Market Minds Advisory
Pet Lodging Market

Pet Lodging Market: Pet Lodging Market: Peak Day Capacity, Vaccination Gate Failures and The Underserved Cat

Around forty days a year carry most of the demand while kennels sit at roughly a third occupancy across the other three hundred, and the industry calls that a seasonality problem.

Lead Analyst

Published

September 2026

Make Smarter Decisions with Customized Research Insights

Request a free sample report and evaluate market opportunities, growth trends, and competitive dynamics relevant to your business needs.

2025 MARKET VALUE$9.6BMarket Size 2025
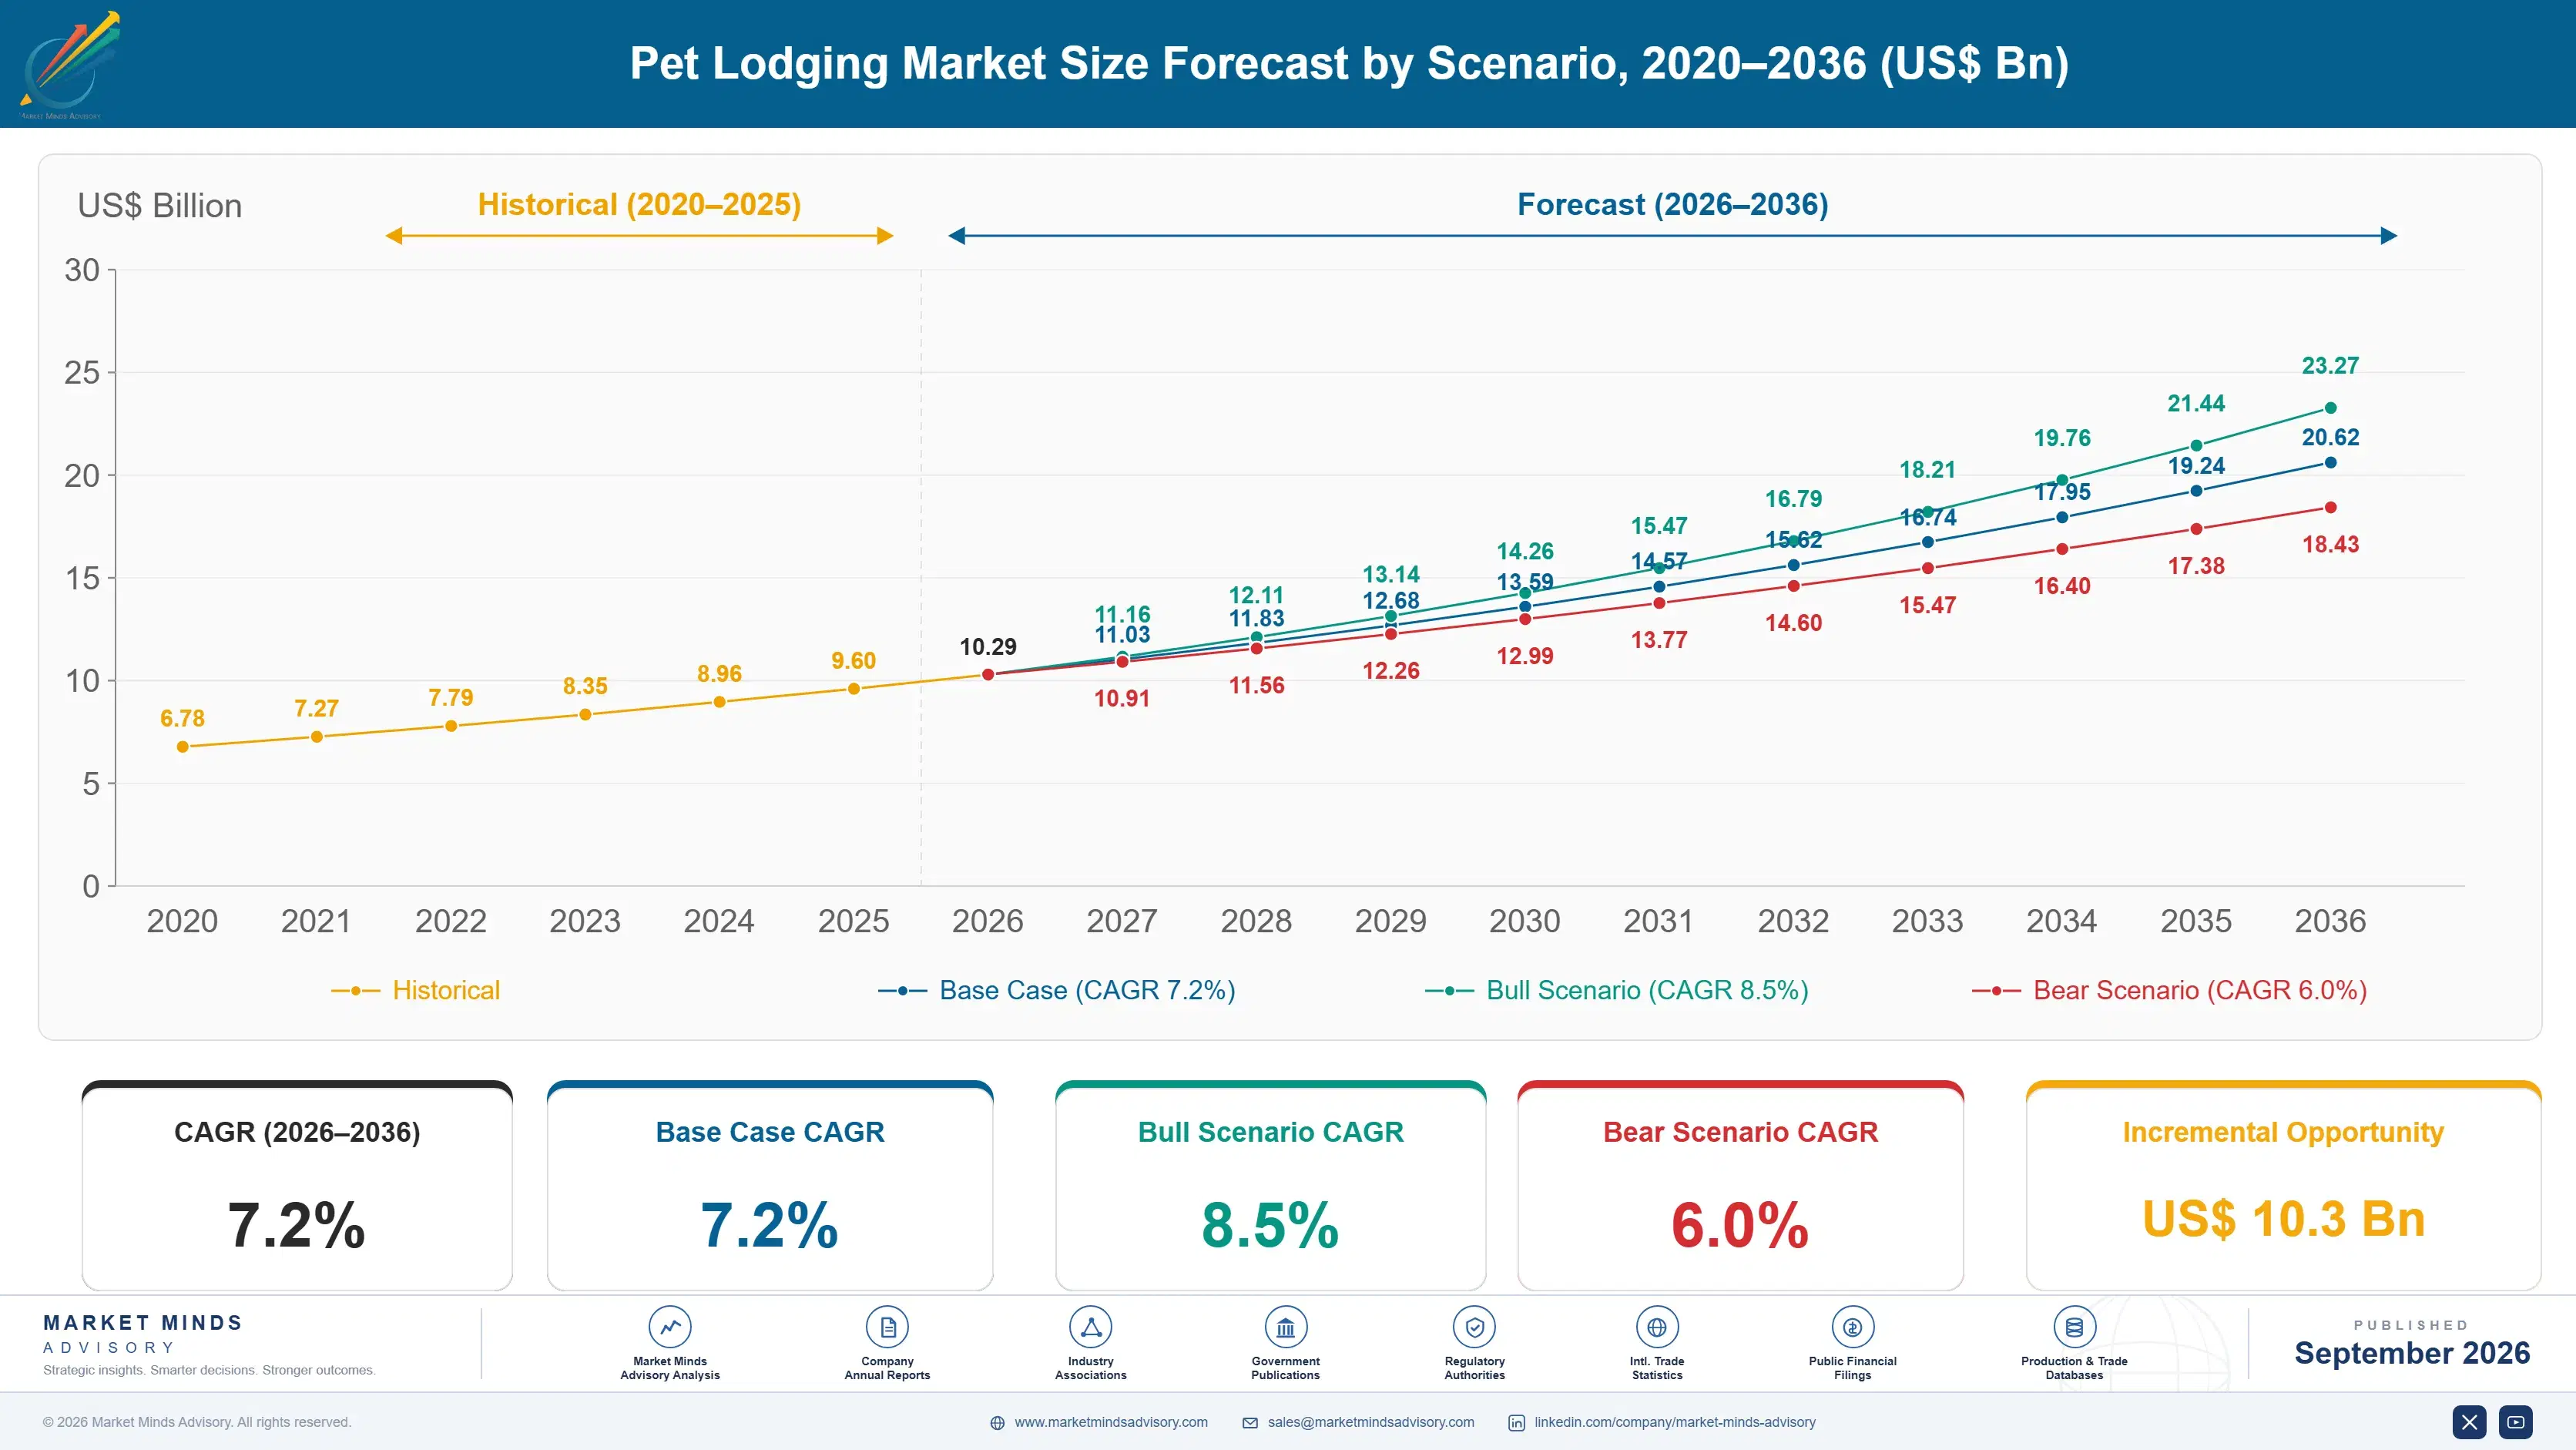
2036 FORECAST VALUE$20.6BBase Case , 2026 to 2036
CAGR 2026 TO 20367.2 %Bull 8.5% / Bear 6.0%
INCREMENTAL OPPORTUNITY$10.3BNet 10- year value creation
EXPANSION MULTIPLE2.00x2036 value over 2026 base
Strategic Levers
M&A Pipeline
Regional Outlook
Country Rankings
Competitive Intelligence
Segmental Deep-dive
Call-Us : 91 93563 13602

Executive Snapshot and Market Trajectory.

Capacity here is physical and demand is not spread across the year. Roughly forty days carry most overnight boarding volume, kennels run at about 37% occupancy across the full year, and facilities turn away bookings at peak while standing half empty in February. Building for those days never pays.
In-home boarding marketplaces grow at 10.8%, half again the market rate of 7.2%, because they reveal spare capacity rather than build it. Cat-only facilities follow at 9.6%. Traditional boarding kennels grow slowest at 5.2%, limited by the runs they already have and by the cost of adding more for forty days of use. Cat provision earns roughly 2.4 times dog boarding per square metre.
Vaccination timing is the admission gate and it fails at the door. Around 23% of bookings collapse at drop-off because a required vaccine was given too recently or not at all, which is a check that could have happened at booking. A facility checking certificate dates then converts most of them, and the owner turned away is usually gone for good. Cat runs meanwhile earn far more per square metre than dog runs.
Market Definition
This market covers paid overnight lodging services for companion animals, spanning traditional boarding kennels, premium pet hotels and resorts, cat-only boarding facilities, in-home boarding marketplaces, veterinary practice boarding, and daycare operations offering overnight extension. Sizing is at service revenue. Daytime-only daycare, dog walking and pet sitting visits without overnight stay, grooming services, veterinary treatment and boarding of livestock or working animals are excluded.
Base Year Value
$9.6B in 2025 (MMA Primary Research Dataset, September 2026)
Forecast Period
2026 to 2036, eleven discrete annual values
CAGR
7.2% base case. Bull 8.5%. Bear 6.0%.
Fastest Growth Segment
In-Home Boarding Marketplaces: 10.8% CAGR
Fastest Growth Country
China: 10.4% CAGR
Fastest Growth Region
South Asia and Pacific: 9.2% CAGR
Largest Region
North America: 44% of 2025 global value
Market Leaders
Rover Group, PetSmart, Mars, Dogtopia, Wag Group. Source: MMA Primary Research Dataset, July 2026.
Primary Survey
n=3,800 procurement and R&D decision-makers, Q4 2025, six countries
Methodology
Demand-side build-up, cross-validated against public data, 47 expert interviews

Pet Lodging Market Forecast Scenarios

pet-lodging-market-size-forecast-scenario-1790023458613
Growth of 6.1% between 2020 and 2025 began with a collapse that nobody has fully replaced. Boarding demand disappeared through 2020 and 2021 as travel stopped, and a meaningful share of independent facilities closed permanently rather than waiting it out. Capacity has not returned, which is why peak turn-aways are worse now despite demand recovering fully.
Three mechanisms carry the base case. In-home marketplaces grow at 10.8% by using bedrooms rather than building kennels, which is the only way capacity expands quickly in this business. Chinese urban pet ownership expands at 10.4% with formal boarding forming alongside it. Cat-only provision grows at 9.6% on a revenue yield per square metre roughly 2.4 times dog boarding, which most operators have never calculated. None of the three requires building a single additional run anywhere.
The bull case is booking-stage vaccination checking. Around 23% of bookings fail at drop-off on vaccination timing, and catching that at booking converts most of them without adding a single run. The bear case is labour. Wages are roughly 46% of operating cost in a business that cannot raise prices outside peak, and tightening closes independents faster than chains replace them.

Why Capacity Never Matches Demand

A boarding facility has a fixed number of runs and a demand curve that concentrates into roughly forty days a year around holidays. Annual occupancy sits near 37% while those forty days are routinely oversubscribed, which means the business turns away revenue it cannot serve and carries fixed cost through months it cannot fill. Building for forty days is an investment nobody can justify. Nobody in this business reports occupancy and turn-aways in the same document.
TOP FIVE CONCENTRATION9%Combined service revenue share held by the five largest participants
PEAK DEMAND DAYS40Days each year carrying most overnight boarding demand
AVERAGE NIGHTLY RATEUSD 48Weighted global overnight rate across all lodging formats
ANNUAL KENNEL UTILISATION37%Share of available runs occupied across a full year
VACCINATION BOOKING FAILURES23%Bookings failing on vaccination timing at the door
CAT YIELD MULTIPLE2.4 timesCat boarding yield against dog boarding per floor area
That explains why the fastest-growing format builds nothing at all. In-home marketplaces match travelling owners to households with a spare room, which expands capacity at peak without capital expenditure and contracts it again afterwards. What they carry instead is a screening and liability exposure a licensed facility does not.
Vaccination requirements are the admission gate and they fail late. Core vaccines must generally be given some days before boarding to be effective, and roughly 23% of bookings collapse at drop-off on a certificate dated too recently or missing entirely. The run stays empty, the owner finds another provider that day and the relationship almost always ends there rather than resuming next holiday.
"This industry has built its capacity for the average day and sells almost nothing on it, then turns customers away at Christmas. The platform competitors understood that you cannot build your way out of a forty day problem."
Director, Pet Services and Consumer Services Practice · MMA Consumer and Industrial Goods Practice · September 2026

Market Trends

Marketplaces Reveal Capacity Rather Than Build It

A boarding kennel expands by pouring concrete and hiring staff, which takes a year and serves a demand peak lasting forty days. An in-home marketplace expands by signing up another household with a spare room, which takes an afternoon and disappears again when demand falls. That flexibility is why the format grows at 10.8% against 7.2% for the market. What it cannot match is the insurance position, staff training and licensing a facility carries, and the two models are increasingly serving different risk appetites rather than competing directly on price.
Market Impact: China grows 3.2 points faster

Cat Provision Earns More Per Square Metre Than Dogs

A cat requires a fraction of the floor area, no exercise yard, considerably less staff time and generates none of the noise that constrains where a dog facility can be sited. Revenue per square metre on cat boarding runs roughly 2.4 times dog boarding as a result. Most facilities were built dog-first with a handful of cat condos added as an afterthought, and very few operators have calculated the comparison. Cat-only provision grows at 9.6%, and the conversion cost of turning underused dog space into cat accommodation is modest. The buildings are already paid for through eleven quiet months.
Market Impact: Peak spans about 40 days

Market Opportunities and Growth Drivers

Chinese Urban Pet Ownership Builds Formal Boarding Alongside

Chinese urban companion animal populations have grown from a small base over roughly fifteen years, and formal boarding provision is forming alongside that rather than lagging behind it, which is unusual. China grows at 10.4%, the fastest national market covered here. Apartment living, long domestic travel distances around national holiday periods and a young owner demographic comfortable with app-based booking all support the marketplace format particularly strongly. Licensed facility provision is developing more slowly than platform capacity across most Chinese cities. Platform capacity is ahead of licensed provision in most Chinese cities.
Market Impact: Costs 23% of bookings

Permanent Capacity Loss Keeps Peak Pricing Firm

A meaningful share of independent boarding facilities closed permanently through 2020 and 2021 rather than surviving a period with no travel demand, and that capacity has not been rebuilt because the economics of building for forty peak days did not improve. Demand has recovered fully while supply has not, which keeps peak nightly rates firm and turn-aways high. Operators with existing licensed capacity are in an unusually strong position, and it is one they did nothing to create. Operators holding licensed capacity are in a strong position none of them created.
Market Impact: Occupancy sits near 37%

Market Restraints and Challenges

Vaccination Timing Fails Bookings At The Door

Roughly 23% of bookings collapse at drop-off because a required vaccine was administered too close to the stay or is missing entirely, and core vaccines generally need some days before boarding to be effective. The root cause is that facilities verify at arrival rather than at booking, when there is still time to fix it. Commercially the loss is total: the run is unsold, the owner is stranded and the relationship usually ends there. Booking-stage verification requires a form field and a reminder rather than any operational change. A form field and a reminder are the whole solution.
Market Impact: Grows 3.6 points above category

Building Capacity For Forty Days Cannot Be Justified

Annual occupancy near 37% against forty heavily oversubscribed days makes additional runs an investment that earns nothing for most of the year. The root cause is that boarding demand follows holiday calendars rather than any pattern an operator influences. Commercially this caps how large a facility-based business can grow and explains why the fastest format builds nothing at all. Operators are responding with peak pricing, overflow agreements between facilities and conversion of underused dog space rather than new construction. Peak pricing, overflow agreements and cat conversion all address it without concrete.
Market Impact: Earns 2.4 times per square metre
3 additional market trends, 4 additional growth drivers, and 2 additional restraints and challenges are covered in the full report. Contact sales@marketmindsadvisory.com to access the complete intelligence.

Segment CAGR and Growth Architecture

Segmentation follows lodging format, the dimension on which capital requirement, capacity flexibility, licensing and margin all divide together in this market. Six formats are assessed at service revenue. Daytime-only daycare, walking and sitting visits without overnight stay, grooming, veterinary treatment and livestock boarding sit outside scope. Facility and platform provision are sized together throughout this report.
pet-lodging-market-market-share-analysis-1790023459213

In-Home Boarding Marketplaces

In-home marketplaces grow at 10.8%, half again the market rate of 7.2%, because they solve the capacity problem by refusing to own any. A kennel expands through construction and hiring across a year to serve a peak lasting forty days; a platform expands by onboarding another household with a spare room and contracts again when demand falls. That elasticity is exactly what this demand curve requires. The cost is a screening and liability exposure that licensed facilities do not carry, since a platform is matching rather than providing, and the two models are separating into different risk appetites rather than competing on price alone. Elasticity is exactly what this demand curve requires.
CAGR 10.8%

Cat-Only Boarding Facilities

Cat-only boarding grows at 9.6% on economics most operators have never calculated properly. A cat needs a fraction of the floor area, no exercise yard, considerably less handling time and generates none of the noise that restricts where a dog facility can be sited or how late staff can work. Revenue per square metre runs roughly 2.4 times dog boarding as a direct result. Most existing facilities were designed dog-first with a few cat condos added afterwards, which means the conversion opportunity sits inside buildings operators already own and pay for through eleven quiet months of the year. Fit-out cost is typically recovered inside a single year of operation, which beats any capacity addition available.
CAGR 9.6%
Full segment breakdown across 6 segments available in the complete report.

Regional Architecture and Country Demand Map

Regional shares measure service revenue where lodging is provided. North America sits far above the standard band, and pet ownership combined with travel frequency and willingness to pay for the service explains all of it. Four other regions consequently sit below their standard bands here.

North America

At 44% this sits far above the standard band, and three things combine to produce it rather than any single factor. Companion animal ownership is high, domestic travel frequency is higher than in most developed markets, and paying a service provider rather than asking a neighbour is culturally normal in a way it is not everywhere. PetSmart and Mars operate facility networks at scale while Rover holds the platform position, and franchised daycare operators including Dogtopia have expanded into overnight provision. Permanent capacity loss since 2020 keeps peak rates firm. Growth of 6.4% reflects a large and mature base. Paying a provider rather than asking a neighbour is culturally normal here.
Share: 44% | CAGR: 6.4% (2026 to 2036)

Western Europe

The 22% position sits inside the standard band, and provision here is considerably more fragmented and more licensed than in North America. Boarding establishments in several markets operate under formal licensing with published welfare ratings that consumers can check, which raises operating standards and the cost of compliance together. British, German and French demand is substantial, with veterinary practice boarding holding a larger share than elsewhere because clinics already have the premises and the trust. Growth of 5.8% is the slowest of the seven regions, constrained by capacity rather than by demand. Published welfare ratings that consumers can look up raise both operating standards and compliance cost together, which is unusual and generally beneficial to larger operators.
Share: 22% | CAGR: 5.8% (2026 to 2036)
Regional intelligence for 5 additional markets available in the complete report: East Asia, South Asia and Pacific, Latin America, Middle East and Africa, Eastern Europe. Contact sales@marketmindsadvisory.com.
pet-lodging-market-country-cagr-analysis-1790023459741

Four Moves For Facility Operators

These four follow from one fact: capacity is fixed, demand is concentrated into forty days, and a quarter of the bookings that do arrive fail at the door. Each has been executed by operators in this market, and three of the four require a process change rather than any capital investment at all. The fourth requires talking to a competitor.

Verify Vaccination At Booking Not Arrival

Roughly 23% of bookings fail at drop-off because a required vaccine was given too recently or is missing, and by then the run is unsold and the owner is stranded. Collecting certificate dates at booking, with an automated check against the required interval and a reminder to the owner, converts most of those bookings without adding a single run. Operators doing this report booking failure falling to around 6%, which on peak days is revenue that simply cannot be recovered any other way. A peak night lost this way cannot be recovered at all.
Market Impact: Cuts booking failure rates to roughly 6% overall

Convert Underused Dog Space To Cat Accommodation

Cat boarding earns roughly 2.4 times dog boarding per square metre, needs no exercise yard and generates none of the noise that constrains dog facility siting and staffing hours. Most facilities were built dog-first with cat condos added afterwards, which means the conversion opportunity sits inside a building the operator already pays for through eleven quiet months. Operators converting underused runs report revenue per square metre rising by roughly 47% on the converted area, at a fit-out cost recovered within a single year. Noise constraints on dog facilities do not apply to cats.
Market Impact: Lifts revenue per square metre by roughly 47%

Price The Forty Peak Days Properly

Annual occupancy near 37% against forty heavily oversubscribed days means most operators are turning customers away at the only moment they hold genuine pricing power. Peak pricing that reflects actual scarcity, with minimum stay requirements and deposits that prevent late cancellation, converts a capacity constraint into margin. Operators applying it report peak period contribution rising by around 34% at unchanged occupancy. The discomfort is cultural rather than commercial, since operators in this business are reluctant to price against their customers. Operators in this business are reluctant to price against customers they know personally.
Market Impact: Lifts peak period contribution by roughly 34% overall

Build Overflow Agreements Between Nearby Facilities

A facility full at Christmas turns away a customer who then finds another provider and frequently stays with them, and a competitor twenty minutes away may have space on the same night. Reciprocal overflow agreements keep the relationship with the originating facility and fill runs that would otherwise sit empty at the other. Operators in overflow arrangements report retention of turned-away customers rising by around 3.1 times. The obstacle is a reluctance to hand a customer to a competitor even temporarily. The customer is lent rather than lost, which is a distinction most operators have never considered.
Market Impact: Raises turned-away customer retention to 3.1 times higher

Who Controls the Margin Pool

Concentration is extremely low at 9% held by the top five, measured consistently on service revenue from overnight pet lodging rather than on facility count, which would overweight small independents enormously. The leader to challenger gap is wide in platform network effects and multi-site capability, and absent at facility level, where an owner-operated kennel competes on equal terms locally.
Competition runs on three dimensions currently. Location and catchment decide almost everything for facility operators, since an owner will not drive far to board a dog. Platform network density decides marketplace competitiveness, because a host without nearby demand and an owner without nearby hosts both leave. Trust decides the premium tier, and it is built through licensing, staff qualification and visible welfare standards rather than through advertising.

Pressure is building between the two models rather than within either. Platforms expand capacity at a speed facilities cannot match and carry a liability profile facilities do not. Licensed operators hold trust and insurance positions platforms struggle to replicate. The resolution is likely to be segmentation by risk appetite rather than one model displacing the other, and operators positioning for that are the ones stating their standards explicitly.
pet-lodging-market-company-positioning-matrix-1790023460269

Competitive Moat and Risk Dimensions

ROVER GROUP

Moat: Network Density And Matching

Two-sided network density is genuinely defensible in a service where an owner will not travel far, because a platform with hosts in every neighbourhood is worth far more than one with hosts in some of them. That density took years and considerable subsidy to build and is difficult for a challenger to replicate catchment by catchment.
ROVER GROUP

Risk: Screening And Liability Exposure

Matching rather than providing means the platform depends on host screening it cannot fully control, and a serious welfare incident reaches the brand regardless of who was legally responsible. Licensed facilities carry trained staff, insurance and inspection that a spare bedroom does not, and that difference becomes visible after the first widely reported failure.
PETSMART

Moat: Retail Adjacency And Scale

Operating boarding inside stores that pet owners already visit removes the discovery problem that independent facilities face entirely, and the retail relationship provides trust before any boarding conversation begins. Multi-site operating capability also supports consistent standards that a fragmented independent field cannot demonstrate. Trust arrives before any boarding conversation begins here.
PETSMART

Risk: Fixed Capacity At Peak Demand

Facility-based capacity cannot flex into forty peak days, which means the business turns away exactly the customers it most wants during the periods when demand is highest. Building additional capacity for those days earns nothing across the remaining eleven months, and platform competitors expand into that same peak at no capital cost at all.

Players Tracked

Prominent Players

Rover Group
PetSmart
Mars
Dogtopia
Wag Group

Other Key Players

TrustedHousesitters
PetBacker
Pawshake
Propelled Brands
Hounds Town USA
K9 Resorts
Pet Paradise
Holidog
Gudog
Mad Paws
PetCloud
Pets at Home
IVC Evidensia
CVS Group
Greencross Vets

Recent Developments

FEBRUARY 2024

Blackstone completes acquisition of Rover Group

The investment firm completed its acquisition of the pet services marketplace, taking the business private. This was a completed acquisition rather than a merger or joint venture, and the platform continues operating under its existing brand and management structure. Host and owner arrangements were unaffected by the transaction.
Signal: Platform network density is being valued as an asset independent of facility ownership. Capacity without premises is what was bought.
OCTOBER 2024

Dogtopia expands franchised locations with overnight provision

The company opened further franchised daycare locations offering overnight boarding extension across North American markets. This was franchise network expansion rather than any acquisition or joint venture at all, with individual sites operated by franchisees under common company standards. Existing daycare-only locations continued operating unchanged alongside.
Signal: Daycare operators are extending into overnight provision where premises already exist. Overnight extension uses premises already leased.
MAY 2025

PetSmart expands boarding capacity across existing store estate

The company added boarding capacity within existing retail locations rather than opening standalone facilities, using space already leased and staffed. This was internal capital investment with no acquisition, franchise or joint venture arrangement involved anywhere in the programme. No standalone boarding facilities were opened during the period.
Signal: Capacity is being added inside existing premises because standalone construction cannot be justified. Standalone construction cannot be justified financially.

What A Night Actually Costs

Labour dominates operating cost at roughly 46% of revenue, covering animal care staff, overnight cover and the handling time that varies enormously between species. Premises cost takes about 19%, whether rent or mortgage service, and it is entirely fixed against an occupancy that averages 37%. Utilities, insurance, food, bedding and cleaning consumables account for most of the remainder across a business with very little variable cost to flex.
Labour and insurance both moved sharply from 2022 onward and neither has reversed. Animal care wages rose across developed markets as the wider labour market tightened, and liability insurance for animal boarding repriced upward following claims experience across the sector. National labour statistics across major markets document wage movement in personal and animal care occupations through that period, and independent operators absorbed most of it.

Exposure varies sharply by format and by species mix. Facility operators carry fixed premises cost against low average occupancy, which is the defining economic problem of this business. Platform operators carry almost none of it, since the premises belong to the host. Cat-weighted facilities carry lower labour and space cost per animal, which is why the yield comparison favours them.
pet-lodging-market-cost-volatility-analysis-1790023460468

Shift species mix toward cats in existing floor area

Cat boarding needs less space, less handling time and no exercise provision, and earns roughly 2.4 times dog boarding per square metre. Converting underused dog runs uses premises already paid for through the quiet months. Fit-out cost is modest and typically recovered inside a year, which is a better return than any capacity addition available.

Cover peak demand through reciprocal overflow rather than construction

Building runs for forty days a year earns nothing across the remaining eleven months, while a competitor nearby may have space on the same nights. Reciprocal overflow agreements serve peak demand at no capital cost and keep the customer relationship with the originating facility. The obstacle is a reluctance to involve a competitor at all.

Staff overnight cover across facilities rather than per site

Overnight cover is a legal and welfare requirement in most licensed markets and it is the least productive labour in the business, since one person supervises whatever is present. Operators running multiple nearby sites can share that cover during low occupancy months. Licensing conditions in some markets prevent it, which needs checking before planning around it.

Portfolio Architecture for Margin Defence

Margin architecture divides by whether an operator owns the premises and by which species occupies them, which is not how this industry usually reports itself. Traditional dog boarding in owned or leased facilities runs at operating margins in the high teens to mid twenties, carrying fixed premises cost against occupancy averaging 37% and labour that cannot flex below a welfare minimum.
Premium pet hotels and cat-only provision hold operating margins in the low to high thirties. The spread reflects species mix and nightly rate rather than any difference in service quality, since a cat generates a fraction of the handling time and floor area a dog requires while paying a rate that is not proportionally lower. Very few operators report the two separately.

The highest-value position is platform matching, at margins in the low forties to low fifties, because the premises, the utilities and the overnight cover all belong to somebody else. What the platform carries instead is a screening and liability exposure that does not appear in an operating margin at all until something goes wrong. Facility boarding provides the trust the category depends on. It does not provide the return.

Volume / Commodity-Adjacent

Traditional dog boarding in owned or leased facilities. Fixed premises cost runs against occupancy averaging a third, and labour cannot flex below the welfare minimum any licence requires. Occupancy averaging a third is the defining constraint.
Gross Margin: 18 to 26%

Premium / Certified

Premium pet hotels and cat-only provision. The eight-point range reflects species mix and nightly rate rather than service quality, since a cat consumes far less handling time and floor area.
Gross Margin: 30 to 38%

Sustainability / Regulatory / Next-Generation

Platform matching where premises, utilities and overnight cover all belong to the host. The screening and liability exposure carried instead does not appear in operating margin until something goes wrong.
Gross Margin: 42 to 52%
pet-lodging-market-portfolio-architecture-1790023460970

High-value Sub-segments and Strategic Watch-out

Platform Matching Operations

High value and high growth at 10.8%. Capacity expands and contracts without capital because the premises belong to hosts. Screening and liability exposure sits outside the operating margin until an incident makes it visible. Network density took several years and considerable subsidy to assemble properly.
Gross Margin: 44 to 52%

Cat-Only Boarding Provision

High value and high growth at 9.6%. Revenue per square metre runs roughly 2.4 times dog boarding with less handling time and no exercise yard. The conversion opportunity sits inside buildings operators already pay for. Very few operators have ever run the yield comparison properly.
Gross Margin: 34 to 40%

Traditional Dog Boarding Kennels

Volume core carrying fixed premises cost against 37% annual occupancy. It provides the licensed capacity and trust the category depends on while earning the least of any format covered here. Labour cannot flex below the welfare minimum any licence requires, and premises cost does not move at all.
Gross Margin: 18 to 25%

Peak Dependent Facility Capacity

Strategic watch-out. Forty days carry most demand and additional runs earn nothing across the other eleven months. The fourteen-point range reflects how differently operators price the peak they actually control. Most operators still price those nights barely above an ordinary Tuesday in a quiet February.
Gross Margin: 16 to 30%

What Makes Owners Return

Demand here is travel-triggered and concentrated, which makes it unlike almost any other pet services category. An owner books because they are going somewhere, and roughly forty days a year around holidays carry most of the volume. That produces a customer relationship measured in two or three bookings annually for a frequent traveller and one every few years for everyone else, with very little in between.
Stickiness is unusually high once established and unusually fragile at the point of failure. An owner who has left an animal somewhere and found it well cared for returns without considering alternatives, because the anxiety of the first booking does not repeat. An owner turned away at peak, or failed at the door on vaccination paperwork, finds another provider in that moment and typically stays with them. Both outcomes are decided by the facility.

Owner expectations have shifted in one direction since 2020. Households that acquired animals during that period travelled for the first time with a pet two or three years later, and they arrived at boarding with far higher expectations of visibility than earlier cohorts. Cameras and daily updates have moved from premium feature to assumption, and their absence reads badly.
pet-lodging-market-end-use-penetration-index-1790023461465

Where Operators Lose Revenue

These are among the four positions where our research anticipates prominent divergence between winners and laggards over the coming forecast period. Each is grounded in the demand model, the regulatory perimeter, and the announced capacity pipeline.
01 / BOOKING STAGE VERIFICATION

Check the vaccine dates before they arrive

Roughly 23% of bookings collapse at drop-off because a required vaccine was administered too close to the stay or is missing entirely, and core vaccines generally need some days beforehand to be effective. By arrival the run is unsold, the owner is stranded and the relationship almost always ends there. Collecting certificate dates at booking with an automated interval check converts most of those, and operators doing it report booking failure falling to around 6% without adding any capacity, and a peak night lost this way is simply gone.
02 / SPECIES MIX CONVERSION

Turn the quiet dog runs into cat rooms

Cat boarding earns roughly 2.4 times dog boarding per square metre, requires no exercise yard, consumes far less handling time and generates none of the noise that constrains siting and staffing hours. Most facilities were built dog-first with a handful of cat condos added afterwards, and very few operators have ever run the comparison. Converting underused runs uses premises already paid for through eleven quiet months, and operators report revenue per square metre rising roughly 47% on converted area, at a fit-out cost recovered inside a single year.
03 / PEAK PRICING DISCIPLINE

Charge for the forty days you control

Annual occupancy near 37% against forty heavily oversubscribed days means operators are turning customers away at the only moment they hold genuine pricing power, and most price those nights barely above an ordinary Tuesday. Peak pricing reflecting actual scarcity, with minimum stays and deposits that prevent late cancellation, converts a capacity constraint into margin. Operators applying it report peak contribution rising by around 34% at unchanged occupancy, and the reluctance is cultural rather than commercial, since operators in this business are reluctant to price against customers they know.
04 / OVERFLOW RECIPROCITY AGREEMENTS

Lend the customer rather than losing them

A facility full at Christmas turns away an owner who finds another provider that night and usually stays with them permanently, while a competitor twenty minutes away may have empty runs on exactly the same dates. Reciprocal overflow agreements fill those runs and keep the relationship with the originating facility rather than transferring it. Operators in such arrangements report retention of turned-away customers rising by around 3.1 times, against a reluctance to involve a competitor at all, which is a distinction most operators in this business have simply never considered.

Engagement Snapshot From the Field

A live engagement with an industry participant carrying material or product regulatory and market exposure ahead of a defining policy shift, showing how our research translates into a defensible multi-year portfolio strategy.
MARKET MINDS ADVISORY · CLIENT ENGAGEMENT SUMMARY
Pet Lodging Producer Strategic Portfolio Review and Transition Roadmap 2026·Investment Scenario on Pet Lodging Exposure Evaluation 2025-26
CLIENT PROFILE
A regional boarding operator running eleven licensed facilities with revenue near USD 31 million (client-reported, unverified by MMA). The estate was dog-weighted with cat provision at roughly 8% of floor area. Vaccination was verified at drop-off, peak nights were priced at a small premium to ordinary nights, and no arrangement existed with any nearby competitor.
STRATEGIC CHALLENGE
Revenue had grown slowly for three years while management reported consistently turning away bookings at holiday periods, and a construction programme adding runs at four sites had been approved. Nobody had calculated annual occupancy against peak turn-aways, or compared revenue per square metre between species anywhere in the estate. Neither number existed internally anywhere.
MMA APPROACH
MMA reconstructed occupancy by day across three years for all eleven sites, then modelled the return on proposed construction against actual demand distribution. Booking records were coded for failure cause at drop-off. Revenue and cost per square metre were calculated separately for dog and cat provision, and turned-away customers were traced to establish whether they returned.
KEY FINDINGS
  1. Annual occupancy averaged 34% while 43 days a year ran above 95%, making the proposed construction a capital investment serving six weeks of demand.
  2. Vaccination failures accounted for 26% of cancelled bookings at drop-off, above the category figure, and every one was identifiable from information available at booking.
  3. Cat provision at 8% of floor area generated 19% of revenue, giving a per square metre yield roughly 2.6 times dog boarding across the estate.
  4. Of customers turned away at peak, 78% never booked again, and three competitors within twenty minutes had available runs on most of those dates.
CLIENT PROFILE
A regional boarding operator running eleven licensed facilities with revenue near USD 31 million (client-reported, unverified by MMA). The estate was dog-weighted with cat provision at roughly 8% of floor area. Vaccination was verified at drop-off, peak nights were priced at a small premium to ordinary nights, and no arrangement existed with any nearby competitor.
STRATEGIC CHALLENGE
Revenue had grown slowly for three years while management reported consistently turning away bookings at holiday periods, and a construction programme adding runs at four sites had been approved. Nobody had calculated annual occupancy against peak turn-aways, or compared revenue per square metre between species anywhere in the estate. Neither number existed internally anywhere.
MMA APPROACH
MMA reconstructed occupancy by day across three years for all eleven sites, then modelled the return on proposed construction against actual demand distribution. Booking records were coded for failure cause at drop-off. Revenue and cost per square metre were calculated separately for dog and cat provision, and turned-away customers were traced to establish whether they returned.
KEY FINDINGS
  1. Annual occupancy averaged 34% while 43 days a year ran above 95%, making the proposed construction a capital investment serving six weeks of demand.
  2. Vaccination failures accounted for 26% of cancelled bookings at drop-off, above the category figure, and every one was identifiable from information available at booking.
  3. Cat provision at 8% of floor area generated 19% of revenue, giving a per square metre yield roughly 2.6 times dog boarding across the estate.
  4. Of customers turned away at peak, 78% never booked again, and three competitors within twenty minutes had available runs on most of those dates.
RECOMMENDED STRATEGY
Phase 1: Phase one: cancel the construction programme and move vaccination verification to booking with automated interval checking. Construction would have served six weeks of demand. Phase 2: Phase two: convert underused dog runs at the four lowest-occupancy sites into cat accommodation. Cat yield ran 2.6 times dog boarding there. Phase 3: Phase three: establish reciprocal overflow agreements with nearby operators and reprice the peak properly. Three competitors had space on most of those nights.
OUTCOME
Revenue grew by roughly 21% across four quarters with no additional floor area built (client-reported, unverified by MMA), driven by cat conversion and peak repricing together. Booking failures fell from 26% to 7% after verification moved to booking stage, and the cancelled construction programme released capital for the conversions.

Frequently Asked Questions

Foundational context covering the market sizes, CAGR, scope, country, region and competition that inform every finding below. This section is provided to cover basics and most often pre-purchase conversations, answered from the MMA Primary Research Dataset.

What is the current size of the Pet Lodging Market?

The market was valued at USD 9.6 billion in 2025, rising to USD 10.3 billion in 2026. Sizing is at service revenue across six overnight lodging formats.

How large will the Pet Lodging Market be by 2036?

MMA forecasts USD 20.6 billion by 2036, an increase of USD 10.3 billion over the 2026 base. That represents expansion of 2.00 times across the forecast period.

What is the CAGR for the Pet Lodging Market 2026 to 2036?

The base case CAGR is 7.2%, with a bull case of 8.5% and a bear case of 6.0%. Historical growth between 2020 and 2025 ran at 6.1%.

Which segment is growing fastest?

In-home boarding marketplaces grow at 10.8%, half again the market rate, because capacity expands and contracts without any capital, and cat-only facilities follow at 9.6% on far better yield.

Who are the major companies in the Pet Lodging Market?

Rover Group, PetSmart, Mars, Dogtopia and Wag lead on service revenue, holding a combined 9%. This is among the most fragmented service markets MMA covers anywhere.

Which country is growing fastest?

China grows fastest at 10.4%, because formal boarding provision is forming alongside urban pet ownership rather than lagging it, with platforms developing faster than licensed facilities.

Report Segmentation Architecture

The full report scope spans multiple orthogonal segmentation dimensions, with cross-tabulated demand data provided for each dimension pair. Coverage extends further to regional breakdowns, trend trajectories, and the competitive detail needed to support segment-level decision-making.

By Lodging Format

  • Traditional Boarding Kennels
  • Premium Pet Hotels and Resorts
  • Cat-Only Boarding Facilities
  • In-Home Boarding Marketplaces
  • Veterinary Practice Boarding
  • Daycare With Overnight Extension

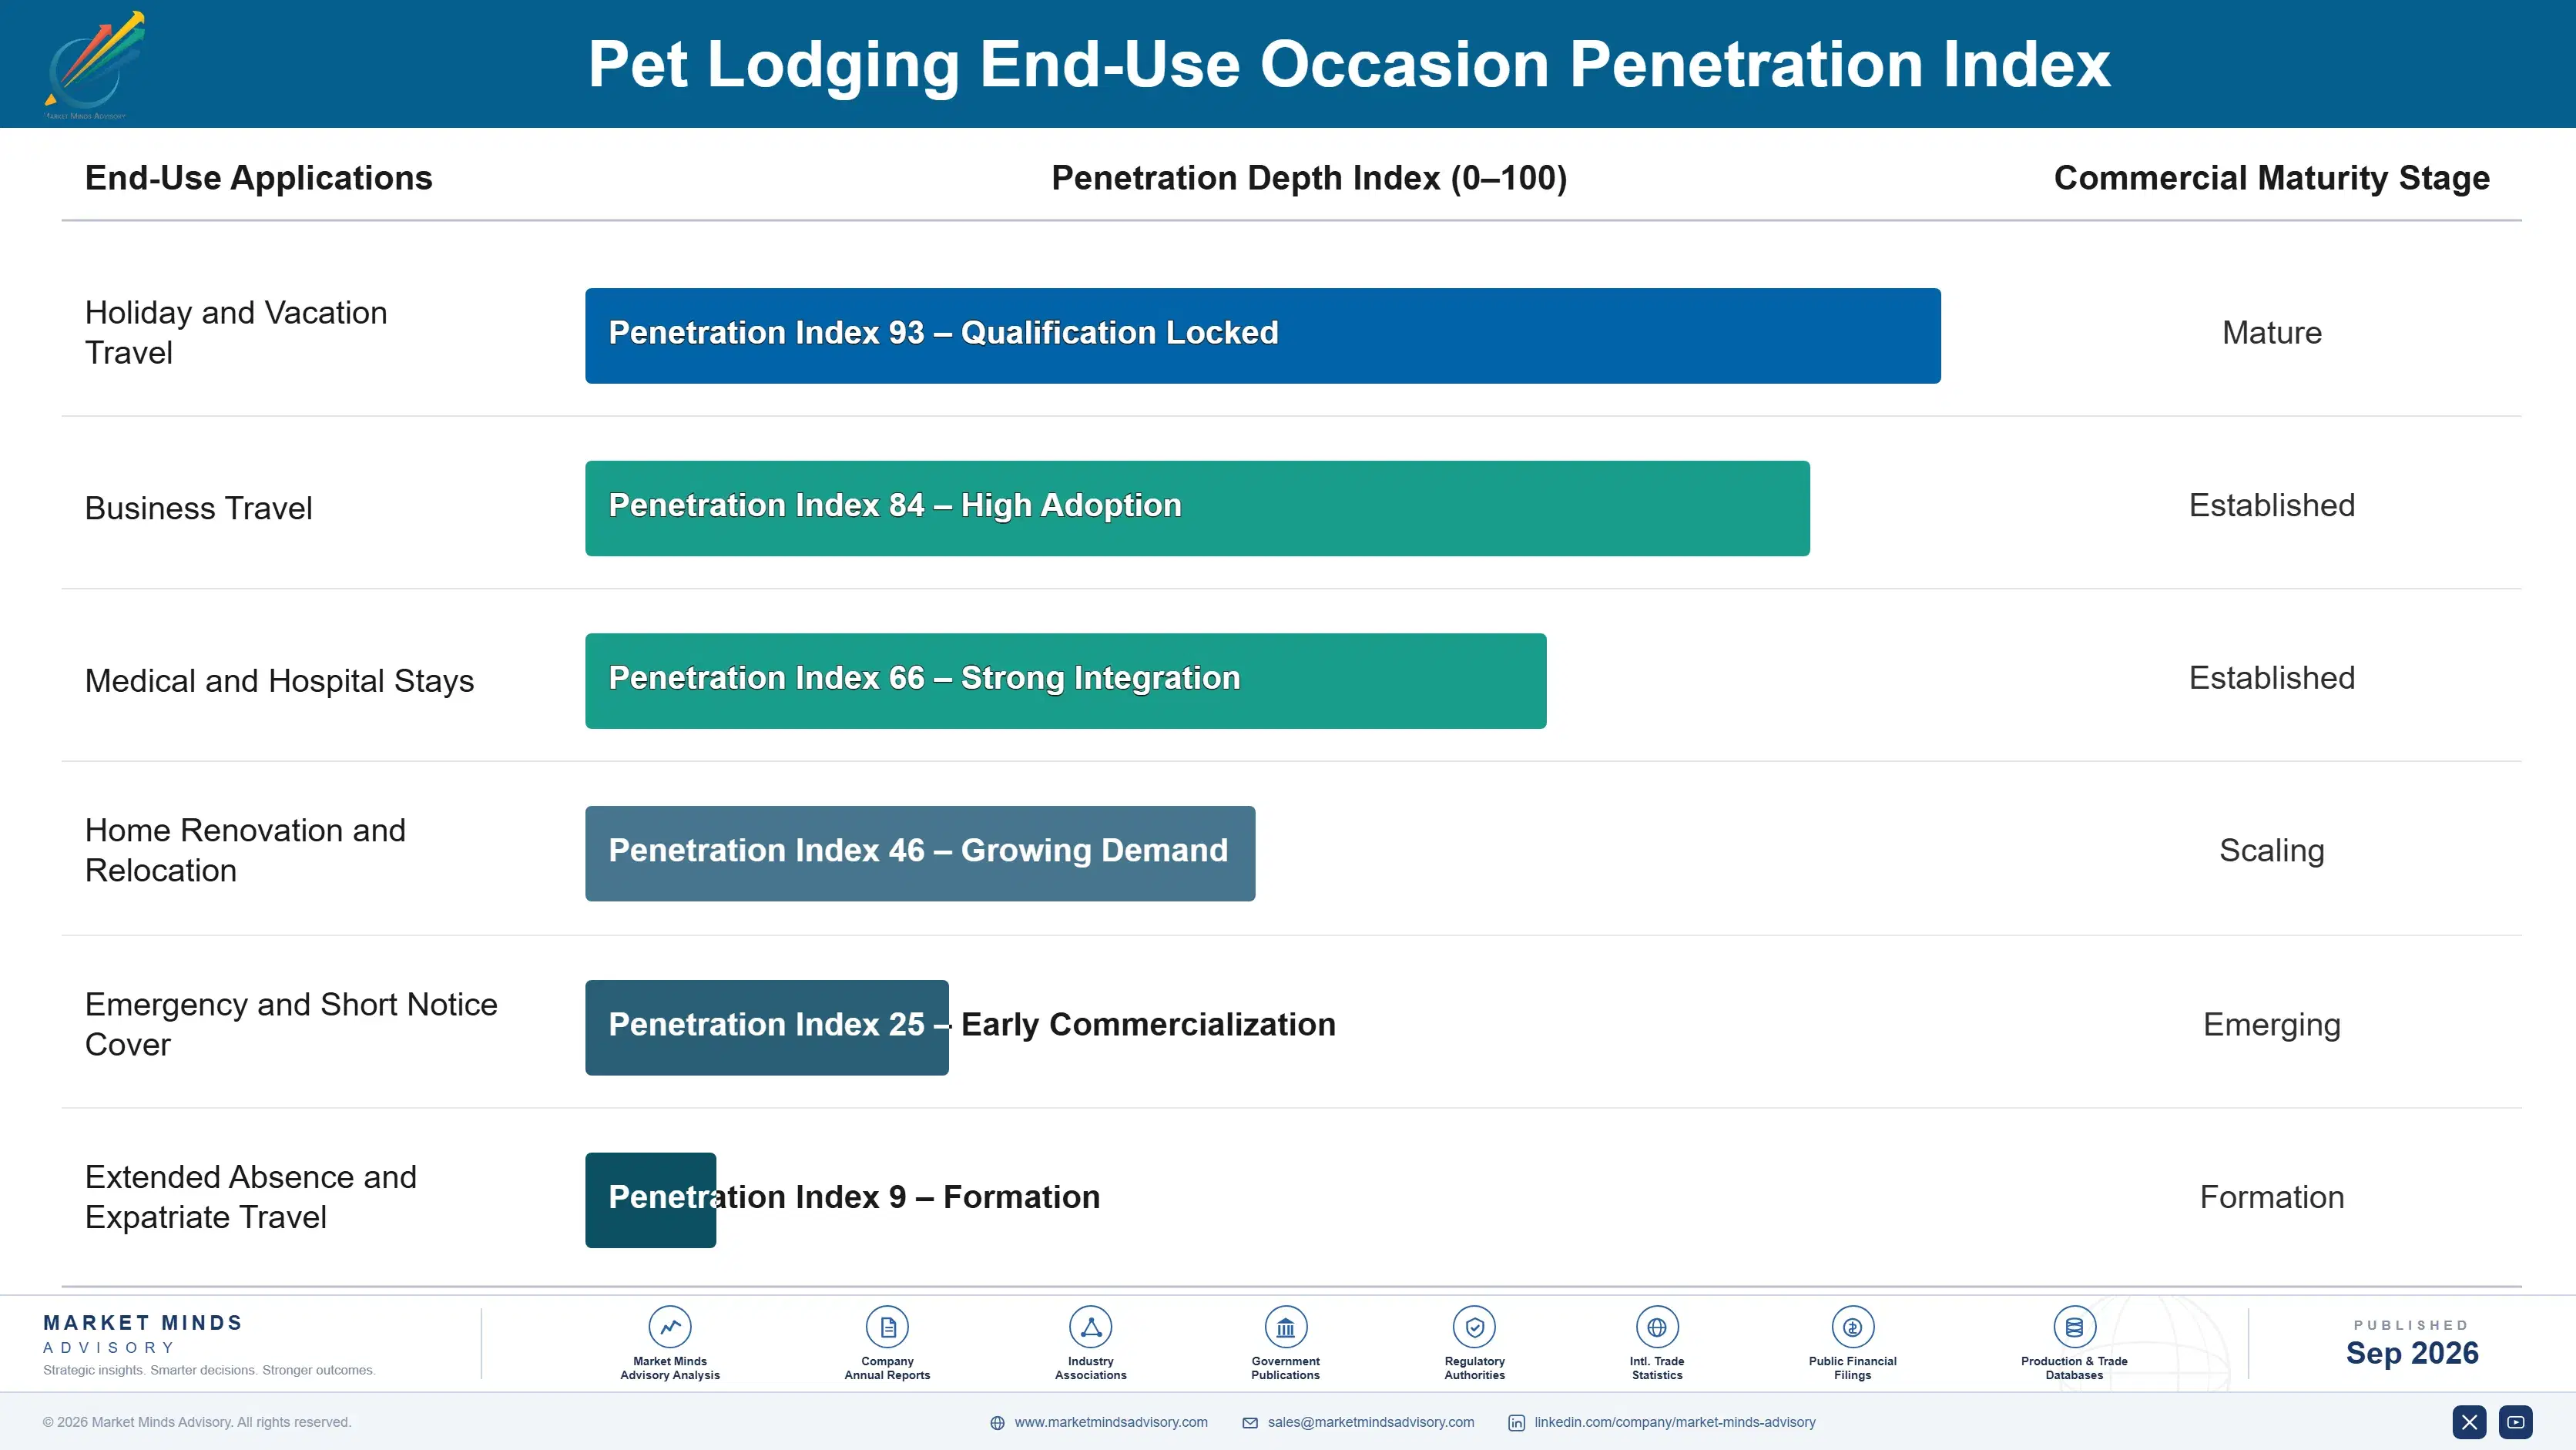
By End-Use Occasion

  • Holiday and Vacation Travel
  • Business Travel
  • Medical and Hospital Stays
  • Home Renovation and Relocation
  • Emergency and Short Notice Cover
  • Extended Absence and Expatriate Travel

By Commercial Model

  • Independent Owner Operated
  • Multi-Site Regional Operators
  • Franchised Networks
  • Retail Attached Provision
  • Veterinary Practice Attached
  • Platform Marketplace Matching

By Region

  • North America
  • Western Europe
  • East Asia
  • South Asia and Pacific
  • Latin America
  • Middle East and Africa
  • Eastern Europe

Scope, Methodology, and Coverage

Every figure in this report is reproducible from documented input assumptions. The scope below maps the historical period, the forecast horizon, the segmentation dimensions, and the countries covered, alongside the underlying primary and qualitative methodology.
Historical Period
2020 to 2025
Forecast Period
2026 to 2036
Base Year
2025 (USD billions; MMA Primary Research Dataset, September 2026)
Market Definition
This market covers paid overnight lodging services for companion animals, spanning traditional boarding kennels, premium pet hotels and resorts, cat-only boarding facilities, in-home boarding marketplaces, veterinary practice boarding, and daycare operations offering overnight extension. Sizing is at service revenue across independent, multi-site, franchised, retail attached, veterinary attached and platform models. Daytime-only daycare, dog walking and pet sitting visits without an overnight stay, grooming services, veterinary treatment, and boarding of livestock or working animals are excluded throughout.
Quantitative Units
USD billions at service revenue; capacity in thousands of runs; occupancy as percentage of available run nights.
Segmentation Dimensions
Lodging format, end-use occasion, commercial model, and geographic region.
Regions Covered
North America, Western Europe, East Asia, South Asia and Pacific, Latin America, Middle East and Africa, Eastern Europe
Countries Covered
United States, United Kingdom, China, Australia, Germany, Brazil
Key Companies Profiled
Rover Group, PetSmart, Mars, Dogtopia, Wag Group, TrustedHousesitters, PetBacker, Pawshake, Propelled Brands, Hounds Town USA, K9 Resorts, Pet Paradise, Holidog, Gudog, Mad Paws, PetCloud, Pets at Home, IVC Evidensia, CVS Group, Greencross Vets
Quantitative Methodology
Primary survey, n=3,800 respondents, Q4 2025, six countries; demand-side model with trade association cross-validation
Qualitative Methodology
47 expert interviews, Q4 2025; applied to validate demand model assumptions, identify emerging dynamics, and assess competitive positioning
Report Format
PDF and XLSX data workbook (Word format preview document)
Publisher
Market Minds Advisory
Report Code
MMA-2026-CON-789
Published
September 2026
Contact
sales@marketmindsadvisory.com | www.marketmindsadvisory.com

Purchase the full Pet Lodging Market Report (2026 to 2036).

The full report sizes the pet lodging market across six formats, six occasions and six commercial models for all seven global regions. It includes daily occupancy reconstruction across multi-site estates to quantify peak concentration against annual utilisation properly. Booking failures are coded by cause at drop-off, with vaccination timing separated from other reasons. Revenue and cost per square metre are calculated separately by species to establish the yield comparison, and turned-away customers are traced to establish whether they return. Competitive assessment covers 20 participants on a consistent service revenue basis.
Daily occupancy reconstructed across multi-site estates
Booking failures coded by cause at drop-off
Revenue per square metre calculated by species
Turned-away customers traced for return behaviour
Six lodging formats sized through 2036
Twenty participants assessed on service revenue

Built For The People Who Decide

From boardroom strategy to bench-side execution, this report is read cover-to-cover by leaders shaping the next decade of their industry, turning demand scenarios, market dynamics and valuation benchmarks into decisions.
CXOs/ Presidents/ VPs/ Managers
M&A and Corporate Development
Strategy Teams and R&D Heads
Procurement and Product Directors
Regulatory and Compliance Leaders
Investor Relations and Equity Analysts