Market Minds Advisory
Pet Joint Health Supplement Market

Pet Joint Health Supplement Market: Pet Joint Health Supplement Market. Glucosamine, Green-Lipped Mussel, UC-II Collagen, MSM and Multi-Ingredient Formulas for Dogs and Cats

Osteoarthritis affects most senior dogs by the time an owner finally notices the limp, so documented mobility score improvement decides which supplement brand earns the veterinary referral once early joint decline becomes visible.

Lead Analyst

Published

September 2026

Make Smarter Decisions with Customized Research Insights

Request a free sample report and evaluate market opportunities, growth trends, and competitive dynamics relevant to your business needs.

2025 MARKET VALUE$0.8BMarket Size 2025
2036 FORECAST VALUE$1.6BBase Case , 2026 to 2036
CAGR 2026 TO 20366.5 %Bull 7.8% / Bear 5.2%
INCREMENTAL OPPORTUNITY$0.7BNet 10- year value creation
EXPANSION MULTIPLE1.88x2036 value over 2026 base
Strategic Levers
M&A Pipeline
Regional Outlook
Country Rankings
Competitive Intelligence
Segmental Deep-dive
Call-Us : 91 93563 13602

Executive Snapshot and Market Trajectory.

Pet joint health supplements cover glucosamine and chondroitin, green-lipped mussel extract, UC-II collagen, MSM combination, and multi-ingredient joint support formulas for dogs and cats. Joint decline is the single most common visible sign of aging a veterinarian will point to. Early intervention genuinely slows the progression.
UC-II Collagen Formulas grow fastest as newer clinical evidence supports lower effective dosing than traditional glucosamine, while multi-ingredient blends carry the largest volumes across general senior wellness positioning. North America leads because the largest aging pet population and veterinary arthritis diagnosis culture concentrate demand, with Western Europe a strong second. Gross margins run 26% to 50%, and active ingredient sourcing and clinical validation cost shape returns. Distributors track repeat formulation volume closely each season.
Five groups hold about 34% of value, led by Nutramax Laboratories, Zesty Paws and VetriScience, so veterinary pharmaceutical groups compete with specialist consumer supplement brands. Pet supplement claim substantiation rules and quality manufacturing standards govern positioning, and owners check clinical evidence, mobility score data and veterinary endorsement before committing to a supplement for regular use. Technical documentation increasingly decides which brand keeps the recurring purchase.
Market Definition
The market covers global manufacturer revenue from dietary supplements formulated specifically to support joint health and mobility in dogs and cats, defined as glucosamine and chondroitin, green-lipped mussel extract, UC-II collagen, MSM combination, and multi-ingredient joint support formulas. It excludes prescription veterinary pharmaceuticals for arthritis, general multivitamin supplements without joint-specific positioning, and complete senior pet food formulations.
Base Year Value
$0.8B in 2025 (MMA Primary Research Dataset, September 2026)
Forecast Period
2026 to 2036, eleven discrete annual values
CAGR
6.5% base case. Bull 7.8%. Bear 5.2%.
Fastest Growth Segment
UC-II Collagen Formulas: 9.1% CAGR
Fastest Growth Country
China: 7.9% CAGR
Fastest Growth Region
South Asia and Pacific: 8.5% CAGR
Largest Region
North America: 31% of 2025 global value
Market Leaders
Nutramax Laboratories, Zesty Paws, VetriScience, PetHonesty, YuMOVE. Source: MMA Analysis, company annual reports.
Primary Survey
n=3,800 procurement and R&D decision-makers, Q4 2025, six countries
Methodology
Demand-side build-up, cross-validated against public data, 47 expert interviews

Pet Joint Health Supplement Market Forecast Scenarios

pet-joint-health-supplement-market-size-forecast-scenario-1790058691605
From 2020 to 2025 pet joint health supplement revenue grew at about 5.0% a year. Pandemic pet adoption lifted 2020 and 2021 demand, veterinary arthritis screening awareness expanded through 2021 and 2022, and UC-II collagen formula adoption then accelerated through 2023 and 2024 as clinical evidence strengthened relative to traditional glucosamine. Multi-ingredient blends held the largest volumes throughout.
The base case of 6.5% rests on three named mechanisms. Rising veterinary awareness of early-stage osteoarthritis, reinforced by formal mobility screening tools, keeps pushing earlier supplement intervention before severe symptoms appear. Growing UC-II collagen clinical evidence keeps expanding formula credibility at meaningfully lower effective doses than traditional glucosamine. Aging pet population growth across major markets keeps sustaining category demand as veterinary guidance increasingly recommends proactive joint support. Each mechanism is visible in retail sales data and veterinary referral trends.
The bull case reaches 7.8% if diagnostic screening broadens further and UC-II collagen evidence keeps strengthening. The bear case falls to 5.2% if pet supplement volumes slow and owners trade down to generic formulations. Both cases assume stable supplement claim substantiation rules and no major recall. Retail shelf space trends remain the key swing factor to watch.

Clinical Evidence, Mobility Score Data and Veterinary Endorsement Set Returns

Manufacturers formulate active ingredient blends targeting cartilage support and inflammation management, validate efficacy through clinical trials measuring standardised mobility score improvement, and balance palatability against dosing precision before commercial launch. Clinical evidence and mobility score data decide acceptance, and each formula must pass efficacy validation, since a joint health claim without clinical backing invites regulatory and veterinary challenge. Retailers expect complete clinical documentation before committing to broader shelf space.
MARKET CONCENTRATION34% CR5Top five participants hold more than one third of value
MULTI-INGREDIENT SHARE37%Portion of revenue from multi-ingredient joint support blends
US HOUSEHOLD SHARE28%Portion of dog and cat households based in United States
ACTIVE INGREDIENT COST SHARE35% of COGSActive ingredient sourcing and formulation cost within manufacturing cost
CLINICAL TRIAL COST SHARE12% of COGSMobility score and palatability testing cost within manufacturing cost
TYPICAL DAILY DOSE COST$0.35-1.40Typical per-dose cost across major joint supplement categories
Value concentrates in five places. UC-II collagen formulas grow fastest. Multi-ingredient blends carry the largest volumes, glucosamine and chondroitin formulas serve established baseline demand, green-lipped mussel extract formulas serve natural positioning, and MSM combination formulas serve inflammation-focused support. Each formulation serves a distinct role inside the joint wellness programme, and none substitutes cleanly for another.
Supply combines veterinary pharmaceutical groups and specialist consumer supplement brands. Nutramax Laboratories and VetriScience run dedicated joint health research programmes at scale, Zesty Paws supplies across veterinary and OTC channels, and PetHonesty and YuMOVE supply through established retail and veterinary distribution networks. Retail and veterinary listings take months to win and require documented clinical trial data. Winning a new listing requires a full trial cycle of validated clinical data before volume scales meaningfully.
"A joint supplement sells a slower decline an owner can actually watch happen, one walk at a time. The brands that keep the bowl are the ones whose mobility score data survives a veterinarian's own screening exam, because this category rewards brands that can prove the dog moves better, not just that the label sounds credible."
Senior Analyst, Pet Nutrition and Senior Animal Health Practice · MMA Pet Joint Health Supplement Practice · September 2026

Market Trends

UC-II Collagen Clinical Evidence Strengthens at Lower Effective Doses

Veterinary nutritionists increasingly recommend UC-II collagen formulas for their documented efficacy at meaningfully lower daily doses than traditional glucosamine and chondroitin combinations, and this strengthening clinical evidence base is expanding formula credibility across both prescription and premium OTC tiers, with brands such as Nutramax Laboratories and VetriScience scaling UC-II formula production to meet demand. UC-II Collagen Formulas grow about 9.1% a year, and gross margins run 30% to 50%. The trend needs clinical trial data and rewards brands with credible formulation science. Buyers judge brands on clinical evidence, palatability and veterinary endorsement.
Market Impact: mobility wellness consultations rise 5-8%
Green-Lipped Mussel Extract Gains Natural Positioning Momentum

Owners increasingly seek natural-sourced joint support ingredients over synthetic alternatives, and green-lipped mussel extract benefits from both a genuine anti-inflammatory fatty acid profile and appealing natural sourcing positioning that resonates with ingredient-conscious buyers. Green-Lipped Mussel Extract Formulas grow about 7.8% a year, and gross margins run 28% to 44%. The trend needs sourcing traceability and rewards brands with strong supply chain transparency. Brands with formulation depth and vet channel reach hold the strongest positions. Early movers set the standard that later entrants must match. Retailers reward brands that respond quickly to reformulation requests.
Market Impact: senior pet population grows 4-7% yearly

Market Opportunities and Growth Drivers

Rising Veterinary Screening Awareness of Early-Stage Osteoarthritis

Veterinary associations continue promoting standardised mobility and orthopedic screening tools during senior wellness visits, and this formalised screening is catching joint decline earlier than informal owner observation alone, expanding the diagnosed population eligible for supplement intervention. Veterinary associations report sustained growth in senior pet mobility wellness consultations. The driver rewards brands with clear clinical documentation, and it supports steady category growth, though screening awareness still varies significantly by veterinary practice and owner demographic. Early movers set the standard that later entrants must match. Retailers reward brands that respond quickly to reformulation requests.
Market Impact: formulation costs take 35% of cost

Aging Pet Population Growth Sustains Category Demand

Pets are living longer across major markets as veterinary care and nutrition improve, and this aging population continues expanding the addressable buyer base for joint supplements as more households reach the senior pet life stage where osteoarthritis risk rises meaningfully. The driver rewards brands with clear efficacy documentation and senior-focused marketing, and it supports continued category growth, though price sensitivity still limits adoption pace in some household segments. Retailers reward brands that respond quickly to reformulation requests. Progress should be reviewed every quarter against agreed mobility score targets. Buyers judge brands on clinical evidence, palatability and veterinary endorsement.
Market Impact: undifferentiated brands lose 100% of trust

Market Restraints and Challenges

Active Ingredient Sourcing Costs and Clinical Validation Squeeze Margins

Active ingredient sourcing and formulation makes up about 35% of manufacturing cost, and validating a joint efficacy claim through trials measuring standardised mobility score improvement requires research investment well beyond standard supplement development, according to industry cost data, while premium active ingredients such as UC-II collagen and green-lipped mussel extract cost more than generic formulation inputs. The root cause is the clinical rigor a credible joint claim requires combined with premium ingredient sourcing needs. Brands can pass through only part of the increase, so margins fall two to four points. Brands respond with formulation standardisation and ingredient contracts.
Market Impact: UC-II collagen formulas grow 9.1% yearly

Crowded Formulation Landscape Complicates Differentiation and Trust

The joint supplement category has accumulated a large number of similarly positioned products over decades, and this crowding makes it genuinely difficult for owners to distinguish clinically validated formulas from marketing-led alternatives without extensive research, according to consumer survey data. The root cause is the category's long history and low barrier to entry for basic glucosamine formulations relative to newer, more clinically rigorous ingredients. Undifferentiated brands can lose owner trust to any competitor with clearer proof. Brands respond with transparent labelling and third-party certification. Smaller brands carry the heaviest exposure and have the least room to adjust.
Market Impact: green-lipped mussel formulas grow 7.8%
3 additional market trends, 2 additional growth drivers, and 4 additional restraints and challenges are covered in the full report. Contact sales@marketmindsadvisory.com to access the complete intelligence.

Segment CAGR and Growth Architecture

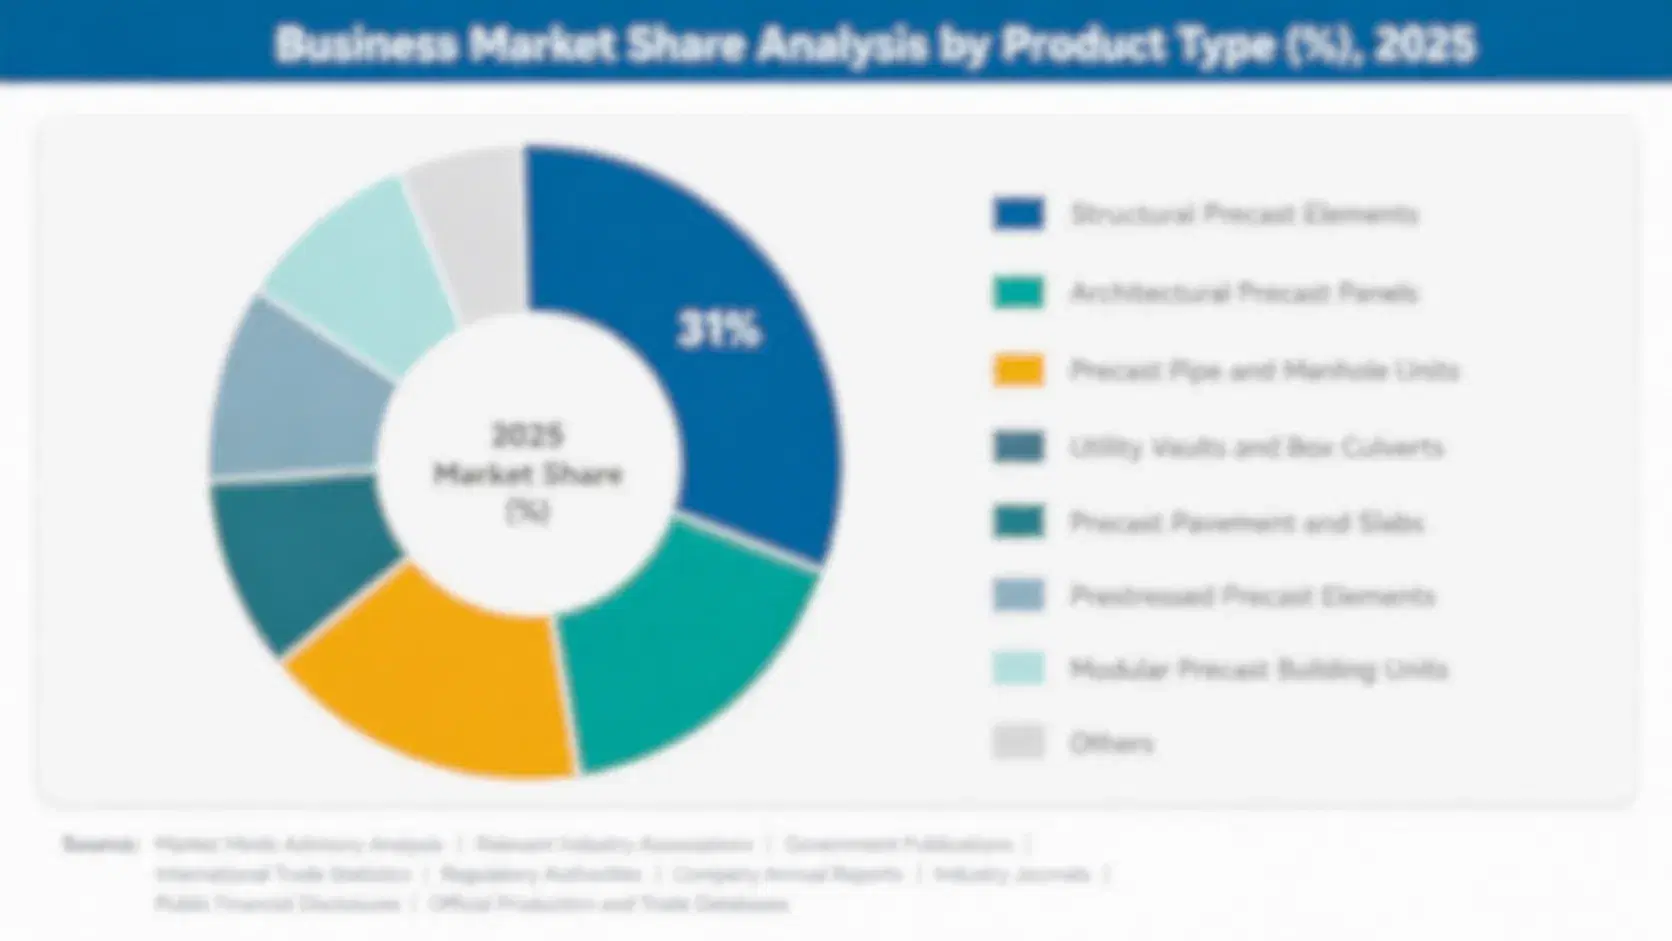
The pet joint health supplement market is segmented by active ingredient formulation, which shows where sourcing cost, margins and clinical positioning differ. Five segments cover glucosamine and chondroitin, green-lipped mussel extract, UC-II collagen, MSM combination, and multi-ingredient formulas. UC-II collagen grows fastest, while multi-ingredient blends carry the largest volumes. MSM formulas round out inflammation-focused coverage.
pet-joint-health-supplement-market-market-share-analysis-1790058691902

UC-II Collagen Formulas

UC-II Collagen Formulas is the fastest-growing segment at 9.1% a year, about 1.40 times the overall market rate. Owners buy formulas built around undenatured type II collagen shown to work at meaningfully lower daily doses than traditional glucosamine and chondroitin combinations, backed by growing published clinical evidence, and prices run 25% to 60% above standard multi-ingredient blends given active ingredient and clinical validation cost. Gross margins of 30% to 50% reward brands with documented mobility score trial data and formulation credibility. Growth depends on veterinary recommendation momentum, trial evidence and retail reach, while clinical validation cost still limits how fast new entrants can compete. Early movers set the standard that later entrants must match.
CAGR 9.1%

Green-Lipped Mussel Extract Formulas

Green-Lipped Mussel Extract Formulas grows at 7.8% a year, about 1.20 times the overall market rate, because owners increasingly seek natural-sourced joint support ingredients backed by a genuine anti-inflammatory fatty acid profile rather than purely synthetic alternatives. Brands use sourcing traceability and supply chain transparency to differentiate. Gross margins of 28% to 44% support brands with production scale and technical reach. Growth depends on natural positioning demand, sourcing transparency and formulation cost, and brands with reliable supply chains hold the strongest positions. Retailers reward brands that respond quickly to reformulation requests. Progress should be reviewed every quarter against agreed mobility score targets. Smaller brands carry the heaviest exposure and have the least room to adjust.
CAGR 7.8%
Full segment breakdown across 5 segments available in the complete report.

Regional Architecture and Country Demand Map

North America leads at 31% because the largest aging pet population and veterinary arthritis diagnosis culture concentrate demand, while Western Europe holds 23%. East Asia holds 17%. South Asia and Pacific holds 11%. Latin America holds 8%. Middle East and Africa holds 5%. Eastern Europe holds 5%.

North America

North America holds 31% share, inside its band, and growth of 6.5%, close to the global rate. The United States runs the largest aging pet population alongside deep veterinary arthritis diagnosis culture, and Nutramax Laboratories and Zesty Paws both maintain significant domestic clinical research and distribution presence. Buyers demand documented mobility score trial data. Retailers also review safety records and audit results before every annual listing renewal. Volumes stay steady, and brands compete mainly on sourcing proof, documentation and delivery reliability. Distributors handle most shipments and set order sizes. Currency moves and freight rates change landed cost each quarter. Brands offering multi-year terms win repeat volume. Buyers also compare delivery reliability before renewing supply terms.
Share: 31% | CAGR: 6.5% (2026 to 2036)

Western Europe

Western Europe holds 23% share, inside its band, and growth of 5.0%, below the global rate. Because North America and Western Europe take the top two slots, the commercial reason is veterinary diagnostic depth: Germany, France and the United Kingdom run strong veterinary orthopedic wellness infrastructure alongside high dog and cat ownership, and YuMOVE maintains particularly deep regional clinical presence. Retailers also review safety records and audit results before every annual listing renewal. Volumes stay steady, and brands compete mainly on sourcing proof, documentation and delivery reliability. Distributors handle most shipments and set order sizes. Currency moves and freight rates change landed cost each quarter. Brands offering multi-year terms win repeat volume.
Share: 23% | CAGR: 5.0% (2026 to 2036)
Regional intelligence for 5 additional markets available in the complete report: East Asia, South Asia and Pacific, Latin America, Middle East and Africa, Eastern Europe. Contact sales@marketmindsadvisory.com.
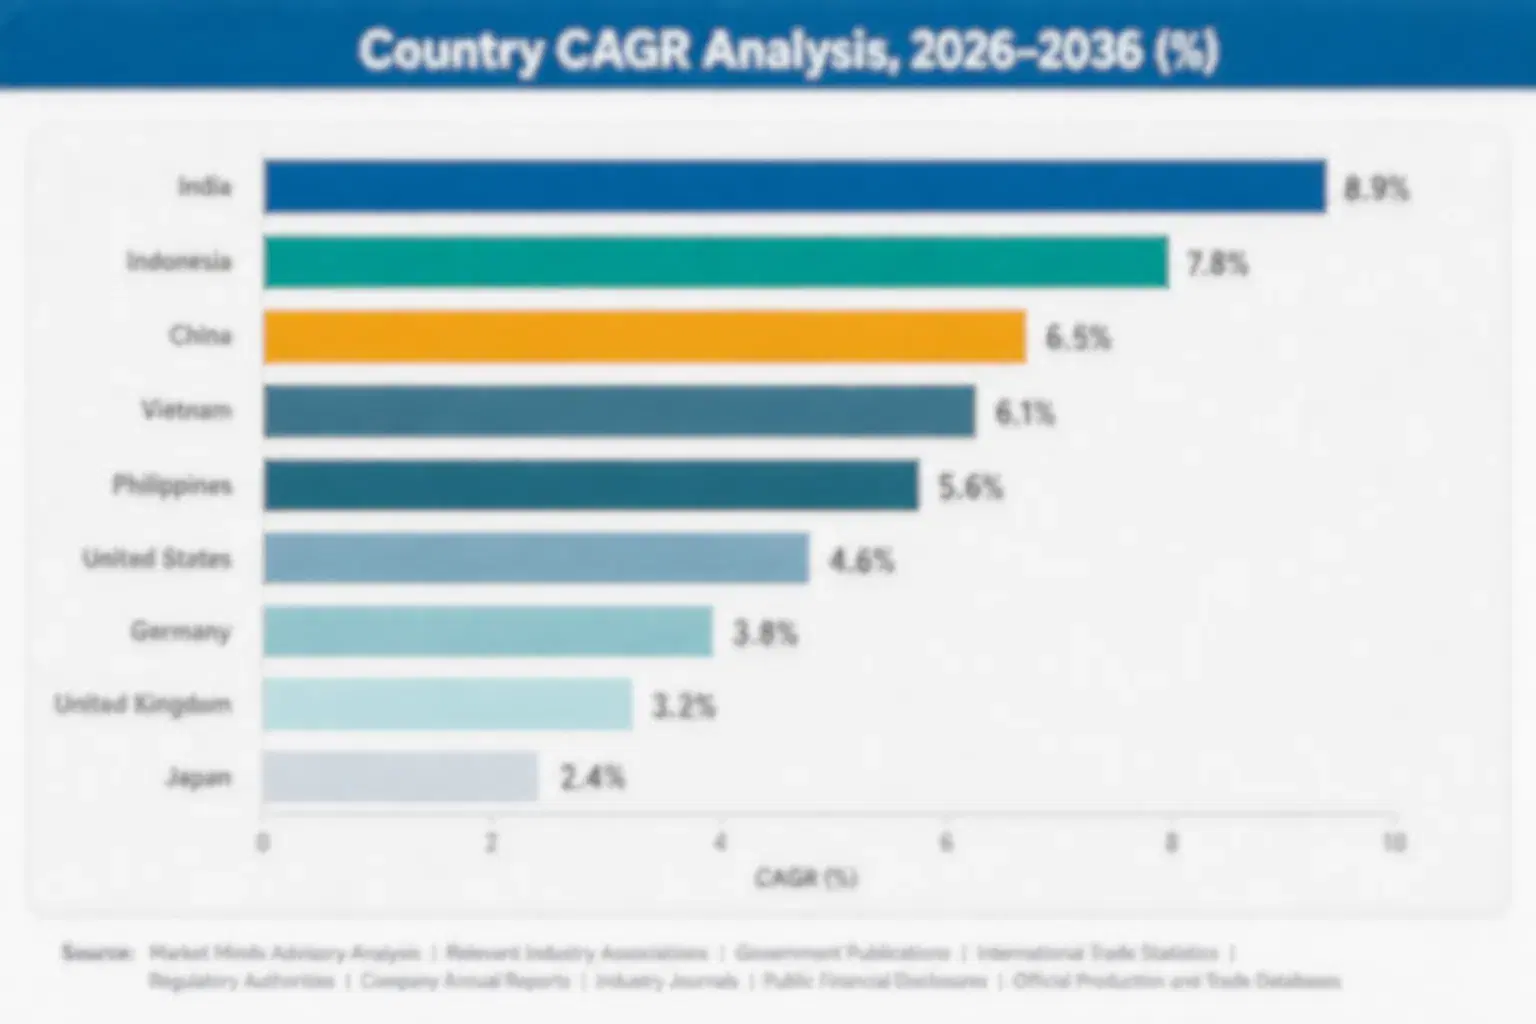
pet-joint-health-supplement-market-country-cagr-analysis-1790058692181

Four Margin Routes for Joint Supplement Brands

Margin in pet joint health supplements comes from clinical validation, UC-II scaling, natural ingredient sourcing and cost control rather than volume alone. The routes below apply to veterinary pharmaceutical groups and specialist consumer brands, and each can start inside one planning cycle, with measures in gross margin points and cost per unit. Retail reach increasingly separates leaders from followers.

Building Clinical Trial Evidence for Mobility Score Improvement

Veterinarians and owners want proof of mobility score improvement, so brands that build clinical trial evidence win contracts worth 9% to 16% of revenue at gross margins of 30% to 50%. Programmes cost $1 million to $7 million. Brands should fund feeding trials, publish peer-reviewed results and secure veterinary endorsement, since unproven joint claims lose the veterinary channel entirely to credentialed rivals. Management should assign one owner to each programme from the start. Early results also help persuade sceptical buyers. Costs are recovered faster in larger plants. Payback runs about three years.
Market Impact: clinical evidence wins contracts worth 9-16% of revenue

Scaling UC-II Collagen Production for Growing Clinical Demand

Owners want the strongest published evidence base at lower dosing, so brands that scale UC-II collagen formula production with documented trial data win contracts worth 8% to 14% of revenue at gross margins of 28% to 44%. Programmes cost $1 million to $5 million. Brands should fund trial validation, secure consistent collagen sourcing and expand production capacity, since unproven formulations lose credibility to brands with documented clinical history. Early results also help persuade sceptical buyers. Costs are recovered faster in larger plants. Payback runs about three years. Management should assign one owner to each programme from the start.
Market Impact: UC-II scaling wins contracts worth 8-14% of revenue

Building Sourcing Traceability for Natural Ingredient Positioning

Owners want documented natural sourcing, so brands that build sourcing traceability for green-lipped mussel and other natural ingredients win contracts worth 7% to 12% of revenue at premiums of 10% to 25%. Programmes cost $0.5 million to $4 million. Brands should invest in supply chain transparency, secure sourcing certification and validate ingredient purity, since unverified natural claims lose owner trust and repeat purchase quickly. Costs are recovered faster in larger plants. Payback runs about three years. Management should assign one owner to each programme from the start. Early results also help persuade sceptical buyers.
Market Impact: sourcing traceability wins contracts worth 7-12% of revenue

Standardising Active Ingredient Sourcing to Control Formulation Cost

Active ingredient cost makes up about 35% of cost, so brands that standardise sourcing across product lines cut cost and complexity by 10% to 18% and protect margins worth 4% to 8% of profit. Programmes cost $0.5 million to $3 million. Brands should consolidate ingredient specifications, qualify shared suppliers and monitor active ingredient markets closely, since fragmented sourcing raises formulation and cost risk substantially. Payback runs about three years. Management should assign one owner to each programme from the start. Early results also help persuade sceptical buyers. Costs are recovered faster in larger plants.
Market Impact: standardised sourcing cuts total cost by 10-18% yearly

Who Controls the Margin Pool

The pet joint health supplement market is concentrated, with a CR5 of 34%, because clinical credibility requirements favour established veterinary supplement groups over new entrants across five distinct formulation types in a long-established category. This assessment measures participants on estimated pet joint health supplement revenue, held constant across all players. Nutramax Laboratories and Zesty Paws lead through clinical research depth and retail distribution reach, VetriScience, PetHonesty and YuMOVE follow, and the gap to the sixth player is significant.
Competition runs on four dimensions today: clinical trial evidence and mobility score validation, veterinary channel relationships and endorsement, retail distribution reach, and ingredient sourcing transparency. Established veterinary groups win on clinical credibility and channel depth, premium OTC challengers win on retail reach and marketing, and natural ingredient specialists win on sourcing transparency. Buyers compare clinical data and veterinary endorsement.

Emerging pressure comes from UC-II collagen evidence widening the addressable clinical market, from natural ingredient sourcing expanding differentiation options, and from ingredient costs that favour brands with scaled platforms. Rankings shift where a brand publishes stronger mobility score data, expands veterinary endorsement faster or builds deeper sourcing transparency, and consolidation continues as small brands face clinical trial and formulation costs.
pet-joint-health-supplement-market-company-positioning-matrix-1790058692477

Competitive Moat and Risk Dimensions

NUTRAMAX LABORATORIES

Moat: Clinical Research and Veterinary Trust

Nutramax Laboratories built its brand around decades of published clinical research and deep veterinary channel trust in joint and mobility supplement categories specifically. Its clinical research depth, veterinary relationships and formulation science give it strong access to veterinary-recommended purchases, and its research base supports continued category leadership in joint health.
NUTRAMAX LABORATORIES

Risk: Narrow Category Concentration Risk

Nutramax Laboratories' concentration in joint health limits diversification as broader consumer brands expand into adjacent categories with wider marketing reach. Active ingredient costs squeeze margins, consumer brands compete on retail accessibility, and veterinary channel shifts can move demand quickly. Investors expect steady returns and careful capital use.
ZESTY PAWS

Moat: Retail Reach and Brand Recognition

Zesty Paws built extensive retail and online distribution reach backed by strong consumer brand recognition, giving it market access advantages that smaller specialist brands cannot match easily. Its retail reach, brand recognition and formulation breadth give it strong access to owners across multiple joint supplement categories, and its scale supports continued expansion into new formulation science.
ZESTY PAWS

Risk: Consumer Brand and Claim Risk

Zesty Paws depends heavily on consumer brand trust that a substantiation challenge or quality incident could damage across its broad supplement portfolio simultaneously. Active ingredient costs squeeze margins, veterinary-endorsed brands compete on clinical credibility, and regulatory scrutiny can shift demand quickly. Investors expect steady returns and disciplined capital use.

Players Tracked

Prominent Players

Nutramax Laboratories
Zesty Paws
VetriScience
PetHonesty
YuMOVE

Other Key Players

Nutri-Vet
PetLab Co
Native Pet
NaturVet
Ark Naturals
Vetoquinol
Bayer Animal Health
Virbac
Ceva Animal Health
Elanco Animal Health
Nestle Purina PetCare
Cosequin
Dasuquin
Finn
Front of the Pack

Recent Developments

JANUARY 2026

Veterinary Supplement Group Expands UC-II Collagen Formula Production Capacity

A veterinary supplement group expanded UC-II collagen formula production capacity to meet rising clinical demand, according to company communications. It is an organic capacity expansion, not an acquisition, and it tests supply readiness. The facility adds several production lines. Financial terms were not disclosed. Rollout follows retailer reviews.
Signal: Confirms brands are scaling UC-II capacity because published clinical evidence keeps outpacing existing production supply. Buyers watch this closely.
FEBRUARY 2026

Consumer Supplement Brand Publishes Clinical Trial Results on Mobility Score Improvement

A consumer supplement brand published clinical trial results demonstrating mobility score improvement across a multi-site feeding study, according to peer-reviewed publication. It is a clinical research publication, not a commercial deal, and it tests formulation credibility. The study covers multiple dog populations. Publication details were disclosed openly.
Signal: Shows consumer brands are investing in published evidence because clinical credibility increasingly determines competitive positioning. Buyers watch this closely.
MARCH 2026

Veterinary Association Publishes Updated Mobility Screening Guidance for Senior Wellness

A veterinary association published updated mobility screening guidance for senior wellness visits, according to public announcements. It is a clinical guidance publication, not a commercial deal, and it tests diagnostic standards. The guidance covers standardised screening tools. Adoption timing across practices remains open. Rollout follows retailer reviews.
Signal: Indicates veterinary bodies are formalising screening guidance because early diagnosis increasingly determines supplement intervention timing. Buyers watch this closely.

Active Ingredient, Clinical Trial and Cost Exposure

Active ingredient sourcing and formulation account for roughly 35% of manufacturing cost, palatability and clinical trial validation about 12%, processing and packaging about 18%, labour and overheads about 15%, and marketing and veterinary education about 12%, with the remainder split across quality assurance. Premium active ingredients such as UC-II collagen and green-lipped mussel extract come mainly from the United States, New Zealand and Europe.
The clearest recent shock came in 2022 and 2023. Specialty chemical market data show glucosamine and collagen input prices rising sharply, and IEA data show energy costs spiking, which lifted processing costs together. Brands absorbed part of the increase, raised pack prices gradually and cut promotional activity, which compressed margins through the period. Some relief came in 2024 and 2025 as ingredient prices eased somewhat.

The disadvantage falls on smaller brands without clinical trial budgets, formulation scale or veterinary channel relationships, because they pay more per unit and cannot spread fixed clinical validation cost. Exposure varies by type: veterinary pharmaceutical groups hold clinical scale and channel depth, consumer brands depend on retail relationships without clinical infrastructure, and natural ingredient specialists depend on narrower formulation scope. Clinical credibility decides who captures premium pricing.
pet-joint-health-supplement-market-cost-volatility-analysis-1790058692782

Multi-Year Ingredient Contracts With Sourcing Diversification

Brands sign multi-year active ingredient contracts and diversify sourcing across regions to cut cost swings of 10% to 20% per year. The main challenge is maintaining formulation consistency across sources, so brands test alternatives early. Procurement teams monitor prices monthly against budgets, and managers review terms yearly closely. Reviews happen on a fixed schedule. Teams document results for future audits.

Shared Clinical Trial Infrastructure Across Product Lines

Brands share clinical trial infrastructure across multiple joint supplement lines to cut validation cost per product by 12% to 22%. The main challenge is coordinating trial timing across diverse formulation types, so brands plan trial calendars carefully. Clinical teams verify results and report findings regularly and thoroughly. Teams document results for future audits. Costs are tracked against budget monthly.

Pack Format Standardisation and Processing Efficiency

Brands standardise pack formats and processing lines across supplement formats to lower unit cost by 8% to 15%. The main challenge is maintaining palatability across standardised processing, so brands test formulations carefully before rollout. Quality teams verify consistency each production run closely. Costs are tracked against budget monthly. Brands are re-evaluated on a fixed cycle.

Portfolio Architecture for Margin Defence

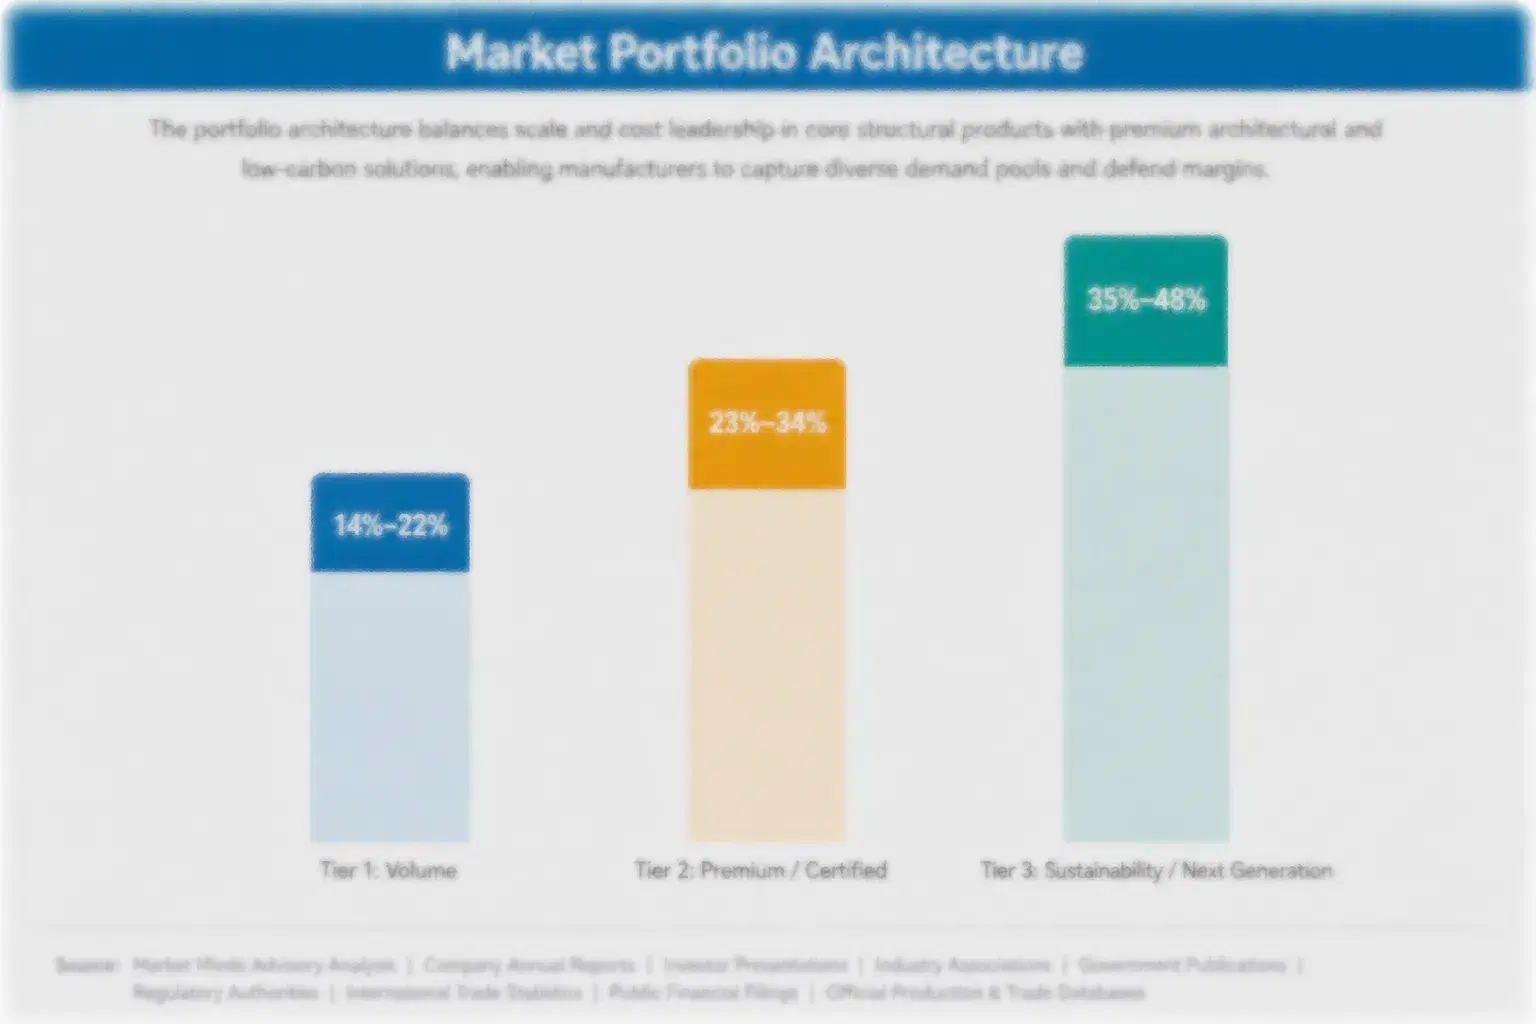
Margins run from moderate returns on standard glucosamine formulas to strong returns on UC-II collagen and multi-ingredient blends sold with clinical validation and veterinary endorsement. Three tiers separate volume products, premium certified products and next-generation solutions, and each draws on different clinical research capability, veterinary channel reach and formulation depth in a concentrated market. Margin gaps between tiers run to 24 points.
The tension between volume and premium is sharp. Standard glucosamine and chondroitin formulas fill retail shelf space at moderate prices and face ingredient cost swings, while UC-II collagen and multi-ingredient blends earn higher margins on smaller volumes and depend on clinical proof, veterinary endorsement and mobility score validation. Brands that run only standard volume suffer when ingredient costs rise, while premium-only brands struggle to fund broad retail distribution.

High-value pools concentrate in UC-II collagen formulas and in multi-ingredient blends sold through veterinary-endorsed clinical validation programmes to owners managing diagnosed joint decline. They gather where owners pay for verified mobility score improvement and formulation credibility, not for volume alone. Green-lipped mussel extract formulas add a natural-positioned pool, and strong brands hold more than one, though each needs different clinical skills.

Volume / Commodity-Adjacent

Standard glucosamine and chondroitin formulas sold on price per unit through grocery and mass retail. Buyers focus on cost and availability, listings follow annual reviews, and differentiation is limited by shared formulation approaches across brands.
Gross Margin: 26%-36%

Premium / Certified

MSM combination and green-lipped mussel formulas with documented efficacy sold through specialty retail and online channels. Buyers value proof of clinical benefit and consistent supply, and listings run for one or more years with regular reviews.
Gross Margin: 28%-40%

Sustainability / Regulatory / Next-Generation

UC-II collagen and multi-ingredient blends sold to owners managing diagnosed joint decline demanding documented mobility score evidence and veterinary endorsement. Sales depend on trial proof and formulation credibility, and brands must show reliable formulation consistency and clean safety records.
Gross Margin: 28%-50%
pet-joint-health-supplement-market-portfolio-architecture-1790058693100

High-value Sub-segments and Strategic Watch-out

UC-II Collagen Formulas

UC-II collagen formulas combine the fastest growth with the strongest pricing, since owners accept gross margins of 30% to 50% for documented mobility score improvement at lower effective doses. Trial evidence depth and formulation credibility form the entry barrier, and brands with credible data lead.
Gross Margin: 30%-50%

Green-Lipped Mussel Extract Formulas

Green-lipped mussel extract formulas deliver solid growth with premium pricing, since owners support gross margins of 28% to 44% for documented natural sourcing with a genuine anti-inflammatory profile. Sourcing transparency and supply chain depth limit competition, though adoption still varies by owner awareness. Reviews occur each season.
Gross Margin: 28%-44%

Glucosamine and Chondroitin Formulas

Glucosamine and chondroitin formulas are the volume core, with value growing about 4.6% a year. Active ingredient cost, formulation consistency and price competition decide profit, and veterinary pharmaceutical groups and consumer brands hold most sales. Retailers renew listings yearly at prices linked to competing bids.
Gross Margin: 26%-36%

MSM Combination Formulas

MSM combination formulas are the strategic watch-out, since growth of about 3.8% a year trails the leaders, private label competition increasingly compresses baseline pricing and generic manufacturer entry adds persistent margin risk. Brands should manage ranges selectively and steer investment toward UC-II and mussel extract lines with clearer buyers.

Why Owners Keep Buying Joint Supplements

Pet joint health supplement demand behaves like an annuity attached to every senior wellness routine, reinforced by the format's role as ongoing management rather than a one-time treatment. Once an owner sees a noticeable improvement in mobility or activity level, purchases repeat every reorder cycle, and switching means risking a return of the stiffness the owner worked to manage. Veterinarians set recommendations around proven results, and prescription relationships lock in volume.
Adoption stickiness differs by owner vertical. Owners of pets with a diagnosed joint condition are the deepest, since the purchase is grounded in active symptom management backed by veterinary screening results. Proactive owners are moderately sticky, driven by veterinary recommendation. Casual owners buying preventively are more fluid, switching formats and brands readily, though a genuinely effective supplement holds repeat purchase for extended periods.

Buyer profiles are shifting between generations. Older owners relied on veterinary recommendation alone and simple brand loyalty, while younger owners research clinical evidence proactively, compare ingredient sourcing and shop online with subscriptions. Veterinarians and pet insurers add a third group that shapes purchasing expectations. Brands with clear data win newer owners.
pet-joint-health-supplement-market-end-use-penetration-index-1790058693402

MMA Verdict: Joint Supplement Strategy

These are among the four positions where our research anticipates prominent divergence between winners and laggards over the coming forecast period. Each is grounded in the demand model, the regulatory perimeter, and the announced capacity pipeline.
01 / CLINICAL EVIDENCE STRATEGY

Build Mobility Score Evidence Before Rivals Lock In Veterinary Channel Trust

Veterinarians and owners want proof of mobility score improvement, and brands that build clinical trial evidence win contracts worth 9% to 16% of revenue at gross margins of 30% to 50%. Brands should invest $1 million to $7 million, fund thorough feeding trials and publish peer-reviewed results broadly and clearly. Those that delay will lose veterinary channel access and referral volume over the next two years, while early movers hold clearly higher prices and durably stronger margins across every renewal.
02 / UC-II SCALING STRATEGY

Scale UC-II Collagen Before Clinical Demand Outpaces Available Supply

Owners want the strongest published evidence base at lower dosing, and brands that scale UC-II collagen formula production with documented trial data win contracts worth 8% to 14% of revenue at gross margins of 28% to 44%. Brands should invest $1 million to $5 million, fund thorough trial validation and secure consistent collagen sourcing broadly. Those that delay will lose credibility and shelf space over the next two years, while early movers hold much stronger owner trust and better margins.
03 / SOURCING TRANSPARENCY STRATEGY

Build Sourcing Traceability Before Rivals Own the Natural Positioning Narrative

Owners want documented natural sourcing, and brands that build sourcing traceability for natural ingredients win contracts worth 7% to 12% of revenue at premiums of 10% to 25%. Brands should invest $0.5 million to $4 million, invest steadily in supply chain transparency and secure broad sourcing certification quickly. Those that delay will lose differentiation and owner trust over the next two years, while early movers hold clearly stronger loyalty, sourcing credibility and durable pricing power across every region, season and renewal.
04 / INGREDIENT COST STRATEGY

Standardise Ingredient Sourcing Before Formulation Costs Erode Achievable Margins

Active ingredient cost makes up about 35% of cost, and brands that standardise sourcing across product lines cut cost and complexity by 10% to 18% and protect margins worth 4% to 8% of profit. Brands should invest $0.5 million to $3 million, consolidate ingredient specifications and qualify shared suppliers. Those that delay will pay rising input bills and lose pricing power over the next two years, while early movers hold lower costs and steadier, more predictable margins across every budget cycle.

Engagement Snapshot From the Field

A live engagement with an industry participant carrying material or product regulatory and market exposure ahead of a defining policy shift, showing how our research translates into a defensible multi-year portfolio strategy.
MARKET MINDS ADVISORY · CLIENT ENGAGEMENT SUMMARY
Pet Joint Health Supplement Producer Strategic Portfolio Review and Transition Roadmap 2026·Investment Scenario on Pet Joint Health Supplement Exposure Evaluation 2025-26
CLIENT PROFILE
The client is a mid-size North American veterinary supplement brand with annual revenue near $92 million (client-reported, unverified by MMA), selling traditional glucosamine formulas through veterinary clinics and specialty retail, facing pressure to modernise its formulation portfolio as UC-II collagen evidence gained veterinary traction. The brand has supplied veterinary clinics across the region for more than a decade.
STRATEGIC CHALLENGE
Veterinary partners requested a credible UC-II collagen line within a 12-month window as clinical evidence shifted prescribing patterns (client-reported, unverified by MMA), the brand lacked collagen-specific clinical trial infrastructure, and management had to decide between building internal capability or partnering with a contract research organisation. The board wanted a clear recommendation before the following veterinary conference season.
MMA APPROACH
MMA analysed clinical development options and partnership trade-offs across three scenarios, interviewed 13 veterinarians, retailers and contract research organisations, and modelled cost and timeline trade-offs between internal development and partnership across two formulation types. It compared options against the veterinary launch timeline and cost targets. Findings were validated against comparable formulation modernisation cases from adjacent supplement segments.
KEY FINDINGS
  1. Partnering with a contract research organisation would reach clinical validation faster than building internal capability within the veterinary deadline (client-reported, unverified by MMA).
  2. Two veterinary partner networks confirmed distribution commitment pending completed clinical trial documentation (client-reported, unverified by MMA). This finding shaped the distribution launch sequencing plan.
  3. Focusing initial launch on a single UC-II formulation would reach market faster than pursuing a full multi-ingredient range immediately (client-reported, unverified by MMA).
  4. Veterinarians reviewing early trial data expressed willingness to switch prescribing patterns once published (client-reported, unverified by MMA). This finding supported the publication-first strategy built into the plan.
CLIENT PROFILE
The client is a mid-size North American veterinary supplement brand with annual revenue near $92 million (client-reported, unverified by MMA), selling traditional glucosamine formulas through veterinary clinics and specialty retail, facing pressure to modernise its formulation portfolio as UC-II collagen evidence gained veterinary traction. The brand has supplied veterinary clinics across the region for more than a decade.
STRATEGIC CHALLENGE
Veterinary partners requested a credible UC-II collagen line within a 12-month window as clinical evidence shifted prescribing patterns (client-reported, unverified by MMA), the brand lacked collagen-specific clinical trial infrastructure, and management had to decide between building internal capability or partnering with a contract research organisation. The board wanted a clear recommendation before the following veterinary conference season.
MMA APPROACH
MMA analysed clinical development options and partnership trade-offs across three scenarios, interviewed 13 veterinarians, retailers and contract research organisations, and modelled cost and timeline trade-offs between internal development and partnership across two formulation types. It compared options against the veterinary launch timeline and cost targets. Findings were validated against comparable formulation modernisation cases from adjacent supplement segments.
KEY FINDINGS
  1. Partnering with a contract research organisation would reach clinical validation faster than building internal capability within the veterinary deadline (client-reported, unverified by MMA).
  2. Two veterinary partner networks confirmed distribution commitment pending completed clinical trial documentation (client-reported, unverified by MMA). This finding shaped the distribution launch sequencing plan.
  3. Focusing initial launch on a single UC-II formulation would reach market faster than pursuing a full multi-ingredient range immediately (client-reported, unverified by MMA).
  4. Veterinarians reviewing early trial data expressed willingness to switch prescribing patterns once published (client-reported, unverified by MMA). This finding supported the publication-first strategy built into the plan.
RECOMMENDED STRATEGY
Phase 1: Phase 1 (Months 1-5): Partner with a contract research organisation and complete UC-II collagen clinical trials. Initial testing covered palatability and formulation validation. Phase 2: Phase 2 (Months 6-9): Launch the formula with the two committed veterinary partner networks and gather early data. Feedback shaped marketing before wider distribution expansion. Phase 3: Phase 3 (Months 10-12): Expand distribution nationally and pursue broader veterinary channel endorsement for the line. Results were reviewed monthly against sales and endorsement targets.
OUTCOME
Within 12 months, the brand launched successfully across both veterinary partner networks and secured early broader veterinary interest in the formula (client-reported, unverified by MMA). Management credited the clinical partnership with compressing time to market for a credible modernisation effort. Veterinary relationships strengthened as documented clinical results reassured partners across the category.

Frequently Asked Questions

Foundational context covering the market sizes, CAGR, scope, country, region and competition that inform every finding below. This section is provided to cover basics and most often pre-purchase conversations, answered from the MMA Primary Research Dataset.

What is the current size of the Pet Joint Health Supplement Market?

The global pet joint health supplement market was valued at $780 million in 2025 on a manufacturer revenue basis. Growth comes from rising diagnostic awareness and UC-II collagen clinical evidence.

How large will the Pet Joint Health Supplement Market be by 2036?

The market is projected to reach $1.56 billion by 2036, up from $0.83 billion in 2026. The increase of $0.73 billion reflects UC-II adoption and expanding veterinary screening.

What is the CAGR for the Pet Joint Health Supplement Market 2026 to 2036?

The market is forecast to grow at a 6.5% CAGR from 2026 to 2036. The bull case reaches 7.8% and the bear case 5.2%, depending on diagnostic screening, clinical evidence and pet supplement volumes.

Which segment is growing fastest?

UC-II Collagen Formulas is the fastest-growing segment at 9.1% CAGR, roughly 1.40 times the overall market rate. Green-Lipped Mussel Extract Formulas follows at 7.8% CAGR.

Who are the major companies in the Pet Joint Health Supplement Market?

Major companies include Nutramax Laboratories, Zesty Paws, VetriScience, PetHonesty and YuMOVE, alongside Nutri-Vet, PetLab Co, Native Pet and NaturVet. These companies compete across formulation depth and veterinary reach.

Which country is growing fastest?

China is growing fastest at about 7.9% CAGR, because rapidly expanding pet ownership and rising veterinary diagnostic awareness expand together. India and Brazil follow through similar growth.

Report Segmentation Architecture

The full report scope spans multiple orthogonal segmentation dimensions, with cross-tabulated demand data provided for each dimension pair. Coverage extends further to regional breakdowns, trend trajectories, and the competitive detail needed to support segment-level decision-making.

By Primary Market Dimension

  • Glucosamine and Chondroitin Formulas
  • Green-Lipped Mussel Extract Formulas
  • UC-II Collagen Formulas
  • MSM Combination Formulas
  • Multi-Ingredient Joint Support Blends

By End-Use Industry

  • Diagnosed Joint Condition Households
  • Proactive Senior Wellness Households
  • Casual Preventive Purchase Households
  • Veterinary Clinic Referral Channel

By Commercial Dimension

  • Veterinary Clinic Sales
  • Specialty Pet Retail
  • Grocery and Mass Retail
  • Online and Subscription Channels

By Region

  • North America
  • Western Europe
  • East Asia
  • South Asia and Pacific
  • Latin America
  • Middle East and Africa
  • Eastern Europe

Scope, Methodology, and Coverage

Every figure in this report is reproducible from documented input assumptions. The scope below maps the historical period, the forecast horizon, the segmentation dimensions, and the countries covered, alongside the underlying primary and qualitative methodology.
Historical Period
2020 to 2025
Forecast Period
2026 to 2036
Base Year
2025 (USD billions; MMA Primary Research Dataset, September 2026)
Market Definition
The market covers global manufacturer revenue from dietary supplements formulated specifically to support joint health and mobility in dogs and cats, defined as glucosamine and chondroitin, green-lipped mussel extract, UC-II collagen, MSM combination, and multi-ingredient joint support formulas. It excludes prescription veterinary pharmaceuticals for arthritis, general multivitamin supplements without joint-specific positioning, and complete senior pet food formulations.
Quantitative Units
USD millions (manufacturer revenue); million units for volume references
Segmentation Dimensions
By Active Ingredient Formulation; By Owner Type; By Commercial Dimension; By Region
Regions Covered
North America, Western Europe, East Asia, South Asia and Pacific, Latin America, Middle East and Africa, Eastern Europe
Countries Covered
United States, Canada, Mexico, Brazil, Argentina, United Kingdom, Germany, France, Italy, Netherlands, China, Japan, South Korea, India, Australia, New Zealand, Saudi Arabia, United Arab Emirates, South Africa, Poland, and additional markets relevant to this sector
Key Companies Profiled
Nutramax Laboratories, Zesty Paws, VetriScience, PetHonesty, YuMOVE, Nutri-Vet, PetLab Co, Native Pet, NaturVet, Ark Naturals, Vetoquinol, Bayer Animal Health, Virbac, Ceva Animal Health, Elanco Animal Health, Nestle Purina PetCare, Cosequin, Dasuquin, Finn, Front of the Pack
Quantitative Methodology
Primary survey, n=3,800 respondents, Q4 2025, six countries; demand-side model with trade association cross-validation
Qualitative Methodology
47 expert interviews, Q4 2025; applied to validate demand model assumptions, identify emerging dynamics, and assess competitive positioning
Report Format
PDF and XLSX data workbook (Word format preview document)
Publisher
Market Minds Advisory
Report Code
MMA-2026-AGR-401
Published
September 2026
Contact
sales@marketmindsadvisory.com | www.marketmindsadvisory.com

Purchase the full Pet Joint Health Supplement Market Report (2026 to 2036).

The full report delivers a detailed assessment of the global pet joint health supplement market through 2036, covering active ingredient formulation, owner type and regional forecasts, competitive benchmarking of leading veterinary and consumer supplement brands, and input cost analysis. It combines MMA primary research, including a six-country survey of 3,800 respondents and 47 expert interviews, with public statistical and company data. Analysts also model active ingredient, clinical trial and processing cost scenarios. Clients receive segment margin ranges, clinical evidence trackers and a case study on formulation modernisation strategy.
Ten-year active ingredient and owner type demand forecasts
Active ingredient, clinical trial and processing cost tracking
Competitive benchmarking of leading joint supplement brands
Supplement claim substantiation and safety tracker
Regional comparative analysis and forecasts included
Quarterly primary survey data update access

Built For The People Who Decide

From boardroom strategy to bench-side execution, this report is read cover-to-cover by leaders shaping the next decade of their industry, turning demand scenarios, market dynamics and valuation benchmarks into decisions.
CXOs/ Presidents/ VPs/ Managers
M&A and Corporate Development
Strategy Teams and R&D Heads
Procurement and Product Directors
Regulatory and Compliance Leaders
Investor Relations and Equity Analysts