Market Minds Advisory
PET Containers Market

PET Containers Market: Recycled Content Mandates, On-Site Conversion Economics and the Slow Retreat of Glass

Recycled PET now trades above virgin resin in several markets, inverting the economics of an entire packaging category and forcing converters to compete for feedstock they once treated as a disposal problem.

Lead Analyst

Bilal Shaikh

Published

September 2026

Make Smarter Decisions with Customized Research Insights

Request a free sample report and evaluate market opportunities, growth trends, and competitive dynamics relevant to your business needs.

2025 MARKET VALUE$48.5BMarket Size 2025
2036 FORECAST VALUE$77.9BBase Case , 2026 to 2036
CAGR 2026 TO 20364.4 %Bull 5.6% / Bear 3.2%
INCREMENTAL OPPORTUNITY$27.3BNet 10- year value creation
EXPANSION MULTIPLE1.54x2036 value over 2026 base
Strategic Levers
M&A Pipeline
Regional Outlook
Country Rankings
Competitive Intelligence
Segmental Deep-dive
Call-Us : 91 93563 13602

Executive Snapshot and Market Trajectory

Food-grade recycled PET costs more than virgin resin across much of Europe, which is not how recycled materials are supposed to work. Mandates created demand before collection infrastructure could supply it, and converters now compete for bottles they once paid to dispose of. Scarcity replaced abundance inside three years.
Hot-fill and aseptic containers compound at 6.6%, exactly 1.50 times the market, as heat-set bottle technology and aseptic filling take juice, tea and dairy volume that glass and metal held for decades. East Asia holds 29% of consumption on beverage volume alone, and South Asia and Pacific grows fastest at 6.4% as bottled water penetration keeps rising from a low base. Developed market penetration peaked long ago.
Concentration is remarkably low, with the top five holding 24%. Blown containers are mostly air and uneconomic to ship, so conversion happens beside the filling line and frequently inside the filler's own building. Preforms travel between regions; finished containers barely cross a border anywhere. That geometry has kept the category fragmented throughout its history, and regional converters hold ground against far larger names because of it. Local density beats global scale here.
Market Definition
The market covers rigid containers blow-moulded from polyethylene terephthalate, including bottles, jars and wide-mouth containers for beverages, food, personal care and household products, together with preforms supplied for third-party blowing. Closures, labels, PET sheet and thermoformed trays are excluded, as is polyester resin sold into textile or film applications rather than container conversion.
Base Year Value
$48.5B in 2025 (MMA Primary Research Dataset, August 2026)
Forecast Period
2026 to 2036, eleven discrete annual values
CAGR
4.4% base case. Bull 5.6%. Bear 3.2%.
Fastest Growth Segment
Hot-Fill and Aseptic Containers: 6.6% CAGR
Fastest Growth Country
India: 7.2% CAGR
Fastest Growth Region
South Asia and Pacific: 6.4% CAGR
Largest Region
East Asia: 29% of 2025 global value
Market Leaders
Amcor, ALPLA Group, Plastipak Holdings, Indorama Ventures, Retal Industries. Source: MMA Analysis based on company annual reports.
Primary Survey
n=3,800 procurement and R&D decision-makers, Q4 2025, six countries
Methodology
Demand-side build-up, cross-validated against public data, 47 expert interviews

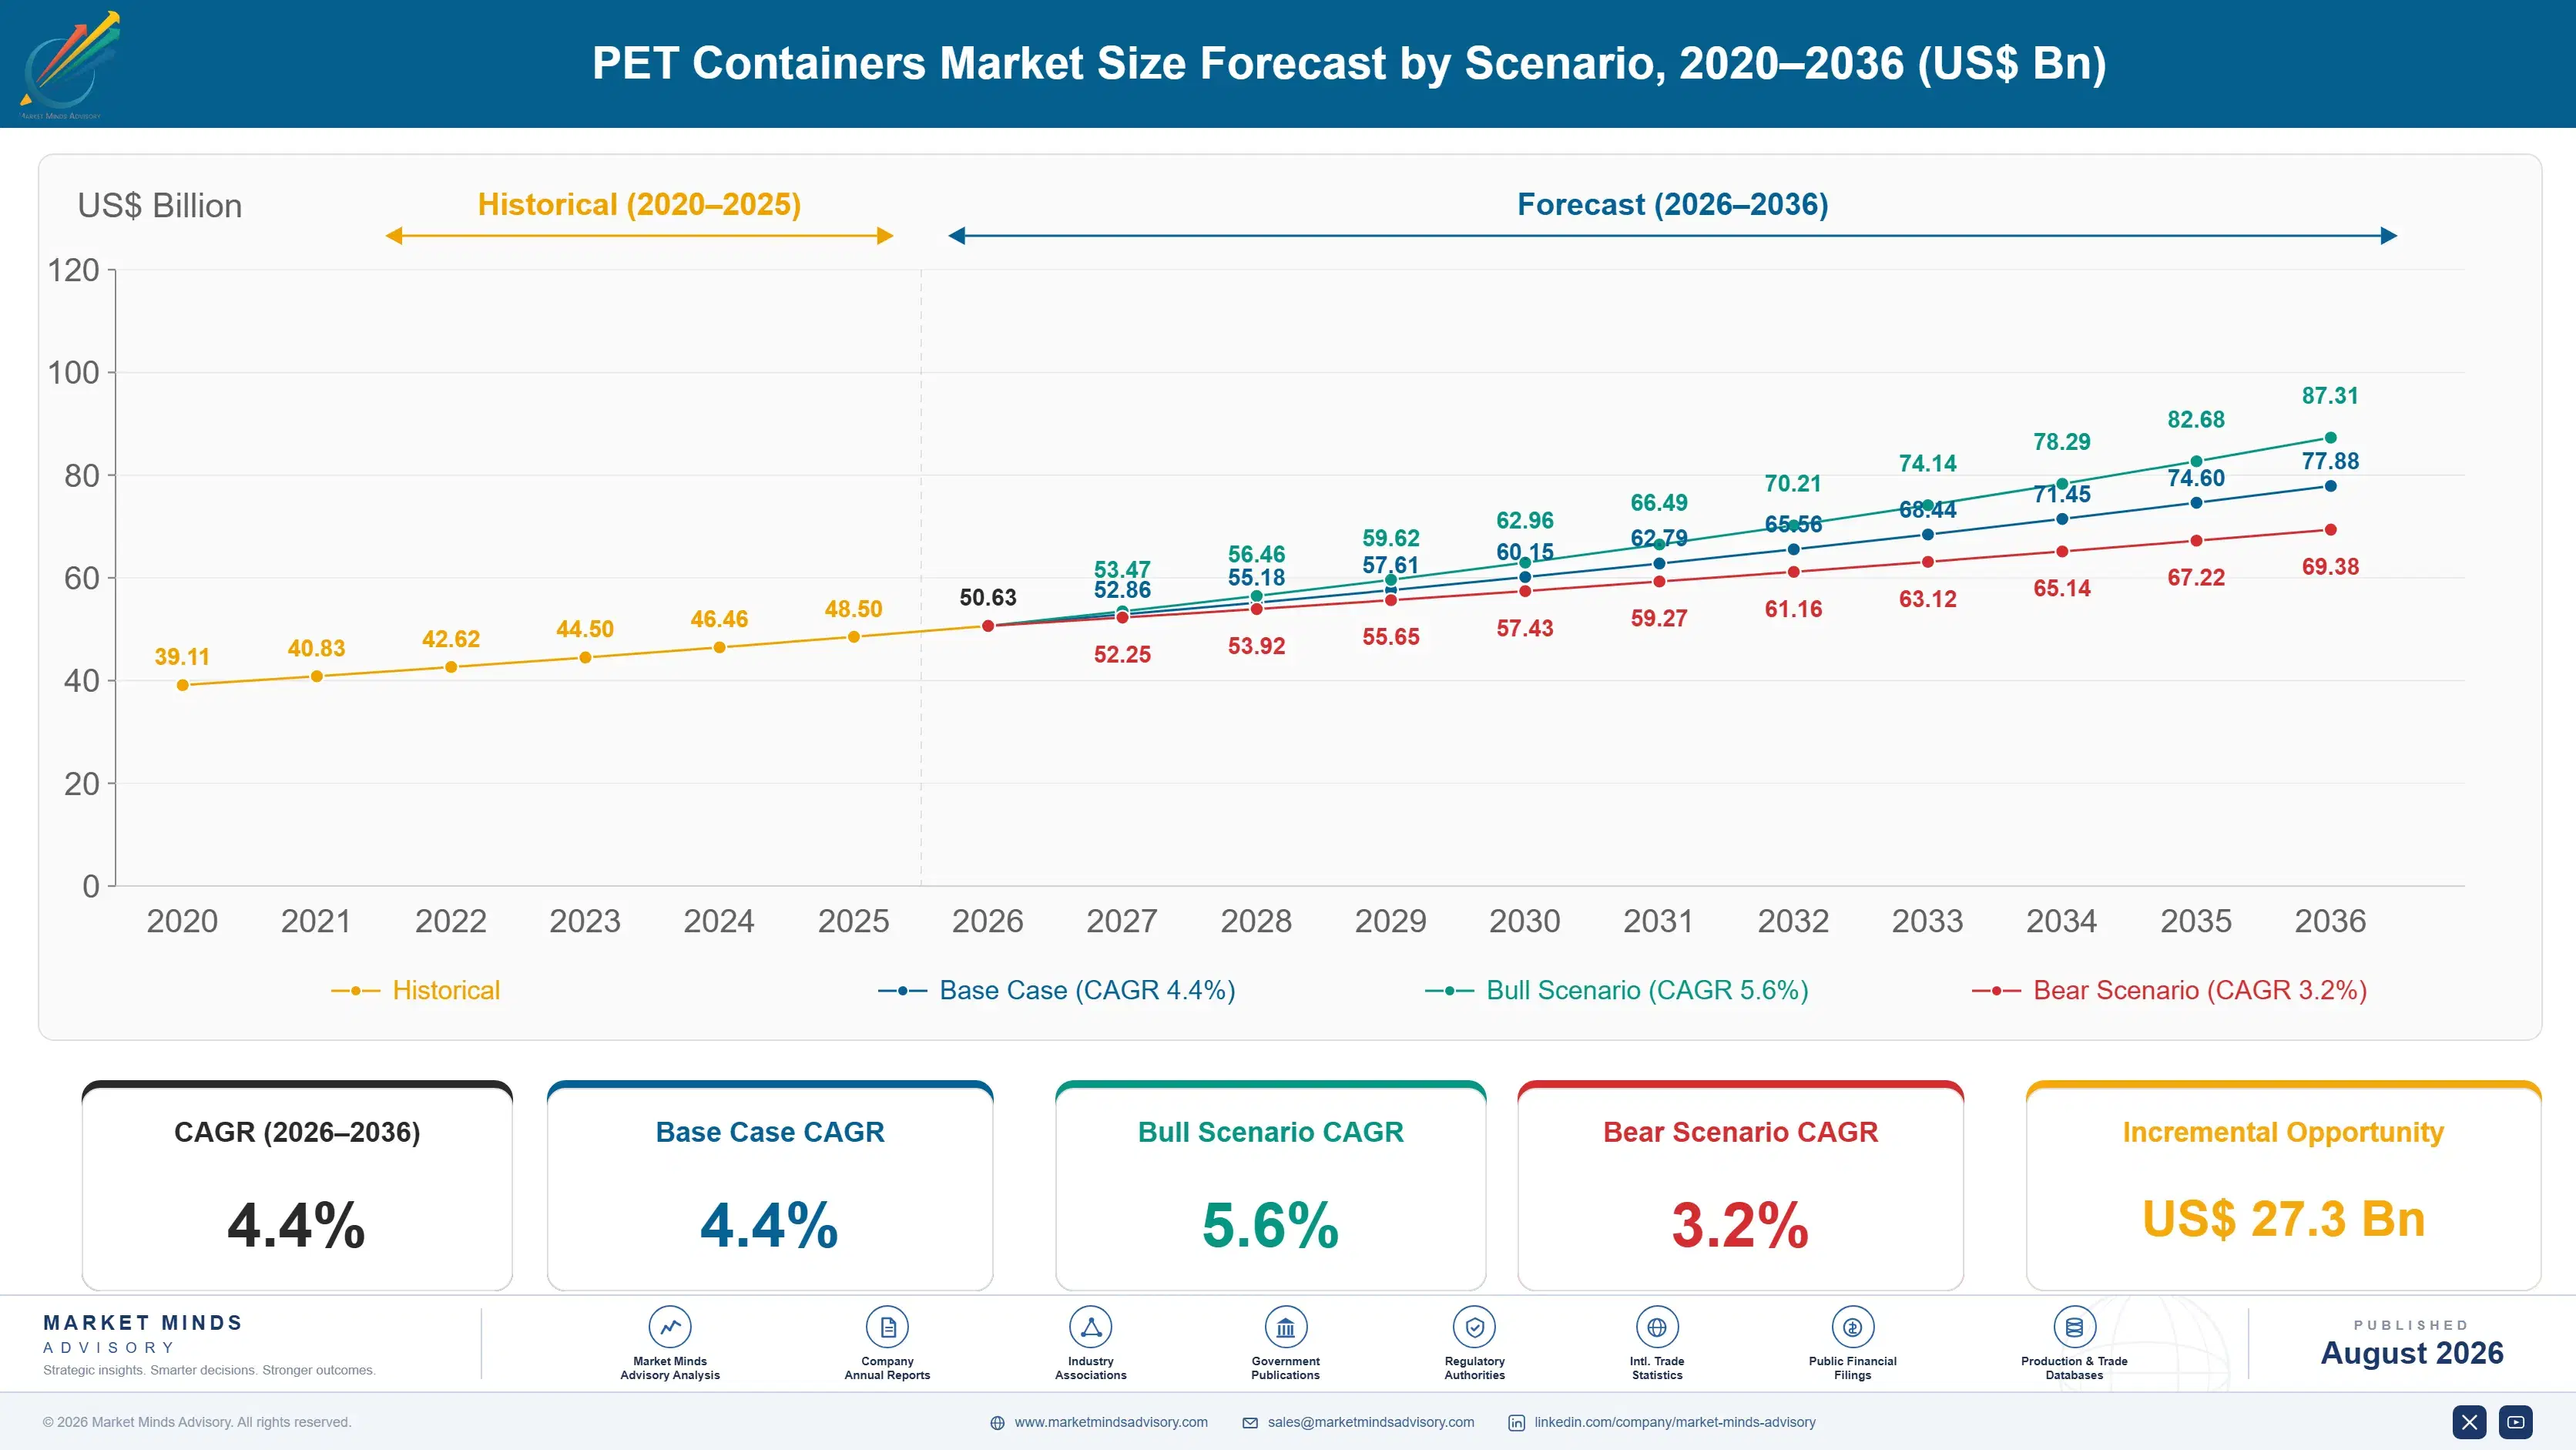
PET Containers Market Forecast Scenarios

pet-containers-market-size-forecast-scenario-1787307270158
The implied 3.6% CAGR across 2020 to 2025 understates how eventful the period was. Pandemic-era on-trade closures shifted beverage volume into retail packs and lifted 2020 and 2021 sharply, then resin cost volatility and European recycled content rules reshaped converter economics entirely from 2022 onward, in ways that unit volumes alone do not show. Unit counts hid most of it.
The base case at 4.4% rests on three mechanisms. Bottled water and ready-to-drink penetration keeps rising across South and Southeast Asia, Africa and Latin America from bases well below developed market levels. Hot-fill and aseptic technology continues taking juice, tea and dairy volume from glass and metal. And recycled content mandates raise the value per container even where the unit count grows slowly. None of the three depends on the others.
The bull case at 5.6% assumes deposit return schemes expand fast enough to make food-grade recycled PET genuinely abundant, removing the feedstock constraint that currently limits conversion. The bear case at 3.2% follows from reuse and refill mandates under the European Packaging and Packaging Waste Regulation biting harder than expected, alongside continued lightweighting that reduces resin content per container.

When Recycled Material Costs More Than Virgin

For thirty years the economics of this market were simple. Resin was cheap, bottles were light, and every year the engineers took a little more weight out of the design. A standard water bottle now weighs 31% less than its 2000 equivalent. That relentless efficiency was the industry's proudest achievement, and it also meant the category grew in units far faster than it grew in value.
TOP FIVE CONCENTRATION24%Combined share held by the five largest global converters
RECYCLED RESIN PREMIUM18% above virginFood-grade recycled polymer price against the virgin equivalent
RESIN COST SHARE62% of COGSPolymer input as proportion of total conversion cost
ON-SITE CONVERSION SHARE37% of volumeContainers blown inside or adjacent to the filling facility
BOTTLE WEIGHT REDUCTION31% since 2000Cumulative lightweighting achieved on standard bottled water containers
DEPOSIT SCHEME COLLECTION92% return rateTypical recovery achieved where deposit return operates properly
Recycled content mandates broke that pattern. European rules requiring recycled polymer in beverage bottles created demand for food-grade recycled PET well ahead of the collection systems that supply it, and the material now trades roughly 18% above virgin in several markets. Converters that once viewed used bottles as somebody else's disposal problem now compete for them as a scarce input. Scarcity replaced abundance within about three years.
The other governing fact is geometry. A blown container is mostly air, so shipping one any distance is uneconomic. Preforms travel; bottles do not. Roughly 37% of volume is blown inside or immediately beside the filling facility under long-term agreements, which makes this a business of local infrastructure positions rather than of global supply relationships. Local density beats global scale here.
"Nobody in this industry expected to spend the 2020s bidding against their own customers for used bottles. The mandate arrived years before the collection infrastructure did, and everyone is now living inside that gap."
Director, Rigid Packaging and Polymer Conversion Practice · MMA Rigid Plastic Pa

Market Trends

Recycled Content Mandates Invert Virgin and Recycled Pricing

European Union single-use plastics rules require 25% recycled content in PET beverage bottles from 2025 and 30% from 2030, with the Packaging and Packaging Waste Regulation extending obligations further. Food-grade recycled PET supply has not kept pace, and the material trades roughly 18% above virgin resin across several European markets. Brand owners with public recycled content commitments bid above the mandate level, tightening supply further. Converters holding contracted recycling capacity or bottle-to-bottle feedstock agreements now hold a cost position that competitors buying on spot cannot approach. That advantage widens as thresholds tighten.
Market Impact: India compounding at 7.2% annually
Hot-Fill and Aseptic Technology Takes Volume From Glass

Heat-set bottle design and aseptic filling let PET handle juice, ready-to-drink tea, dairy and sauces that previously required glass or metal for thermal or shelf-life reasons. The container is lighter, cheaper to transport and less prone to breakage in distribution. Aseptic lines cost considerably more than conventional filling and require validated sterilisation, so conversion happens at capital investment cycles rather than continuously. The segment compounds at 6.6% against a market at 4.4%, and the volume it takes rarely returns to the format it left. Filling line capital decides the timing.
Market Impact: Deposit schemes achieving 92% colle

Market Opportunities and Growth Drivers

Bottled Water Penetration Rises From Very Low Bases

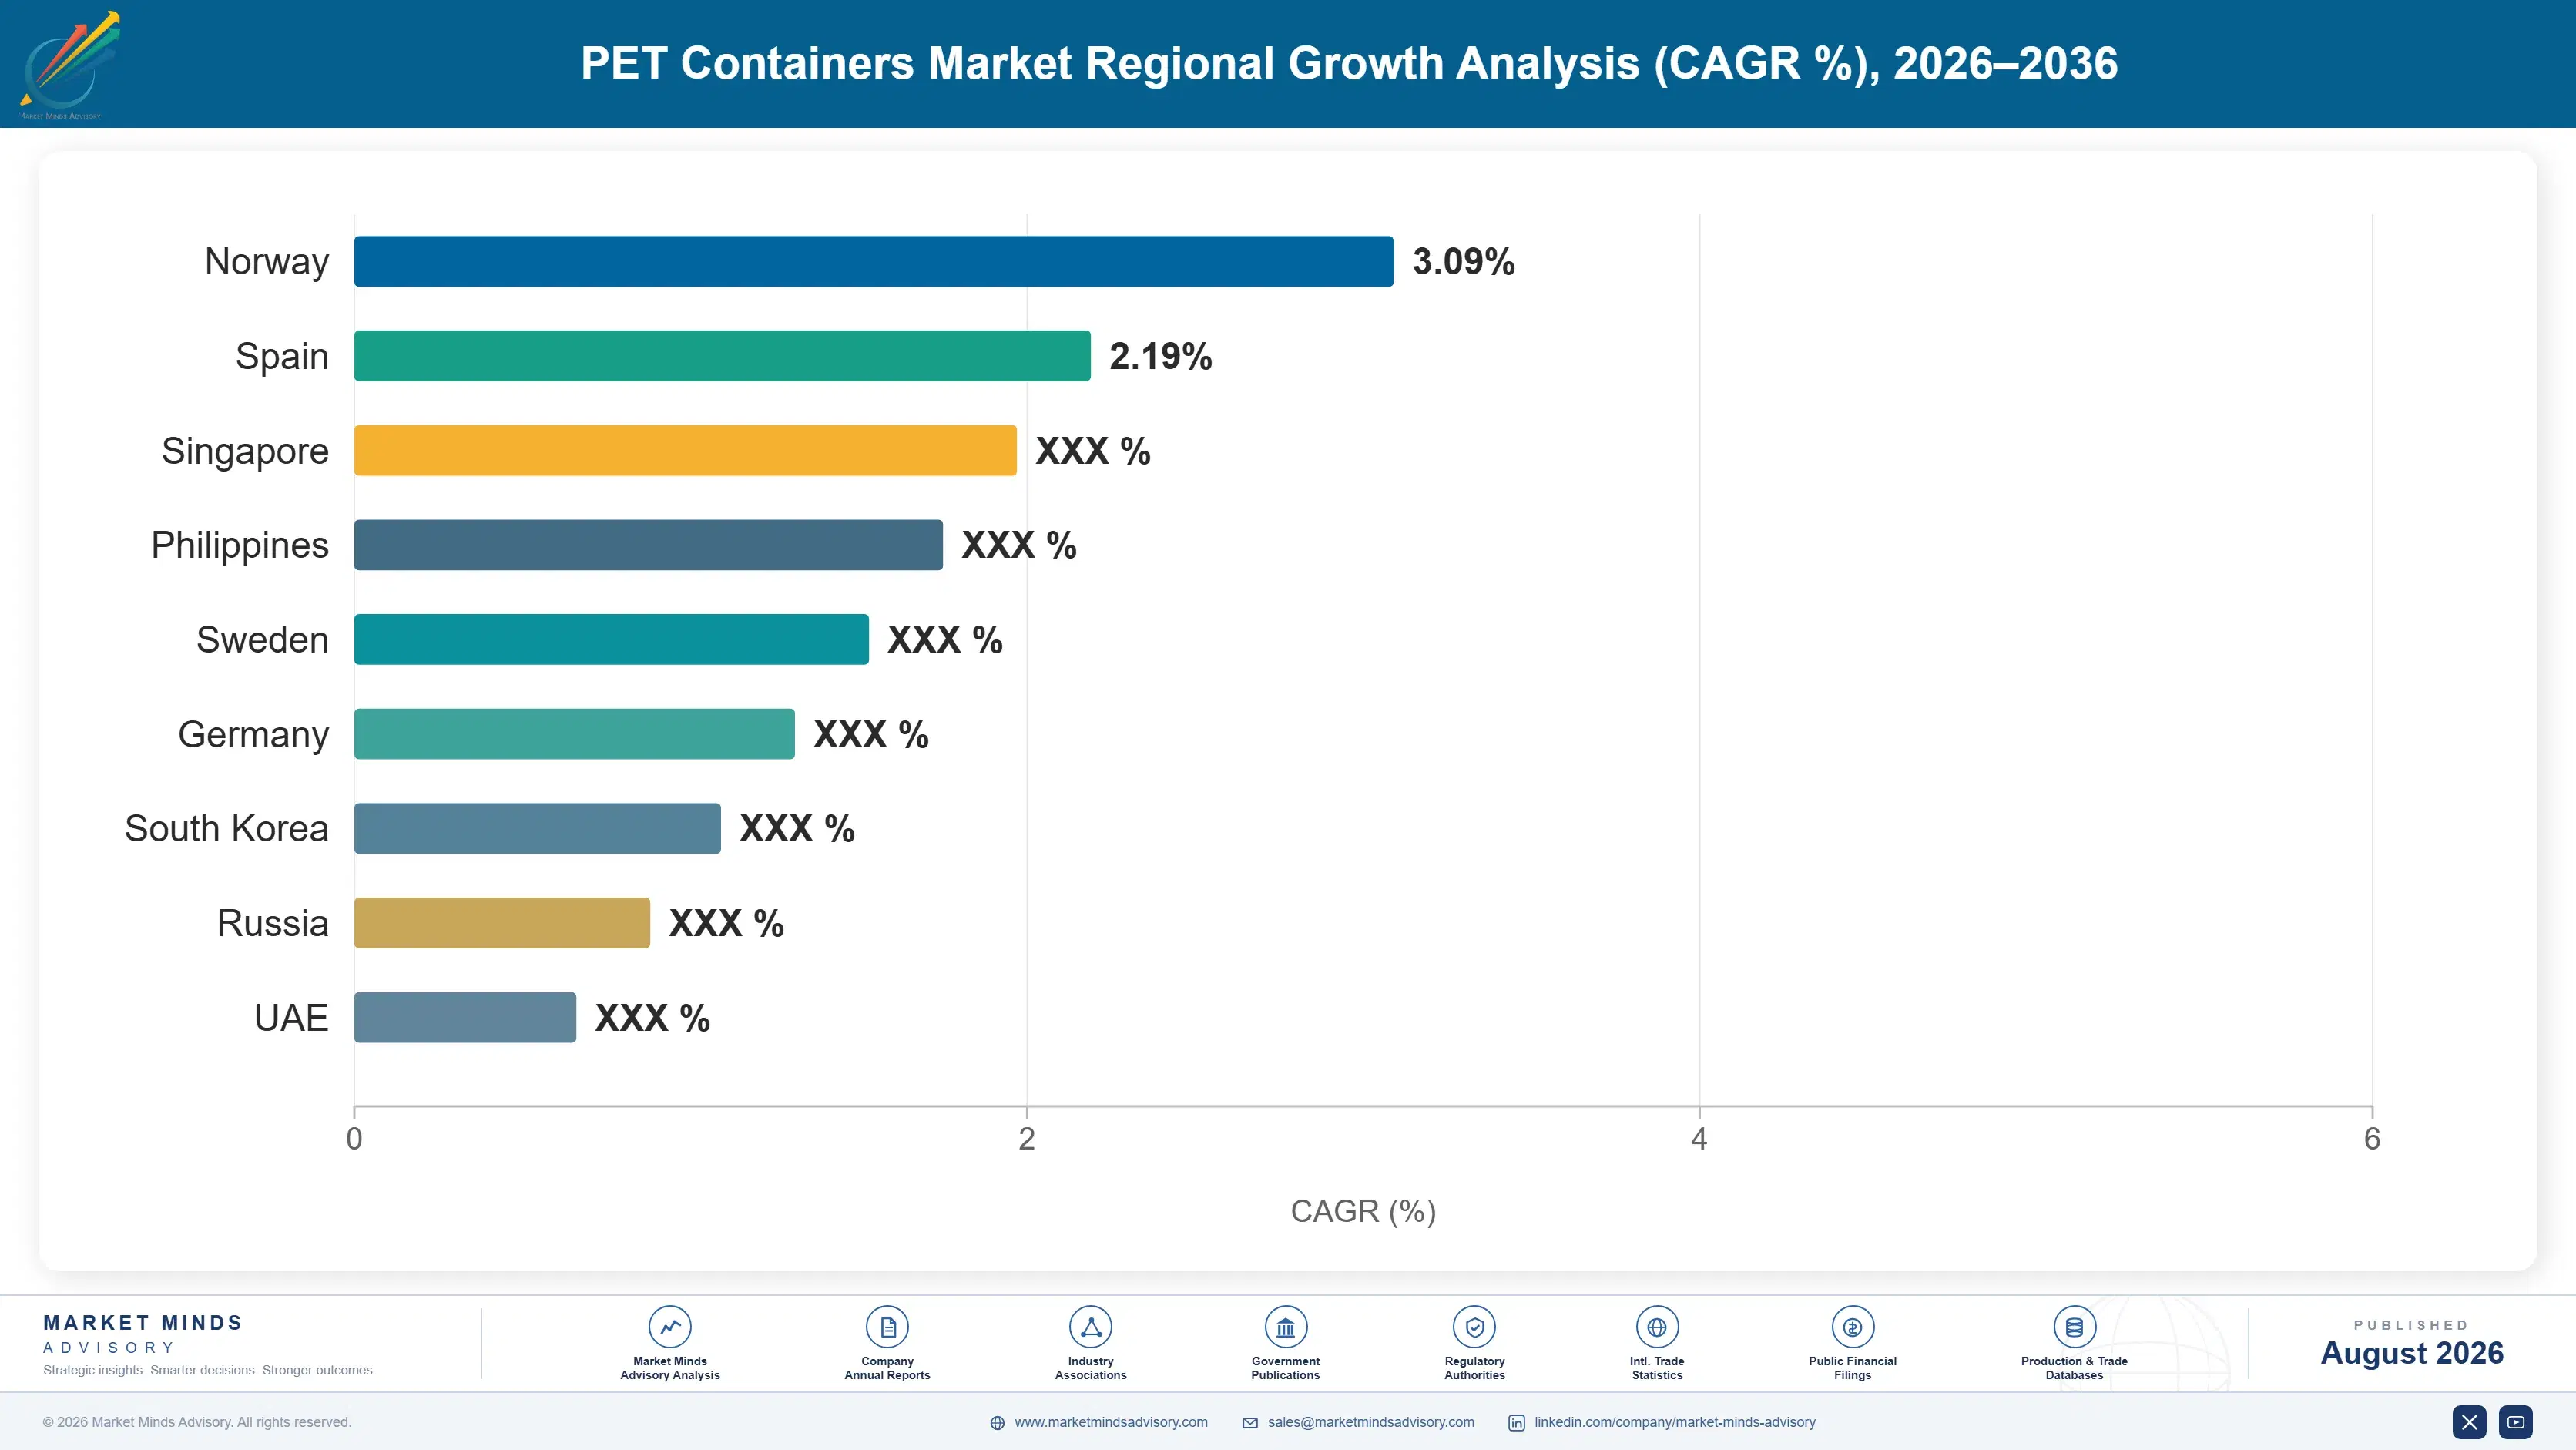
Per capita bottled water consumption across India, Indonesia, Nigeria and much of Sub-Saharan Africa remains a fraction of developed market levels, and it rises with urbanisation, disposable income and mistrust of municipal supply. That growth arrives as unit volume rather than as value per container, since these markets buy the lightest, cheapest formats available. India compounds at 7.2%, ahead of every other national market, and regional converters have added blowing capacity alongside the bottling plants rather than shipping finished containers any meaningful distance. Value per container is the lowest anywhere.
Market Impact: Reuse targets covering 20% of bever

Deposit Return Schemes Secure Bottle-to-Bottle Feedstock

Where deposit return operates properly, collection rates reach around 92% and the recovered material is clean enough for food-grade recycling rather than downcycling into fibre. Germany, the Nordics and several Canadian provinces demonstrate that, and schemes are being introduced across additional European Union member states, the United Kingdom and parts of Australia. Each scheme launch converts a diffuse waste stream into a contractable feedstock supply, which is precisely what converters facing recycled content mandates need in order to plan capacity. A scheme launch changes the feedstock arithmetic in a market within about eighteen months of commencing operation.
Market Impact: Weight down 31% since 2000

Market Restraints and Challenges

Reuse and Refill Mandates Threaten Single-Use Volume Directly

The European Packaging and Packaging Waste Regulation sets binding reuse targets for certain beverage categories, and several member states have gone further. The root cause is a policy judgement that recycling alone will not meet waste reduction goals, which puts single-use formats under pressure regardless of their recycled content. Refillable PET and glass both benefit. Converters mitigate by developing refillable PET designs that survive multiple wash and fill cycles, a technically demanding specification, and by concentrating on categories the reuse targets do not reach. Neither response addresses the policy direction itself.
Market Impact: Recycled resin priced 18% above vir

Lightweighting Erodes Value Per Container Continuously

Container weight has fallen 31% since 2000 on standard water formats, and design work continues. The root cause is that resin represents 62% of conversion cost, so every gram removed goes almost entirely to the customer's benefit and the converter's revenue line. Unit growth therefore overstates value growth persistently. Converters mitigate by shifting mix toward hot-fill, aseptic and personal care formats where performance requirements set a weight floor, and by pricing on conversion service rather than on delivered resin weight. Beverage formats are closer to their functional limits than personal care ones.
Market Impact: Aseptic and hot-fill compounding at
3 additional market trends, 4 additional growth drivers, and 2 additional restraints and challenges are covered in the full report. Contact sales@marketmindsadvisory.com to access the complete intelligence.

Segment CAGR and Growth Architecture

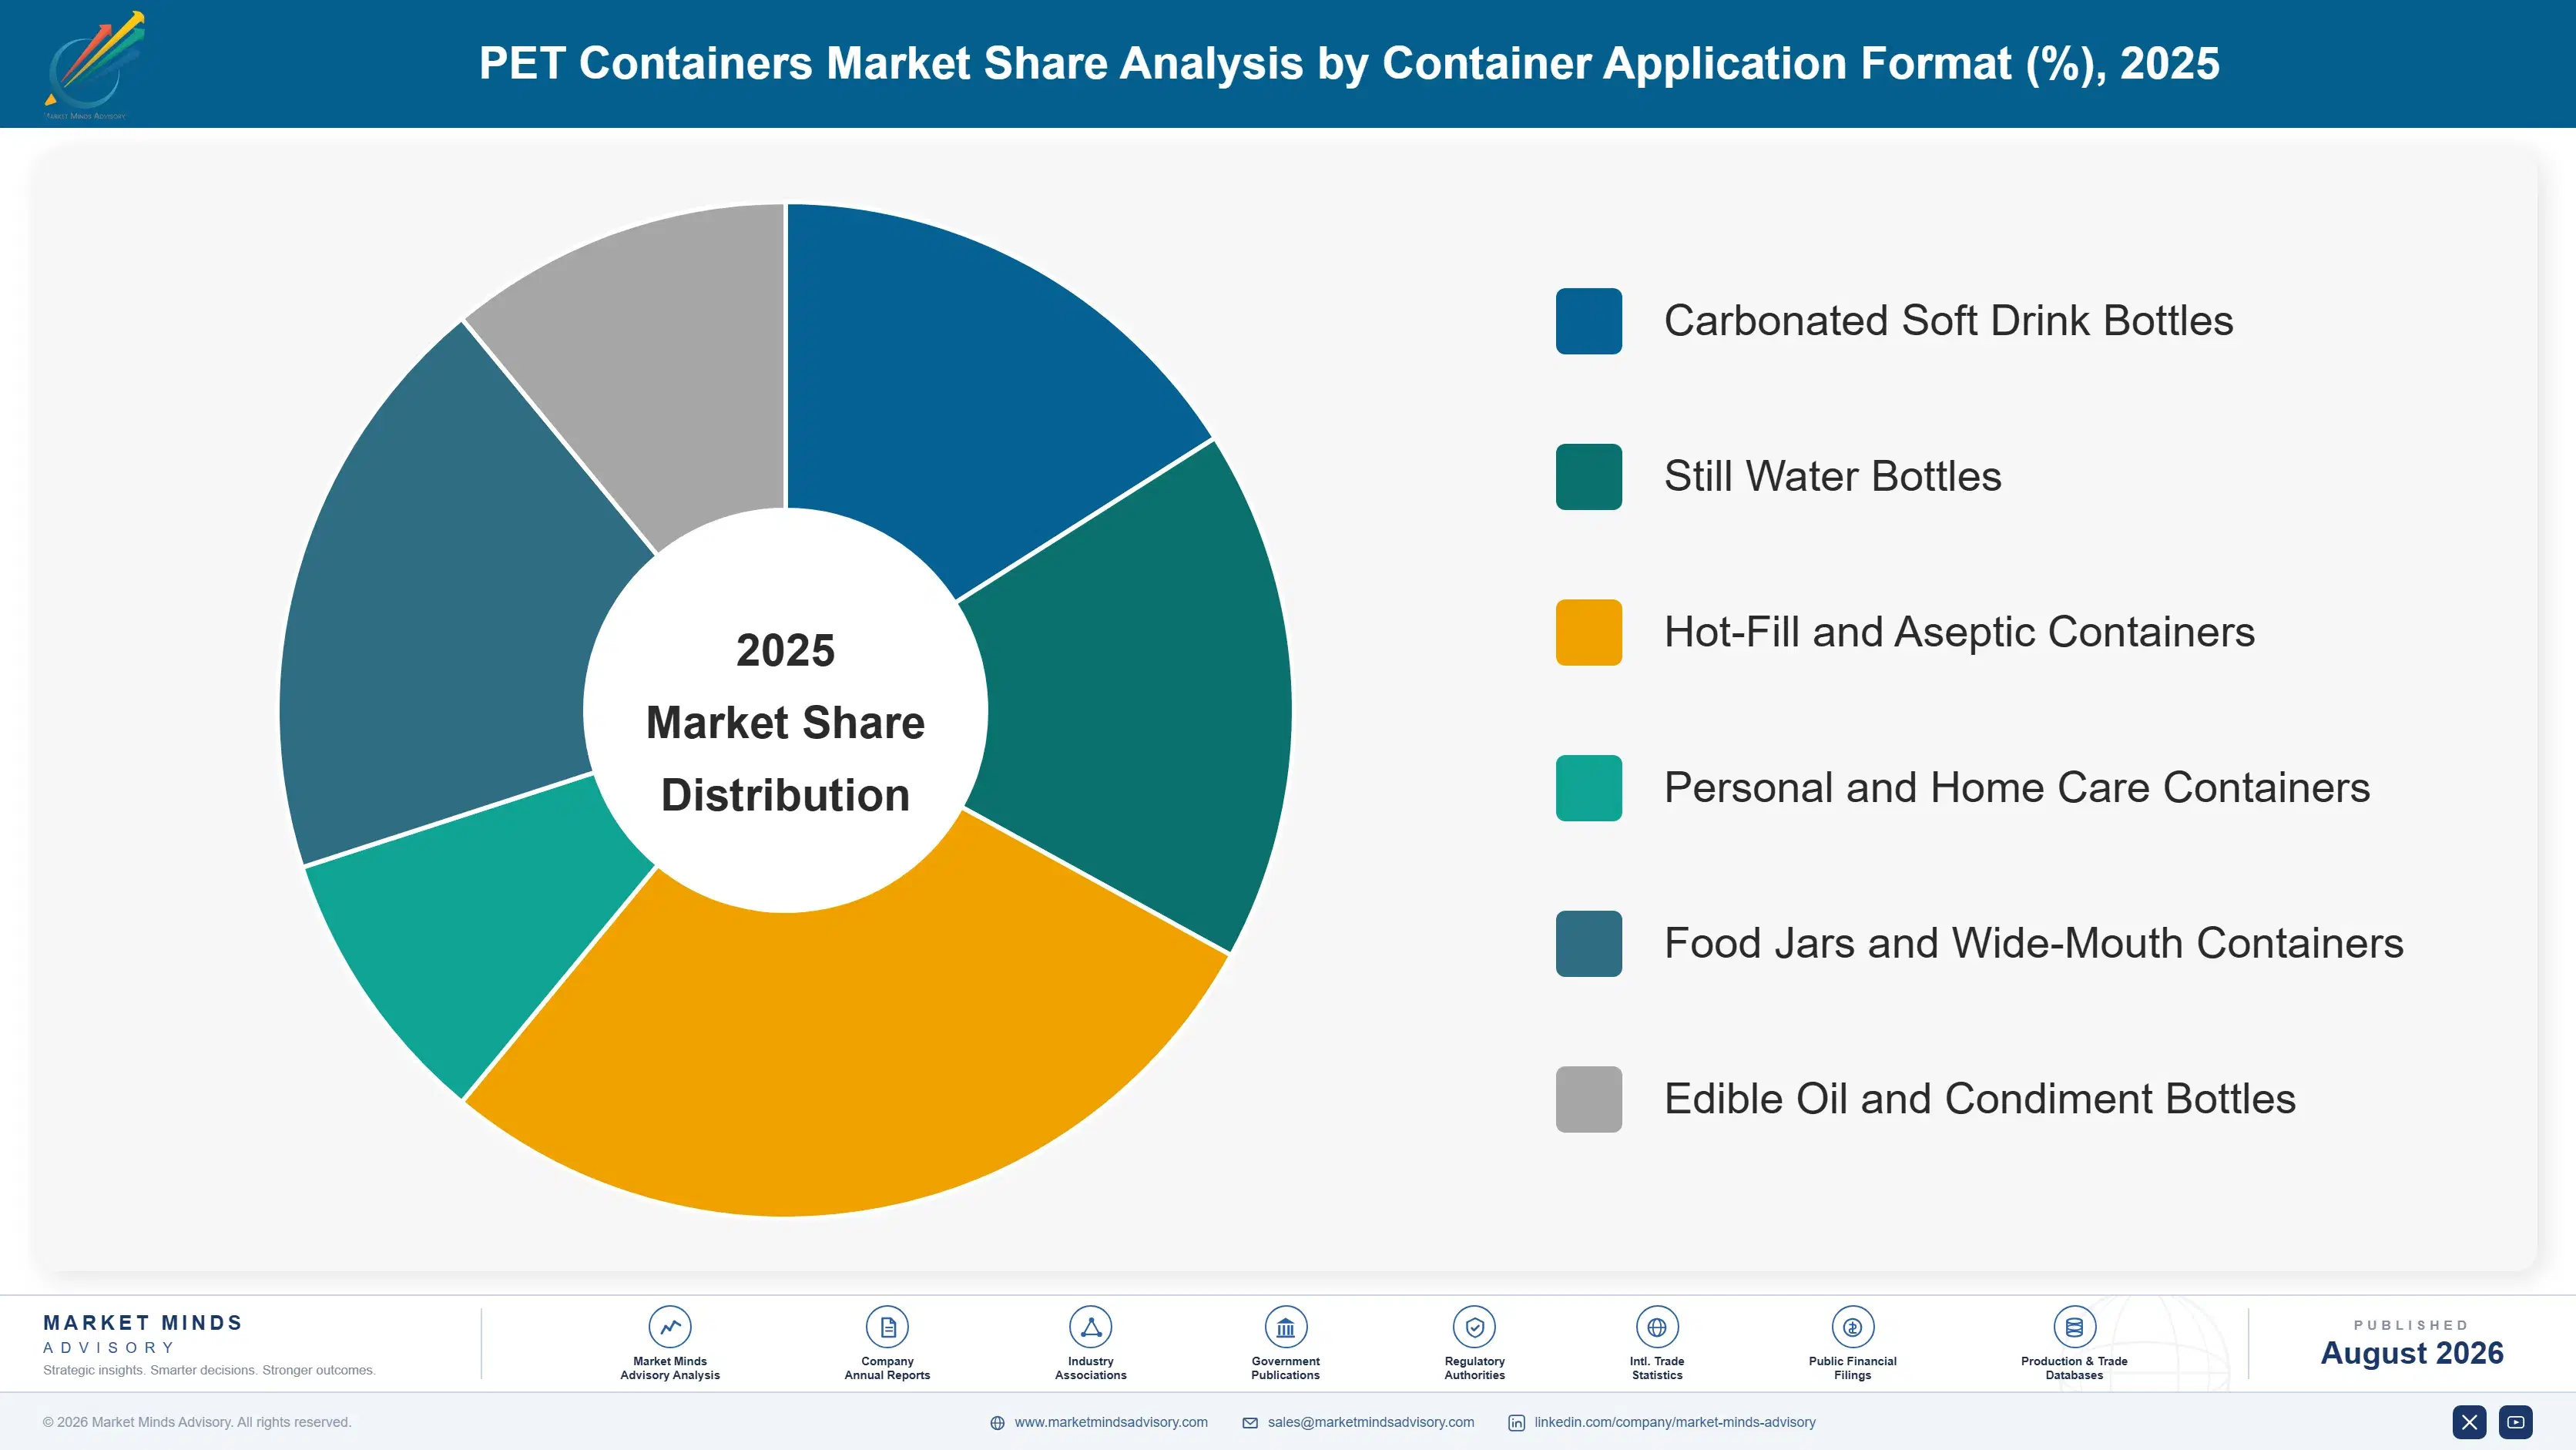
Segmentation follows container application format, because that determines the technical specification, the filling technology it must survive and the competitive alternative it displaces or defends against. A hot-fill juice bottle and a carbonated soft drink bottle share a polymer and almost nothing else in design, cost structure or customer decision process. Filling technology draws the line.
pet-containers-market-market-share-analysis-1787307270695

Hot-Fill and Aseptic Containers

Hot-fill and aseptic containers compound at 6.6%, exactly 1.50 times the market rate, by taking volume that glass and metal held on thermal and shelf-life grounds. Heat-set bottle design withstands filling at temperatures that would deform a standard container, while aseptic filling sterilises product and package separately and combines them in a controlled environment. Juice, ready-to-drink tea, dairy beverages, sauces and nutritional products have all moved. The container is lighter, cheaper to distribute and far less prone to breakage. Aseptic filling lines cost several times a conventional line, so conversion follows capital investment cycles rather than arriving continuously, and volume that switches rarely returns to its previous format. Glass rarely wins the volume back.
CAGR 6.6%

Personal and Home Care Containers

Personal and home care containers grow at 5.4%, well ahead of beverage formats, on quite different commercial logic. Shape, surface finish and decoration matter here in a way they never do for a water bottle, since the container is part of the product's shelf presentation rather than merely a vessel. That supports higher conversion margins and shorter production runs. Recycled content commitments from personal care brand owners have been aggressive, frequently exceeding regulatory requirements, which drives demand for food-grade recycled polymer even where food contact rules would not require it. Weight reduction pressure is far weaker than in beverages, because a container that feels flimsy undermines the product positioning it was designed to support.
CAGR 5.4%
Full segment breakdown across 6 segments available in the complete report.

Regional Architecture and Country Demand Map

Consumption follows beverage and packaged goods filling rather than population, and conversion follows consumption almost exactly, because blown containers cannot travel far economically. Preform trade moves between regions; finished container trade barely exists at all outside border markets. Filling capacity is therefore the map worth reading here.

East Asia

East Asia holds 29% of global consumption, the largest regional share, driven by Chinese beverage volume across bottled water, ready-to-drink tea and functional drinks. Chinese conversion capacity is extensive and highly fragmented, with hundreds of regional blowers operating close to filling plants. Ready-to-drink tea in particular has favoured hot-fill and aseptic formats, making China the largest single market for that technology. Japanese demand is smaller and technically demanding, with lightweighting taken further than anywhere else and aseptic filling near-universal for teas and coffees. Korean volumes are modest. Recycled content requirements are tightening across the region but from a later start than Europe, so the recycled polymer premium is less pronounced. Growth of 5.2% tracks beverage consumption closely.
Share: 29% | CAGR: 5.2% (2026 to 2036)

South Asia and Pacific

Growing fastest of the seven regions at 6.4%, with India compounding at 7.2%, South Asia and Pacific takes 12% of global consumption. Indian bottled water penetration remains far below developed market levels and rises steadily with urbanisation and distrust of municipal supply, arriving as high unit volume in the lightest available formats. Indonesian and Vietnamese demand follows a similar pattern. Australian consumption resembles Western Europe, with deposit return schemes now operating across most states and delivering clean bottle-to-bottle feedstock. Converter capacity has been built alongside bottling plants throughout the region, since finished containers cannot be shipped economically. Value per container is the lowest of any region, which keeps the revenue share well below the unit share.
Share: 12% | CAGR: 6.4% (2026 to 2036)
Regional intelligence for 5 additional markets available in the complete report: North America, Western Europe, Latin America, Middle East and Africa, Eastern Europe. Contact sales@marketmindsadvisory.com.
pet-containers-market-country-cagr-analysis-1787307271223

Where Conversion Margin Survives Resin Pass-Through

Resin is 62% of cost and moves with oil and polymer markets outside anyone's control, so most of what looks like revenue in this business is pass-through. The margin that matters sits in feedstock access, physical position beside the filler, and formats where performance rather than price sets the specification. Conversion price is rarely the differentiator.

Contract Food-Grade Recycled Feedstock Ahead of Mandates

Recycled PET trades roughly 18% above virgin in Europe because mandates arrived before collection infrastructure did. Converters holding contracted bottle-to-bottle supply, whether through owned recycling capacity or long-term agreements with deposit scheme operators, quote recycled content at a cost their spot-buying competitors cannot match. As the 2030 threshold approaches that gap widens rather than closes. Securing feedstock is a capital and contracting exercise rather than a technical one, and the converters that moved early on it are now winning brand owner tenders on availability rather than on conversion price. The window is closing quickly.
Market Impact: Feedstock access worth a full 18% r

Take On-Site and Wall-to-Wall Conversion Positions

Roughly 37% of volume is blown inside or beside the filling facility, and those arrangements run on multi-year agreements that are close to impossible to displace once installed. The converter supplies equipment, operators and containers directly onto the filling line, eliminating finished container freight entirely. Capital sits with the converter, which deters competitors, and the relationship survives procurement cycles that would otherwise retender the business annually. Gross margins run 6 to 11 points above conventional supply, and the position holds for the life of the filling plant rather than the life of a contract.
Market Impact: On-site positions worth 6 to 11 mar

Build Aseptic and Hot-Fill Technical Capability

Hot-fill and aseptic containers compound at 6.6% by taking juice, tea and dairy volume from glass and metal permanently. Heat-set moulding and aseptic-compatible container design require process capability and validation experience that standard blowing operations do not hold. Because filling line investment is substantial, the customer selects a container partner at the capital decision and rarely revisits it afterwards. Conversion margins in these formats run 8 to 14 points above commodity water bottles, and the technical barrier keeps the quoting field considerably narrower than in any beverage format. Displacement afterwards is rare.
Market Impact: Technical formats carrying 8 to 14

Weight Mix Toward Decorated Personal Care Formats

Personal and home care containers grow at 5.4% and behave commercially unlike beverage packaging. Shape, surface finish and decoration form part of the product's shelf presentation, so specification is driven by brand design rather than by delivered cost per gram. Run lengths are shorter, changeovers more frequent and lightweighting pressure far weaker, since a flimsy container undermines the positioning it was meant to support. Conversion margins run roughly 10 to 16 points above beverage work. The requirement is tooling flexibility and decoration capability rather than the raw throughput that beverage conversion rewards.
Market Impact: Personal care margins 10 to 16 poin

Who Controls the Margin Pool

The top five converters hold 24% of the market measured on container conversion revenue, a basis applied consistently through this section. Fragmentation is extreme for a category this large, and freight geometry explains it. Blown containers cannot travel economically, so a converter beside a filling plant cannot be undercut from a distance regardless of its cost position. Geometry rather than commercial skill sets the market structure.
Competition operates on three dimensions. Physical proximity to filling capacity, including on-site and wall-to-wall arrangements covering 37% of volume, determines who can serve an account at all. Contracted food-grade recycled feedstock determines who can quote mandated recycled content without paying spot premiums. And technical capability in heat-set and aseptic formats determines participation in the fastest-growing beverage categories. All three are physical or contractual advantages rather than commercial ones.

Two pressures are reshaping position. Brand owners with recycled content commitments are contracting directly with recyclers, bypassing converters in the feedstock chain entirely. Separately, resin producers including Indorama Ventures have integrated forward into preform and container conversion. Rankings will move toward whoever pairs secured recycled feedstock with on-site conversion positions inside major filling operations. Very few converters hold both positions today.
pet-containers-market-company-positioning-matrix-1787307271752

Competitive Moat and Risk Dimensions

AMCOR

Moat: Global reach and technical depth

Amcor combines conversion capacity across most major regions with genuine development capability in heat-set, aseptic and barrier container design. That lets the company serve multinational beverage and personal care customers with a consistent specification across markets, which matters where a brand owner wants one container design filled on four continents rather than four separate local solutions.
AMCOR

Risk: Exposure to reuse regulation

European reuse and refill targets under the Packaging and Packaging Waste Regulation threaten single-use beverage volume directly, and Amcor's exposure to that category is meaningful. Refillable PET development helps but the specification is technically demanding, and volume moving to refillable glass or on-site dispensing does not return. Regulatory direction rather than competitive pressure is the principal risk to this position.
ALPLA GROUP

Moat: On-site conversion infrastructure

ALPLA has built its position around in-house and wall-to-wall plants operating inside customer filling facilities, which eliminates finished container freight and embeds the company in the customer's operations. Those arrangements survive procurement cycles that would retender conventional supply, and the capital commitment involved deters competitors from attempting displacement once a plant is installed.
ALPLA GROUP

Risk: Capital intensity of embedded plants

On-site plants tie substantial capital to individual customer facilities, and that capital cannot be redeployed if a filling site closes or a category declines. Reuse mandates, category shifts and customer consolidation all create stranded asset exposure that a conventional converter supplying multiple accounts from one plant does not carry to the same degree.

Players Tracked

Prominent Players

Amcor
ALPLA Group
Plastipak Holdings
Indorama Ventures
Retal Industries

Other Key Players

Berry Global
Graham Packaging
Pretium Packaging
Alpha Packaging
Resilux
Zhuhai Zhongfu Enterprise
Serioplast
Logoplaste
Taiwan Hon Chuan Enterprise
Greiner Packaging
Ring Container Technologies
Esterform Packaging
Nampak
PDG Plastiques
Gerresheimer

Recent Developments

JANUARY 2025

European recycled content threshold takes effect across beverage bottles

The 25% recycled content requirement for PET beverage bottles became applicable across European Union member states, tightening an already short food-grade recycled polymer market. This was a regulatory threshold rather than any commercial development, and it widened the price gap between recycled and virgin resin further.
Signal: Mandated demand for a material whose suppl
MAY 2025

Additional deposit return schemes launch across Central Europe

Deposit return schemes commenced operation in further European Union member states, converting diffuse post-consumer collection into contractable bottle-to-bottle feedstock supply. These were regulatory scheme launches rather than corporate transactions, and they materially improve food-grade recycled availability in those markets. Availability should improve materially within two years.
Signal: Collection infrastructure is finally being
SEPTEMBER 2025

Brand owners contract recycled feedstock directly with recyclers

Several multinational beverage and personal care brand owners signed multi-year offtake agreements with food-grade recycling operators, securing recycled polymer supply ahead of the 2030 threshold. These were supply agreements rather than acquisitions or joint ventures, and they bypass converters in the feedstock chain. Converters lose that capture entirely.
Signal: Feedstock security is moving up the chain

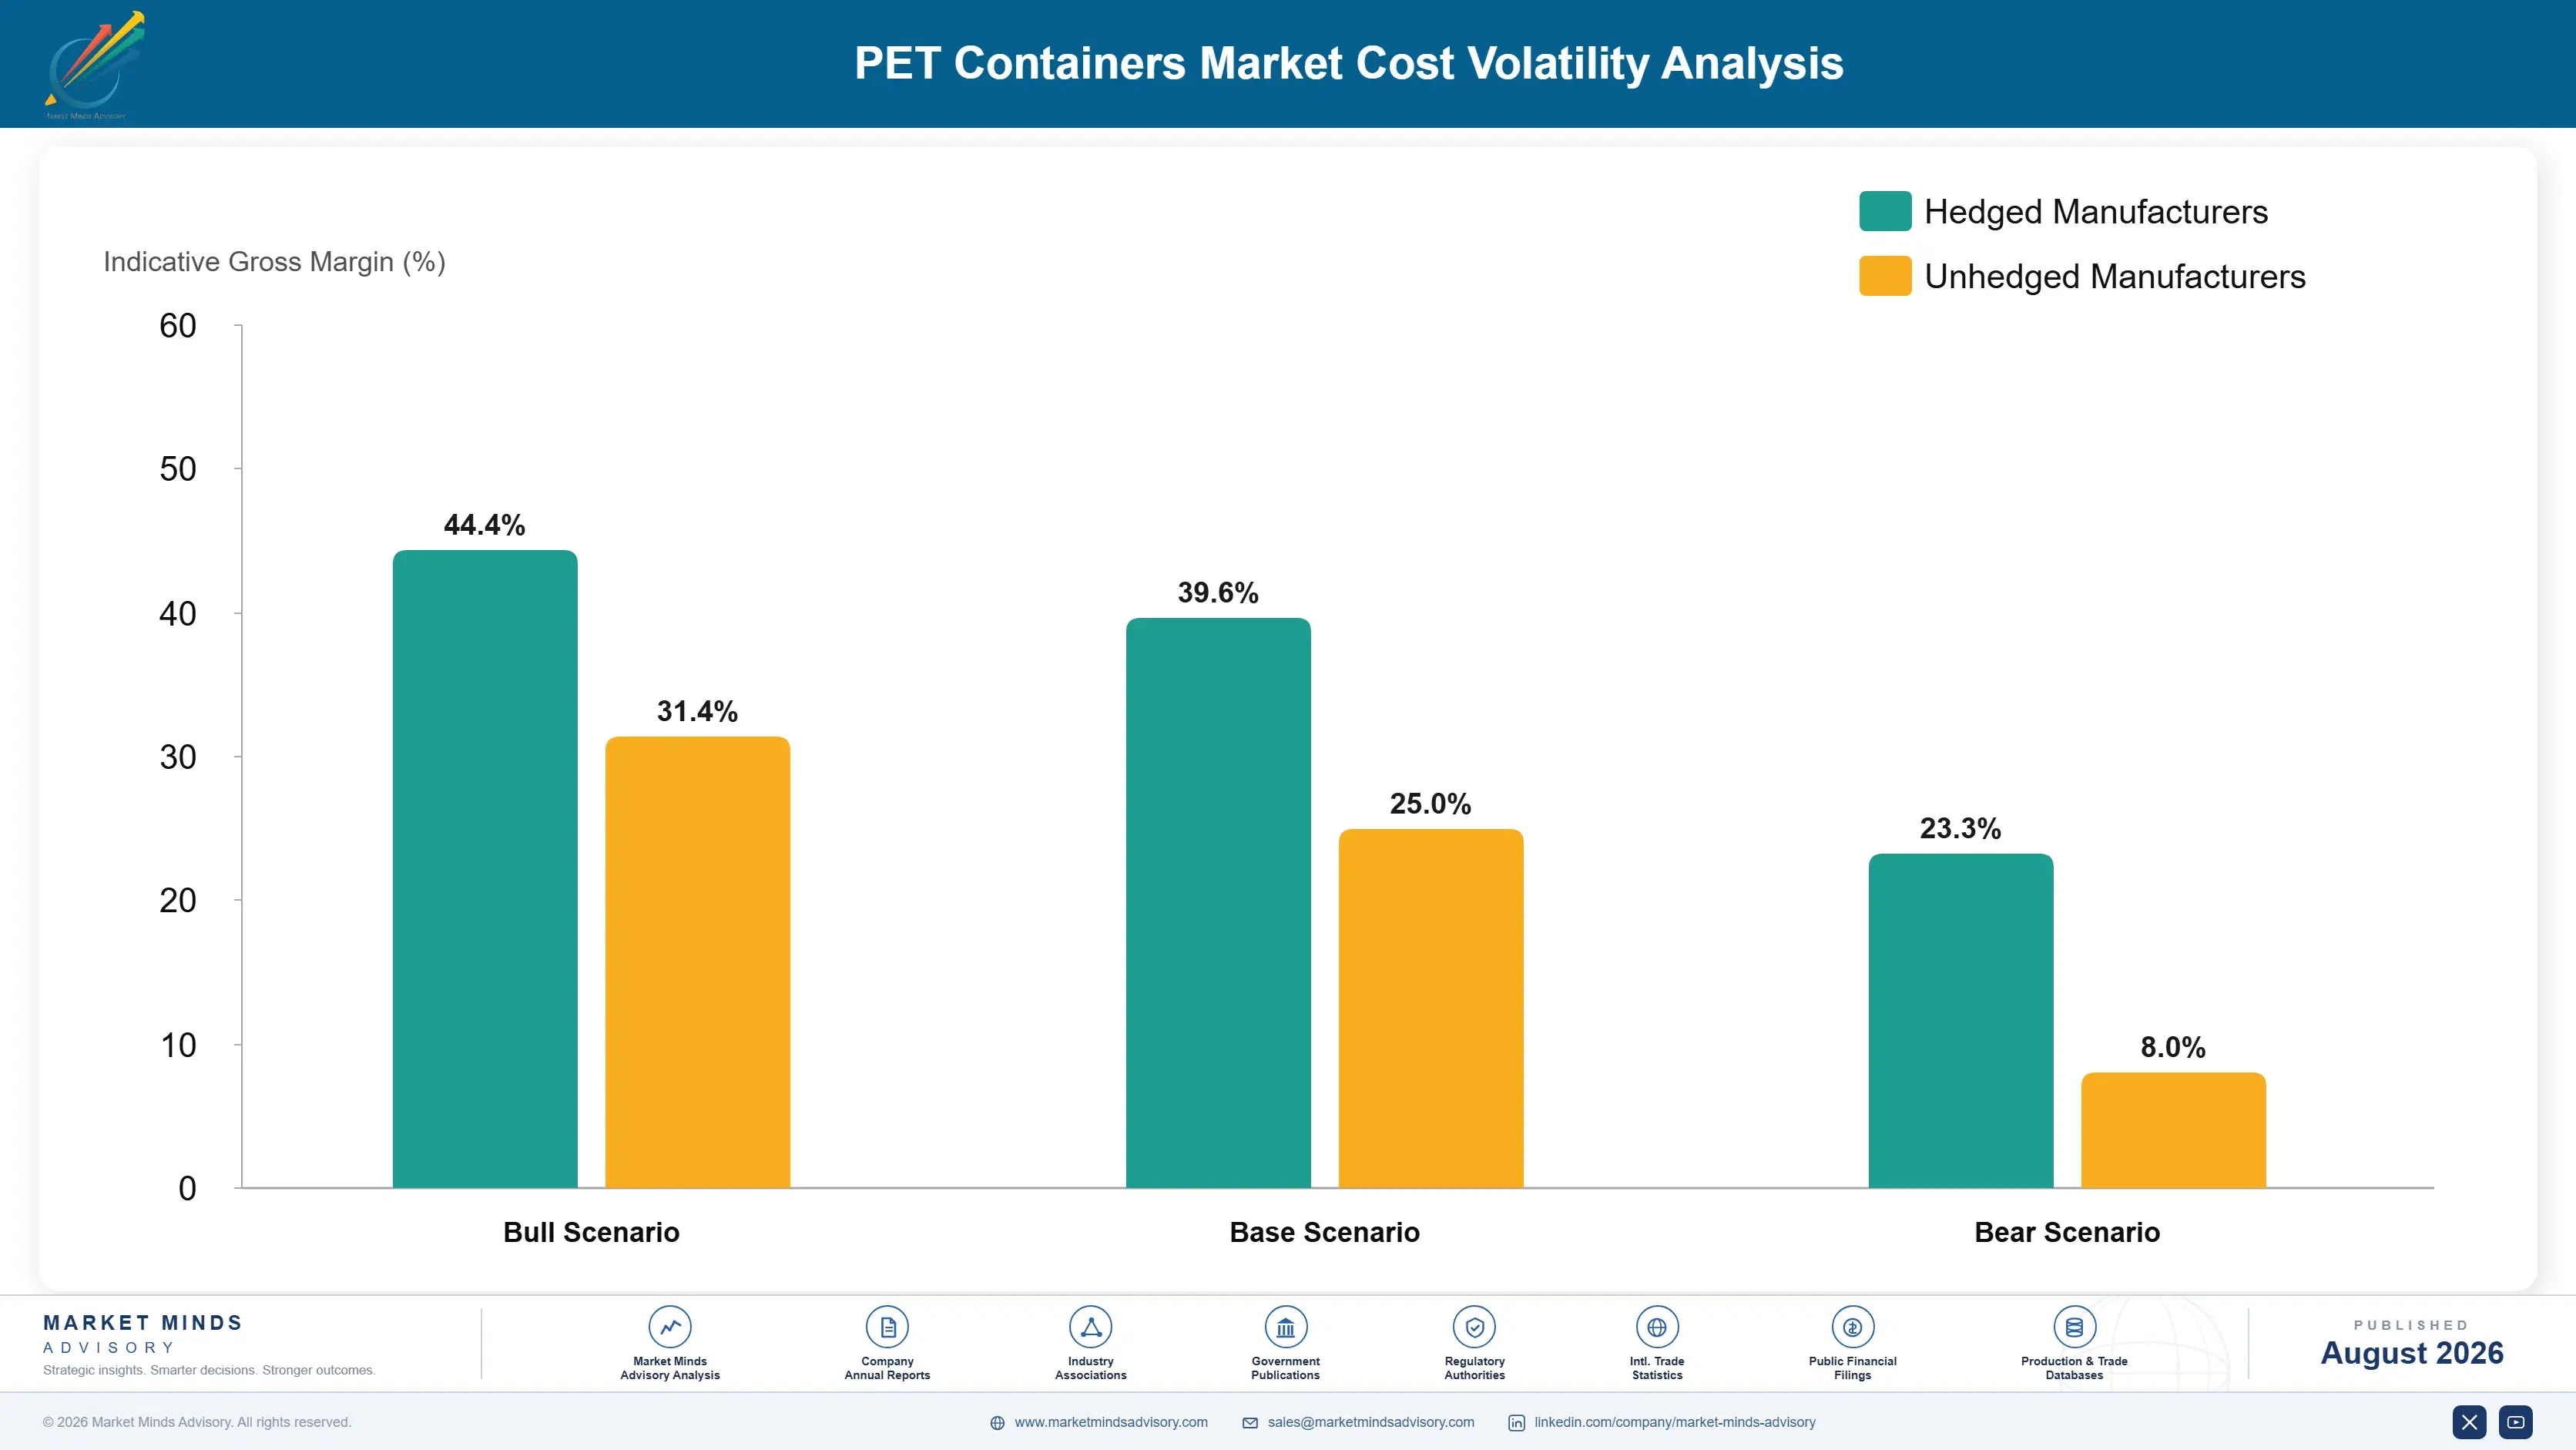
Resin Dominates Everything Else

Polymer accounts for roughly 62% of cost of goods, which leaves very little room for anything else to matter. Virgin PET resin sources from petrochemical producers across the Gulf, East Asia and North America, while food-grade recycled polymer comes from a far smaller and geographically constrained recycling base. Energy for blowing and drying runs around 11%, with labour, tooling and freight making up the remainder.
European natural gas disruption from 2022 raised both petrochemical feedstock and conversion energy costs simultaneously, and International Energy Agency reporting through that period documents the underlying movement. Virgin PET pricing rose sharply and recycled polymer followed it upward rather than providing relief, because mandate-driven demand had already tightened that market independently. Company annual reports covering rigid packaging segments disclose the resulting margin compression across several quarters.

Exposure varies by contract structure rather than by scale. Converters operating on resin pass-through agreements move polymer cost to the customer within weeks and carry little exposure. Those quoting delivered container prices on annual terms absorb the movement entirely for a year at a time. The disadvantage falls hardest on mid-sized regional converters, who lack the volume to negotiate pass-through terms yet compete against larger converters that have them.
pet-containers-market-cost-volatility-analysis-1787307271948

Resin pass-through clauses indexed to published polymer benchmarks

Indexing container pricing to published virgin and recycled polymer benchmarks moves 62% of cost structure outside the converter's risk entirely. Large converters achieve this routinely; smaller ones often cannot. Where a customer resists indexing, shortening contract terms achieves much the same protection with less negotiating friction, though it reduces the visibility both sides value.

Owned or contracted food-grade recycling capacity

Recycled PET trading 18% above virgin turns feedstock access into a genuine cost advantage rather than a compliance obligation. Converters with owned washing and pelletising capacity, or long-term agreements with deposit scheme operators, insulate themselves from a spot market that tightens further as the 2030 threshold approaches. The capital requirement is considerable but the position is durable.

Continued lightweighting within performance and brand constraints

Every gram removed cuts 62% of the cost base proportionally, which is why design work has never stopped despite the revenue implications. The remaining headroom is smaller than it was, and beverage formats are closer to their functional limits than personal care ones. Where a customer shares the saving contractually, the exercise benefits both sides rather than only the buyer.

Portfolio Architecture for Margin Defence

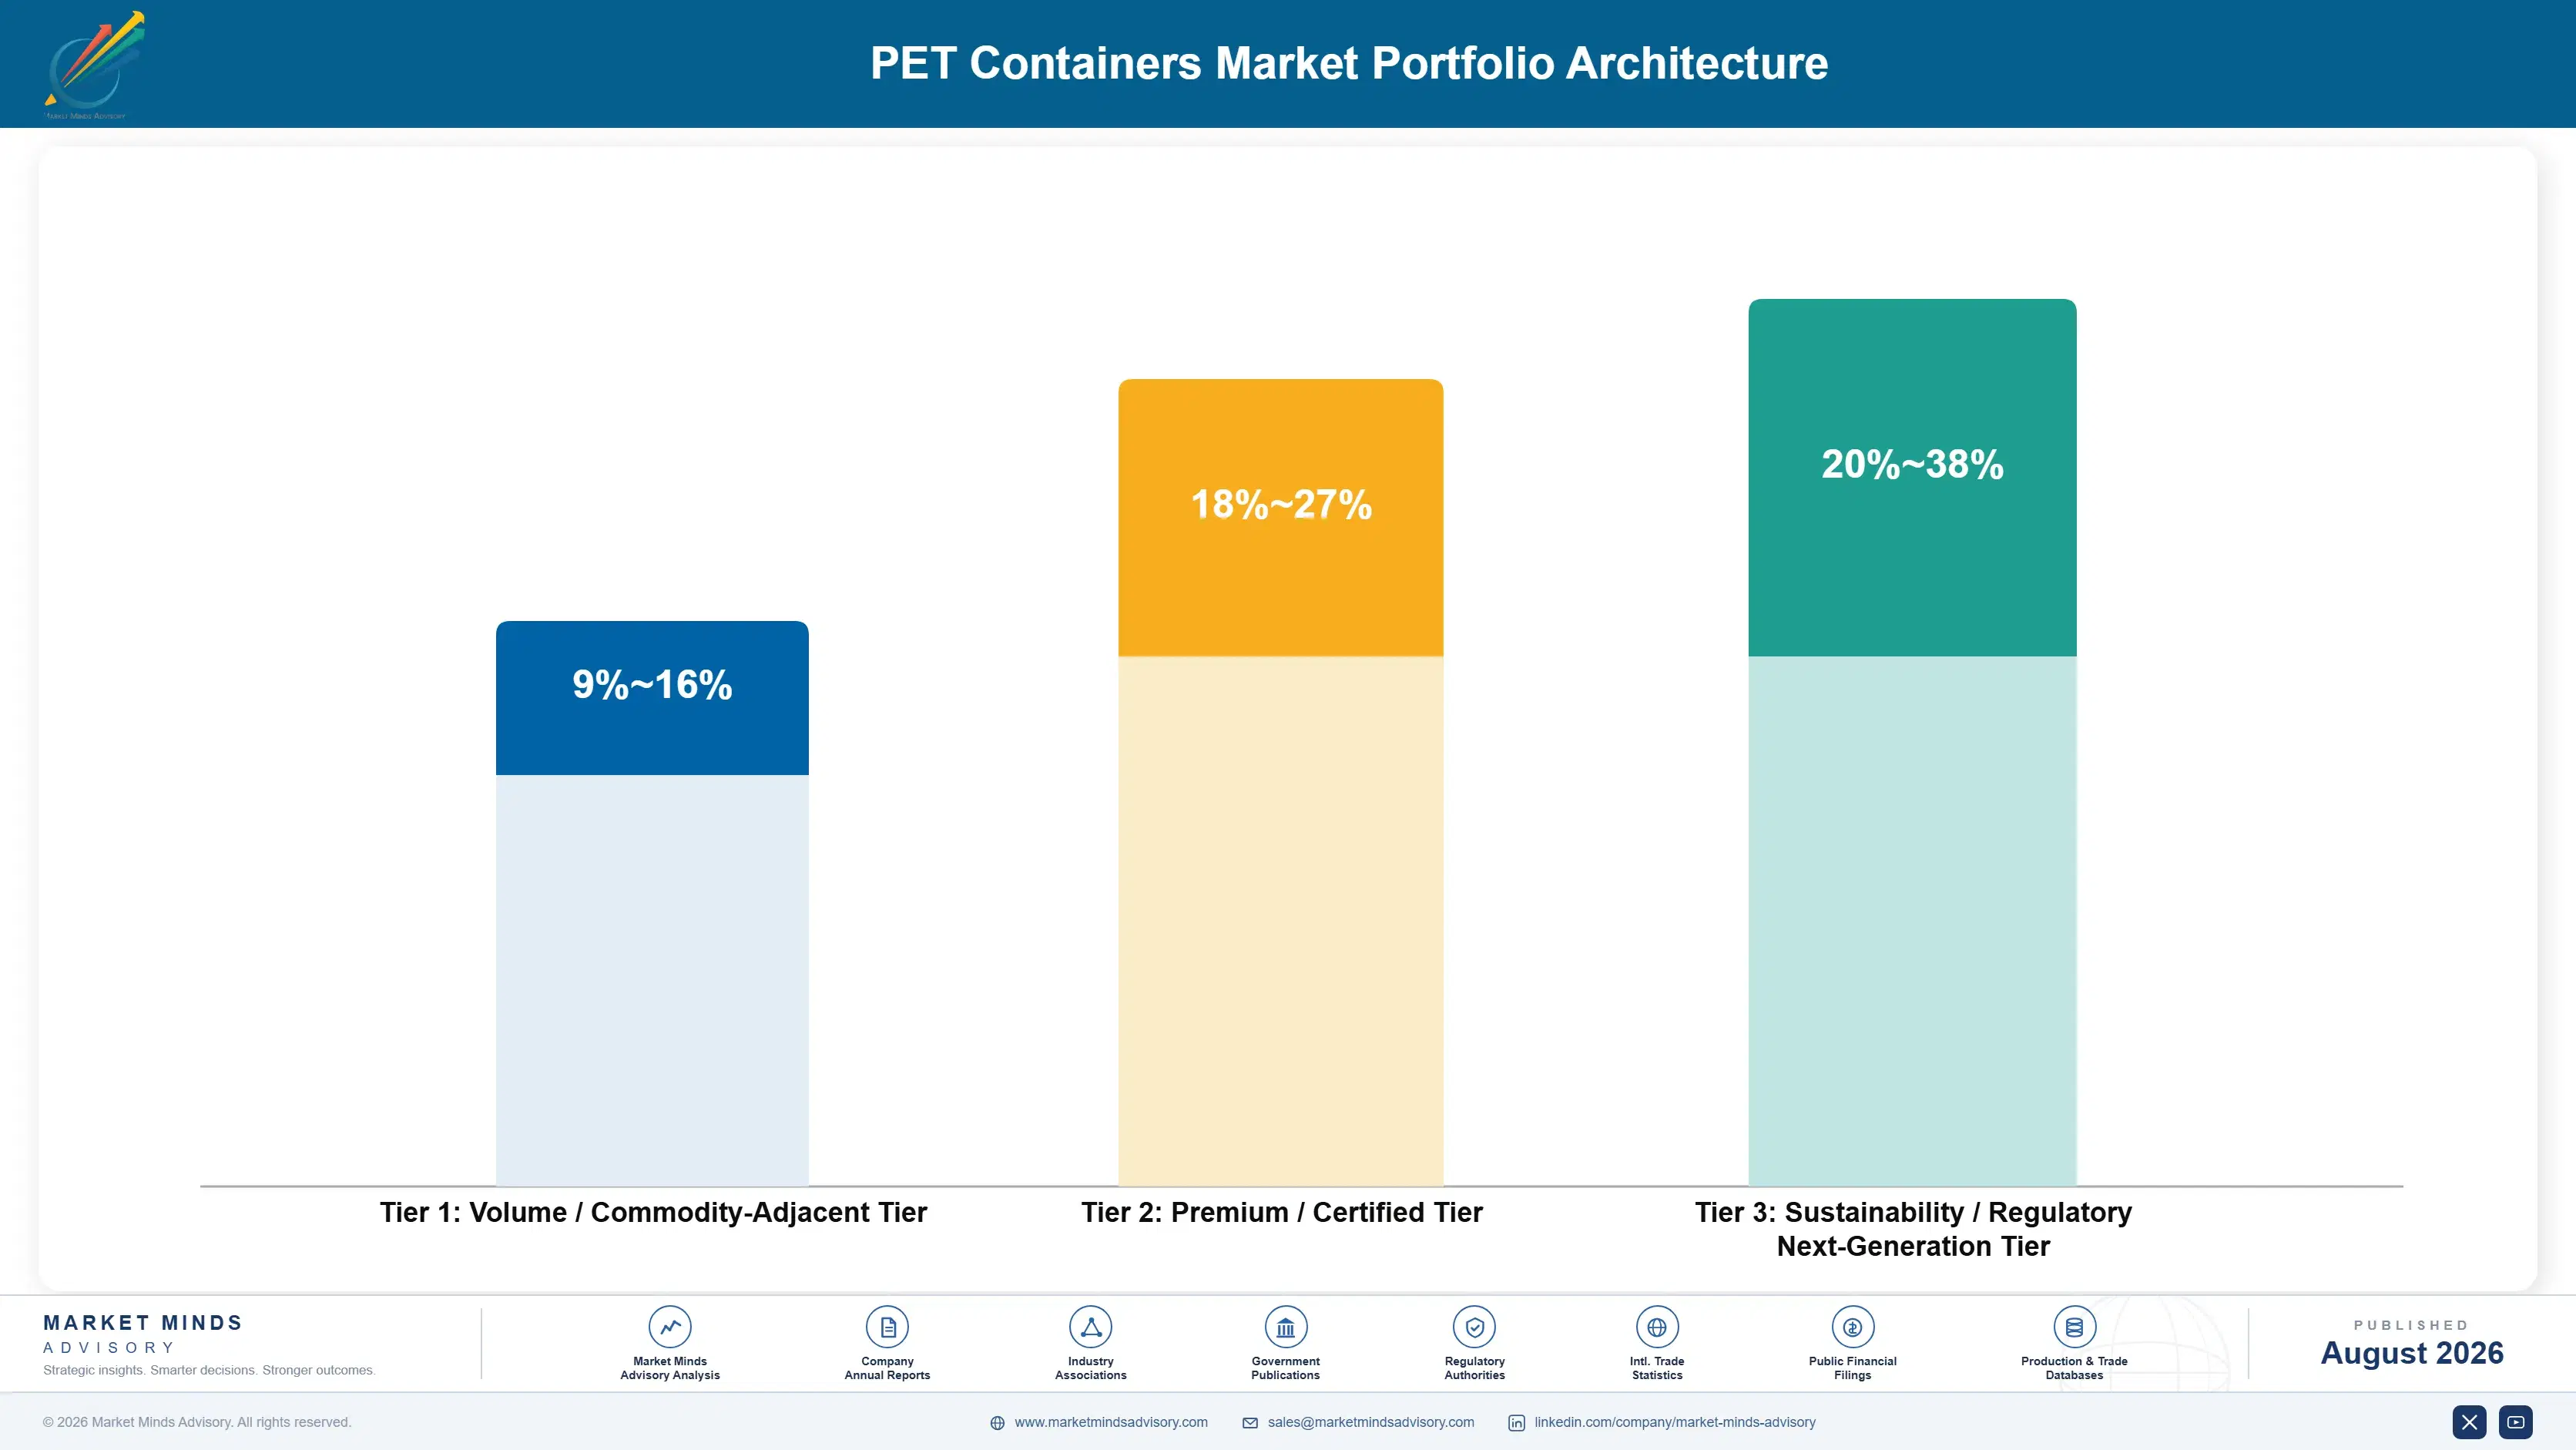
The portfolio separates on what sets the specification. Where delivered cost per container decides, as in water and carbonated soft drinks, conversion margins compress toward the minimum a blowing operation can sustain. Where thermal performance, barrier requirement or brand presentation decides, the buyer accepts a specification-led price. Hot-fill, aseptic and decorated personal care formats all sit in the second category. Specification authority draws the whole ladder.
The tension is that commodity beverage volume fills the blowing lines and justifies the on-site positions that make a converter difficult to displace. Abandoning it to chase specification-led margin gives up the physical proximity that underpins the whole business model. The successful converters run beverage volume for position and utilisation while building technical and decorated capability on top of it. Position and margin are separate objectives that have to be managed together.

High-value pools concentrate where a filling technology, a regulatory requirement or a brand design brief sets the container specification. Aseptic dairy and juice, barrier-enhanced formats and decorated personal care all qualify, and each is chosen at a capital or design decision rather than at annual procurement. Annual procurement never touches those decisions.

Volume / Commodity-Adjacent Tier

Water, carbonated soft drink and edible oil bottles competing on delivered cost per container. Lightweighting pressure is continuous, resin pass-through determines whether the converter carries polymer risk, and physical proximity to the filler decides who can compete at all.
Gross Margin: 9-16%

Premium / Certified Tier

Hot-fill, aseptic and barrier-enhanced containers requiring heat-set moulding, validated process capability and container designs qualified against specific filling technologies. Selection happens at the customer's capital investment decision rather than at annual procurement review.
Gross Margin: 18-27%

Sustainability / Regulatory / Next-Generation Tier

High recycled content formats, refillable PET designs and decorated personal care containers. The wide margin range reflects the gap between feedstock-constrained recycled beverage work and design-led decorated packaging with entirely different economics.
Gross Margin: 20-38%
pet-containers-market-portfolio-architecture-1787307272451

High-value Sub-segments and Strategic Watch-out

Aseptic Dairy and Beverage Containers

Compounding at 6.6% by taking volume from glass and metal that rarely returns to its previous format. Container partner selection happens at the filling line capital decision, and heat-set and aseptic validation experience keeps the quoting field far narrower than in any other beverage format.
Gross Margin: 20-27%

Decorated Personal Care Containers

Growing at 5.4% on specification driven by brand design rather than delivered cost per gram. Lightweighting pressure is weak because a flimsy container undermines the positioning, and conversion margins run roughly 10 to 16 points above equivalent beverage work. Tooling flexibility rather than throughput is what wins the work.
Gross Margin: 26-38%

Water and Carbonated Beverage Bottles

The volume core at 3.2 to 4.2%, competing on delivered cost per container with weight down 31% since 2000. Run for blowing line utilisation and to hold the on-site positions that make a converter genuinely difficult to displace afterwards. Margin has to come from elsewhere entirely.
Gross Margin: 9-16%

High Recycled Content Beverage Formats

The watch-out. Mandates require the content but food-grade feedstock trades 18% above virgin, so the tier can carry negative margin without contracted supply. Converters with owned recycling capacity profit from exactly the same requirement that damages competitors. The same rule creates winners and losers simultaneously.
Gross Margin: 6-28%

Contracts Built Around Physical Position

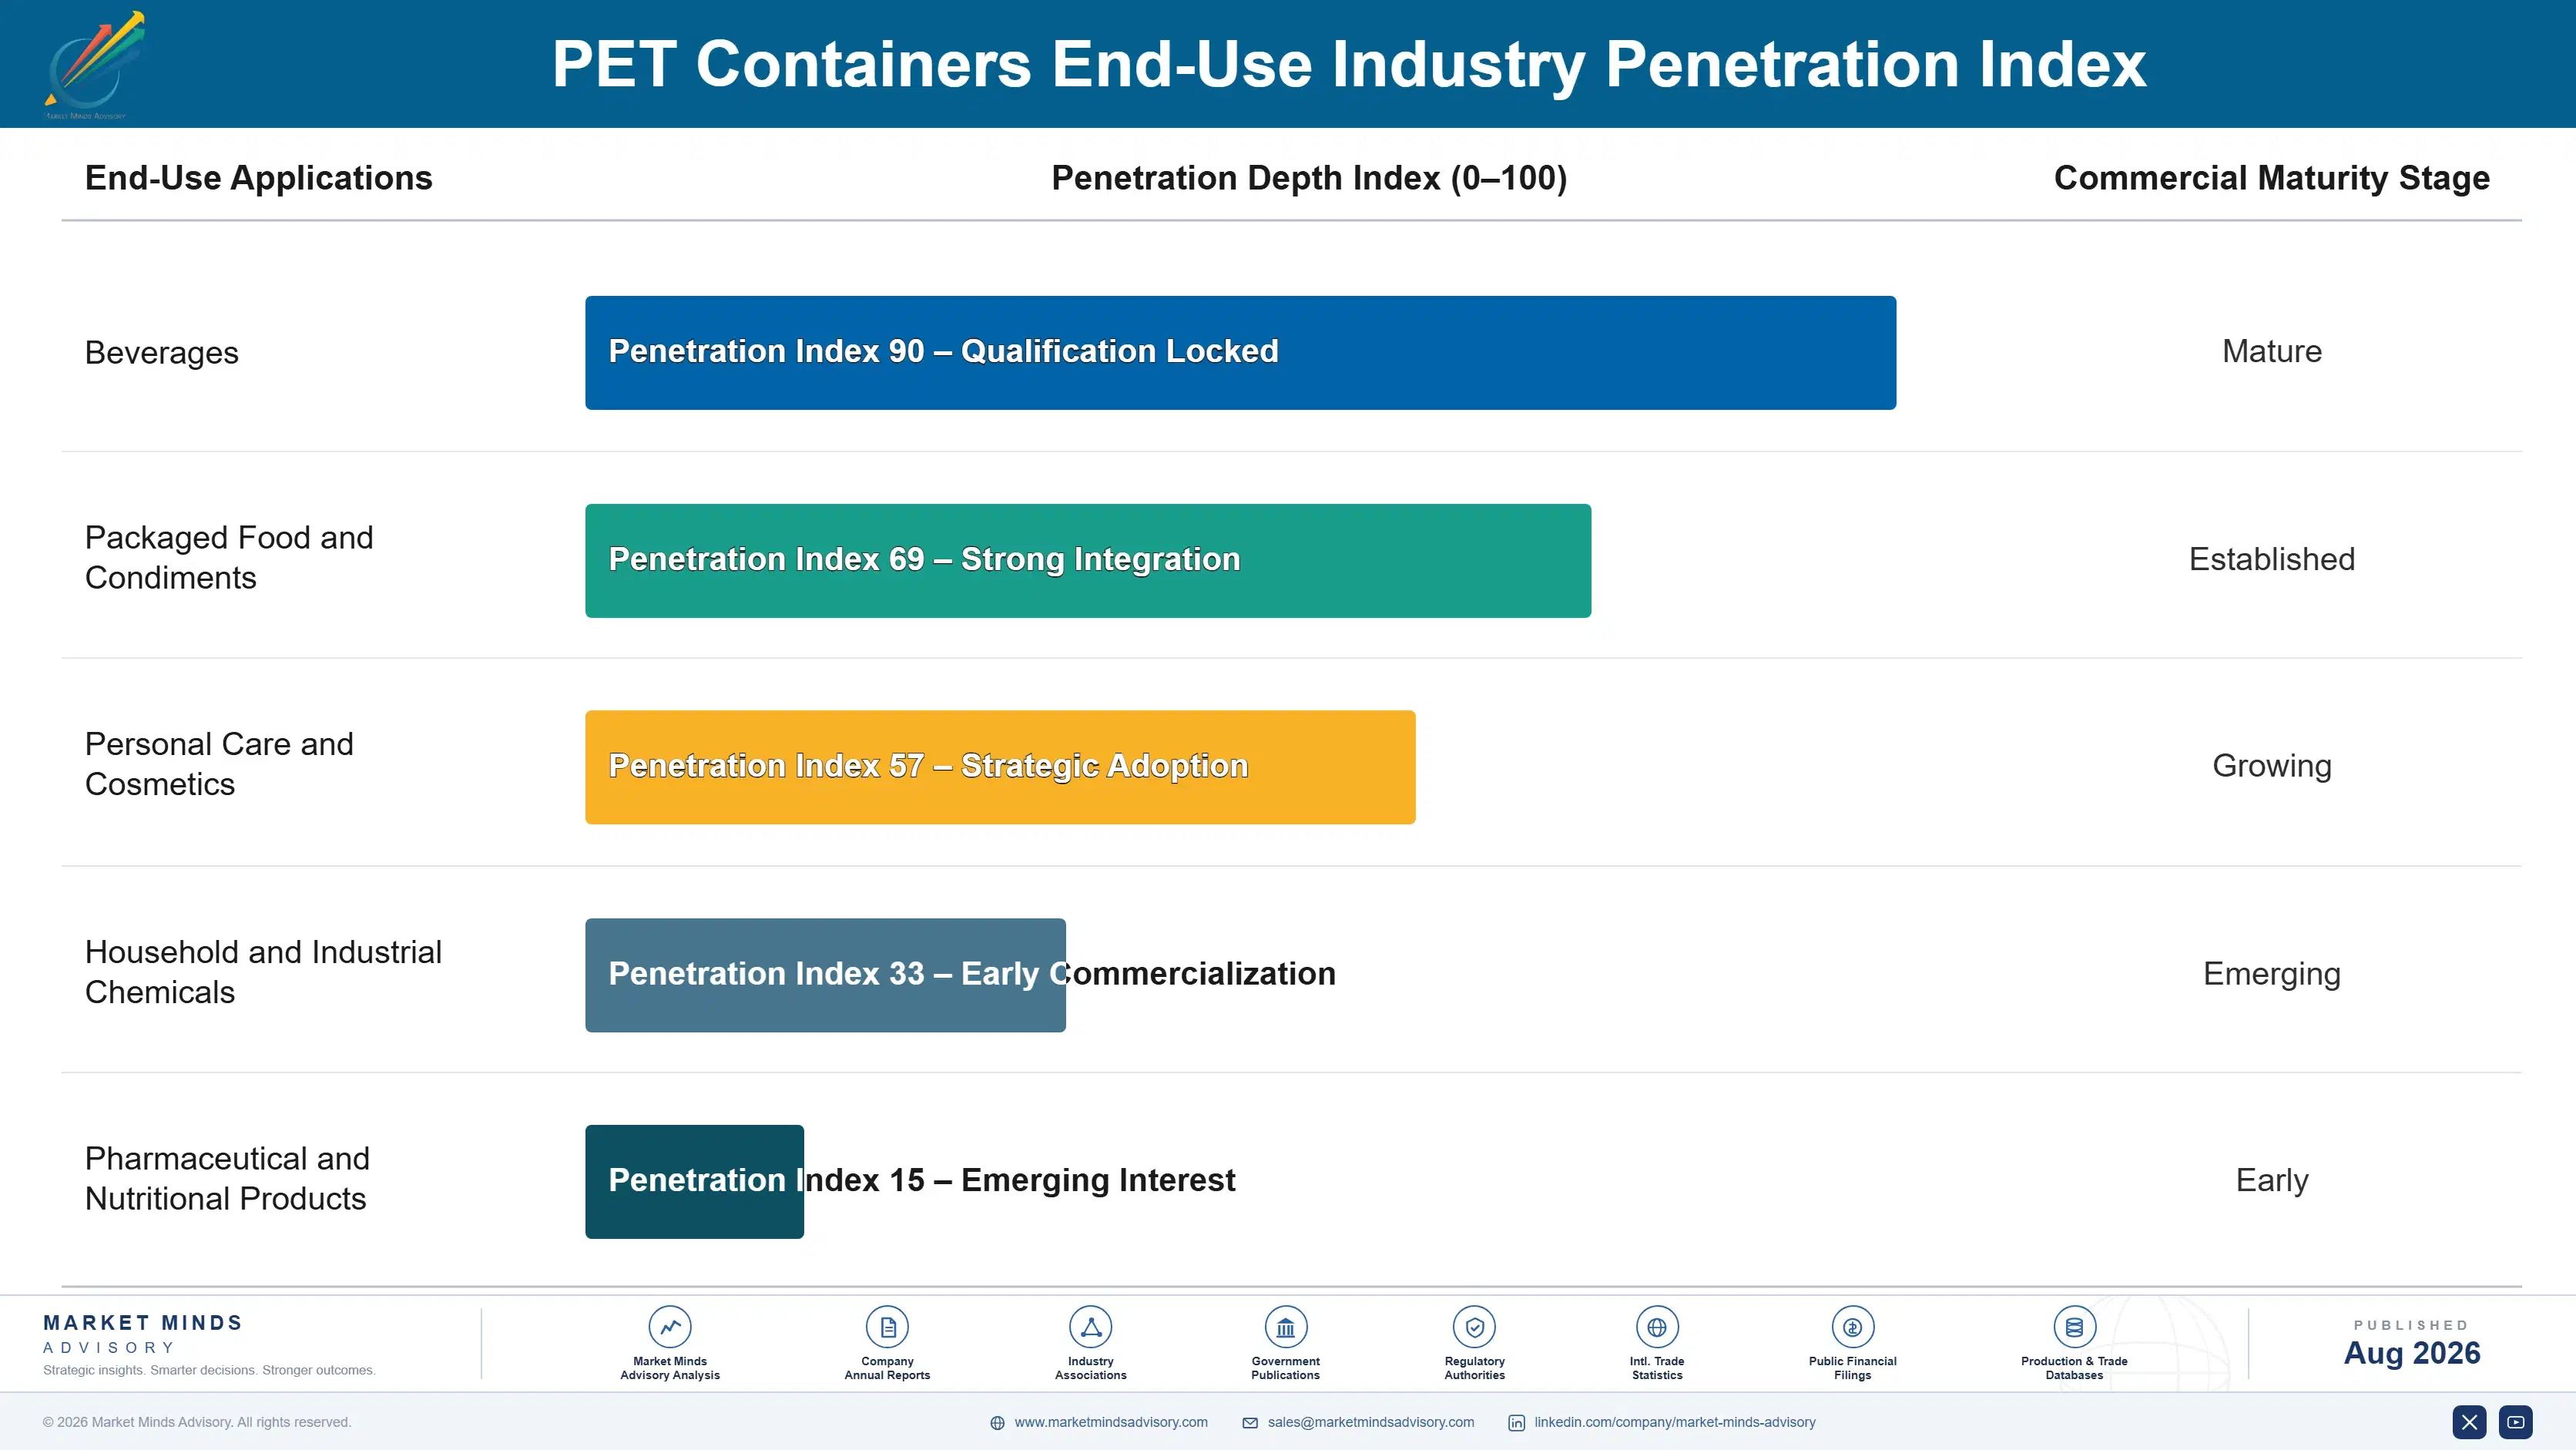
Revenue here behaves like infrastructure rather than like supply. An on-site or wall-to-wall plant, covering 37% of volume between them, ties the converter to a filling facility for the life of that site rather than the life of a contract. Even conventional supply carries stickiness, because a converter within economical freight distance of a filler faces few genuine competitors and both parties know it. Freight distance does the work a contract normally would.
Depth varies considerably by category. Aseptic dairy and juice fillers buy deepest, selecting a container partner at the capital investment decision and validating the container against the line. Personal care brands buy on design collaboration across multi-year platform cycles. Water and carbonated soft drink fillers buy on annual delivered cost and retender routinely. Contract fillers sit shallowest, switching converters whenever the arithmetic changes. Category determines depth almost entirely.

The specifying population has broadened. Container decisions used to sit with packaging engineering and procurement. Increasingly a sustainability function holds recycled content targets and reuse exposure, and that participant evaluates a converter on feedstock security rather than on conversion price at all. That is a different conversation entirely.
pet-containers-market-end-use-penetration-index-1787307272947

Where PET Conversion Still Pays

These are among the four positions where our research anticipates prominent divergence between winners and laggards over the coming forecast period. Each is grounded in the demand model, the regulatory perimeter, and the announced capacity pipeline.
01 / RECYCLED FEEDSTOCK SECURITY

Owning the feedstock beats optimising the conversion

Food-grade recycled PET trades roughly 18% above virgin resin in Europe largely because the mandates arrived several years ahead of the collection infrastructure meant to supply them. Converters holding owned recycling capacity or contracted deposit scheme offtake can quote mandated content at costs that spot buyers cannot approach, and the gap widens as the 2030 threshold nears. Brand owners are now contracting directly with the recyclers themselves, which means the window for converters to secure that position is closing quickly indeed.
02 / PHYSICAL PROXIMITY ADVANTAGE

Freight geometry protects positions that cost advantage cannot take

A blown container is mostly air and uneconomic to ship any distance, which is why the top five converters hold only 24% of a market worth nearly fifty billion dollars. On-site and wall-to-wall arrangements covering 37% of volume take that logic to its conclusion, embedding the converter inside the filling facility itself. Those positions survive the procurement cycles that would retender conventional supply annually, and they hold for the life of the filling plant rather than the life of the contract.
03 / FILLING TECHNOLOGY CAPABILITY

Aseptic capability is chosen at capital decisions, not at procurement

Hot-fill and aseptic containers compound at 6.6%, exactly 1.50 times the market, taking juice, ready-to-drink tea and dairy volume that glass and metal had held securely for decades. Heat-set moulding and aseptic-compatible container design both demand process capability and validation experience that a standard blowing operation simply does not hold at all. Because the filling line investment involved is so substantial, the customer picks a container partner at that capital decision and then very rarely reopens the question at all afterwards.
04 / LIGHTWEIGHTING VALUE LEAKAGE

Every gram removed leaves the converter and stays with the customer

Container weight has fallen 31% since 2000 on standard bottled water formats, and because resin represents 62% of conversion cost that reduction transfers almost entirely to the buyer. Unit growth consequently overstates value growth year after year across the entire beverage portfolio, and it always has. Shifting mix toward hot-fill, aseptic and decorated personal care formats, where either functional performance or brand presentation sets a hard weight floor below which design cannot go, is realistically the only durable response available to any converter anywhere.

Engagement Snapshot From the Field

A live engagement with an industry participant carrying material or product regulatory and market exposure ahead of a defining policy shift, showing how our research translates into a defensible multi-year portfolio strategy.
MARKET MINDS ADVISORY · CLIENT ENGAGEMENT SUMMARY
PET Containers Producer Strategic Portfolio Review and Transition Roadmap 2026·Investment Scenario on PET Containers Exposure Evaluation 2025-26
CLIENT PROFILE
A regional PET converter operating eleven plants across Western and Central Europe with roughly EUR 720 million in revenue (client-reported, unverified by MMA), weighted heavily toward water and carbonated soft drink bottles supplied to regional fillers. Recycled content work represented about 19% of volume (client-reported, unverified by MMA), all of it served from spot purchases of food-grade recycled polymer.
STRATEGIC CHALLENGE
Recycled polymer trading above virgin had turned mandated recycled content work into a loss-making tier, and the 2030 threshold would extend that exposure across most of the portfolio. Management had proposed exiting recycled content tenders. The commercial team argued that exiting would concede the customer relationships entirely, since brand owners were consolidating suppliers around recycled content capability.
MMA APPROACH
MMA modelled recycled polymer availability by member state against deposit scheme launch timetables, then tested the client's tender losses to establish whether price or availability had decided each one. Conversion economics were rebuilt separating resin pass-through from conversion margin, which internal reporting had combined and which obscured where the losses actually sat.
KEY FINDINGS
  1. Losses on recycled content work came almost entirely from spot feedstock purchasing rather than from conversion inefficiency, and disappeared under any contracted supply scenario the team modelled.
  2. Three of the client's eleven plants sat in member states launching deposit return schemes within two years, where contractable food-grade feedstock would become available well ahead of the 2030 threshold.
  3. Brand owners had already begun consolidating converter panels around recycled content capability, meaning an exit would have cost conventional volume alongside the recycled tier itself.
  4. The client had no on-site or wall-to-wall conversion positions at all, despite four customers operating filling sites large enough to support one economically.
CLIENT PROFILE
A regional PET converter operating eleven plants across Western and Central Europe with roughly EUR 720 million in revenue (client-reported, unverified by MMA), weighted heavily toward water and carbonated soft drink bottles supplied to regional fillers. Recycled content work represented about 19% of volume (client-reported, unverified by MMA), all of it served from spot purchases of food-grade recycled polymer.
STRATEGIC CHALLENGE
Recycled polymer trading above virgin had turned mandated recycled content work into a loss-making tier, and the 2030 threshold would extend that exposure across most of the portfolio. Management had proposed exiting recycled content tenders. The commercial team argued that exiting would concede the customer relationships entirely, since brand owners were consolidating suppliers around recycled content capability.
MMA APPROACH
MMA modelled recycled polymer availability by member state against deposit scheme launch timetables, then tested the client's tender losses to establish whether price or availability had decided each one. Conversion economics were rebuilt separating resin pass-through from conversion margin, which internal reporting had combined and which obscured where the losses actually sat.
KEY FINDINGS
  1. Losses on recycled content work came almost entirely from spot feedstock purchasing rather than from conversion inefficiency, and disappeared under any contracted supply scenario the team modelled.
  2. Three of the client's eleven plants sat in member states launching deposit return schemes within two years, where contractable food-grade feedstock would become available well ahead of the 2030 threshold.
  3. Brand owners had already begun consolidating converter panels around recycled content capability, meaning an exit would have cost conventional volume alongside the recycled tier itself.
  4. The client had no on-site or wall-to-wall conversion positions at all, despite four customers operating filling sites large enough to support one economically.
RECOMMENDED STRATEGY
Phase 1: Phase 1 (months 1 to 9): Contract multi-year food-grade recycled supply with deposit scheme operators in the three member states launching schemes. Phase 2: Phase 2 (months 9 to 22): Propose wall-to-wall conversion arrangements to the four customers whose filling volumes support the capital commitment involved. Phase 3: Phase 3 (months 22 to 36): Rebuild commercial reporting to separate resin pass-through from conversion margin across every account and tender.
OUTCOME
Recycled content work moved from negative to positive contribution within fourteen months of the first feedstock contract (client-reported, unverified by MMA). Two wall-to-wall arrangements were agreed, covering roughly 90 million containers annually. Blended conversion margin improved by approximately three points (client-reported, unverified by MMA) with no change to the underlying plant footprint.

Frequently Asked Questions

Foundational context covering the market sizes, CAGR, scope, country, region and competition that inform every finding below. This section is provided to cover basics and most often pre-purchase conversations, answered from the MMA Primary Research Dataset.

What is the current size of the PET Containers Market?

The global market was worth USD 48.5 billion in 2025, reaching USD 50.63 billion in 2026. East Asia holds the largest regional share at 29% of consumption.

How large will the PET Containers Market be by 2036?

MMA forecasts USD 77.89 billion by 2036, an expansion multiple of 1.54 times the 2026 base. That represents roughly USD 27.26 billion of incremental value.

What is the CAGR for the PET Containers Market 2026 to 2036?

The base case compounds at 4.4% annually, with a bull case of 5.6% and a bear case of 3.2%. Historical growth from 2020 to 2025 ran at 3.6%.

Which segment is growing fastest?

Hot-fill and aseptic containers compound at 6.6%, exactly 1.50 times the market rate. They take juice, tea and dairy volume from glass and metal that rarely returns.

Who are the major companies in the PET Containers Market?

Amcor, ALPLA Group, Plastipak Holdings, Indorama Ventures and Retal Industries hold a combined 24% of the market. Fragmentation is extreme because blown containers cannot be shipped economically.

Which country is growing fastest?

India compounds at 7.2%, ahead of every other national market. Bottled water penetration rises steadily with urbanisation from a base far below developed market levels.

Report Segmentation Architecture

The full report scope spans multiple orthogonal segmentation dimensions, with cross-tabulated demand data provided for each dimension pair. Coverage extends further to regional breakdowns, trend trajectories, and the competitive detail needed to support segment-level decision-making.

By Container Application Format

  • Carbonated Soft Drink Bottles
  • Still Water Bottles
  • Hot-Fill and Aseptic Containers
  • Personal and Home Care Containers
  • Food Jars and Wide-Mouth Containers
  • Edible Oil and Condiment Bottles

By End-Use Industry

  • Beverages
  • Packaged Food and Condiments
  • Personal Care and Cosmetics
  • Household and Industrial Chemicals
  • Pharmaceutical and Nutritional Products

By Commercial Dimension

  • Conventional Off-Site Container Supply
  • On-Site and Wall-to-Wall Conversion
  • Preform Supply for Third-Party Blowing
  • Contract Filler and Co-Packer Supply

By Region

  • North America
  • Western Europe
  • East Asia
  • South Asia and Pacific
  • Latin America
  • Middle East and Africa
  • Eastern Europe

Scope, Methodology, and Coverage

Every figure in this report is reproducible from documented input assumptions. The scope below maps the historical period, the forecast horizon, the segmentation dimensions, and the countries covered, alongside the underlying primary and qualitative methodology.
Historical Period
2020 to 2025
Forecast Period
2026 to 2036
Base Year
2025 (USD billions; MMA Primary Research Dataset, August 2026)
Market Definition
The market covers rigid containers blow-moulded from polyethylene terephthalate, spanning bottles, jars and wide-mouth containers used for beverages, packaged food, personal care, household chemicals and nutritional products, together with preforms supplied for third-party blowing. Closures, labels, PET sheet, thermoformed trays and polyester resin sold into textile or film applications are excluded. Sizing is measured at converter revenue in current prices, inclusive of resin pass-through.
Quantitative Units
USD billions (current prices); container units and tonnes of converted polymer where applicable
Segmentation Dimensions
By Container Application Format; By End-Use Industry; By Commercial Dimension; By Region
Regions Covered
North America, Western Europe, East Asia, South Asia and Pacific, Latin America, Middle East and Africa, Eastern Europe
Countries Covered
USA, China, Germany, France, UK, Japan, South Korea, India, Australia, Canada, Brazil, Mexico, Indonesia, Vietnam, Thailand, Malaysia, UAE, Saudi Arabia, South Africa, Nigeria, Turkey, Poland, Netherlands, Italy, Spain, Sweden, Switzerland, Argentina, Colombia, Singapore, and additional markets relevant to this sector
Key Companies Profiled
Amcor, ALPLA Group, Plastipak Holdings, Indorama Ventures, Retal Industries, Berry Global, Graham Packaging, Pretium Packaging, Alpha Packaging, Resilux, Zhuhai Zhongfu Enterprise, Serioplast, Logoplaste, Taiwan Hon Chuan Enterprise, Greiner Packaging, Ring Container Technologies, Esterform Packaging, Nampak, PDG Plastiques, Gerresheimer
Quantitative Methodology
Primary survey, n=3,800 respondents, Q4 2025, six countries; demand-side model with trade association cross-validation
Qualitative Methodology
47 expert interviews, Q4 2025; applied to validate demand model assumptions, identify emerging dynamics, and assess competitive positioning
Report Format
PDF and XLSX data workbook (Word format preview document)
Publisher
Market Minds Advisory
Report Code
MMA-2026-PAC-640
Published
August 2026
Contact
sales@marketmindsadvisory.com | www.marketmindsadvisory.com

Purchase the full PET Containers Market Report (2026 to 2036).

The full report sizes PET containers across six application formats, three commercial dimensions and seven regions, with annual forecasts to 2036 under base, bull and bear scenarios. Food-grade recycled polymer availability is modelled member state by member state against deposit return scheme launch timetables and mandated content thresholds. Conversion economics are rebuilt separating resin pass-through from conversion margin, a distinction most converter reporting combines and which obscures where profit actually sits. On-site and wall-to-wall arrangements are mapped against major filling facilities. Twenty converters are profiled on a consistent conversion revenue basis.
Recycled polymer availability modelled against deposit scheme timetables
Conversion margin separated from resin pass-through by format
On-site and wall-to-wall positions mapped by filling facility
Reuse mandate exposure quantified by beverage category
Lightweighting headroom assessed against functional performance limits
Aseptic and heat-set capability compared across twenty converters

Built For The People Who Decide

From boardroom strategy to bench-side execution, this report is read cover-to-cover by leaders shaping the next decade of their industry, turning demand scenarios, market dynamics and valuation benchmarks into decisions.
CXOs/ Presidents/ VPs/ Managers
M&A and Corporate Development
Strategy Teams and R&D Heads
Procurement and Product Directors
Regulatory and Compliance Leaders
Investor Relations and Equity Analysts