Market Minds Advisory
Pet Market

Pet Market: Pet Market: Humanisation Spending, Veterinary Consolidation And The Population That Stopped Growing

Pet populations across developed markets have essentially stopped growing, and every point of category growth now depends on persuading the same owners to spend more per animal than they did last year.

Lead Analyst

Published

September 2026

Make Smarter Decisions with Customized Research Insights

Request a free sample report and evaluate market opportunities, growth trends, and competitive dynamics relevant to your business needs.

2025 MARKET VALUE$310.0BMarket Size 2025
2036 FORECAST VALUE$576.4BBase Case , 2026 to 2036
CAGR 2026 TO 20365.8 %Bull 7.0% / Bear 4.6%
INCREMENTAL OPPORTUNITY$248.4BNet 10- year value creation
EXPANSION MULTIPLE1.76x2036 value over 2026 base
Strategic Levers
M&A Pipeline
Regional Outlook
Country Rankings
Competitive Intelligence
Segmental Deep-dive
Call-Us : 91 93563 13602

Executive Snapshot and Market Trajectory.

The pandemic adoption wave is over and the animals it produced are now middle aged. Populations have flattened across developed markets, which means growth arrives entirely through spending per pet rather than through more pets. Premiumisation is not an opportunity, it is the only mechanism left.
Veterinary services and pet healthcare grow fastest at 8.7%, because an ageing pet population generates clinical demand that nothing else in this category matches. Consolidated veterinary groups have raised pricing considerably faster than inflation, and insurance penetration at 21% is the mechanism that lets owners absorb it. That combination is producing the fastest growing and most contested revenue anywhere here. Those two parties are now negotiating with each other considerably more warily than before.
Concentration is remarkably low at 29% because the category spans food manufacturing, retail, clinical services and insurance, which share a customer and nothing else. The genuine commercial question is who owns the relationship with the owner, and veterinary groups have quietly built the strongest position of anybody. Veterinary groups reach the owner at the moment of clinical decision, which is a position nobody else in this category holds.
Market Definition
Revenue from goods and services purchased for companion animals, covering pet food and nutrition, veterinary services and pet healthcare, pet insurance and health plans, accessories, equipment and durables, grooming, boarding and pet services, and pharmaceuticals and parasiticides sold through all channels. Excludes livestock and production animal products, working animal equipment, live animal sales and breeding operations, and equine products where the animal is kept primarily for sport or work.
Base Year Value
$310.0B in 2025 (MMA Primary Research Dataset, August 2026)
Forecast Period
2026 to 2036, eleven discrete annual values
CAGR
5.8% base case. Bull 7.0%. Bear 4.6%.
Fastest Growth Segment
Veterinary Services and Pet Healthcare: 8.7% CAGR
Fastest Growth Country
India: 7.8% CAGR
Fastest Growth Region
South Asia and Pacific: 7.8% CAGR
Largest Region
North America: 32% of 2025 global value
Market Leaders
Mars Petcare, Nestle Purina PetCare, Zoetis, Chewy and Colgate-Palmolive lead on companion animal category revenue across goods and services. Source: company annual reports and MMA Primary Research Dataset, July 2026.
Primary Survey
n=3,800 procurement and R&D decision-makers, Q4 2025, six countries
Methodology
Demand-side build-up, cross-validated against public data, 47 expert interviews

Pet Calming Collars Market Forecast Scenarios

pet-calming-collars-market-size-forecast-scenario-1788165803040
Between 2020 and 2025 the market grew at an estimated 6.0% historical CAGR, held back early by pandemic-driven retail-channel disruption before recovering discretionary pet spending and rising veterinary-endorsement visibility restored steadier momentum through 2024 into 2025, a pace consistent with growth-specialty pet-care transitions broadly across the sector. Premiumization-driven adoption continued despite persistent clinical-substantiation-cost constraints throughout the period nationwide.
The base case assumes 6.8% CAGR through 2036, driven by three mechanisms: continued CBD-formulation adoption requiring clinically studied calming claims at growing brand scale, sustained veterinary-channel demand favoring documented efficacy formulations, and expanding premiumization adoption broadening combination-active applications across regional retailers, with brands calibrating clinical investment against these converging demand mechanisms directly across every major retail program. Regulatory claim-substantiation mandates further support this trajectory globally. Manufacturers are calibrating capacity investment closely against mechanisms.
The bull case, at 8.1%, hinges on faster CBD-formulation penetration across emerging-brand cohorts alongside accelerated regulator acceptance of expanded hemp-derived claim documentation. The bear case, at 5.5%, reflects a scenario where ingredient-supply volatility and clinical-testing-cost disruption persist, forcing brands to defer formulation investment and slowing conversion momentum among smaller, less capitalized indie brands nationwide. Manufacturers are tracking both pathways closely nationwide.

More Spending, Not More Pets

The population arithmetic has turned and the industry has been slow to acknowledge it. Household penetration in developed markets sits near 58% and has stopped rising, adoption returned to trend after the pandemic surge, and those animals are now moving together into middle age. Every point of category growth therefore comes from spending per animal, which runs around USD 1,240 annually and does the entire job.
MARKET CONCENTRATION CR529%Share of category revenue held by the leading participants
ANNUAL SPENDING PER PETUSD 1,240Average household outlay per companion animal in developed markets
INSURANCE PENETRATION21%Share of companion animals covered by a health policy
VETERINARY PRACTICE CONSOLIDATION34%Proportion of clinics owned by corporate groups rather than independently
PREMIUM FOOD SHARE43%Portion of nutrition spending on premium and specialised formats
HOUSEHOLD PENETRATION58%Share of households in developed markets keeping a companion animal
Veterinary services are where that spending increasingly goes. Corporate groups now own 34% of clinics, pricing has risen considerably faster than general inflation, and an ageing animal population generates clinical demand that arrives regardless of what an owner intended to spend. Insurance covering 21% of animals is what makes the larger bills payable at all, which is why insurers and veterinary groups now negotiate rather more warily than before.
Concentration at 29% reflects a category that is really four businesses. Food manufacturing is a consumer packaged goods operation. Veterinary services are clinical. Insurance is underwriting. Retail is retail. They share a customer and essentially nothing else, and the participants who have worked out that owning the customer relationship matters more than owning any one of those businesses are the ones behaving most interestingly.
"Everybody in this category talks about humanisation as though it were a marketing insight. It is an ageing population of animals meeting a consolidated veterinary sector with pricing power, and the insurance industry deciding how much of that owners can actually pay."
Director, Pet Care and Companion Animal Practice · MMA Pet Care and Companion Animal Products Practice · August 2026

Market Trends

Population Growth Stopped And Spending Per Animal Replaced It

Household penetration near 58% in developed markets has flattened, the pandemic adoption surge returned to trend, and unit volumes across food and accessories reflect that plainly. Growth now depends entirely on spending per animal running around USD 1,240 annually. Participants who built plans around a growing population are discovering that premiumisation is not an opportunity so much as the only mechanism left, and that it has finite room before affordability starts binding. A category planning around a growing animal population has been planning against something that simply stopped happening some years ago.
Market Impact: Grows at 8.7% against 5.8%

Veterinary Consolidation Has Moved Pricing Power Decisively

Corporate groups now own 34% of clinics in developed markets, and consolidated ownership has raised pricing considerably faster than general inflation across almost every procedure category. Independent practices anchored local pricing and are steadily disappearing. Owners encounter the result at the point of clinical decision, where declining treatment is not a comfortable option. Insurance at 21% penetration determines who can absorb the increase, which makes insurers the counterweight in a negotiation nobody else is having. Nobody organised was pushing back on any of that pricing until the insurers finally arrived.
Market Impact: Covers 21% of companion animals

Market Opportunities and Growth Drivers

The Pandemic Cohort Is Ageing Into Clinical Spending

Animals adopted during lockdown are now entering the years where veterinary expenditure rises sharply and predictably, and they are doing so together rather than spread across normal adoption patterns. That produces a demand wave in diagnostics, chronic medication and surgical intervention arriving on a demographic timetable nobody influences. Veterinary services accordingly grow at 8.7% against a market rate of 5.8%. The cohort effect will persist for the better part of a decade. A demand wave arriving on a demographic timetable is considerably more reliable than one arriving on a marketing plan.
Market Impact: Prices above 21% covered animals

Insurance Penetration Raises What Owners Can Actually Pay

Around 21% of companion animals now carry health cover, and an insured animal receives treatment an uninsured one frequently does not when the estimate arrives. Penetration rising therefore lifts clinical spending capacity across whole populations rather than changing any individual decision. It also transfers negotiating position toward insurers, who increasingly question pricing that consolidated veterinary groups have set without much resistance until now. That negotiation will shape this category considerably. An insurer questioning clinical pricing is the first organised counterweight this category has produced, and it arrived from an unexpected direction entirely.
Market Impact: Saturates at 58% household penetration

Market Restraints and Challenges

Veterinary Pricing Has Outrun Household Affordability

Clinical pricing has risen faster than household income for several years, and owners deferring or declining treatment now appears in clinical data across multiple developed markets. The root cause is consolidation removing the independent practices that previously anchored local pricing. Commercially it caps the growth that veterinary services can sustain regardless of clinical demand. Mitigation runs through insurance penetration, payment plans, tiered service offerings and preventive care subscriptions that spread cost across a year rather than concentrating it. Nobody wants to be the participant who priced treatment beyond the owner's reach.
Market Impact: Spends USD 1,240 per animal

Flat Populations Leave Premiumisation Carrying Everything

With household penetration near 58% and no longer rising, every point of growth depends on persuading existing owners to spend more per animal than they did last year. The root cause is demographic saturation in the markets where spending per animal is highest. Commercially it means volume declines are permanent rather than cyclical. Mitigation runs through emerging market entry, category extension into services, healthspan and longevity positioning, and multi-pet household targeting where penetration still has room. Every one of those routes goes somewhere other than the saturated markets where the money currently is.
Market Impact: Owns 34% of clinical capacity
4 additional market trends, 3 additional growth drivers, and 2 additional restraints and challenges are covered in the full report. Contact sales@marketmindsadvisory.com to access the complete intelligence.

Segment CAGR and Growth Architecture

Segmentation follows category type, because food manufacturing, clinical services, underwriting and retail are genuinely different businesses that share a customer and very little else. Six categories describe the market completely, from accessories competing on price and novelty through to veterinary services where an ageing animal population and consolidated pricing power meet one another head on.
pet-calming-collars-market-market-share-analysis-1788165803598

Veterinary Services and Pet Healthcare

The fastest category grows at 8.7%, half again the market rate of 5.8%, and two forces are pushing it together. An ageing animal population generates clinical demand on a timetable nobody influences, while corporate groups owning 34% of clinics have raised pricing considerably faster than inflation across almost every procedure. Insurance covering 21% of animals determines who can absorb that. The result is the fastest growing revenue in this category and also the most contested, since insurers have begun questioning pricing that consolidated groups set for years without meeting any organised resistance at all. Nobody else at all in this category reaches the owner while a decision is actually being made.
CAGR 8.7%

Pet Insurance and Health Plans

Insurance grows at 7.9% from a penetration base of 21% that leaves enormous room in almost every market outside a handful of northern European ones. The product does two things at once commercially: it makes veterinary bills payable for owners who would otherwise decline treatment, and it gives insurers a position from which to question clinical pricing that nobody else has been challenging. Loss ratios have deteriorated as veterinary inflation outpaced premium repricing, which is a straightforward underwriting problem and also the reason insurers are now taking a considerably closer interest in what clinics charge. An insurer with an organised view on clinical pricing is a genuinely new participant in this argument.
CAGR 7.9%
Full segment breakdown across 6 segments available in the complete report.

Regional Architecture and Country Demand Map

Spending follows income and household penetration, which have both saturated in the largest markets. North America leads on spending per animal, with East Asia expanding on premiumisation and South Asia and Pacific growing fastest from very low ownership. Household penetration has saturated where spending is highest.

North America

Out-of-band note: this region holds 32% at the very top of its band because spending per animal here exceeds every other market by a wide margin, which no share band accommodates comfortably. Veterinary consolidation has advanced further here than anywhere, with corporate groups holding a substantial share of clinics and pricing power to match. Insurance penetration remains low relative to that pricing, which produces the affordability tension most visible in this market. Household penetration has stopped rising and premiumisation now carries the entire growth burden. The tension between consolidated pricing and low insurance coverage is sharper here than anywhere, and it is the clearest preview of where every other developed market is heading next.
Share: 32% | CAGR: 6.2% (2026 to 2036)

Western Europe

The slowest growing region reflects household penetration that saturated earlier than anywhere and an insurance market that is unusually developed in the Nordic countries and thin almost everywhere else. Veterinary consolidation has advanced substantially in the United Kingdom and is progressing elsewhere, attracting regulatory attention over pricing transparency in at least one market. Premium and specialised nutrition penetration is high. Regulatory attention to pet food claims and to veterinary competition is heavier here than in any other region. Regulatory attention to veterinary competition arriving here first matters for everybody, because remedies designed in one market tend to establish the template that other regulators reach for when the same question arises later.
Share: 24% | CAGR: 4.6% (2026 to 2036)
Regional intelligence for 5 additional markets available in the complete report: East Asia, South Asia and Pacific, Latin America, Middle East and Africa, Eastern Europe. Contact sales@marketmindsadvisory.com.
pet-calming-collars-market-country-cagr-analysis-1788165804109

Where Pet Category Margin Sits

Four levers work on customer ownership, clinical economics and spending capacity rather than on product quality, which competitors match readily in every part of this category. Relationship ownership, insurance attachment, preventive subscription and emerging market entry each address something a participant can pursue now. None of the four requires a better product than anybody already sells.

Own The Owner Relationship Rather Than The Transaction

This category spans four unrelated businesses that share one customer, and the participant holding the relationship with that owner captures spending across all of them rather than competing within one. Veterinary groups have quietly built the strongest position here because clinical advice directs food, medication and insurance decisions together. A relationship worth USD 1,240 annually across categories beats a transaction in any one of them. Most participants still optimise their own category in isolation from everybody else. Owning a category and owning a customer are entirely different positions to hold.
Market Impact: Captures the whole USD 1,240 spent across categories

Attach Insurance At The Point Of Acquisition

Insurance penetration sits at 21% and an insured animal receives treatment an uninsured one frequently does not, which means attachment raises lifetime clinical spending far more than any marketing does. Attachment works best at acquisition, before an owner has encountered a bill and before any condition becomes pre-existing. Breeders, shelters and first veterinary visits are where the decision happens. Participants selling insurance through general advertising are competing for attention at exactly the wrong moment entirely. An insured animal is worth several times over an uninsured one over a full lifetime.
Market Impact: Lifts coverage above the current 21% penetration base

Sell Preventive Care As A Monthly Subscription

Veterinary pricing has outrun household affordability and owners are deferring treatment, which damages both clinical outcomes and practice revenue simultaneously. Preventive plans spreading vaccination, dental and screening cost across 12 monthly payments convert a series of unwelcome bills into an ordinary household expense. Practices offering them report considerably higher visit frequency and better retention. It is a payment structure rather than a clinical innovation, which is exactly why so few practices have bothered with it. Twelve small monthly payments are considerably more easier to accept than one large unexpected estimate.
Market Impact: Spreads clinical cost across all 12 monthly payments

Enter Emerging Markets Before Premiumisation Arrives

Ownership in emerging markets is rising from a very low base and premiumisation is following considerably faster than it did in developed markets, which compresses a twenty year progression into perhaps 8 years. Participants entering during the value phase build distribution and brand recognition that arriving later cannot replicate at any price. Entering after premiumisation means competing against established positions for the profitable segment. The window closes quietly and nobody announces when it has. Nobody ever sends a note round to announce that the value phase has finally ended anywhere.
Market Impact: Compresses the whole progression into roughly 8 years

Who Controls the Margin Pool

Concentration is remarkably low at around 29% across the five largest participants measured on companion animal category revenue, and it is low for a definitional reason rather than a competitive one. Food manufacturing, veterinary services, insurance underwriting and retail are separate industries that happen to share a customer, and essentially nobody holds a leading position across more than two of them. That is definitional rather than competitive.
Competition runs on customer relationship, category position and pricing power. Customer relationship decides who captures spending across categories rather than within one. Category position decides which of the four businesses a participant is actually in. Pricing power sits overwhelmingly with consolidated veterinary groups, who reach the owner at the moment when declining a purchase is emotionally difficult. The third of those decides most outcomes.

Pressure is arriving from veterinary consolidators and from insurers moving against each other. Groups have raised clinical pricing steadily against fragmented independent competition. Insurers, facing deteriorating loss ratios, have begun questioning that pricing with an organisation nobody previously brought to the conversation. Rankings will shift toward participants holding the owner relationship, since that is what determines who captures spending as it moves between categories.
pet-calming-collars-market-company-positioning-matrix-1788165804639

Competitive Moat and Risk Dimensions

MARS PETCARE

Moat: Breadth across food and clinics

Mars Petcare holds leading positions in pet nutrition alongside substantial veterinary clinic ownership, which reaches an owner through both the shelf and the consulting room. Clinical advice influences food and medication choices directly, and owning both sides of that captures spending most participants can only compete for. Scale across nutrition funds brand investment clinical operators could never justify.
MARS PETCARE

Risk: Regulatory attention to combined ownership

Holding both clinical practice and the products those practices recommend attracts competition scrutiny, and at least one regulator has already opened examination of veterinary market structure and pricing. Combined ownership is commercially powerful and precisely what makes it visible. Remedies affecting referral or recommendation practices would reduce exactly the advantage the combination was built to capture.
ZOETIS

Moat: Therapeutic pipeline and clinical position

Zoetis holds companion animal therapeutics with genuine patent protection and clinical evidence, which is unusual in a category where most products are readily substitutable by a competitor within weeks. Chronic condition medication for an ageing animal population produces recurring revenue on prescriptions that continue for years. Veterinary prescribing relationships are built through clinical education rather than through consumer marketing entirely.
ZOETIS

Risk: Dependence on veterinary affordability

Therapeutic revenue depends on owners paying for treatment, and clinical pricing has outrun household affordability sufficiently that deferred and declined treatment is now visible in the data. Insurance penetration at 21% covers only a minority of animals. Pressure on veterinary pricing would reach medication costs alongside everything else that a consultation involves.

Players Tracked

Prominent Players

Mars Petcare
Nestle Purina PetCare
Zoetis
Chewy
Colgate-Palmolive

Other Key Players

General Mills Blue Buffalo
Freshpet
IDEXX Laboratories
Elanco Animal Health
Boehringer Ingelheim Animal Health
Trupanion
Lemonade Pet
IVC Evidensia
VCA Animal Hospitals
Petco
PetSmart
Dechra Pharmaceuticals
Virbac
Unicharm Pet Care
Yantai China Pet Foods

Recent Developments

APRIL 2024

Regulator opened examination of veterinary market pricing structure

A competition regulator opened a formal examination of veterinary services covering pricing transparency, corporate ownership concentration and whether pet owners receive adequate information about treatment options and their costs. This was a regulatory review rather than any commercial arrangement between the veterinary groups under examination.
Signal: Regulators examining veterinary consolidation follow pricing that rose faster than owners could reasonably absorb any of it.
SEPTEMBER 2024

Insurer repriced policies against deteriorating veterinary loss ratios

A pet insurer substantially repriced its policy book after veterinary cost inflation outran premium assumptions, while simultaneously beginning direct negotiation with clinical groups over procedure pricing. This was an underwriting and commercial decision rather than any merger, acquisition or joint venture with the veterinary operators concerned.
Signal: Insurers negotiating clinical pricing brings organised resistance that veterinary groups have never previously had to face.
FEBRUARY 2025

Veterinary group launched preventive care subscription across practices

A veterinary group launched monthly preventive care subscriptions across its practice network, spreading vaccination, dental and screening costs across the year rather than presenting owners with occasional bills they increasingly deferred or declined. This was a commercial pricing structure rather than any transaction between participants.
Signal: Spreading cost across monthly payments addresses affordability without any reduction in the underlying clinical pricing itself.

What Pet Category Costs Contain

Cost divides differently across four businesses that share this heading. In nutrition, raw materials and protein absorb roughly 46% of manufacturing cost, packaging near 17%, conversion near 19% and distribution the remaining 18%. In veterinary services, clinical staff dominate at well above half of practice cost, with premises, equipment and consumables sharing the rest. The two economics are barely comparable and are frequently discussed as though they were identical.
Protein and grain pricing moved sharply across recent seasons and raised nutrition manufacturing cost accordingly, with premium formats carrying higher protein content and therefore more exposure. Nestle and Freshpet have both discussed input cost across recent reporting periods. Veterinary staff cost has moved further and more damagingly, since qualified clinical staff are scarce across every developed market and wage competition between consolidated groups has been intense.

Exposure varies by business rather than by geography. Nutrition manufacturers carry commodity exposure against retail pricing that competes with private label. Veterinary practices carry staff cost against pricing they have largely been able to set. Insurers carry veterinary inflation directly through loss ratios, which is why they have moved from accepting clinical pricing to questioning it rather firmly.
pet-calming-collars-market-cost-volatility-analysis-1788165804837

Protein formulation flexibility across ingredient sources

Protein and raw materials absorb close to half of nutrition manufacturing cost and price on agricultural markets nobody in this industry influences. Formulation flexibility across protein sources, qualified in advance rather than during a price spike, reduces exposure measurably. Premium formats carry higher protein content and therefore more exposure, which manufacturers frequently overlook when designing them.

Clinical staffing models reducing wage competition exposure

Veterinary staff cost dominates practice economics and qualified clinicians are scarce across every developed market, which has produced wage competition between consolidated groups that nobody wins. Technician-led models, remote consultation and scheduling design reduce dependence on the scarcest staff. Practices competing purely on salary are bidding against every other group for the same very small pool.

Insurance repricing aligned to clinical inflation

Loss ratios deteriorate whenever veterinary pricing outruns premium assumptions, and policy books written on historic clinical costs lose money quietly for years before anybody notices. Repricing on observed clinical inflation rather than on general assumptions protects underwriting. Insurers who repriced late have carried losses that earlier alignment would have prevented almost entirely for them in practice.

Portfolio Architecture for Margin Defence

The portfolio separates by whether a business reaches the owner at a moment of decision. Food and accessories are the volume core: enormous revenue, purchased on shelf against private label and competing brands, and dependent on premiumisation because unit volumes no longer grow. Large, familiar, and defended by brand rather than by anything an owner cannot substitute. Volume growth stopped and nobody replaced it.
Margin concentrates in veterinary services, therapeutics and insurance. All three reach the owner at a moment when declining is emotionally difficult or when a policy already committed the spending. Veterinary services grow at 8.7% on an ageing population meeting consolidated pricing power. Therapeutics carry genuine patent protection, which almost nothing else in this category does anywhere. All three reach the owner differently.

The overlooked position is the owner relationship itself. Four unrelated businesses share one customer, and whoever holds that relationship captures spending as it moves between them rather than competing inside a single category. Veterinary groups have built the strongest position without most other participants appearing to notice it happening at all. That is the one position genuinely worth holding in this category.

Volume / Commodity-Adjacent

Mainstream pet food, accessories, equipment and retail distribution competing on shelf against private label. Range spans ten points because scale and commodity exposure decide outcomes far more than brand strength alone does.
Gross Margin: 22-32%

Premium / Certified

Premium and specialised nutrition, grooming and boarding services and branded health-positioned products. Range spans twelve points because premiumisation depth and service delivery economics vary considerably within this tier. Delivery economics decide it.
Gross Margin: 34-46%

Sustainability / Regulatory / Next-Generation

Veterinary services, companion animal therapeutics, diagnostics and insurance underwriting. Range spans eighteen points because clinical, pharmaceutical and underwriting economics are genuinely different businesses inside one tier. Very little at all transfers between them.
Gross Margin: 44-62%
pet-calming-collars-market-portfolio-architecture-1788165805349

High-value Sub-segments and Strategic Watch-out

Veterinary Services and Pet Healthcare

High value and high growth at 8.7%, combining an ageing animal population with consolidated ownership holding real pricing power. The sixteen point range separates corporate groups with scale and pricing latitude from independent practices anchoring local pricing and steadily disappearing. Regulators and insurers have both noticed.
Gross Margin: 46-62%

Pet Insurance and Health Plans

High value with moderate growth at 7.9%, from a penetration base near a fifth that leaves enormous room in most markets. The fourteen point range reflects loss ratio performance, since books written on historic clinical cost assumptions have deteriorated considerably against veterinary inflation. Repricing arrived late.
Gross Margin: 40-54%

Pet Food and Accessories

The volume core, purchased on shelf against private label with unit volumes that no longer grow in developed markets. Premiumisation carries the entire growth burden here, and it has finite room before household affordability begins binding on it. Nothing here grows without a price increase.
Gross Margin: 22-32%

Owner Affordability Ceiling

The strategic watch-out rather than a growth pool. Clinical pricing has outrun household income for several years, deferred treatment already appears in the data, and insurance covers only a fifth of animals against it. Deferred treatment is the first real evidence of a genuine limit.
Gross Margin: Variable

Why Owners Keep Spending

The annuity in this category is the animal rather than any product. A companion animal generates spending across food, healthcare, insurance and services for a decade or more, and the owner's willingness to fund it rises rather than falls as the animal ages. Spending near USD 1,240 annually per animal recurs without any renewal decision being made, which is a considerably more reliable structure than most consumer categories ever achieve.
Stickiness varies enormously by category. Veterinary relationships are close to permanent, since clinical history, familiarity and trust are genuinely difficult to transfer and owners rarely change practice without a reason. Insurance is sticky because pre-existing conditions make switching expensive or impossible after the first claim. Food and accessories have almost no stickiness at all, competing on shelf against private label and substitutes every single week.

The owner has changed in ways the industry mostly welcomes and occasionally should not. Willingness to spend on an animal has risen substantially and consistently across two decades. That has also allowed clinical pricing to rise faster than household income for several years, and the deferred treatment now appearing in the data is the first genuine evidence that the willingness has an actual limit somewhere.
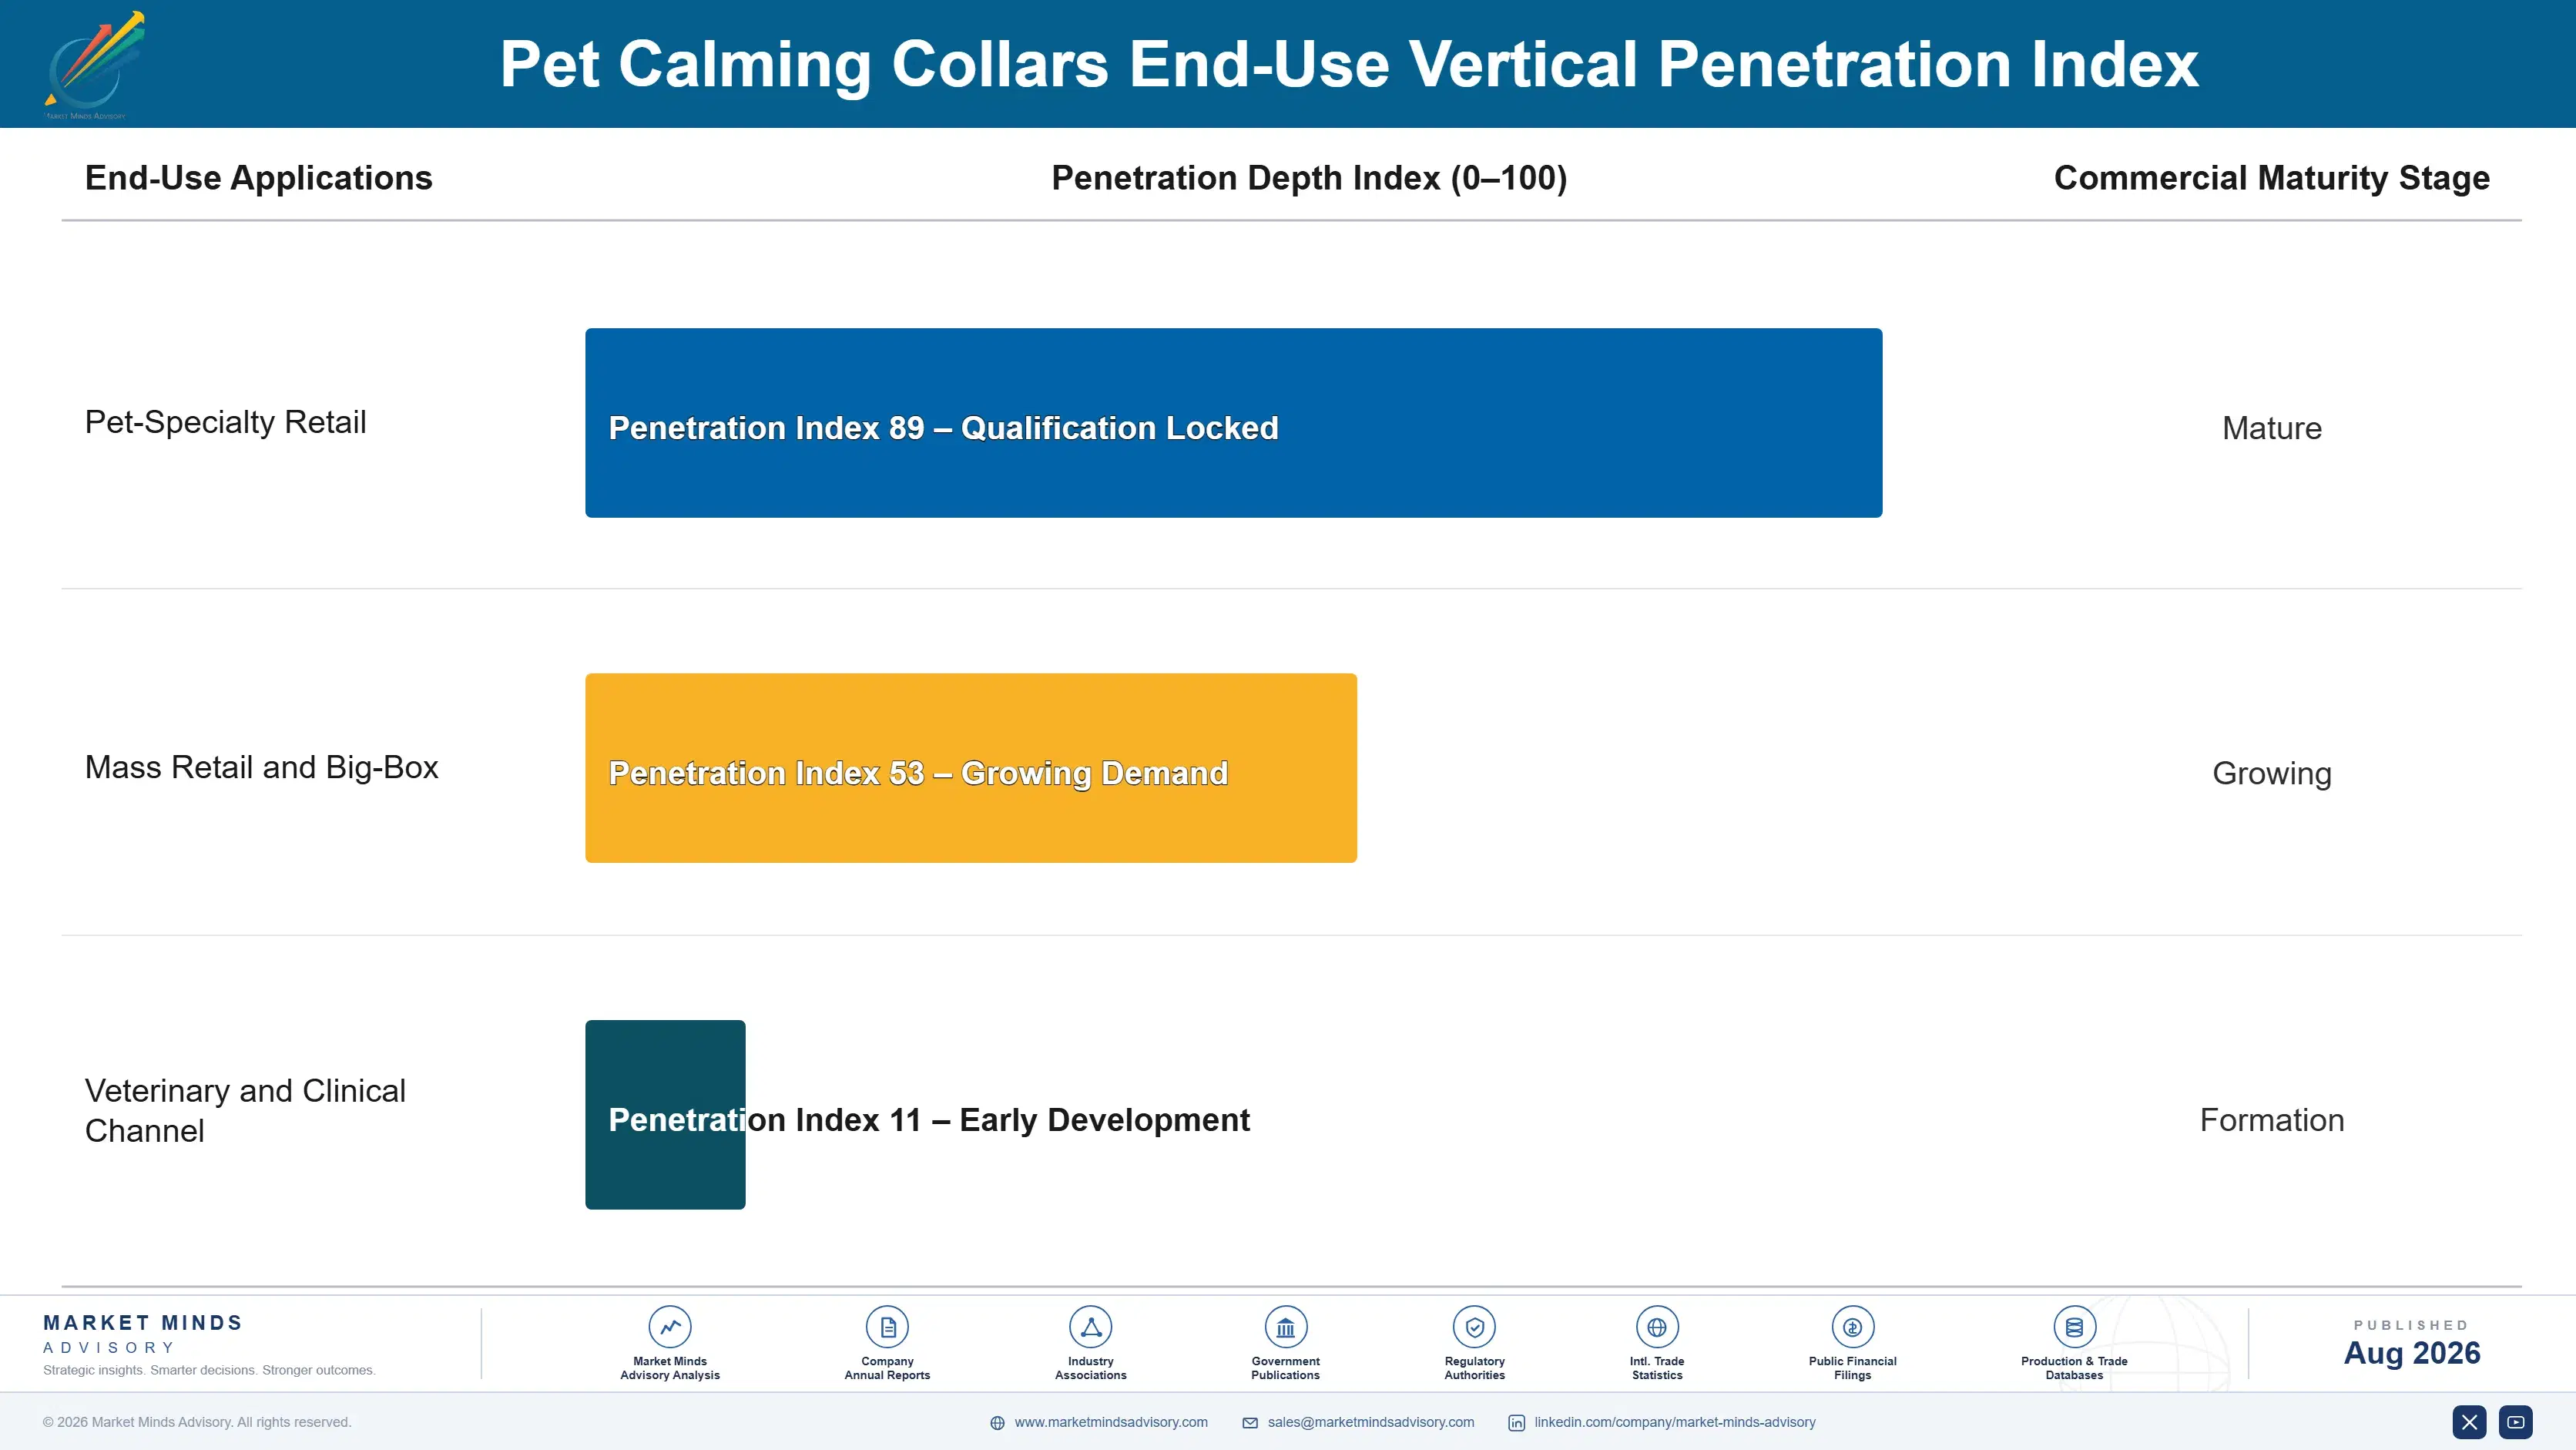
pet-calming-collars-market-end-use-penetration-index-1788165805847

Where Participants Should Commit

These are among the four positions where our research anticipates prominent divergence between winners and laggards over the coming forecast period. Each is grounded in the demand model, the regulatory perimeter, and the announced capacity pipeline.
01 / OWNER RELATIONSHIP OWNERSHIP

Four businesses share one customer, and somebody owns them

This category spans four genuinely unrelated businesses that happen to share a single customer, and the participant holding the relationship with that owner captures spending across all of them rather than competing inside any one of them. Veterinary groups have quietly built the strongest position here, because clinical advice directs food, medication and insurance decisions together in a single consulting room conversation. A relationship worth USD 1,240 annually beats a transaction in one category by a very wide margin indeed.
02 / INSURANCE ATTACHMENT TIMING

Attach at acquisition or not at all

Insurance penetration sits at 21% and an insured animal receives treatment that an uninsured one frequently does not once the estimate finally arrives, which means attachment raises lifetime clinical spending far more effectively than any marketing ever does. Attachment works best at the very moment of acquisition, before an owner has encountered any bill and before any condition has become a pre-existing condition. Breeders, shelters and first veterinary visits are precisely where that particular decision actually gets made in practice.
03 / PREVENTIVE PAYMENT STRUCTURE

Monthly beats occasional when affordability is binding

Veterinary pricing has outrun household affordability and owners are now visibly deferring necessary treatment, which damages both clinical outcomes and practice revenue at exactly the same time as each other. Preventive plans spreading vaccination, dental and screening costs across twelve monthly payments convert a series of unwelcome bills into an ordinary household expense line instead. Practices that offer them report considerably higher visit frequency and better retention, and it is a payment structure rather than any kind of clinical innovation.
04 / EMERGING MARKET TIMING

The value phase is where positions get built

Ownership across emerging markets is rising from a very low base indeed and premiumisation there is following considerably faster than it ever did in developed markets, compressing a twenty year progression into perhaps eight of them. Participants who enter during the value phase build distribution and brand recognition that arriving later simply cannot replicate at any price at all afterwards. Entering after premiumisation has arrived means competing against established positions for exactly the profitable segment everybody in the market wants.

Engagement Snapshot From the Field

A live engagement with an industry participant carrying material or product regulatory and market exposure ahead of a defining policy shift, showing how our research translates into a defensible multi-year portfolio strategy.
MARKET MINDS ADVISORY · CLIENT ENGAGEMENT SUMMARY
Pet Producer Strategic Portfolio Review and Transition Roadmap 2026·Investment Scenario on Pet Exposure Evaluation 2025-26
CLIENT PROFILE
A premium pet nutrition manufacturer selling through grocery, specialist retail and online channels across three developed markets, with no veterinary channel presence and no involvement in services or insurance. Volume had been flat for three years while the company had launched successive premium tiers, and management described the flatness as a competitive share issue rather than as a population one.
STRATEGIC CHALLENGE
The board needed to establish how much of the volume flatness was population saturation rather than share loss, and whether building a veterinary channel justified the very different commercial capability it requires. It also faced a decision on emerging market entry at value price points, which the brand organisation regarded as inconsistent with the premium positioning it had spent a decade building.
MMA APPROACH
MMA decomposed three years of volume performance into population, share and mix effects across all three markets, separating saturation from anything competitive for the first time. It modelled veterinary channel development against continued retail premium investment. Expert interviews with veterinary groups, insurers, retailers and competing manufacturers established where owner spending actually gets directed and by whom.
KEY FINDINGS
  1. Population saturation rather than share loss explained almost all of the volume flatness, and successive premium launches had been addressing a problem the company did not have.
  2. Veterinary recommendation directed a substantial share of premium nutrition purchasing, and the client had no relationship whatever with any clinical group in any market.
  3. Retail buyers were expanding private label in exactly the premium tiers the client had launched into, using the client's own positioning to justify their pricing.
  4. Emerging market entry at value price points would have built distribution ahead of a premiumisation wave already visible and moving considerably faster than developed markets had.
CLIENT PROFILE
A premium pet nutrition manufacturer selling through grocery, specialist retail and online channels across three developed markets, with no veterinary channel presence and no involvement in services or insurance. Volume had been flat for three years while the company had launched successive premium tiers, and management described the flatness as a competitive share issue rather than as a population one.
STRATEGIC CHALLENGE
The board needed to establish how much of the volume flatness was population saturation rather than share loss, and whether building a veterinary channel justified the very different commercial capability it requires. It also faced a decision on emerging market entry at value price points, which the brand organisation regarded as inconsistent with the premium positioning it had spent a decade building.
MMA APPROACH
MMA decomposed three years of volume performance into population, share and mix effects across all three markets, separating saturation from anything competitive for the first time. It modelled veterinary channel development against continued retail premium investment. Expert interviews with veterinary groups, insurers, retailers and competing manufacturers established where owner spending actually gets directed and by whom.
KEY FINDINGS
  1. Population saturation rather than share loss explained almost all of the volume flatness, and successive premium launches had been addressing a problem the company did not have.
  2. Veterinary recommendation directed a substantial share of premium nutrition purchasing, and the client had no relationship whatever with any clinical group in any market.
  3. Retail buyers were expanding private label in exactly the premium tiers the client had launched into, using the client's own positioning to justify their pricing.
  4. Emerging market entry at value price points would have built distribution ahead of a premiumisation wave already visible and moving considerably faster than developed markets had.
RECOMMENDED STRATEGY
Phase 1: Phase one: stop launching premium retail tiers against a saturated population and redirect that investment toward veterinary channel development instead. Phase 2: Phase two: build clinical relationships and veterinary-recommended formats, accepting that this requires commercial capability the retail organisation does not currently hold. Phase 3: Phase three: enter two emerging markets at value price points, accepting brand positioning discomfort in exchange for distribution built ahead of premiumisation.
OUTCOME
The client reported veterinary channel revenue growing from nothing to a meaningful share within six quarters (client-reported, unverified by MMA). Premium retail tier launches were discontinued. Two emerging market entries were approved at value price points, and retail private label pressure was met with cost position rather than further premium tiers.

Frequently Asked Questions

Foundational context covering the market sizes, CAGR, scope, country, region and competition that inform every finding below. This section is provided to cover basics and most often pre-purchase conversations, answered from the MMA Primary Research Dataset.

What is the current size of the Pet Market?

The market is valued at USD 310.0 billion in 2025, measured as revenue from goods and services purchased for companion animals across all channels worldwide.

How large will the Pet Market be by 2036?

MMA forecasts USD 576.37 billion by 2036, up from USD 327.98 billion in 2026. That represents incremental revenue of USD 248.39 billion and an expansion multiple of 1.76 times.

What is the CAGR for the Pet Market 2026 to 2036?

The base case CAGR is 5.8%, with a bull case of 7.0% and a bear case of 4.6%. Veterinary spending on an ageing animal population supplies most of that growth.

Which segment is growing fastest?

Veterinary services and pet healthcare grow at 8.7%, half again the market rate of 5.8%, because an ageing animal population meets consolidated clinical pricing power.

Who are the major companies in the Pet Market?

Mars Petcare, Nestle Purina PetCare, Zoetis, Chewy and Colgate-Palmolive lead on category revenue, holding only around 29% between them across what are really four separate industries.

Which country is growing fastest?

India grows fastest at 7.8%, driven by urban ownership rising from a very low base as incomes support animals kept as companions rather than for working purposes.

Report Segmentation Architecture

The full report scope spans multiple orthogonal segmentation dimensions, with cross-tabulated demand data provided for each dimension pair. Coverage extends further to regional breakdowns, trend trajectories, and the competitive detail needed to support segment-level decision-making.

By Category Type

  • Pet Food and Nutrition
  • Veterinary Services and Pet Healthcare
  • Pet Insurance and Health Plans
  • Accessories, Equipment and Durables
  • Grooming, Boarding and Pet Services
  • Pharmaceuticals and Parasiticides

By End-Use Industry

  • Dog Owning Households
  • Cat Owning Households
  • Small Mammal and Bird Owners
  • Aquarium and Reptile Keepers
  • Multi-Pet Households
  • Breeders and Rescue Organisations

By Commercial Dimension

  • Grocery and Mass Retail
  • Specialist Pet Retail
  • Online and Subscription Channels
  • Veterinary Clinic Distribution
  • Direct To Consumer Brands
  • Insurance and Health Plan Sales

By Region

  • North America
  • Western Europe
  • East Asia
  • South Asia and Pacific
  • Latin America
  • Middle East and Africa
  • Eastern Europe

Scope, Methodology, and Coverage

Every figure in this report is reproducible from documented input assumptions. The scope below maps the historical period, the forecast horizon, the segmentation dimensions, and the countries covered, alongside the underlying primary and qualitative methodology.
Historical Period
2020 to 2025
Forecast Period
2026 to 2036
Base Year
2025 (USD billions; MMA Primary Research Dataset, August 2026)
Market Definition
Revenue from goods and services purchased for companion animals, spanning pet food and nutrition, veterinary services and pet healthcare, pet insurance and health plans, accessories, equipment and durables, grooming, boarding and pet services, and pharmaceuticals and parasiticides. Grocery and mass retail, specialist pet retail, online and subscription channels, veterinary clinic distribution, direct to consumer brands and insurance sales are all included. Livestock and production animal products, working animal equipment, live animal sales and breeding operations, and equine products where the animal is kept primarily for sport or work are excluded.
Quantitative Units
USD billions, companion animal goods and services revenue
Segmentation Dimensions
Category type, animal and household type, distribution channel, region
Regions Covered
North America, Western Europe, East Asia, South Asia and Pacific, Latin America, Middle East and Africa, Eastern Europe
Countries Covered
United States, Canada, United Kingdom, Germany, France, Sweden, China, Japan, South Korea, India, Australia, Brazil, Mexico, Poland
Key Companies Profiled
Mars Petcare, Nestle Purina PetCare, Zoetis, Chewy, Colgate-Palmolive, IDEXX Laboratories, Elanco Animal Health, Trupanion, IVC Evidensia, Freshpet
Quantitative Methodology
Primary survey, n=3,800 respondents, Q4 2025, six countries; demand-side model with trade association cross-validation
Qualitative Methodology
47 expert interviews, Q4 2025; applied to validate demand model assumptions, identify emerging dynamics, and assess competitive positioning
Report Format
PDF and XLSX data workbook (Word format preview document)
Publisher
Market Minds Advisory
Report Code
MMA-2026-AGR-151
Published
August 2026
Contact
sales@marketmindsadvisory.com | www.marketmindsadvisory.com

Purchase the full Pet Market Report (2026 to 2036).

The full report addresses what happens to a category when its population stops growing and every point of growth has to come from spending per animal instead. It quantifies veterinary consolidation against clinical pricing and owner affordability, maps insurance penetration as the mechanism determining what owners can actually pay, and assesses the owner relationship as the position that captures spending across four otherwise unrelated businesses. Segment analysis covers all six category types, with particular attention to veterinary services where ageing animals meet consolidated pricing power. Competitive assessment ranks twenty participants on companion animal category revenue.
Six category type segmentation with growth rates
Veterinary consolidation mapped against clinical pricing movement
Twenty participant assessment on companion animal revenue
Insurance penetration assessed as clinical spending capacity
Population saturation separated from competitive share effects
Owner relationship value quantified across all four businesses

Built For The People Who Decide

From boardroom strategy to bench-side execution, this report is read cover-to-cover by leaders shaping the next decade of their industry, turning demand scenarios, market dynamics and valuation benchmarks into decisions.
CXOs/ Presidents/ VPs/ Managers
M&A and Corporate Development
Strategy Teams and R&D Heads
Procurement and Product Directors
Regulatory and Compliance Leaders
Investor Relations and Equity Analysts