Market Minds Advisory
Personal Protective Equipment Market

Personal Protective Equipment Market: Compliance, Certification, and the Respirator Shift

Occupational safety regulators are tightening exposure limits faster than factories can requalify suppliers, pushing buyers toward certified respiratory and chemical protective gear even as glove and fabric input costs swing with rubber pricing.

Lead Analyst

David Horsley

Published

August 2026

Make Smarter Decisions with Customized Research Insights

Request a free sample report and evaluate market opportunities, growth trends, and competitive dynamics relevant to your business needs.

2025 MARKET VALUE$68.0BMarket Size 2025
2036 FORECAST VALUE$140.2BBase Case , 2026 to 2036
CAGR 2026 TO 20366.8 %Bull 8.1% / Bear 5.5%
INCREMENTAL OPPORTUNITY$67.6BNet 10- year value creation
EXPANSION MULTIPLE1.93x2036 value over 2026 base
Strategic Levers
M&A Pipeline
Regional Outlook
Country Rankings
Competitive Intelligence
Segmental Deep-dive
Call-Us : 91 93563 13602

Executive Snapshot and Market Trajectory

Respiratory protection is pulling away from every other PPE category as regulators cut permissible exposure limits for silica, diesel particulate, and industrial dust faster than most manufacturers had planned for this cycle, forcing rapid product requalification across nearly every certified category they currently sell to buyers.
Hand and body protection still carry the largest volume, but respirators and chemical-resistant clothing pull growth fastest as construction, mining, and battery manufacturing all specify stricter exposure controls than five years ago. East Asia manufactures the bulk of global tonnage, while South Asia and Pacific compounds fastest as India's factory safety enforcement and export manufacturing growth pull compliant local production into a market imports alone cannot serve fast enough.
Five suppliers hold a modest quarter of global share, and 3M's certified product breadth across nearly every PPE category has proven durable even against a costly historical liability episode that competitors still reference deliberately in sales conversations with wary institutional buyers. Regulatory exposure limit tightening, nitrile and rubber feedstock volatility, and connected-safety data platforms now decide who wins large industrial contracts faster than any single fabric innovation moving through the category this decade.
Market Definition
The market covers personal protective equipment worn by workers to reduce exposure to physical, chemical, biological, and respiratory hazards, spanning head, eye and face, hearing, respiratory, hand, body, and foot protection sold to industrial, construction, healthcare, and government buyers. Medical-grade single-use PPE sold exclusively through hospital procurement channels and military-specific combat gear are excluded.
Base Year Value
$68.0B in 2025 (MMA Primary Research Dataset, August 2026)
Forecast Period
2026 to 2036, eleven discrete annual values
CAGR
6.8% base case. Bull 8.1%. Bear 5.5%.
Fastest Growth Segment
Respiratory Protection Equipment: 9.5% CAGR
Fastest Growth Country
India: 11.5% CAGR
Fastest Growth Region
South Asia and Pacific: 8.9% CAGR
Largest Region
East Asia: 30% of 2025 global value
Market Leaders
3M Company, Honeywell International Inc., MSA Safety Incorporated, Ansell Limited, DuPont de Nemours Inc. Source: MMA Analysis based on company annual reports.
Primary Survey
n=3,800 procurement and R&D decision-makers, Q4 2025, six countries
Methodology
Demand-side build-up, cross-validated against public data, 47 expert interviews

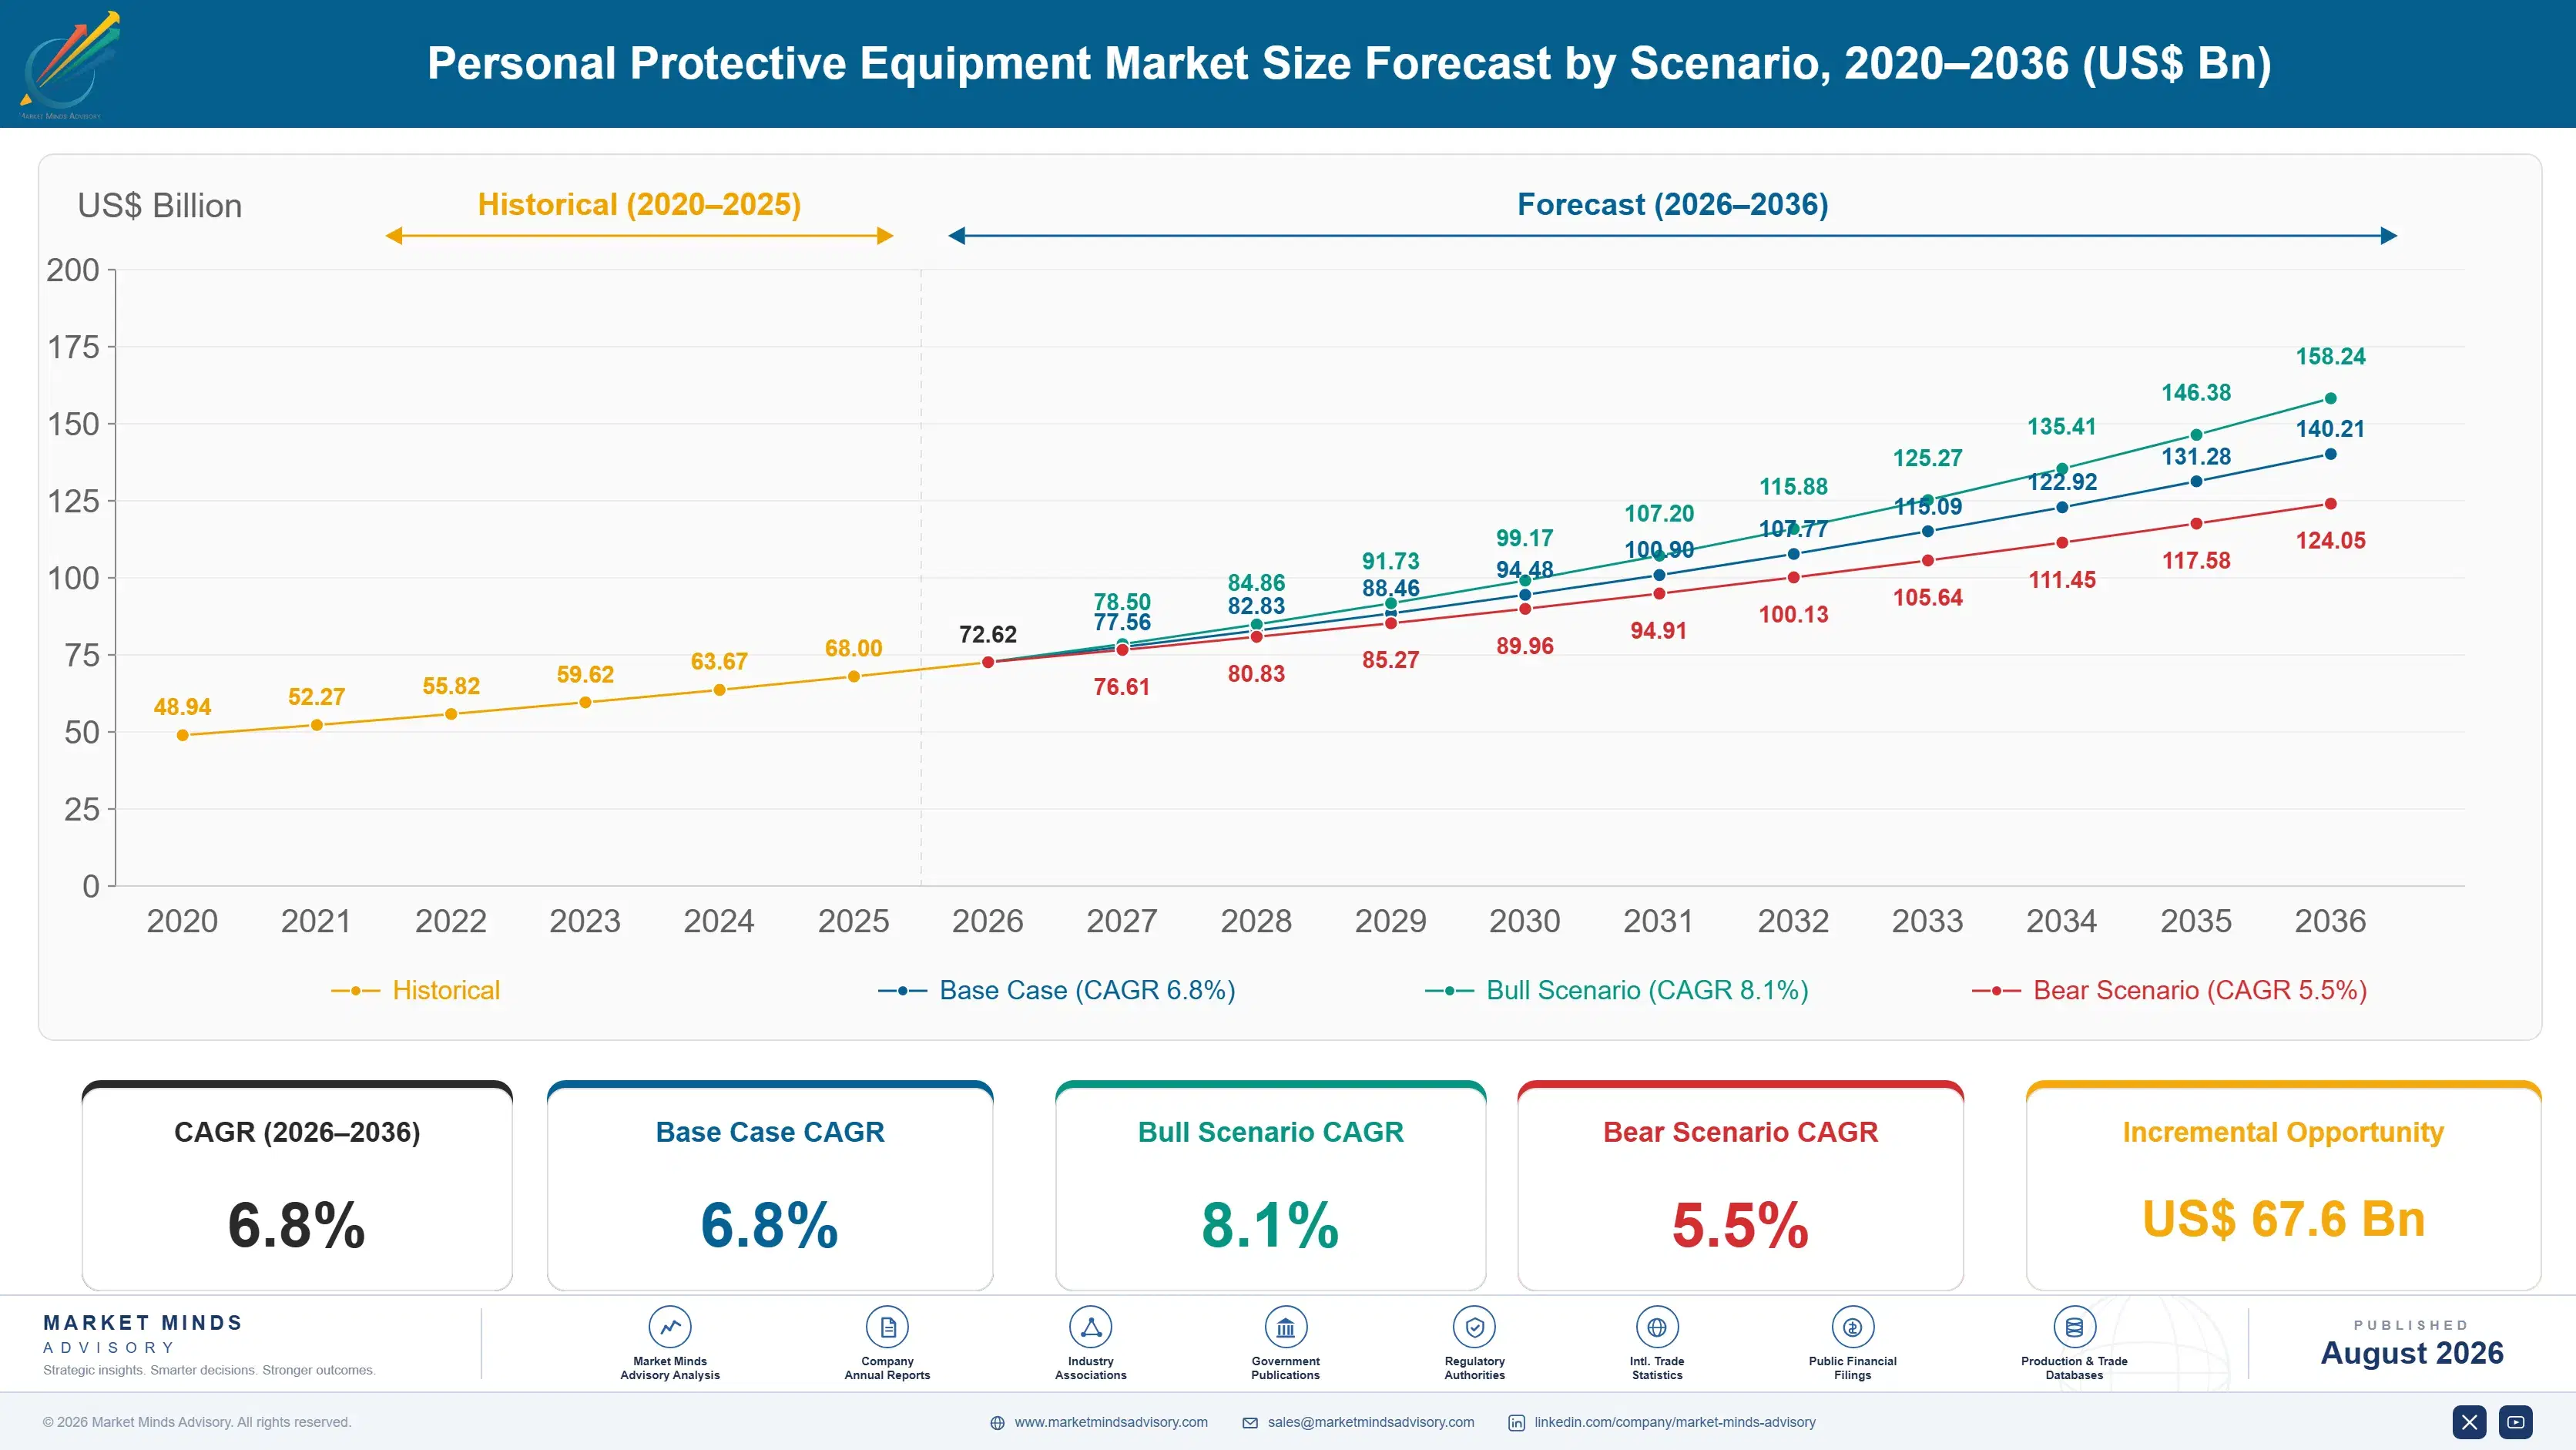
Personal Protective Equipment Market Forecast Scenarios

personal-protective-equipment-market-size-forecast-scenario-1787300137099
Global PPE demand grew near 5.6% annually between 2020 and 2025, distorted by an extraordinary 2020 to 2021 pandemic surge in respiratory and single-use protection before normalising sharply as inventories corrected across most distribution channels. Industrial and construction demand resumed steadier growth through the back half of the period as pandemic-driven volatility faded from year-over-year comparisons.
The base case reaches 6.8% on three mechanisms. First, tightening occupational exposure limits for silica, diesel particulate, and industrial chemicals push buyers toward certified respiratory and chemical-resistant categories that carry higher unit prices. Second, construction and mining capital spending across South Asia and the Gulf sustains steady volume growth in hand and body protection. Third, connected-safety platforms bundling sensors into PPE add a data-service revenue layer that pure equipment sales did not previously capture.
The bull case at 8.1% assumes exposure limit tightening accelerates faster than modelled across multiple jurisdictions simultaneously and connected-safety adoption scales faster than expected among large industrial buyers. The bear case at 5.5% assumes industrial capital spending slows amid a broader manufacturing downturn and nitrile feedstock costs stay elevated enough to compress replacement-cycle purchasing among cost-sensitive buyers this decade.

Compliance Economics Behind the Respirator Shift

PPE behaves like a compliance tax that buyers resent paying until an incident makes the cost of not paying obvious to management and the board. Commodity gloves and eyewear compete on unit price and distribution reach, while certified respiratory and chemical-resistant categories compete on regulatory approval and fit-testing infrastructure that smaller suppliers cannot easily replicate at scale across multiple certification regimes simultaneously.
CR5 CONCENTRATION24%Top five suppliers hold a modest combined market share
AVERAGE SELLING PRICEUSD 4.80 per unitBlended price across all protection categories globally today
LEADING PRODUCING COUNTRYChina, 34% shareOne country dominates global PPE manufacturing capacity broadly
REPLACEMENT CYCLE LENGTH3 to 9 monthsTypical reorder interval varies sharply by protection category
TRADE INTENSITY29% cross-borderA meaningful share of finished units crosses a border
NITRILE SHARE OF COGS22-28%Glove feedstock dominates hand protection production cost structure
Commercial activity concentrates around certification breadth and distribution density rather than fabric innovation alone. Suppliers that hold NIOSH, EN, and equivalent certifications across the widest category range win large industrial contracts that single-category specialists increasingly cannot bid for as procurement teams consolidate vendor lists to reduce audit burden and simplify multi-site compliance reporting across their full operating footprint.
Over the next decade, exposure limit rulemaking in Washington, Brussels, and New Delhi will matter more than any single fabric or fit innovation introduced this cycle. Nitrile feedstock pricing, connected-safety data adoption, and vendor consolidation will decide who captures the next wave of large industrial contracts before buyers lock multi-year supply agreements with a shrinking, more consolidated group of certified suppliers across every region this report tracks.
"Buyers do not budget for PPE, they budget for the audit that follows an incident. That is why certification breadth beats fabric innovation every time procurement actually decides."
Director, Industrial Safety and Compliance Practice · MMA Industrial Safety and

Market Trends

Silica Exposure Limit Tightening Forces Respirator Requalification

OSHA's respirable crystalline silica standard, enforced more aggressively since 2023 inspections targeting construction and foundry operations, has cut the permissible exposure limit to a fraction of the previous threshold, forcing many sites to move from disposable dust masks to powered air-purifying respirators. The European Union's parallel Carcinogens and Mutagens Directive amendment extended similar limits across member states through 2024 and 2025. Manufacturers report powered respirator orders growing faster than any other category as compliance officers reclassify silica-generating tasks that previously qualified for lighter protection under older, looser exposure assumptions entirely.
Market Impact: Raises compliant demand 4.2 million
Connected Safety Platforms Bundle Sensors Into Standard Gear

Honeywell, 3M, and MSA Safety have all launched connected-safety product lines embedding gas, fall, and biometric sensors directly into helmets, harnesses, and respirators, feeding real-time data into enterprise safety management platforms. Large mining and oil and gas operators have begun specifying connected PPE in procurement tenders explicitly, treating the data layer as a genuine risk-management tool rather than a novelty feature. This shift converts equipment sales into subscription-adjacent relationships, since the sensor data platform typically carries an ongoing licensing fee that recurs annually regardless of physical unit replacement cycles industry-wide.
Market Impact: Adds 3,200 units per fab

Market Opportunities and Growth Drivers

Global Occupational Exposure Limits Keep Tightening Across Jurisdictions

Regulators in the United States, European Union, and India have all lowered permissible exposure limits for silica, diesel particulate, and industrial solvents across multiple rulemakings since 2022, each requiring buyers to upgrade from basic to certified protection categories. India's factory inspectorate reforms alone brought thousands of previously unregistered facilities under formal safety compliance requirements for the first time. This regulatory tightening operates independently of economic cycles, since compliance deadlines do not pause for a slowing industrial capex environment, giving PPE suppliers a demand floor that construction equipment and industrial machinery manufacturers do not enjoy.
Market Impact: Swings glove input cost 60%

Battery And Semiconductor Fabs Specify Chemical-Resistant Protection

Battery gigafactory and semiconductor fabrication plant construction, expanding rapidly across the United States, India, and Southeast Asia under domestic manufacturing incentive programmes, requires chemical-resistant suits, respirators, and cleanroom-compatible protective gear at volumes construction PPE buyers rarely specify. Each new fab typically requires several thousand certified protective garments annually for both construction workers and eventual plant operators handling hazardous electrolyte and etching chemicals. This is a genuinely new demand pool layered on top of traditional industrial buyers, and suppliers with cleanroom-certified product lines are capturing outsized share of this specific growth segment.
Market Impact: Adds 8 to 14 months

Market Restraints and Challenges

Nitrile Feedstock Volatility Compresses Glove Manufacturer Margins

Nitrile butadiene rubber prices swung by more than 60% between 2021 and 2023, driven by acrylonitrile feedstock shortages following a 2021 Texas winter storm that shut Gulf Coast petrochemical capacity for weeks. The root cause is thin global acrylonitrile production capacity concentrated among a handful of producers, leaving glove manufacturers with little supplier diversification to fall back on during a shock. Malaysian and Thai glove makers, who supply most of the world's nitrile examination and industrial gloves, absorbed significant margin compression during the spike. Several manufacturers are now qualifying alternative elastomer blends to reduce single-feedstock dependence going forward.
Market Impact: Lifts respirator orders by 28% yearly

Fragmented Regional Certification Standards Slow Product Launches

PPE certification requirements differ meaningfully across NIOSH, EN, GB, and other national standards bodies, each demanding separate testing, documentation, and periodic recertification for functionally similar products sold in different markets. The root cause is genuine historical divergence in national safety philosophy and testing methodology that harmonisation efforts have not fully resolved despite decades of trade discussion. This forces suppliers to either maintain separate product lines per region or absorb the cost and delay of multi-standard certification before launching new protective categories. Larger suppliers are responding by front-loading multi-standard certification into product development rather than sequencing it market by market.
Market Impact: Adds 15% subscription-linked revenue share
3 additional market trends, 4 additional growth drivers, and 2 additional restraints and challenges are covered in the full report. Contact sales@marketmindsadvisory.com to access the complete intelligence.

Segment CAGR and Growth Architecture

Segmentation follows protection category, a single classification logic grounded in the body zone and hazard type each product addresses, from respiratory filtration to chemical-resistant fabric protection systems. Each category carries its own certification standard, fit-testing requirement, and replacement cycle, so commercial position tracks hazard type rather than end-use industry, covered separately in the framework.
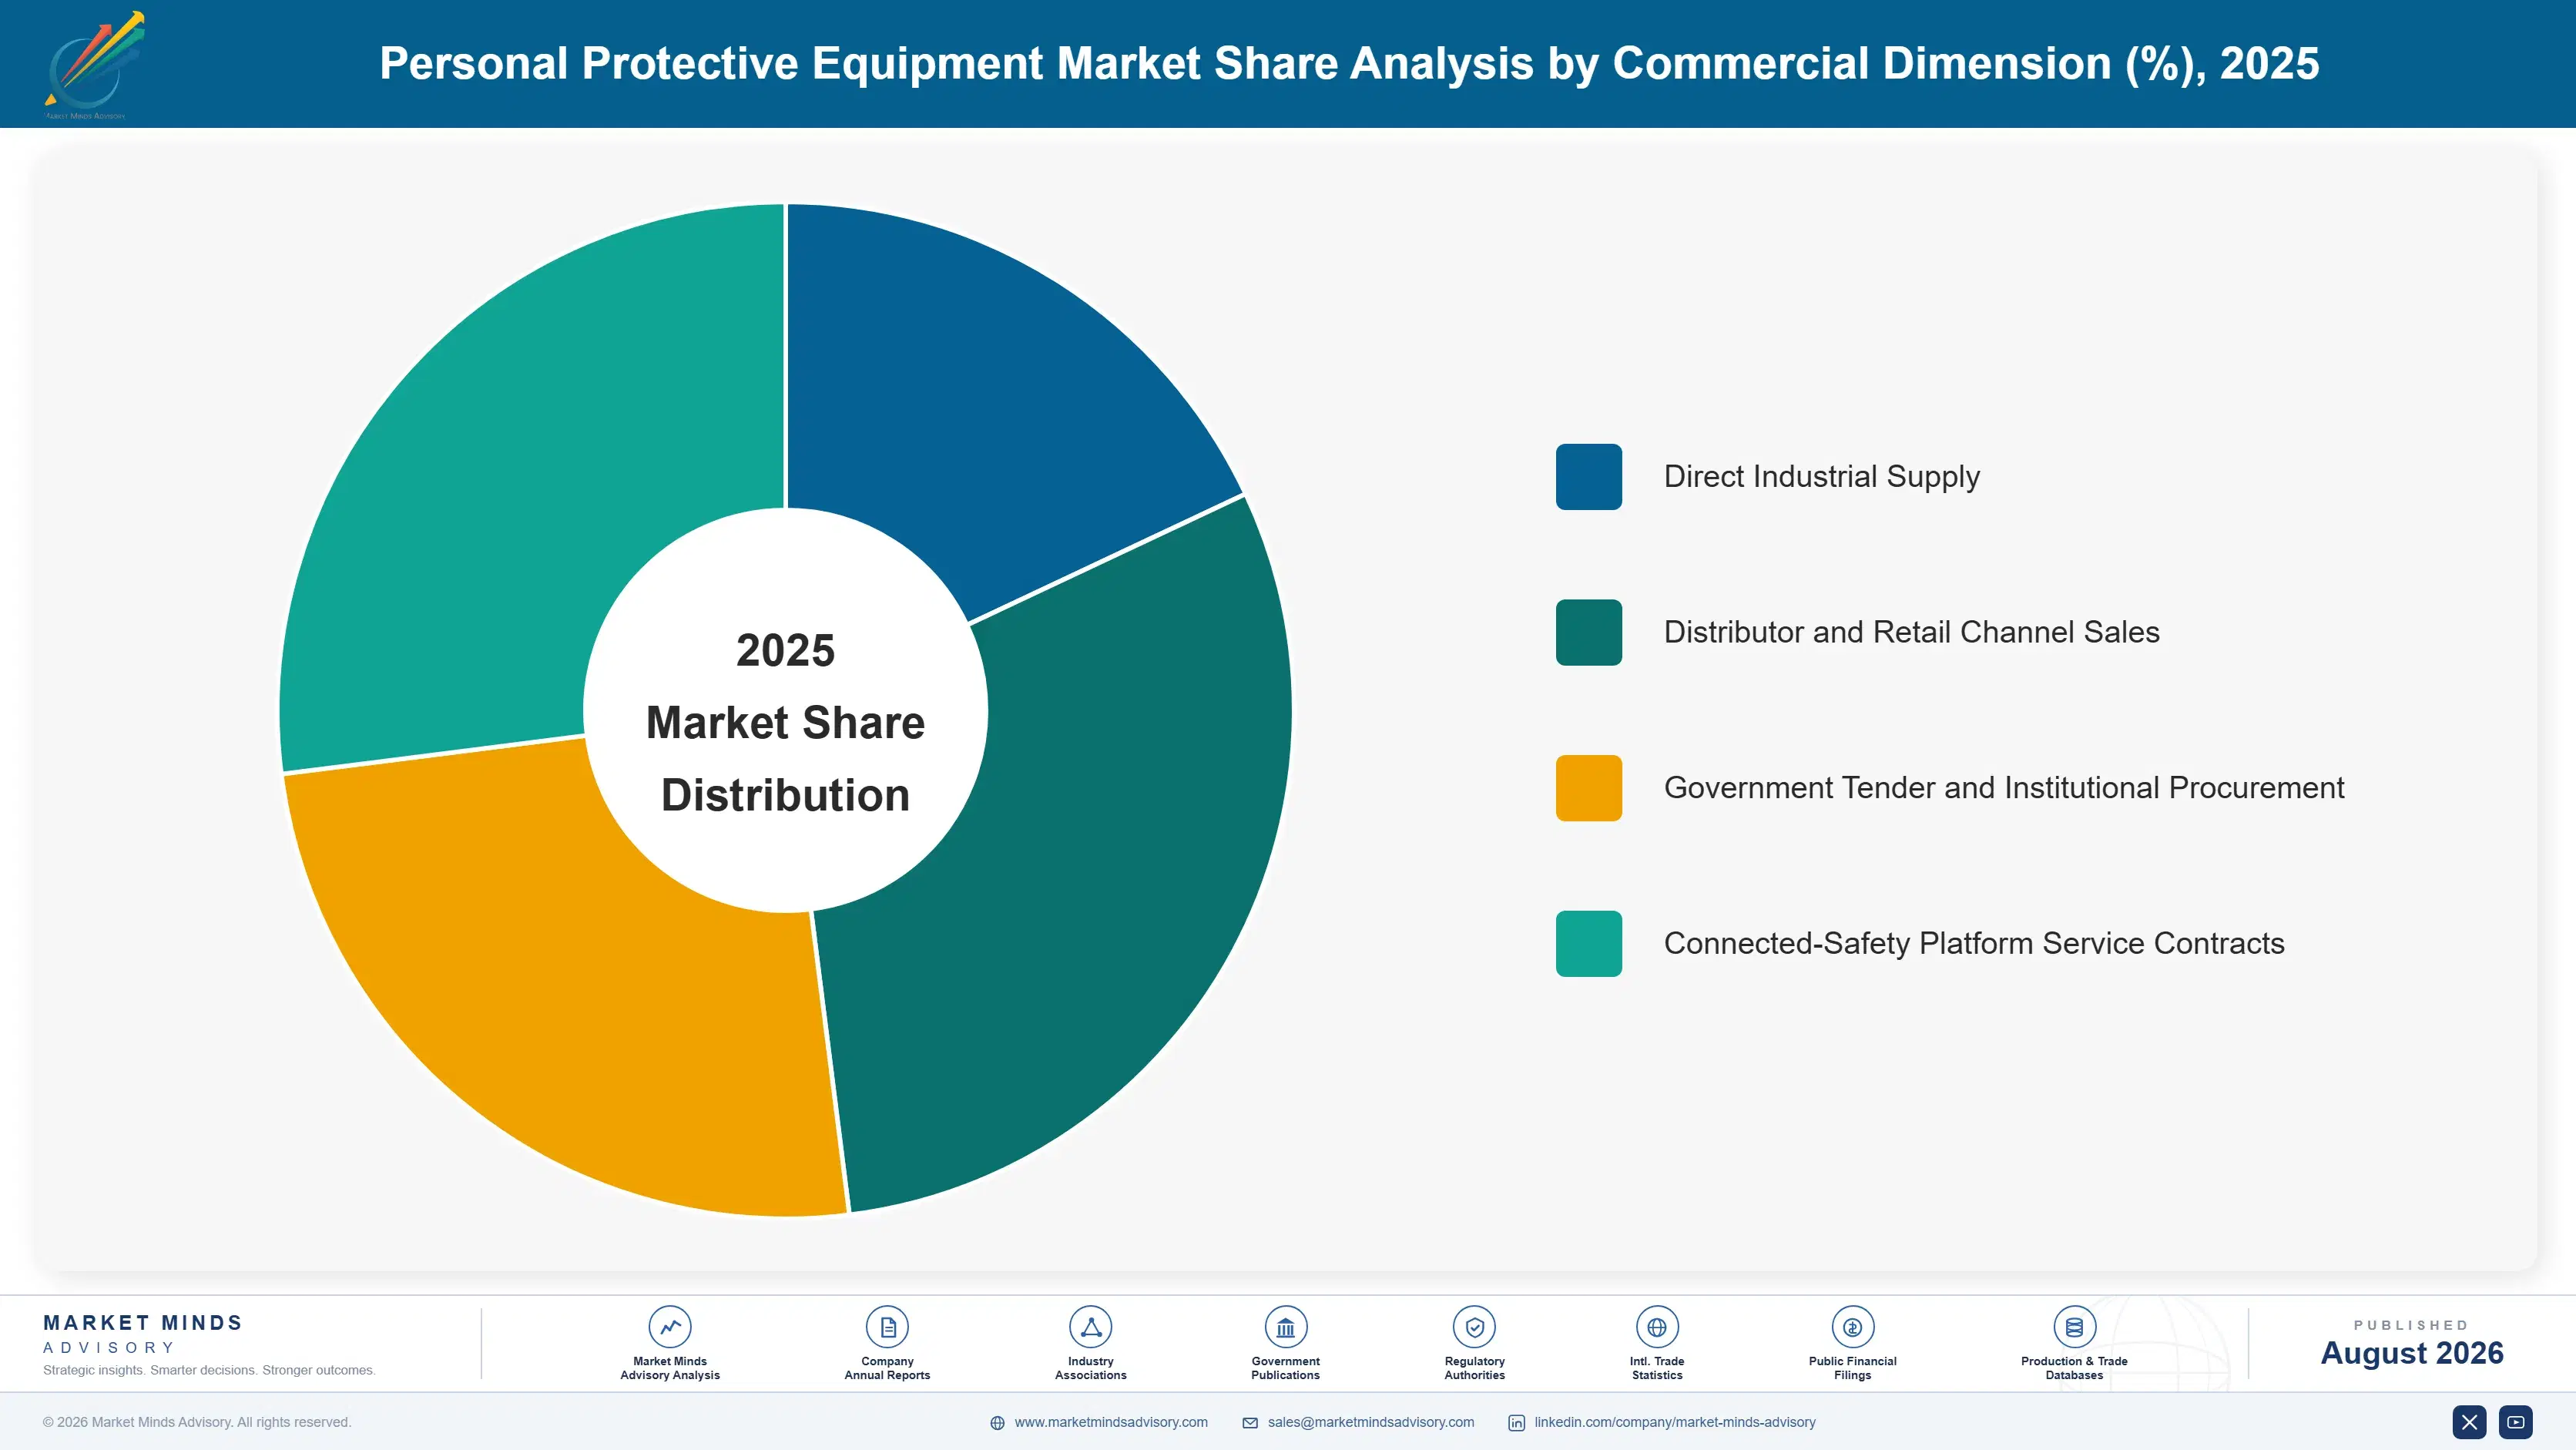
personal-protective-equipment-market-market-share-analysis-1787300137633

Respiratory Protection Equipment

Respiratory protection grows fastest at 9.5%, about 1.40 times the overall 6.8% rate, as tightening silica, diesel particulate, and industrial chemical exposure limits push buyers from disposable dust masks toward powered air-purifying and supplied-air respirators. Fit-testing requirements and NIOSH or EN certification create a genuine barrier that commodity mask makers cannot cross without significant investment in testing infrastructure and regulatory documentation. 3M, Honeywell, and MSA Safety dominate the certified segment specifically, while a long tail of uncertified disposable mask suppliers competes only in markets with weaker enforcement. Connected-safety sensor integration is now concentrating almost entirely within this category, adding a recurring data-service revenue layer that other protection categories have not yet developed at comparable scale.
CAGR 9.5%

Protective Clothing

Protective clothing grows second-fastest at 8.2%, driven by chemical, thermal, and high-visibility hazard categories that construction, battery manufacturing, and oil and gas buyers increasingly specify by certified standard rather than generic coverall. DuPont's Tyvek franchise anchors the chemical-resistant category specifically, while flame-resistant and arc-rated garments serve utility and oil and gas workers facing thermal hazard exposure. Battery gigafactory construction has created a genuinely new demand pool for cleanroom-compatible chemical suits that did not exist at meaningful scale five years ago. Replacement cycles run shorter than durable equipment categories, since single-use and limited-reuse garments dominate chemical-resistant applications specifically, giving this category a steadier recurring order pattern than helmet or eyewear categories typically see.
CAGR 8.2%
Full segment breakdown across 6 segments available in the complete report.

Regional Architecture and Country Demand Map

Seven regions divide between manufacturing scale and enforcement intensity rather than following each other closely. East Asia manufactures the largest volume on Chinese capacity, while South Asia and Pacific compounds fastest as India's factory safety enforcement pulls compliant local production into a market imports increasingly cannot serve.

North America

OSHA's enforcement intensity, now running well above its pre-pandemic inspection pace across construction and manufacturing sites, keeps North America the highest per-worker PPE spend anywhere despite its comparatively modest manufacturing base relative to Asia. Large industrial buyers increasingly specify connected-safety respirators and harnesses in procurement tenders, a category where Honeywell and MSA Safety hold entrenched enterprise relationships that smaller suppliers cannot easily displace at scale. Silica exposure rulemaking targeting construction and foundry operations has pulled a wave of respirator upgrades forward across multiple states since 2023. Growth trails East Asia and South Asia because the market is already mature and enforcement-driven upgrades, while steady, do not compound the way new manufacturing capacity does elsewhere in faster-growing regions.
Share: 25% | CAGR: 6.5% (2026 to 2036)

Western Europe

The EU's PPE Regulation 2016/425 sets a uniform CE marking standard across member states, and REACH chemical restrictions on flame retardants and coatings have forced several fabric reformulations that only larger, better-capitalised suppliers could absorb without meaningful business disruption. Germany and France anchor demand through automotive and chemical processing safety programmes that track industrial output rather than construction cycles specifically. Uvex and Delta Plus, both regionally headquartered, compete on certification depth against imported Asian product in commodity categories where price competition runs hardest. Growth trails East Asia and South Asia and Pacific because the market is mature, regulation is already comprehensive, and incremental compliance tightening moves slower than in still-formalising markets elsewhere.
Share: 20% | CAGR: 5.3% (2026 to 2036)
Regional intelligence for 5 additional markets available in the complete report: East Asia, South Asia and Pacific, Latin America, Middle East and Africa, Eastern Europe. Contact sales@marketmindsadvisory.com.
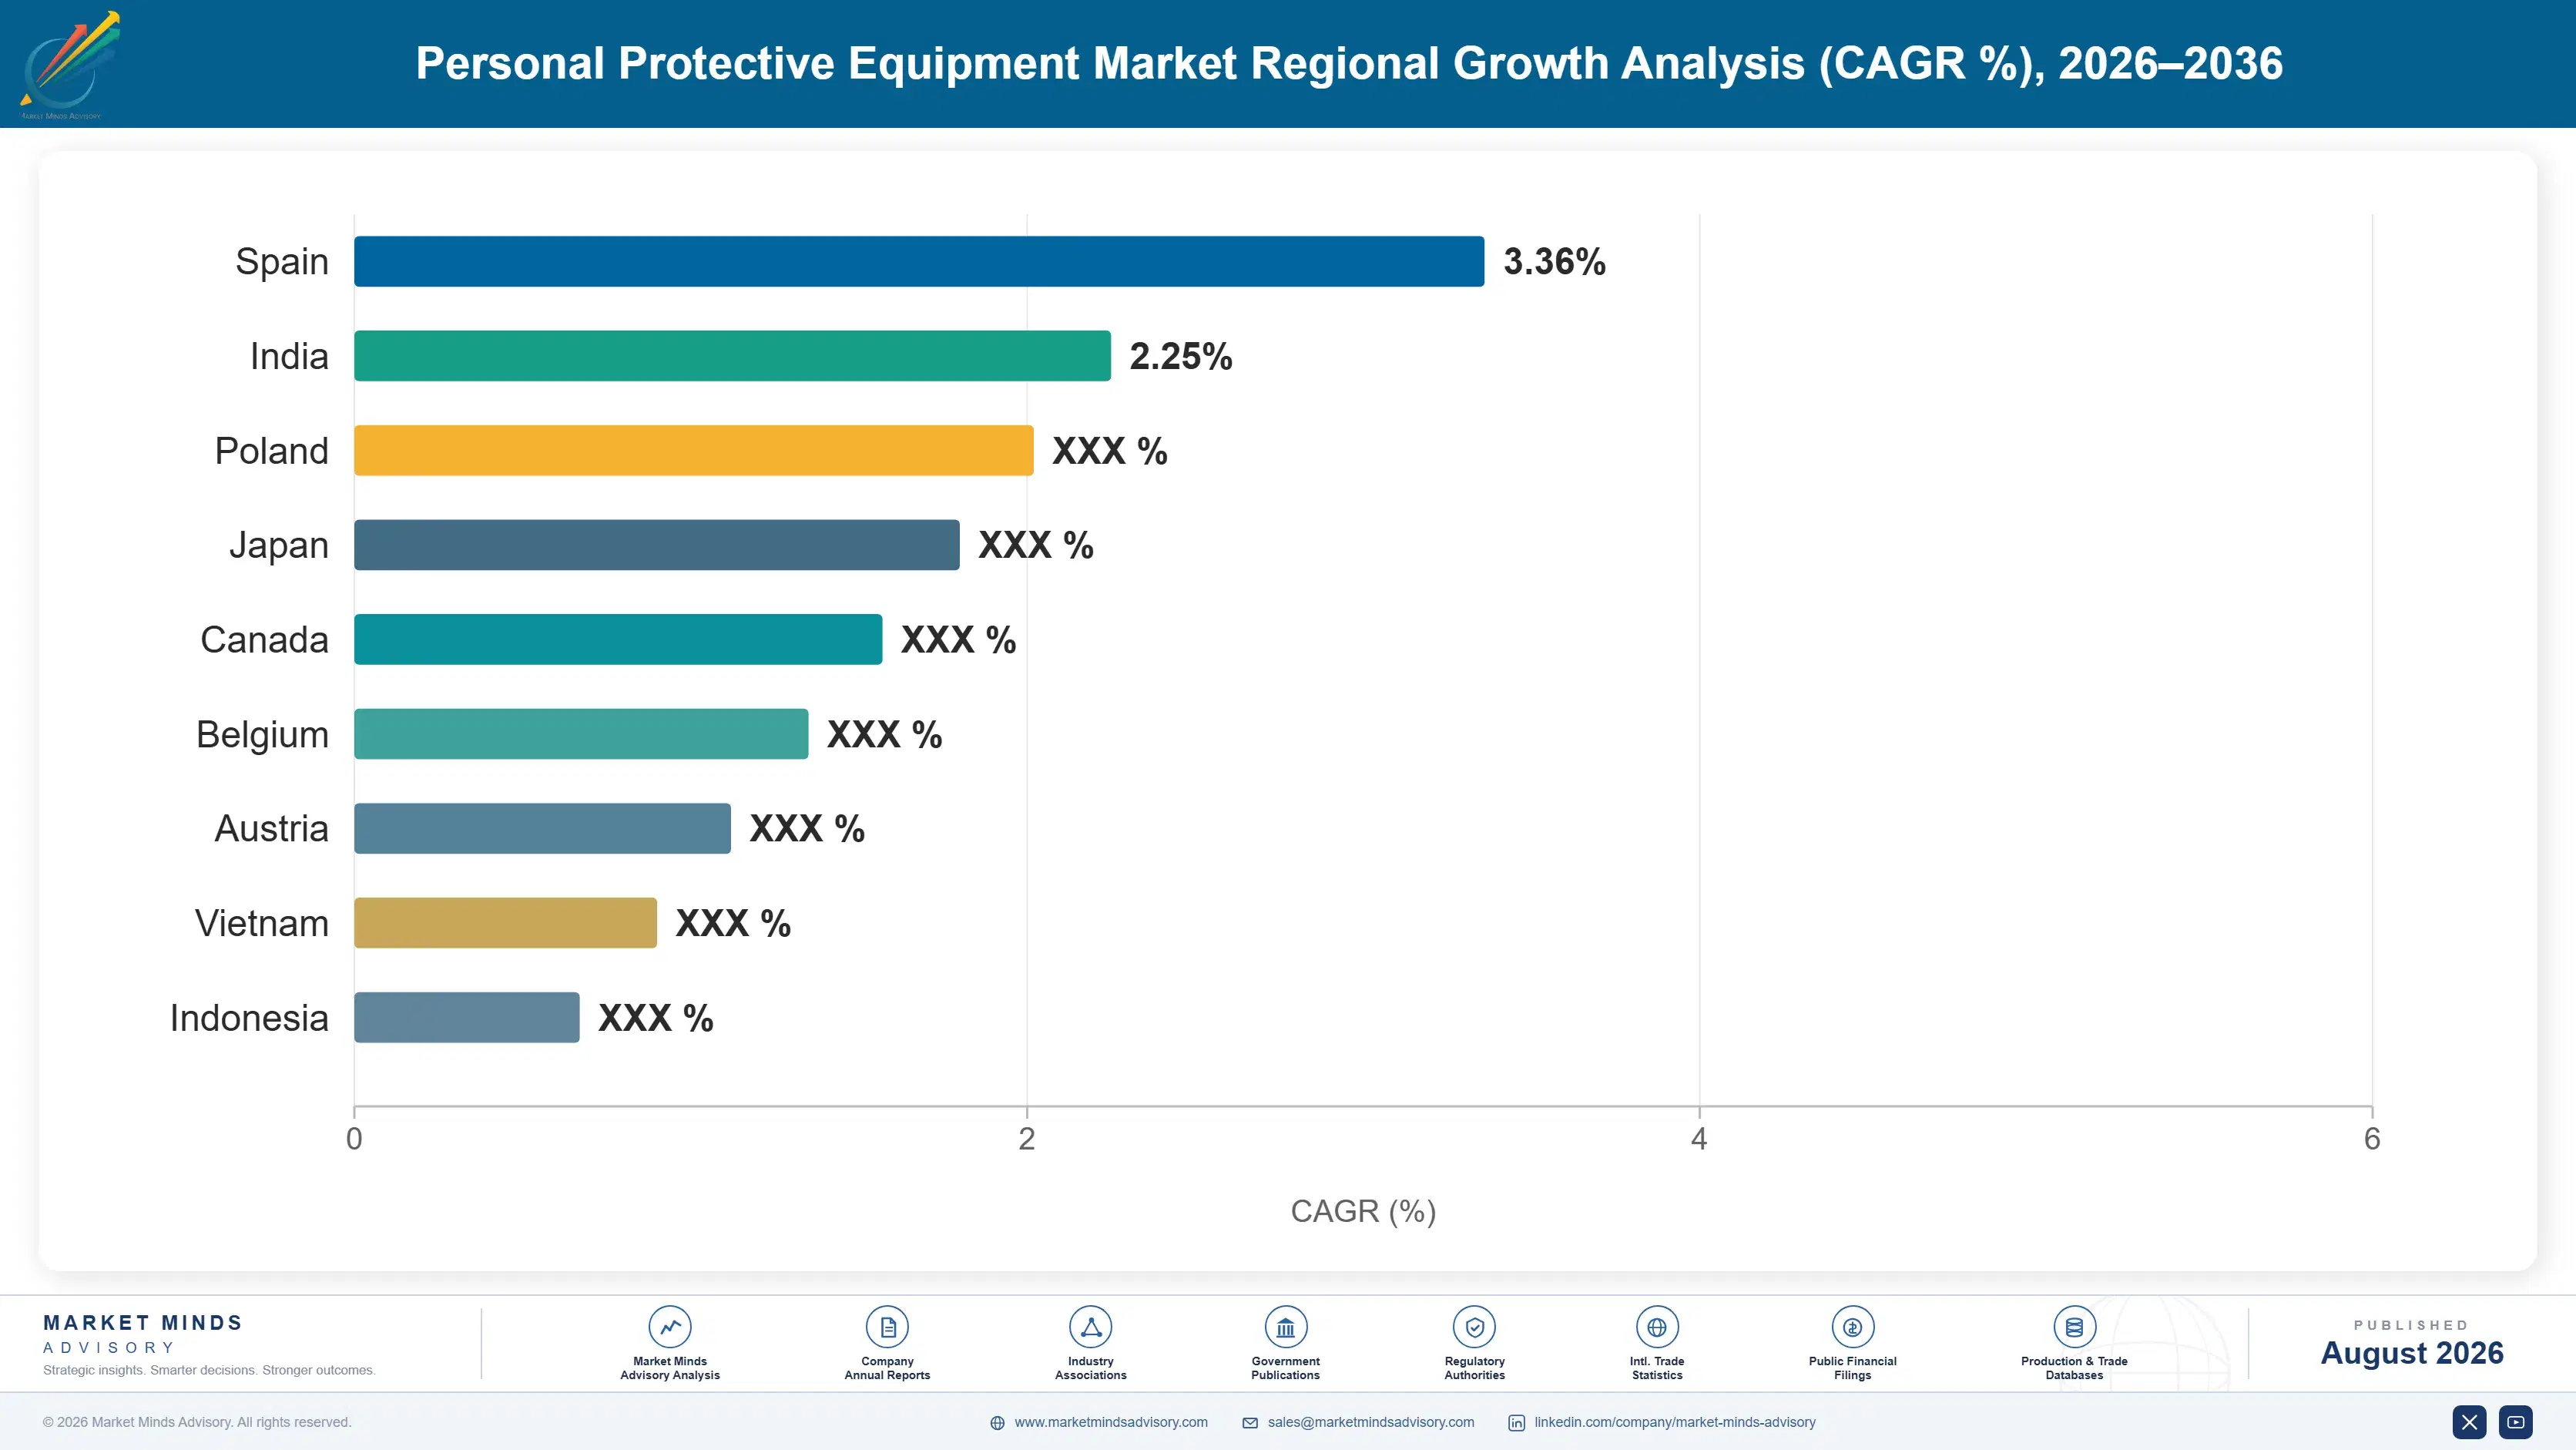
personal-protective-equipment-market-country-cagr-analysis-1787300138140

Where PPE Suppliers Can Capture More Margin

Margin in this market concentrates where certification breadth, data services, and contract structure protect a supplier from feedstock volatility and commodity competition simultaneously across the full multi-year buyer relationship lifecycle. The four moves below shift revenue toward buyers who consistently pay for compliance certainty and consolidation rather than PPE priced purely off unit cost.

Bundle Connected-Safety Data Subscriptions With Hardware Sales

Sensor-embedded respirators, harnesses, and helmets feeding real-time data into enterprise safety platforms convert a one-time equipment sale into a recurring subscription relationship worth roughly 15% to 20% of total contract value annually. Large mining and oil and gas operators are already specifying this bundled model explicitly in procurement tenders, treating the data layer as a genuine risk-management tool rather than a novelty add-on. Suppliers without a connected-safety platform now compete purely on hardware price against rivals earning a durable annuity layer most equipment-only competitors cannot easily replicate without years of platform development investment.
Market Impact: Adds 15% to 20% recurring subscription revenue annually

Qualify Multi-Standard Certification To Access Cross-Border Tenders

Maintaining simultaneous NIOSH, EN, and GB certification across a product line, rather than sequencing markets one at a time, lets suppliers bid multinational industrial tenders that single-standard competitors cannot enter at all regardless of price offered. The upfront certification investment runs into seven figures per product family, but it opens roughly 30% more addressable tender volume for large multinational industrial and mining accounts that consolidate PPE procurement across every operating geography. Suppliers that front-loaded multi-standard certification are already winning global framework agreements that single-market specialists are simply unable to compete for under current tender rules.
Market Impact: Opens roughly 30% more addressable global tender volume

Build Vendor Consolidation Programmes For Large Industrial Accounts

Large industrial buyers increasingly consolidate PPE procurement to a small number of certified vendors specifically to reduce audit burden and simplify multi-site compliance reporting across dozens or hundreds of facilities simultaneously. Suppliers offering single-vendor programmes spanning respiratory, hand, body, and head protection capture roughly 25% to 35% more wallet share per account than category specialists competing site by site. This consolidation trend rewards suppliers with the broadest certified category range, since a buyer standardising vendors weighs breadth as heavily as unit price once the audit and reporting burden reduction is properly quantified against switching cost.
Market Impact: Captures 25% to 35% more account wallet share

Diversify Glove Feedstock To Defend Margin Against Nitrile Swings

Nitrile butadiene rubber price swings exceeding 60% within a two-year window have repeatedly compressed glove manufacturer margins for suppliers holding no feedstock alternative to fall back on during a genuine supply shock event affecting the whole industry at once. Qualifying alternative elastomer blends and diversifying acrylonitrile sourcing across multiple regional suppliers reduces single-feedstock exposure that squeezed margins hardest during the 2021 to 2023 spike specifically across nearly every glove manufacturer. Manufacturers that diversified early avoided roughly 12% to 18% of the margin compression that single-source competitors absorbed during that same volatile period.
Market Impact: Avoids 12% to 18% of margin compression annually

Who Controls the Margin Pool

Concentration is modest at CR5 24%, assessed on revenue across certified protection categories, and the gap between leader and challenger reflects certification breadth more than manufacturing scale. 3M's product range spans nearly every category, a position Honeywell has matched only by building comparable breadth deliberately over multiple recent years.
Three dimensions define current activity. Connected-safety platform investment continues as leading suppliers embed sensors into standard gear to capture recurring data-service revenue that pure hardware sales cannot provide. Multi-standard certification racing is accelerating, as suppliers front-load NIOSH, EN, and GB approval to bid multinational tenders single-standard rivals cannot enter. Vendor consolidation programmes keep advancing too, as large industrial buyers narrow their supplier lists to reduce audit burden across every facility they operate.

Pressure is building from two directions at once. Regional glove and mask manufacturers in China and Southeast Asia are exporting aggressively into commodity categories, testing pricing discipline everywhere certification requirements are lighter. Meanwhile large industrial buyers keep consolidating vendor lists toward the broadest certified suppliers, squeezing single-category specialists out of large contracts entirely. Rankings will shift toward suppliers combining certification breadth with genuine data-service revenue, not toward whoever ships the most commodity units globally.
personal-protective-equipment-market-company-positioning-matrix-1787300138652

Competitive Moat and Risk Dimensions

3M COMPANY

Moat: Broad Certified Product Portfolio

3M's certification spans nearly every protection category, from respirators to hearing and eye protection, letting large industrial buyers consolidate almost their entire PPE spend with one single trusted vendor. That breadth advantage compounds as more buyers actively pursue vendor consolidation to reduce audit burden across sites.
3M COMPANY

Risk: Historical Product Liability Exposure

3M's costly settlement over defective military earplugs, resolved for billions of dollars in 2023, remains a live reference point competitors raise deliberately in competitive sales conversations with cautious institutional buyers. Any future product defect claim would face heightened scrutiny given that recent litigation history specifically.
HONEYWELL INTERNATIONAL INC.

Moat: Connected Safety Data Platform

Honeywell's enterprise safety data platform, integrating sensor-equipped PPE with plant-wide industrial IoT systems, gives it a genuine software layer competitors selling hardware alone cannot easily replicate without years of platform development investment. Large industrial accounts increasingly standardise on the platform once integrated into daily operations.
HONEYWELL INTERNATIONAL INC.

Risk: Industrial Capex Cycle Dependency

A meaningful share of Honeywell's PPE revenue ties to large industrial and manufacturing capital spending cycles that slow during broader economic downturns, unlike pure regulatory-compliance-driven demand that persists regardless of capex conditions. A prolonged industrial slowdown would compress this segment faster than compliance-driven competitors would feel it.

Players Tracked

Prominent Players

3M Company
Honeywell International Inc.
MSA Safety Incorporated
Ansell Limited
DuPont de Nemours Inc.

Other Key Players

Kimberly-Clark Corporation
Lakeland Industries Inc.
Alpha Pro Tech Ltd.
Uvex Group
JSP Limited
Delta Plus Group
Bolle Safety
Mallcom (India) Limited
Radians Inc.
Ergodyne
Sioen Industries NV
Supermax Corporation Berhad
Top Glove Corporation Bhd
Cordova Safety Products
Blauer Manufacturing Company

Recent Developments

FEBRUARY 2026

3M launches dual-certified powered respirator line

3M launched an expanded line of powered air-purifying respirators certified under both updated NIOSH and EN standards simultaneously, targeting the surge in demand from construction and foundry operators upgrading compliance following tightened silica exposure limit enforcement across multiple jurisdictions since 2023, including several new US states.
Signal: A product launch, not an acquisition, signals 3M defending its certification breadth lead against Honeywell's platform push.
SEPTEMBER 2025

OSHA finalizes updated silica standard enforcement guidance

The US Occupational Safety and Health Administration finalized updated enforcement guidance for its respirable crystalline silica standard, directing inspectors toward construction and foundry sites with elevated exposure risk and clarifying compliance documentation requirements that had created ambiguity since the original 2016 rule took effect nationally.
Signal: A regulatory clarification, not a corporate transaction, removes ambiguity that had slowed some buyers' compliance upgrade decisions.
JUNE 2025

Honeywell signs mining connected-safety platform agreement

Honeywell signed a multi-year connected-safety platform agreement with a major North American mining operator, embedding sensor-equipped respirators and gas monitors across the client's full underground and surface operations under a recurring annual data-service subscription structure covering several thousand workers across multiple active mine sites nationally.
Signal: A platform services agreement, not a joint venture, extends Honeywell's recurring revenue base within an existing large account.

Nitrile, Nonwoven Fabric, and Cost

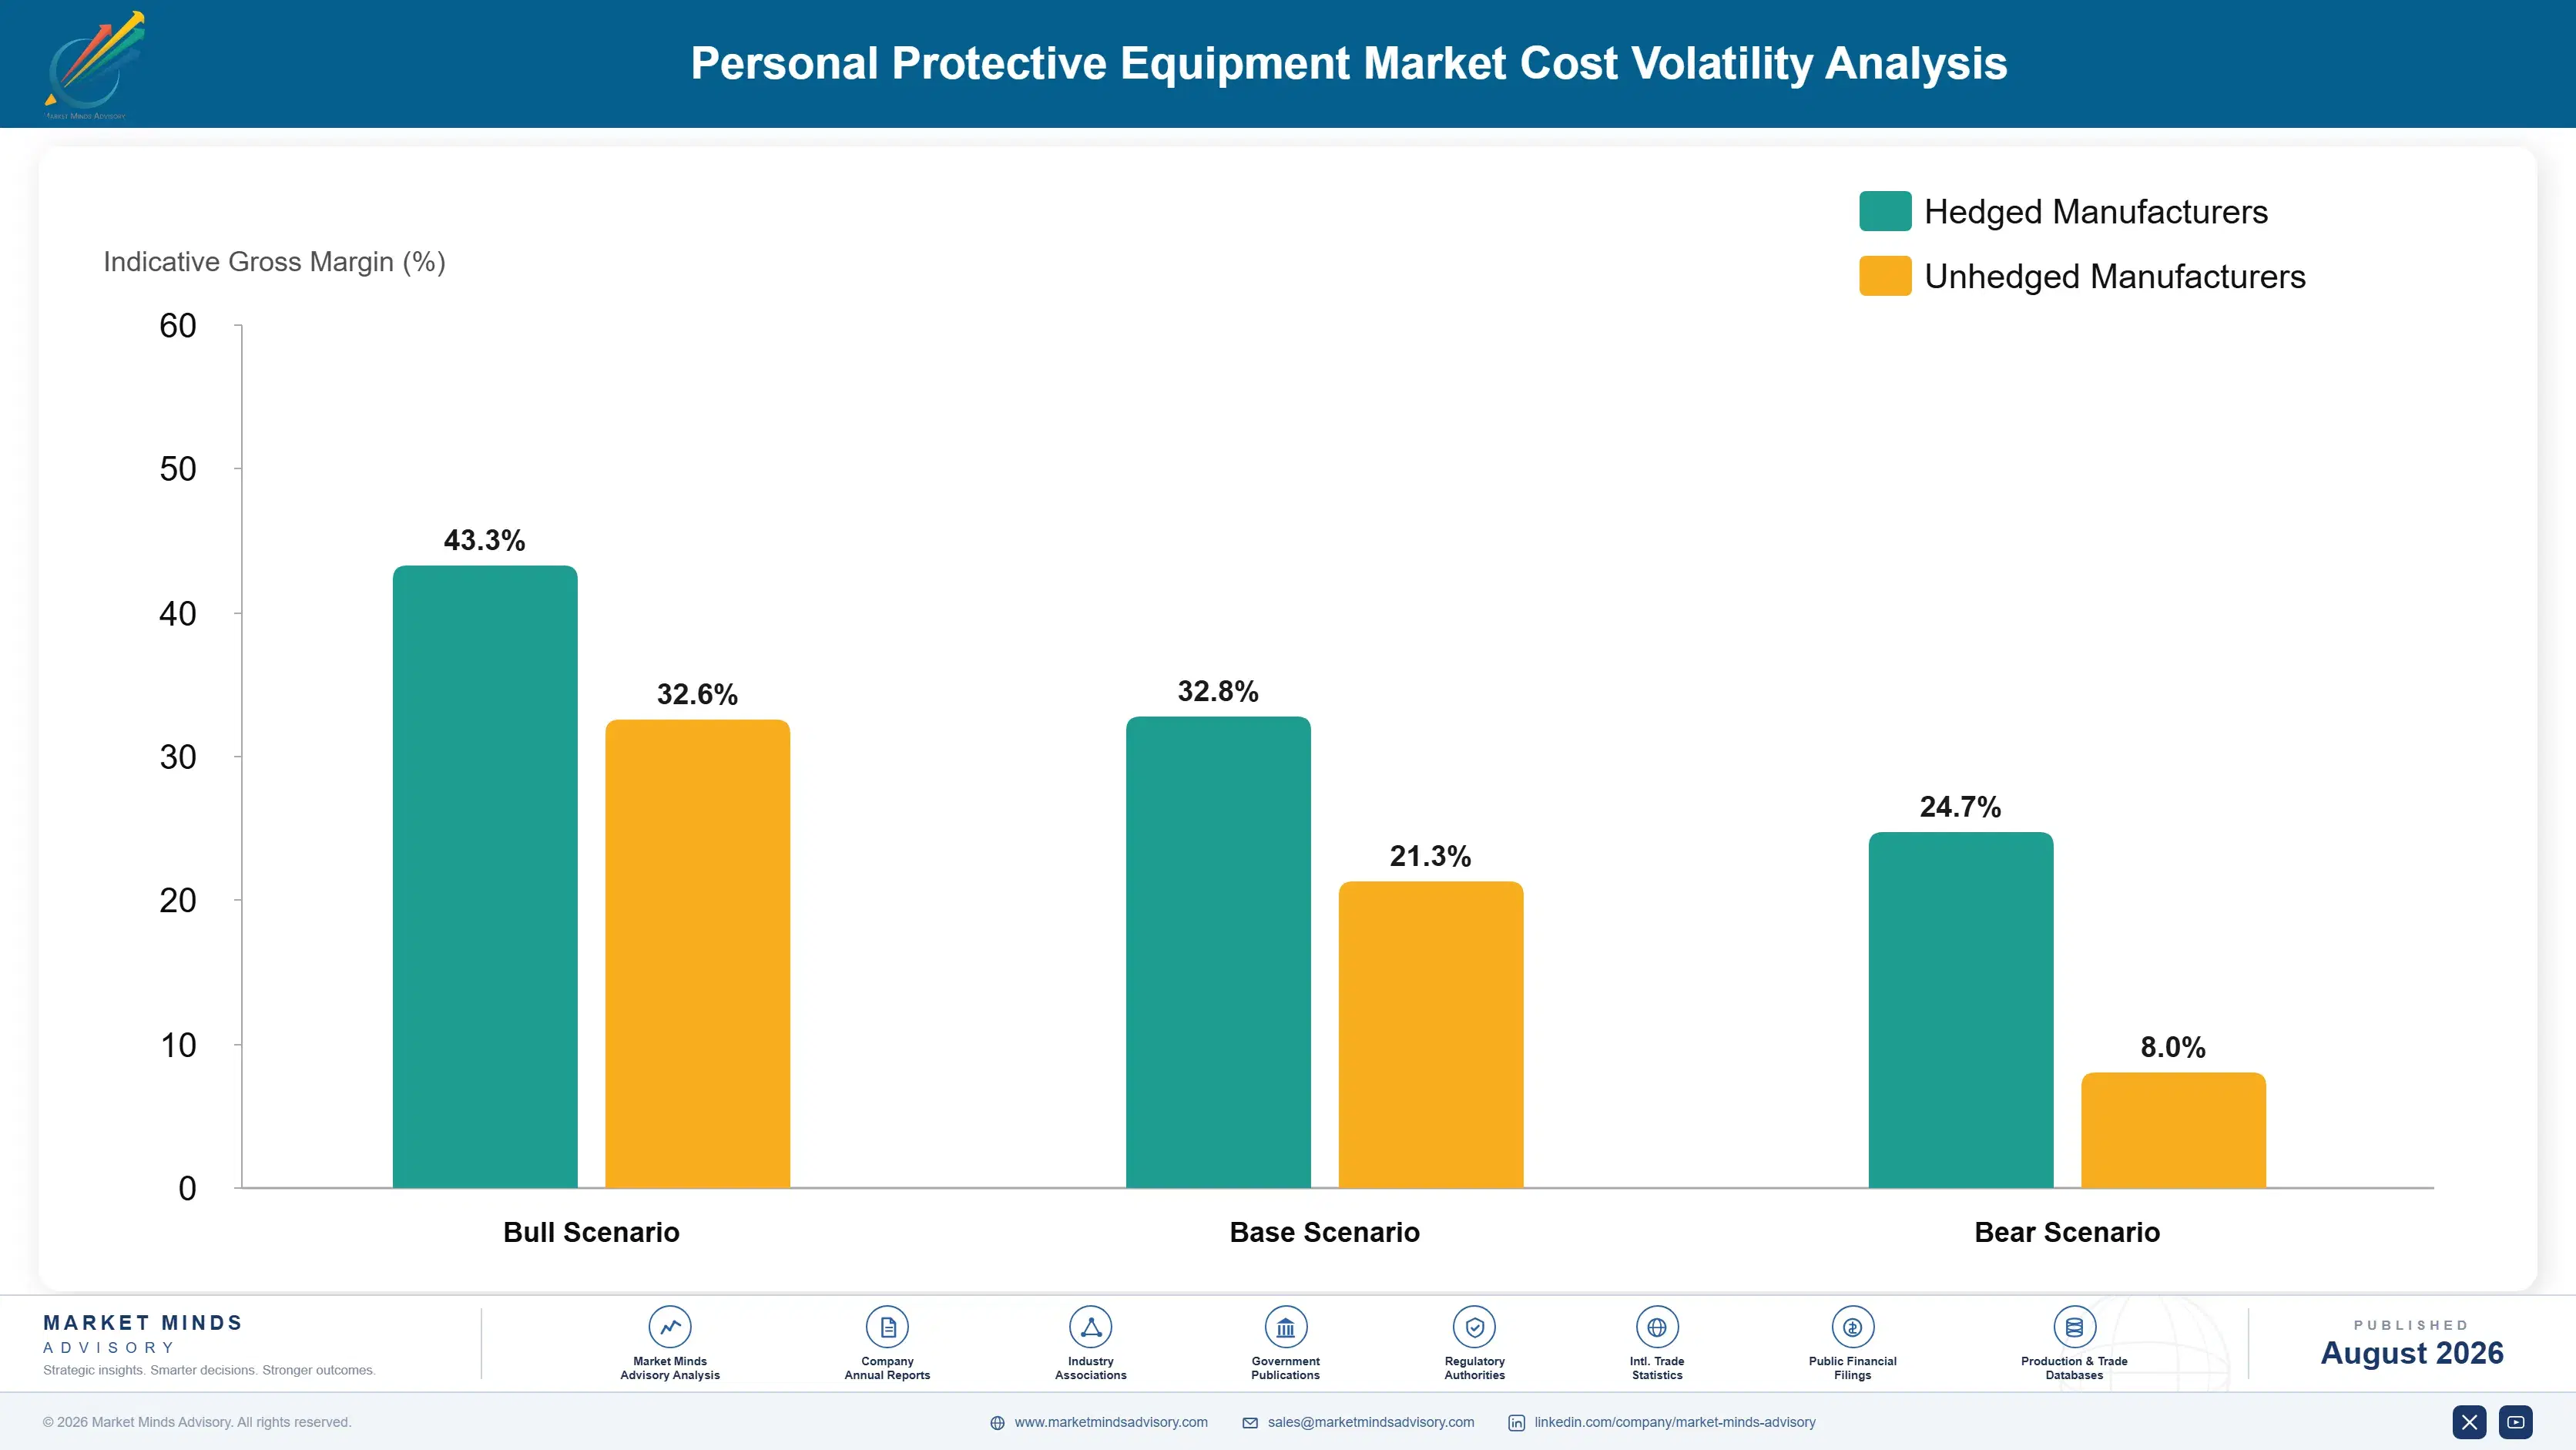
Nitrile butadiene rubber accounts for 22% to 28% of cash cost of goods sold in glove manufacturing, sourced primarily from Malaysian and Thai processors converting acrylonitrile feedstock refined largely in the United States and Asia. Nonwoven polypropylene fabric contributes a further 15% to 20%, with polycarbonate and aluminum making up most of eyewear and helmet cost.
The 2021 nitrile shortage remains the sector's defining volatility event. A February 2021 Texas winter storm shut Gulf Coast petrochemical capacity for weeks, disrupting acrylonitrile supply just as pandemic-driven glove demand stayed elevated globally. Top Glove and Supermax, Malaysia's largest manufacturers, both disclosed materially compressed 2021 and 2022 gross margins in annual reports as feedstock costs spiked faster than contract pricing could adjust. EIA data confirmed the shortage traced directly to the storm-driven shutdown.

Exposure separates suppliers with diversified feedstock sourcing from those dependent on a single elastomer supply chain. 3M and Honeywell, holding broader product portfolios, absorb nitrile volatility more gradually than single-category glove specialists whose entire cost base moves with one feedstock. Malaysian and Thai manufacturers, concentrated almost entirely in glove production, carry the sharpest exposure and the least ability to pass costs through to price-sensitive buyers quickly.
personal-protective-equipment-market-cost-volatility-analysis-1787300138846

Diversify Elastomer Sourcing Beyond Single-Region Acrylonitrile

Qualifying alternative elastomer blends and sourcing acrylonitrile from multiple regional refiners, rather than concentrating purchases with Gulf Coast-dependent suppliers, reduces exposure to any single weather or supply disruption event significantly. This costs modestly more per unit but has already proven its value once during the 2021 shortage specifically, when diversified suppliers fared measurably better.

Hedge Feedstock Costs Through Index-Linked Customer Contracts

Moving standard glove and respirator contracts to a feedstock index surcharge, adjusted quarterly against a published benchmark, removes the guesswork suppliers currently absorb when quoting fixed prices months ahead of delivery to large accounts across regions. Buyers increasingly accept this structure since it also protects them from overpaying during periods of falling input costs.

Build Buffer Inventory Ahead Of Seasonal Demand Peaks

Nonwoven fabric and nitrile capacity tighten seasonally around flu season and construction peak months each year, and suppliers that pre-book capacity and build modest buffer inventory ahead of those predictable windows avoid the premium spot pricing and delivery delays that reactive buyers routinely face during those recurring annual demand surges across the wider industry.

Portfolio Architecture for Margin Defence

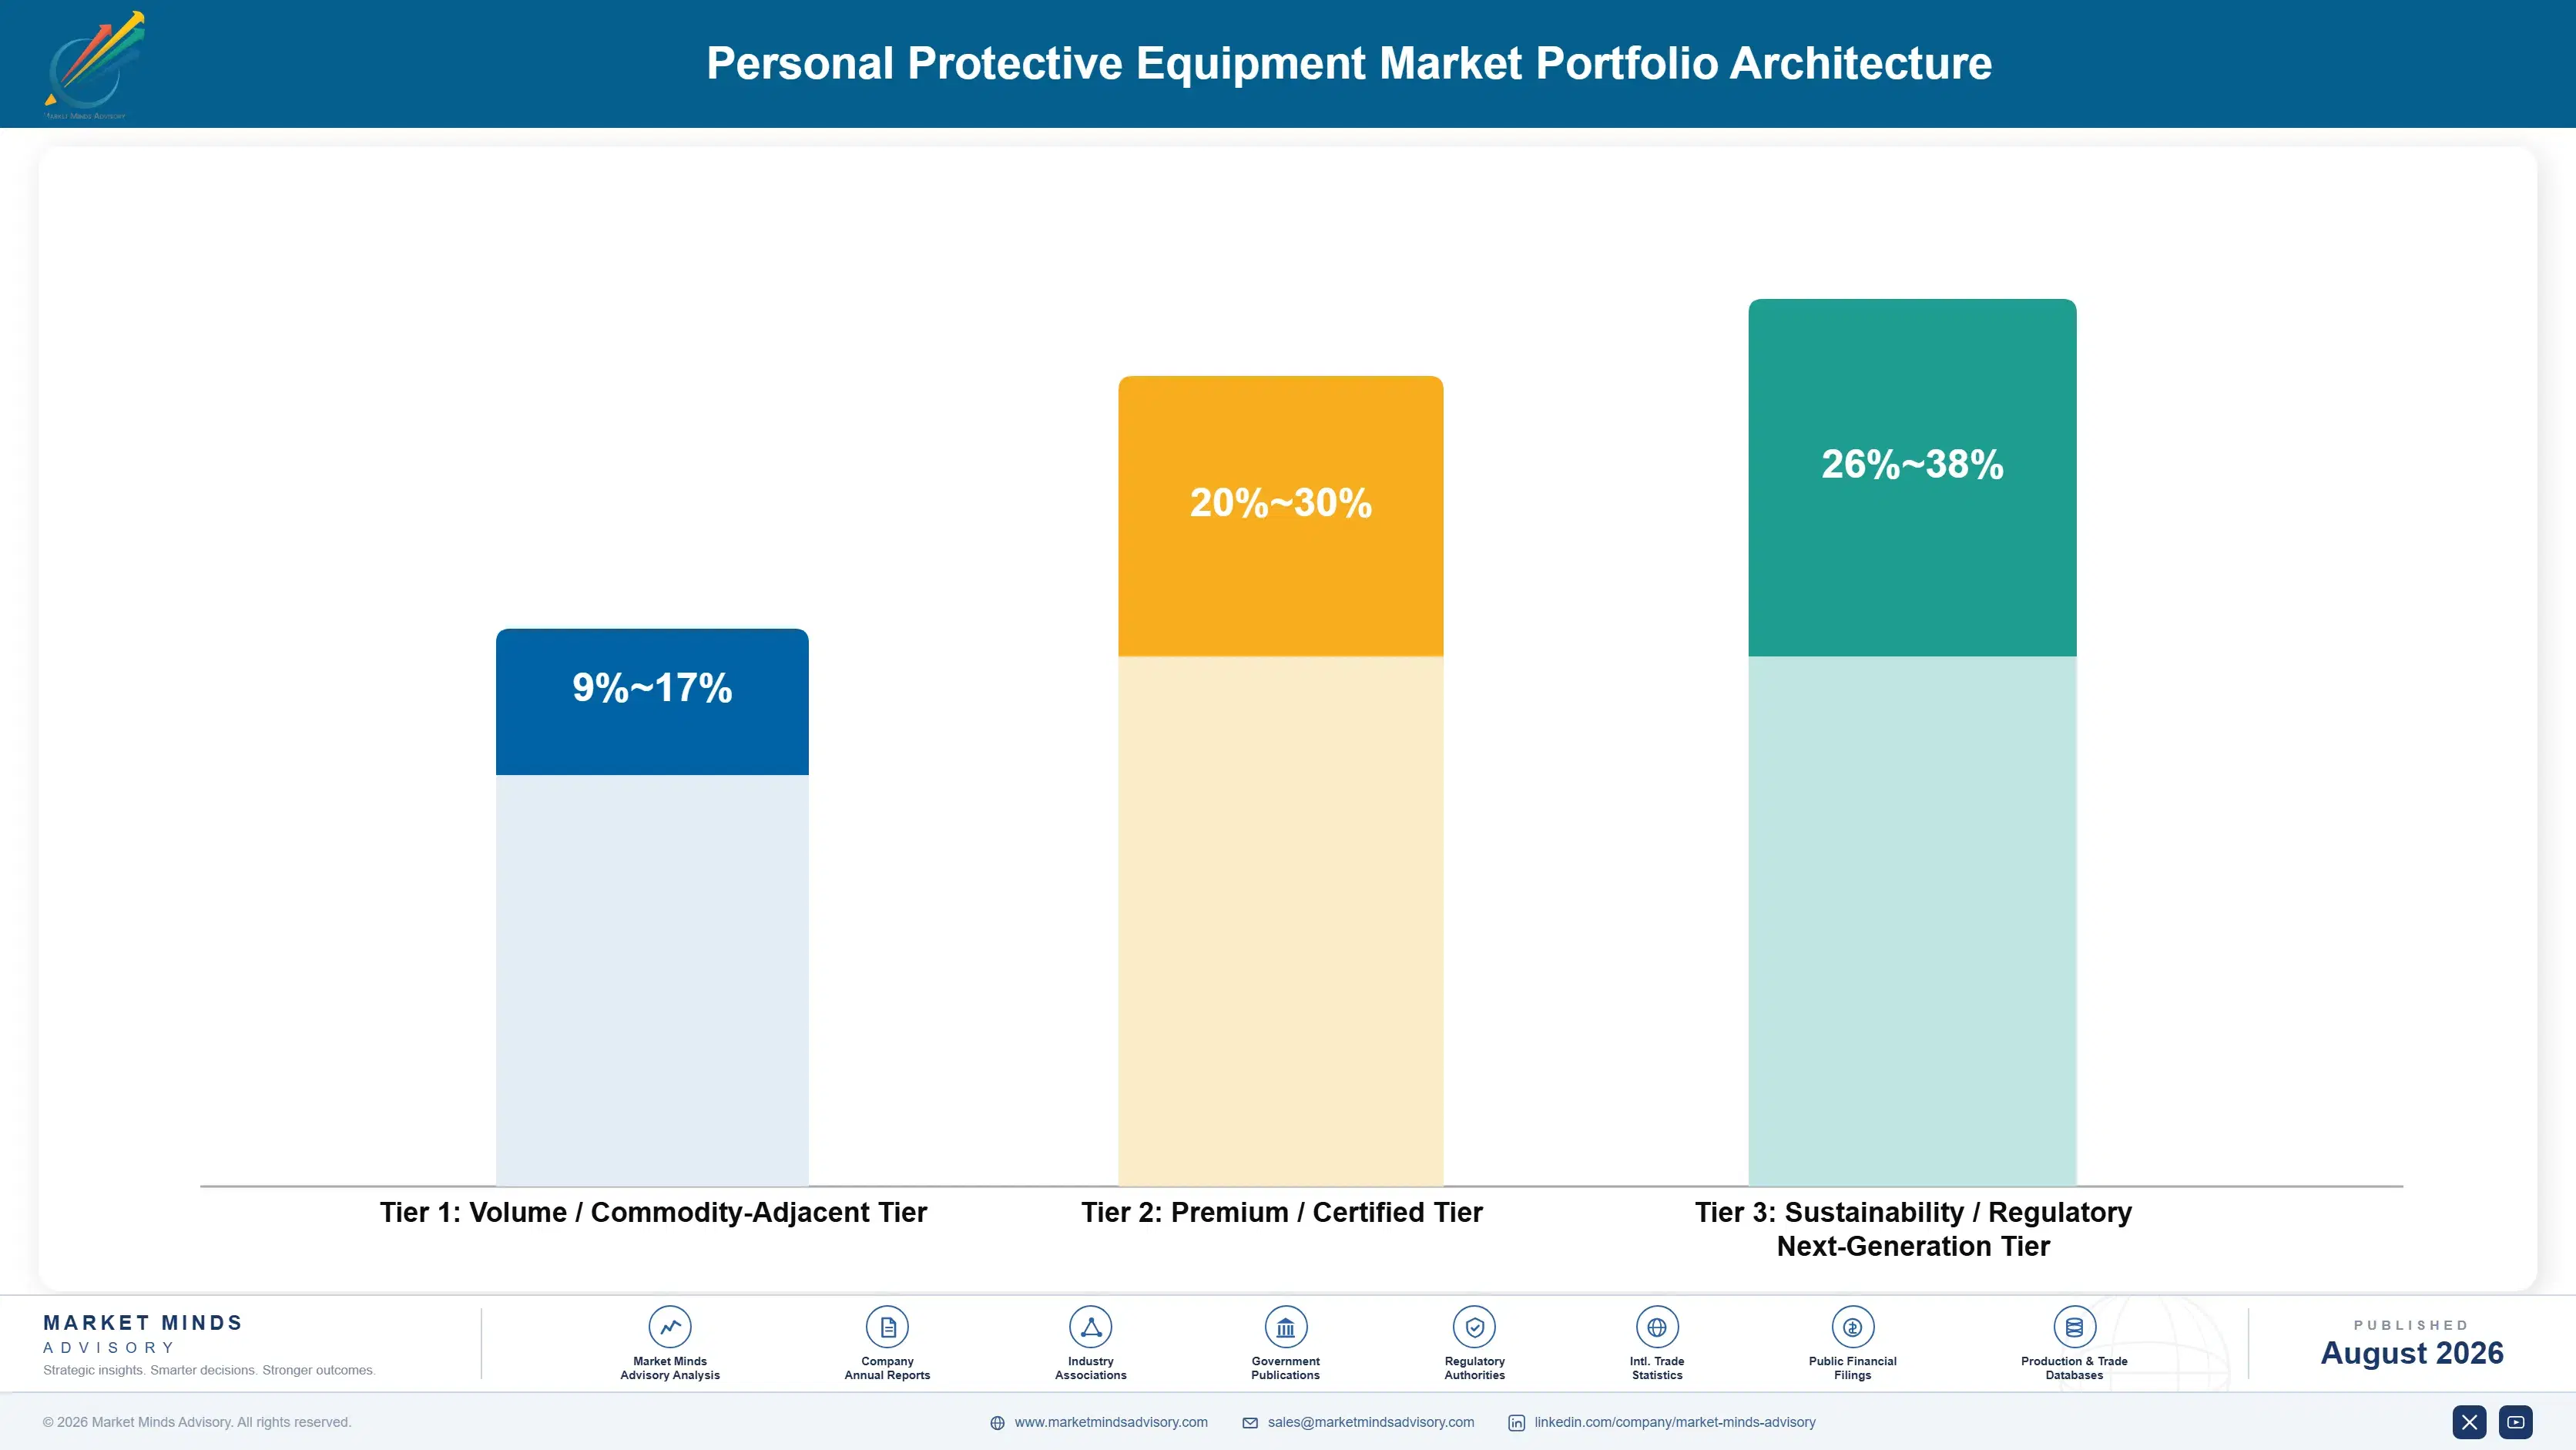
The portfolio splits into three margin tiers separated by certification, hazard complexity, and buyer sophistication rather than unit volume alone. Commodity gloves and basic eyewear compete almost entirely on unit price and distribution reach, while certified respiratory and chemical-resistant categories earn considerably more because fewer suppliers can navigate the certification and fit-testing burden credibly at meaningful scale.
The tension running through every supplier's strategy is volume against premium. Commodity categories fund fixed manufacturing overhead and keep production lines running, but they earn thin single-digit to low-double-digit margins that barely survive a bad feedstock quarter. Certified respiratory and connected-safety categories carry the earnings upside, yet they demand regulatory expertise, fit-testing infrastructure, and platform development that smaller manufacturers often cannot sustain through a full investment cycle.

High-value pools concentrate wherever a buyer cannot easily substitute supplier or certification: powered respirators for tightened exposure limits, cleanroom-compatible suits for battery and semiconductor fabs, and connected-safety platforms carrying recurring data revenue all sit here. Commodity nitrile gloves and basic eyewear, sold into distributed industrial channels, remain the volume anchor that keeps manufacturing lines utilised but contribute comparatively little to blended profitability.

Volume / Commodity-Adjacent Tier

Commodity nitrile gloves, basic safety eyewear, and disposable dust masks sold on unit price and distribution reach, competing directly against regional manufacturers on landed cost with minimal certification differentiation across most buyer categories.
Gross Margin: 9-17%

Premium / Certified Tier

Certified powered respirators, chemical-resistant clothing, and fall protection systems carrying NIOSH, EN, or equivalent certification and fit-testing documentation that uncertified competitors cannot credibly offer large institutional and industrial buyers today.
Gross Margin: 20-30%

Sustainability / Regulatory / Next-Generation Tier

Connected-safety sensor-embedded respirators and helmets, plus cleanroom-certified suits for battery and semiconductor fabrication, commanding a genuine premium for the data-service and hazard-specific engineering layered on top of standard hardware sold.
Gross Margin: 26-38%
personal-protective-equipment-market-portfolio-architecture-1787300139342

High-value Sub-segments and Strategic Watch-out

Respiratory Protection Equipment

Respiratory protection is the high-value, high-growth pool, expanding at 9.5% as tightening exposure limits push buyers toward powered and supplied-air respirators. The wide margin range reflects certification status: NIOSH- and EN-certified suppliers capture the top end, while uncertified disposable mask makers earn considerably less on commodity volume.
Gross Margin: 24-36%

Protective Clothing

Protective clothing forms the high-value, moderate-growth pool at 8.2%, serving chemical, thermal, and cleanroom hazard categories that battery and semiconductor fabs increasingly specify by certified standard rather than generic coverall. The wide range reflects hazard complexity, since chemical-resistant suits earn more than basic high-visibility garments command.
Gross Margin: 20-32%

Hand Protection

Hand protection is the volume core, the largest unit segment by far and the one every manufacturer depends on to keep production lines running through demand cycles. Margins stay thin because pricing tracks nitrile feedstock and delivered cost closely, leaving limited room for differentiation across competing domestic and imported supply.
Gross Margin: 9-16%

Head Protection

Head protection is the strategic watch-out, squeezed between Chinese commodity helmet imports and slower replacement cycles that leave little room to absorb rising resin cost. The wide range reflects that certified suppliers to construction and mining still earn respectably while undifferentiated hard hats increasingly compete on price alone.
Gross Margin: 10-20%

How PPE Demand Actually Repeats

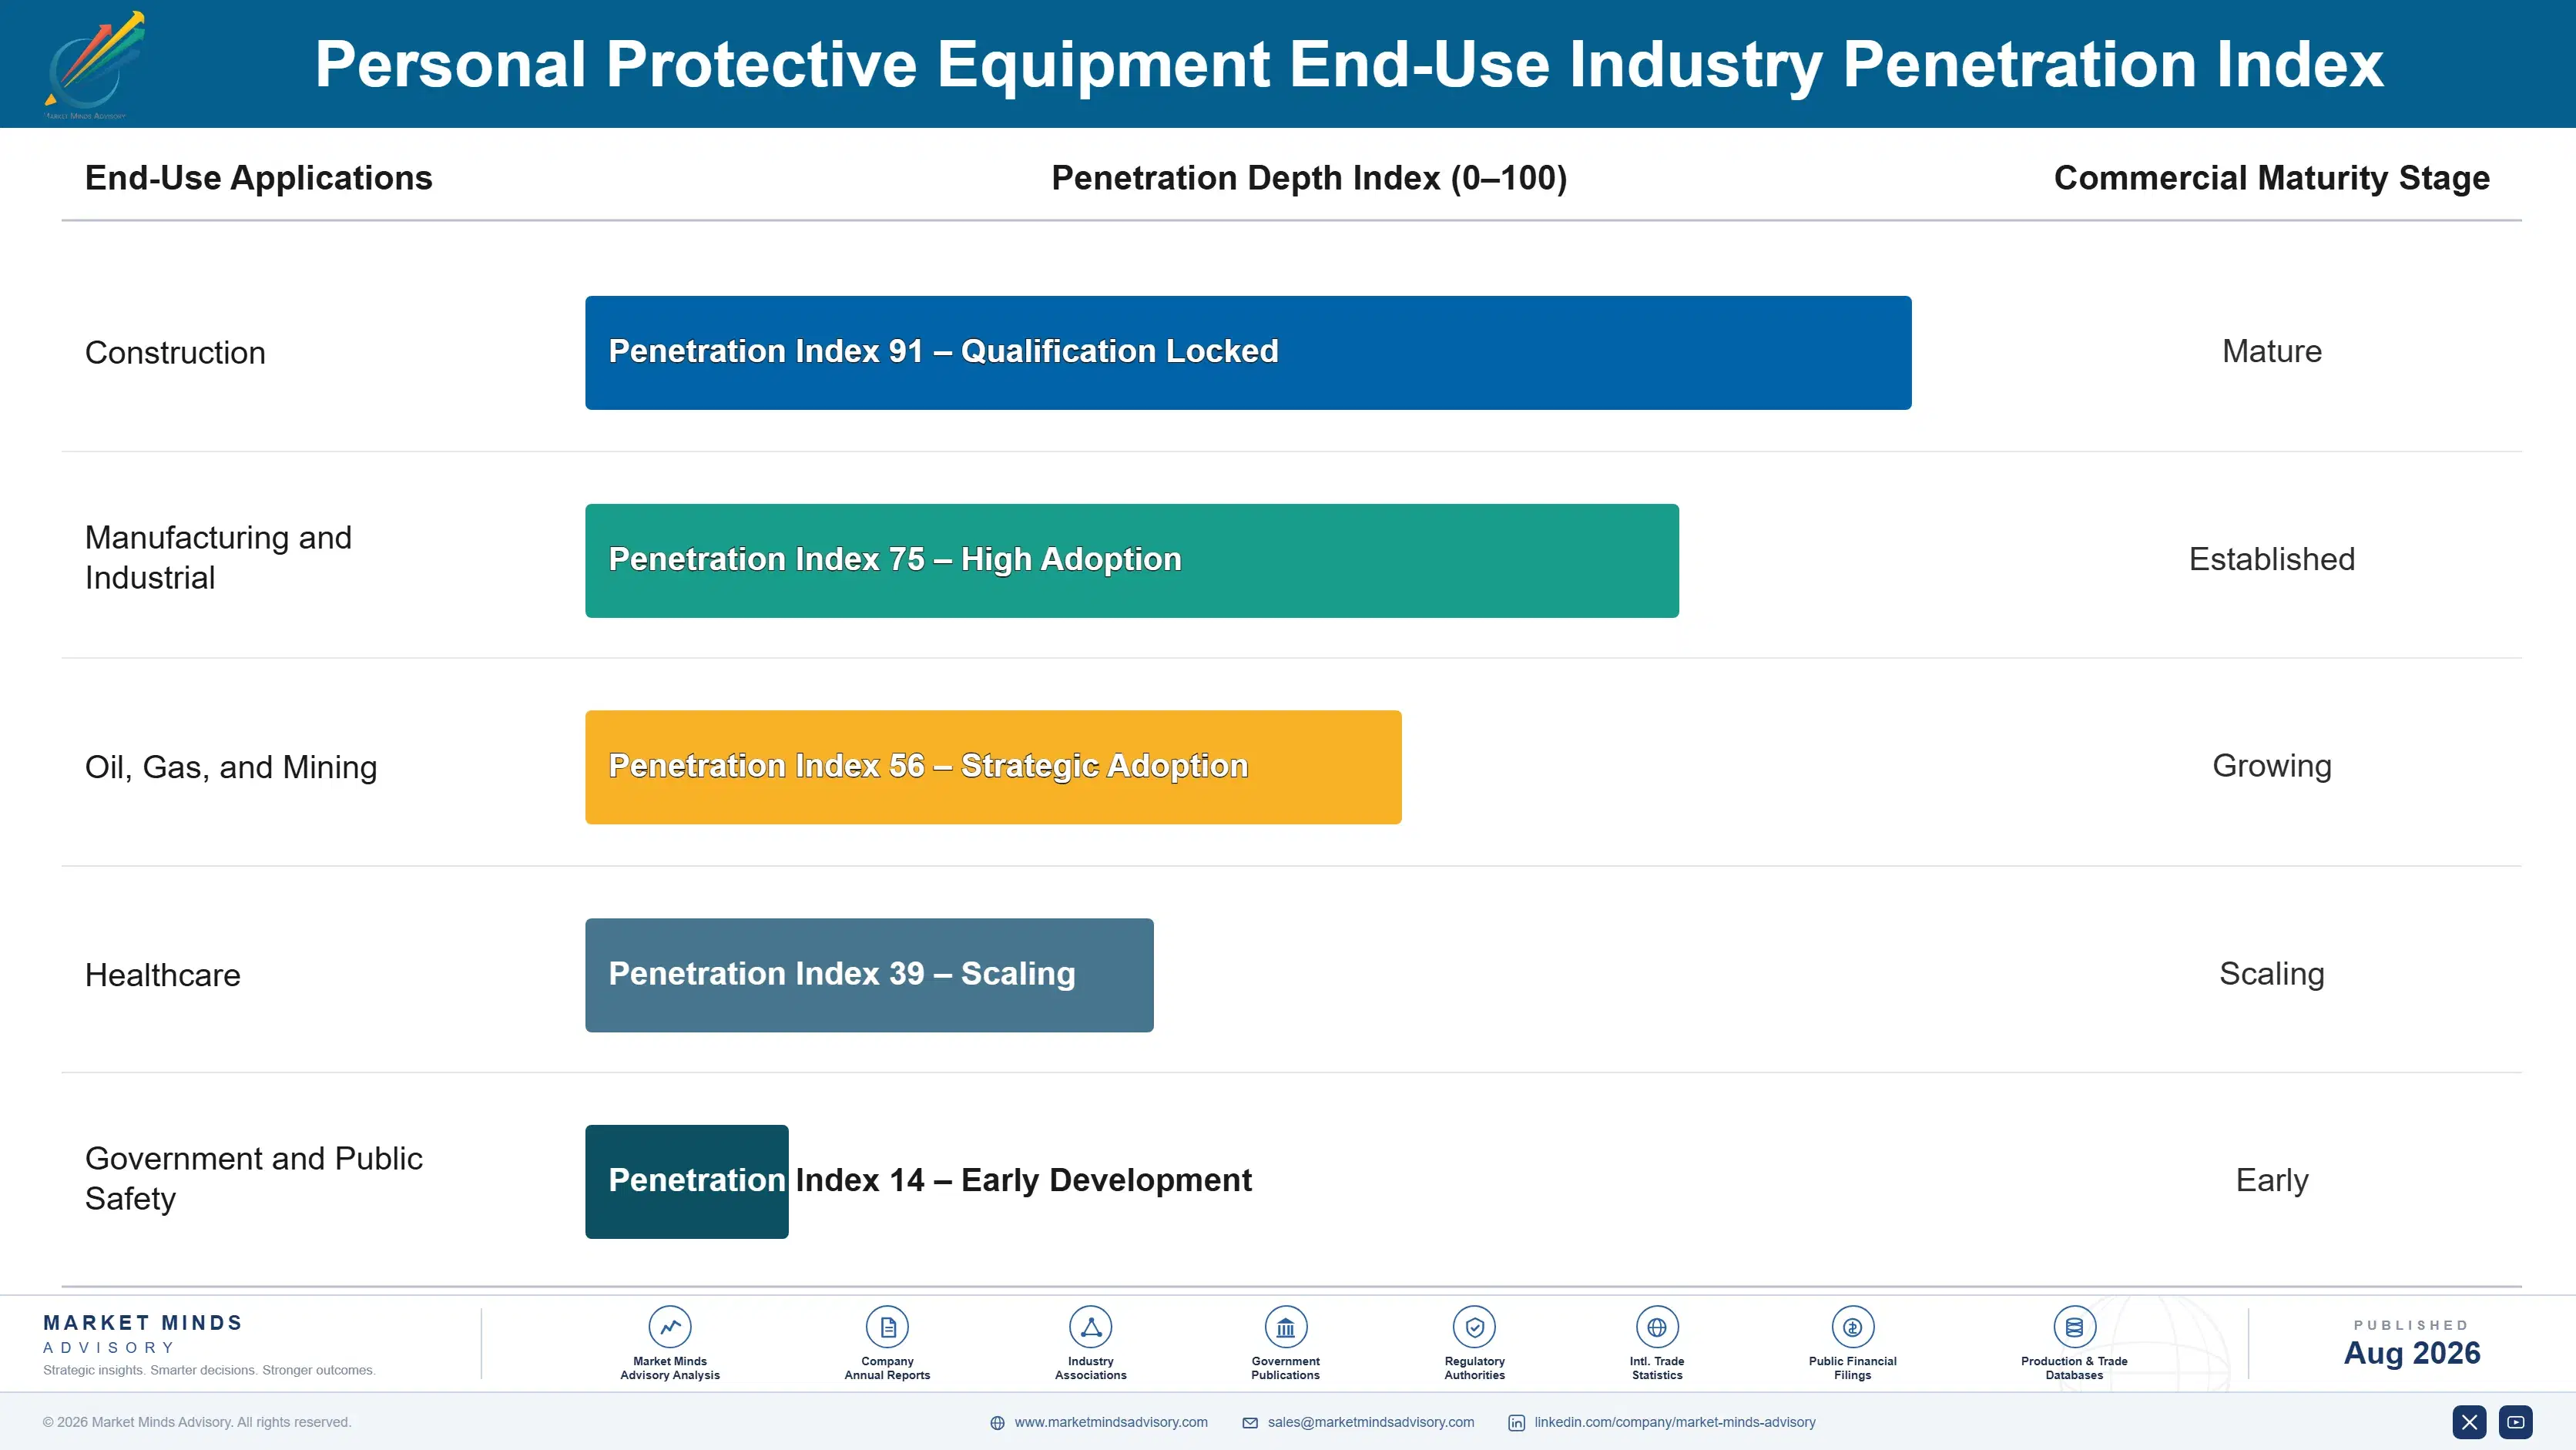
Demand here runs on replacement cycles that vary enormously by category, from disposable respirators reordered monthly to helmets and eyewear replaced only every few years on damage or expiry. Connected-safety platforms add a genuine annuity layer, since the data subscription recurs independent of unit replacement timing, giving suppliers revenue construction equipment sellers do not have.
Adoption depth varies sharply by vertical. Large industrial and mining accounts, once a supplier clears safety committee approval, rarely switch, since requalifying a vendor across every facility costs more in audit and retraining time than any price gap could offset. Small contractors and distributed retail buyers sit at the other extreme, treating PPE largely as a commodity purchased at whichever distributor is closest. Battery and semiconductor fabs fall between the two, loyal within a facility but open-bid on new construction.

Buyer profiles have shifted generationally too. Corporate safety officers increasingly run procurement through digital compliance platforms that score suppliers on certification currency and incident data rather than relationship alone, opening qualification to newer entrants able to demonstrate the data. Younger safety leaders also weigh worker comfort and connected-safety data more heavily than predecessors did, a shift mattering as much as unit price in some tenders.
personal-protective-equipment-market-end-use-penetration-index-1787300139828

Where PPE Suppliers Should Bet Next

These are among the four positions where our research anticipates prominent divergence between winners and laggards over the coming forecast period. Each is grounded in the demand model, the regulatory perimeter, and the announced capacity pipeline.
01 / CERTIFICATION INVESTMENT PRIORITY

Multi-standard certification is becoming the entry ticket for large global tenders

Suppliers maintaining simultaneous NIOSH, EN, and GB certification are winning multinational industrial contracts that single-standard competitors are simply unable to bid for, regardless of how competitive their pricing looks on paper at first glance. The certification investment runs into seven figures per product family, but it opens roughly 30% more addressable tender volume among multinational accounts consolidating procurement across every operating geography they currently run. Suppliers still sequencing certification market by market should treat this as urgent capital allocation, not a deferrable compliance cost.
02 / CONNECTED SAFETY STRATEGY

Sensor data platforms are becoming a durable hardware-proof moat

Honeywell and 3M's connected-safety platforms convert one-time equipment sales into recurring data subscriptions worth roughly 15% to 20% of total contract value, a revenue layer competitors selling hardware alone simply cannot match at comparable margin or retention. Large mining and oil and gas operators are already specifying this bundled model explicitly in procurement tenders, treating the data layer as a genuine risk-management tool rather than a novelty add-on. Suppliers without a platform strategy risk losing bankability-sensitive accounts to rivals demonstrating measurable safety outcomes.
03 / FEEDSTOCK DIVERSIFICATION DISCIPLINE

Nitrile hedging separates resilient manufacturers from the next feedstock shock casualties

The 2021 acrylonitrile shortage taught the glove industry a lesson some manufacturers still have not fully internalized, given how concentrated Gulf Coast feedstock sourcing remained even after the disruption exposed that single point of failure clearly. Producers diversifying elastomer blends and regional sourcing now avoid roughly 12% to 18% of the margin compression that single-source competitors absorbed during the last spike specifically, a meaningful and durable difference. This discipline is becoming a genuine competitive differentiator, not merely a procurement department concern.
04 / VENDOR CONSOLIDATION POSITIONING

Category breadth is winning large accounts faster than any single product innovation

Large industrial buyers are narrowing supplier lists specifically to reduce audit burden across dozens of facilities, and suppliers with the broadest certified category range are capturing outsized wallet share as a direct result of that ongoing consolidation trend. 3M's position illustrates this clearly, since its breadth advantage has held even against a costly historical liability episode that would have sunk a narrower, less diversified competitor entirely. Suppliers investing in single-category excellence alone now risk losing large accounts to broader-portfolio rivals.

Engagement Snapshot From the Field

A live engagement with an industry participant carrying material or product regulatory and market exposure ahead of a defining policy shift, showing how our research translates into a defensible multi-year portfolio strategy.
MARKET MINDS ADVISORY · CLIENT ENGAGEMENT SUMMARY
Personal Protective Equipment Producer Strategic Portfolio Review and Transition Roadmap 2026·Investment Scenario on Personal Protective Equipment Exposure Evaluation 2025-26
CLIENT PROFILE
A North American mining operator running twelve active sites approached MMA while evaluating whether to consolidate PPE procurement from eight regional vendors down to two global suppliers. The client reported annual PPE spend near USD 42 million, with safety incident and audit costs cited separately as a growing management concern across the organisation (client-reported, unverified by MMA).
STRATEGIC CHALLENGE
Site-level managers valued their existing local vendor relationships and worried consolidation would raise unit prices, while corporate safety leadership wanted standardized certification and connected-safety data collection across every operating site. Nobody had quantified whether the audit and compliance savings from consolidation would actually offset any vendor pricing premium at real operating scale.
MMA APPROACH
MMA modelled total cost of ownership across both scenarios, incorporating unit pricing, audit labor hours, incident-related downtime, and connected-safety platform licensing across three separate vendor consolidation structures under active consideration. We also benchmarked comparable mining operators' consolidation outcomes against their own subsequently disclosed safety incident rates and audit cost trends.
KEY FINDINGS
  1. Consolidating to two vendors reduced audit labor hours by an estimated 35%, since standardized certification documentation replaced eight separate site-level compliance processes.
  2. Unit pricing from the two finalist vendors ran only 3% above the blended cost of the existing eight-vendor structure, far below what site managers had assumed.
  3. Comparable operators that had consolidated PPE vendors previously reported measurably lower recordable incident rates within eighteen months, though causation remained difficult to isolate cleanly.
  4. Connected-safety platform licensing added a real ongoing cost, but modelled downtime avoidance from earlier hazard detection exceeded that cost within the first operating year (client-reported, unverified by MMA).
CLIENT PROFILE
A North American mining operator running twelve active sites approached MMA while evaluating whether to consolidate PPE procurement from eight regional vendors down to two global suppliers. The client reported annual PPE spend near USD 42 million, with safety incident and audit costs cited separately as a growing management concern across the organisation (client-reported, unverified by MMA).
STRATEGIC CHALLENGE
Site-level managers valued their existing local vendor relationships and worried consolidation would raise unit prices, while corporate safety leadership wanted standardized certification and connected-safety data collection across every operating site. Nobody had quantified whether the audit and compliance savings from consolidation would actually offset any vendor pricing premium at real operating scale.
MMA APPROACH
MMA modelled total cost of ownership across both scenarios, incorporating unit pricing, audit labor hours, incident-related downtime, and connected-safety platform licensing across three separate vendor consolidation structures under active consideration. We also benchmarked comparable mining operators' consolidation outcomes against their own subsequently disclosed safety incident rates and audit cost trends.
KEY FINDINGS
  1. Consolidating to two vendors reduced audit labor hours by an estimated 35%, since standardized certification documentation replaced eight separate site-level compliance processes.
  2. Unit pricing from the two finalist vendors ran only 3% above the blended cost of the existing eight-vendor structure, far below what site managers had assumed.
  3. Comparable operators that had consolidated PPE vendors previously reported measurably lower recordable incident rates within eighteen months, though causation remained difficult to isolate cleanly.
  4. Connected-safety platform licensing added a real ongoing cost, but modelled downtime avoidance from earlier hazard detection exceeded that cost within the first operating year (client-reported, unverified by MMA).
RECOMMENDED STRATEGY
Phase 1: Phase 1 (0 to 6 months): Consolidate to two finalist vendors at three pilot sites, retaining local relationships elsewhere pending pilot results. Phase 2: Phase 2 (6 to 18 months): Roll out consolidated vendors and connected-safety platform across remaining nine sites based on pilot performance data. Phase 3: Phase 3 (18 to 36 months): Renegotiate vendor terms annually using accumulated incident and audit-cost data as leverage for improved pricing.
OUTCOME
The client proceeded with the pilot phase, and audit labor hours fell in line with MMA's modelled estimate within the first two quarters of implementation. The board approved full rollout ahead of schedule, citing the pilot data as decisive evidence for the broader consolidation decision (client-reported, unverified by MMA).

Frequently Asked Questions

Foundational context covering the market sizes, CAGR, scope, country, region and competition that inform every finding below. This section is provided to cover basics and most often pre-purchase conversations, answered from the MMA Primary Research Dataset.

What is the current size of the Personal Protective Equipment Market?

The global personal protective equipment market was valued at USD 68.0 billion in 2025. Respiratory protection and certified chemical-resistant clothing account for the fastest-growing share of that total.

How large will the Personal Protective Equipment Market be by 2036?

The market is projected to reach USD 140.2 billion by 2036, up from USD 72.6 billion in 2026. That represents an incremental opportunity of roughly USD 67.6 billion across the forecast decade.

What is the CAGR for the Personal Protective Equipment Market 2026 to 2036?

The base case CAGR is 6.8% annually. MMA models a bull case of 8.1% if exposure limit tightening accelerates further, and a bear case of 5.5% if industrial capital spending slows broadly.

Which segment is growing fastest?

Respiratory protection equipment grows fastest at 9.5% CAGR, about 1.40 times the overall market rate, as tightening silica and diesel particulate exposure limits push buyers toward certified powered respirators.

Who are the major companies in the Personal Protective Equipment Market?

3M Company, Honeywell International, MSA Safety, Ansell Limited, and DuPont de Nemours lead on certified category revenue. 3M holds the broadest certified product portfolio specifically.

Which country is growing fastest?

India posts the fastest national CAGR at 11.5%, driven by factory inspectorate reforms, production-linked manufacturing incentives, and export growth pulling certified local PPE production ahead of every other major market.

Report Segmentation Architecture

The full report scope spans multiple orthogonal segmentation dimensions, with cross-tabulated demand data provided for each dimension pair. Coverage extends further to regional breakdowns, trend trajectories, and the competitive detail needed to support segment-level decision-making.

By Protection Category

  • Respiratory Protection
  • Protective Clothing
  • Hand Protection
  • Head Protection
  • Eye and Face Protection
  • Foot Protection

By End-Use Industry

  • Construction
  • Manufacturing and Industrial
  • Oil, Gas, and Mining
  • Healthcare
  • Government and Public Safety

By Commercial Dimension

  • Direct Industrial Supply
  • Distributor and Retail Channel Sales
  • Government Tender and Institutional Procurement
  • Connected-Safety Platform Service Contracts

By Region

  • North America
  • Western Europe
  • East Asia
  • South Asia and Pacific
  • Latin America
  • Middle East and Africa
  • Eastern Europe

Scope, Methodology, and Coverage

Every figure in this report is reproducible from documented input assumptions. The scope below maps the historical period, the forecast horizon, the segmentation dimensions, and the countries covered, alongside the underlying primary and qualitative methodology.
Historical Period
2020 to 2025
Forecast Period
2026 to 2036
Base Year
2025 (USD billions; MMA Primary Research Dataset, August 2026)
Market Definition
The market covers personal protective equipment worn by workers to reduce exposure to physical, chemical, biological, and respiratory hazards, spanning head, eye and face, hearing, respiratory, hand, body, and foot protection sold to industrial, construction, and government buyers. Medical-grade single-use PPE sold exclusively through hospital procurement channels is excluded.
Quantitative Units
USD billions (current prices); millions of units shipped where applicable
Segmentation Dimensions
By Protection Category; By End-Use Industry; By Commercial Dimension; By Region
Regions Covered
North America, Western Europe, East Asia, South Asia and Pacific, Latin America, Middle East and Africa, Eastern Europe
Countries Covered
USA, China, Germany, France, UK, Japan, South Korea, India, Australia, Canada, Brazil, Mexico, Indonesia, Vietnam, Thailand, Malaysia, UAE, Saudi Arabia, South Africa, Nigeria, Turkey, Poland, Netherlands, Italy, Spain, Sweden, Switzerland, Argentina, Colombia, Singapore, and additional markets relevant to this sector
Key Companies Profiled
3M Company, Honeywell International Inc., MSA Safety Incorporated, Ansell Limited, DuPont de Nemours Inc., Kimberly-Clark Corporation, Lakeland Industries Inc., Alpha Pro Tech Ltd., Uvex Group, JSP Limited, Delta Plus Group, Bolle Safety, Mallcom (India) Limited, Radians Inc., Ergodyne, Sioen Industries NV, Supermax Corporation Berhad, Top Glove Corporation Bhd, Cordova Safety Products, Blauer Manufacturing Company
Quantitative Methodology
Primary survey, n=3,800 respondents, Q4 2025, six countries; demand-side model with trade association cross-validation
Qualitative Methodology
47 expert interviews, Q4 2025; applied to validate demand model assumptions, identify emerging dynamics, and assess competitive positioning
Report Format
PDF and XLSX data workbook (Word format preview document)
Publisher
Market Minds Advisory
Report Code
MMA-2026-CON-103
Published
August 2026
Contact
sales@marketmindsadvisory.com | www.marketmindsadvisory.com

Purchase the full Personal Protective Equipment Market Report (2026 to 2036).

The full MMA Personal Protective Equipment report sizes the market across six protection categories, five end-use industries, four commercial channels, and seven regions through 2036. It profiles 20 participants on a consistent certified category revenue basis, scoring the top two on certification breadth, connected-safety platform depth, and feedstock exposure. Scenario models quantify how exposure limit tightening, nitrile feedstock volatility, and vendor consolidation trends move both demand and realised pricing. The report also includes delivered-cost modelling by category, a feedstock exposure screen, connected-safety platform adoption tracking, and a certification investment prioritisation framework built for strategy, procurement, and investment teams.
Six-category segmentation with unit and value forecasts
Seven-region demand map with country-level detail
Twenty-company competitive profiles on certified revenue
Nitrile and nonwoven feedstock cost sensitivity modelling
Exposure limit and certification standard tracking
Connected-safety platform adoption readiness assessment playbook

Built For The People Who Decide

From boardroom strategy to bench-side execution, this report is read cover-to-cover by leaders shaping the next decade of their industry, turning demand scenarios, market dynamics and valuation benchmarks into decisions.
CXOs/ Presidents/ VPs/ Managers
M&A and Corporate Development
Strategy Teams and R&D Heads
Procurement and Product Directors
Regulatory and Compliance Leaders
Investor Relations and Equity Analysts