Market Minds Advisory
Peptide Therapeutics Market

Peptide Therapeutics Market: GLP-1 Expansion and Oncology Pipeline Growth

Pharmaceutical manufacturers and specialty pharmacy networks across major healthcare systems are qualifying GLP-1 receptor agonist production capacity as metabolic disease prescribing volume and pipeline maturity pull manufacturing investment forward faster than most developers anticipated worldwide.

Lead Analyst

Alice Ballenger

Published

September 2026

Make Smarter Decisions with Customized Research Insights

Request a free sample report and evaluate market opportunities, growth trends, and competitive dynamics relevant to your business needs.

2025 MARKET VALUE$8.4BMarket Size 2025
2036 FORECAST VALUE$23.4BBase Case , 2026 to 2036
CAGR 2026 TO 20369.8 %Bull 11.1% / Bear 8.5%
INCREMENTAL OPPORTUNITY$14.2BNet 10- year value creation
EXPANSION MULTIPLE2.55x2036 value over 2026 base
Strategic Levers
M&A Pipeline
Regional Outlook
Country Rankings
Competitive Intelligence
Segmental Deep-dive
Call-Us : 91 93563 13602

Executive Snapshot and Market Trajectory

Pharmaceutical manufacturers and specialty pharmacy networks across major healthcare systems are qualifying expanded GLP-1 receptor agonist production capacity, and that shift is happening considerably faster than most developers anticipated as metabolic disease prescribing volume pulls manufacturing investment forward across every major healthcare market today.
North America anchors global demand, home to the largest metabolic disease prescribing volume and specialty pharmacy distribution infrastructure in the world, as Novo Nordisk A/S, Eli Lilly and Company, and AstraZeneca plc compete for the same health system and payer formulary contracts across a manufacturing base. GLP-1 receptor agonist peptides are the fastest-growing category, smaller than the combined oncology and hormone replacement peptide volume but the dominant driver as obesity and diabetes prescribing intensify.
Five suppliers, Novo Nordisk A/S, Eli Lilly and Company, AstraZeneca plc, Amgen Inc, and Ipsen S.A., hold roughly 58 percent of global peptide therapeutics revenue, a concentration built on decades of peptide synthesis engineering scale and regulatory approval depth that smaller specialty developers find difficult to match. Tightening manufacturing capacity constraints and expanding payer formulary coverage are pulling production investment forward across nearly every major metabolic and oncology therapeutics roadmap.
Market Definition
The peptide therapeutics market covers GLP-1 receptor agonist peptides, oncology peptide therapeutics, growth hormone and growth factor analog peptides, peptide hormone replacement therapeutics, antimicrobial and anti-infective peptides, and peptide drug delivery and conjugate technologies used as therapeutic agents for metabolic, oncologic, endocrine, and infectious disease treatment. It excludes peptide-based vaccines, which represent a distinct regulatory and commercial category, diagnostic peptide reagents not used therapeutically, and small-molecule drugs that merely target peptide receptors without being peptide-based themselves.
Base Year Value
$8.4B in 2025 (MMA Primary Research Dataset, August 2026)
Forecast Period
2026 to 2036, eleven discrete annual values
CAGR
9.8% base case. Bull 11.1%. Bear 8.5%.
Fastest Growth Segment
GLP-1 Receptor Agonist Peptides: 14.4% CAGR
Fastest Growth Country
China: 12.8% CAGR
Fastest Growth Region
South Asia and Pacific: 11.8% CAGR
Largest Region
North America: 32% of 2025 global value
Market Leaders
Novo Nordisk A/S, Eli Lilly and Company, AstraZeneca plc, Amgen Inc, Ipsen S.A. Source: MMA Analysis based on company annual reports and investor filings.
Primary Survey
n=3,800 procurement and R&D decision-makers, Q4 2025, six countries
Methodology
Demand-side build-up, cross-validated against public data, 47 expert interviews

Peptide Therapeutics Market Forecast Scenarios

peptide-therapeutics-market-size-forecast-scenario-1787306228471
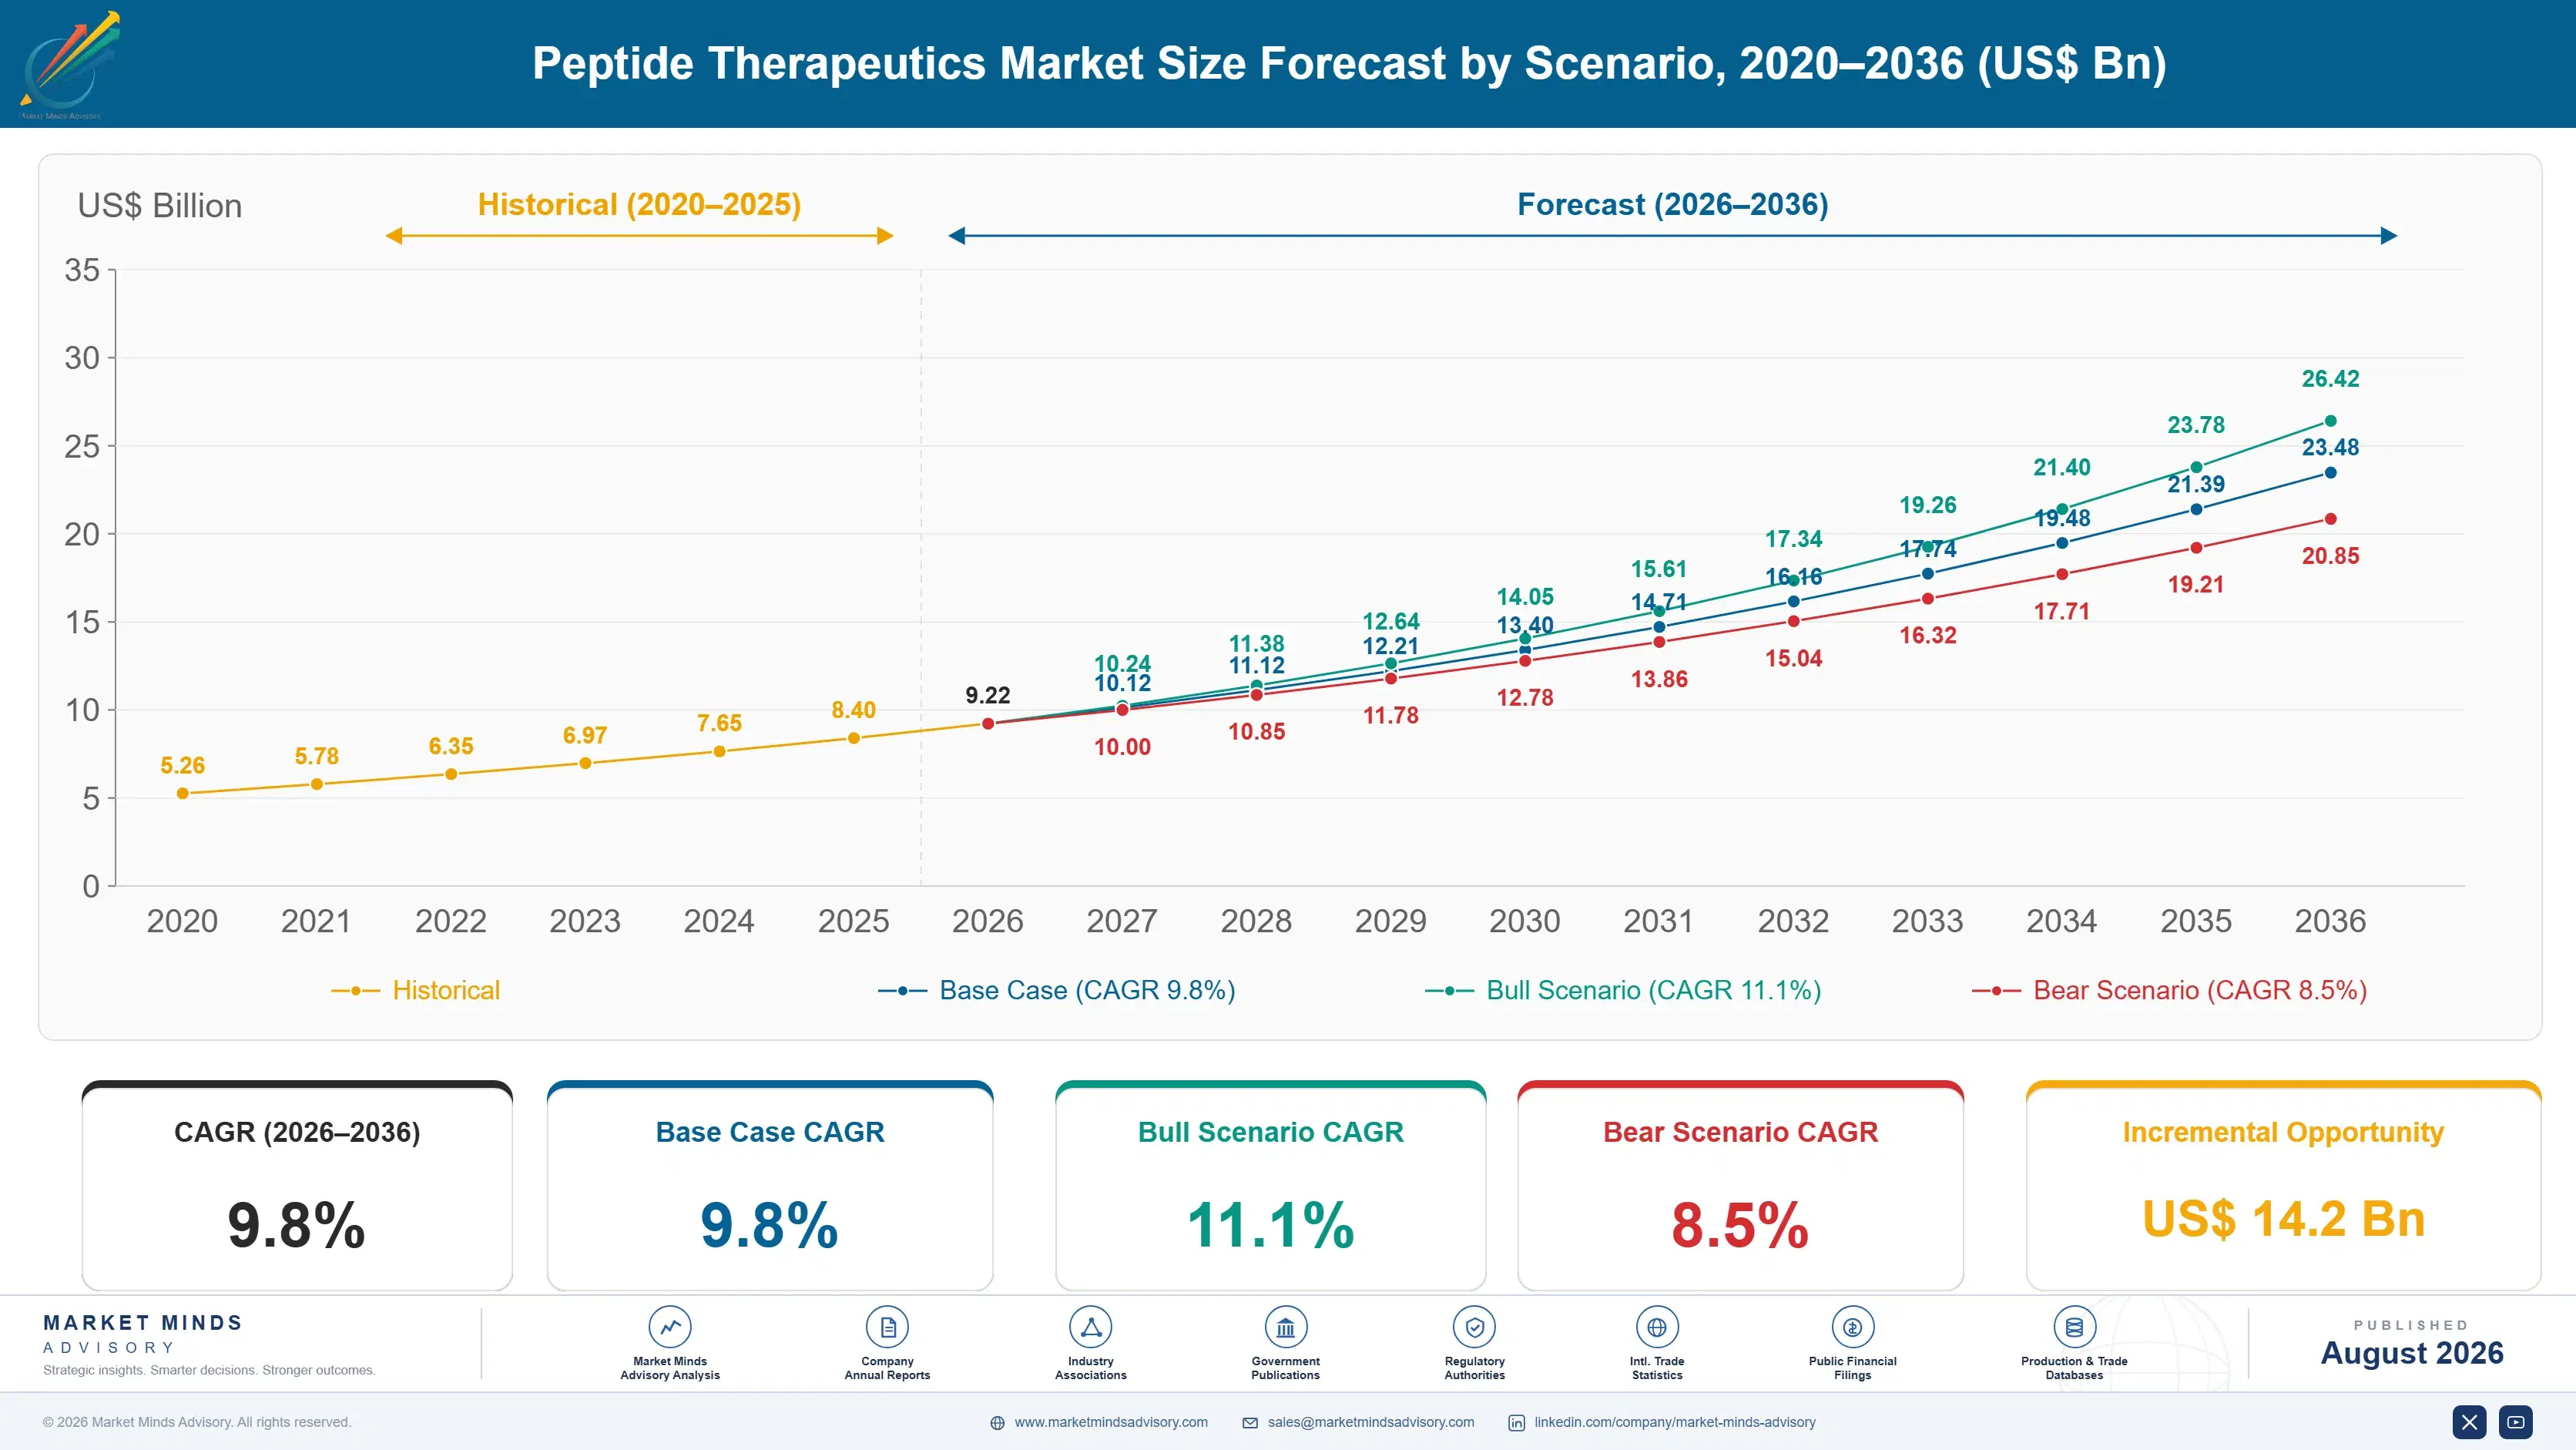
Peptide therapeutics demand grew steadily from 2020 through 2025 as GLP-1 receptor agonist prescribing volume accelerated behind expanding obesity and diabetes treatment adoption across major healthcare markets worldwide. The category grew at roughly a 9.0 percent historical compound rate as manufacturers began qualifying expanded production capacity ahead of tightening supply constraints. Growth accelerated across the final two years of the period.
MMA's base case assumes 9.8 percent compound growth through 2036, anchored in three mechanisms. First, expanding metabolic disease prevalence and treatment-seeking behavior across major healthcare systems is pulling prescribing volume forward across an increasing number of payer formulary tiers. Second, tightening manufacturing capacity investment is favouring integrated peptide synthesis and formulation platforms over fragmented contract manufacturing arrangements. Third, rising oncology peptide pipeline maturity is extending therapeutic demand into applications that historically relied on conventional small-molecule chemotherapy alone.
A bull scenario near 11.1 percent follows if payer formulary coverage expansion accelerates ahead of currently scheduled reimbursement policy timelines across major healthcare markets. The bear case near 8.5 percent materialises if manufacturing capacity constraints persist longer than expected, extending prescribing backlogs and limiting volume growth across cost-sensitive healthcare systems. Suppliers monitoring both scenarios are adjusting plans ahead of confirmed demand signals.

GLP-1 Scale-Up Reshapes Manufacturing Standards

Peptide therapeutics have moved from a specialty drug category into a metabolic and oncology treatment standard faster than most pharmaceutical executives expected a few years ago, reshaping how manufacturers plan synthesis capacity and formulation investment. Drugs that would have been reserved for specialist prescribing a decade ago are evaluated on population-health outcomes because payers and health systems treat metabolic disease management as a formulary priority rather than a discretionar
MARKET CONCENTRATION58%Five suppliers hold a meaningful combined global share
AVERAGE TREATMENT COST$950/monthReflects a standard branded receptor agonist treatment regimen today
NORTH AMERICA PRESCRIBING SHARE32%Largest metabolic disease prescribing volume found worldwide today
PEPTIDE SYNTHESIS COST SHARE41%Specialty amino acid and synthesis reagent sourcing dominates cost
MANUFACTURING CAPACITY UTILIZATION89%Share of installed global peptide synthesis capacity currently utilized
PATENT EXCLUSIVITY WINDOW8-12 yearsTypical remaining exclusivity duration for a leading branded peptide
Commercial activity concentrates in GLP-1 receptor agonist and growth hormone analog peptides, where synthesis engineering scale and regulatory approval depth give the five largest suppliers durable advantages on large payer formulary and health system contracts. Oncology peptide therapeutics remain a smaller but fast-scaling category, increasingly specified directly by oncology treatment programme directors. Antimicrobial peptides and drug delivery conjugates round out demand across infectious disease and targeted delivery applications.
The next decade will be shaped less by incremental peptide sequence engineering than by how fast manufacturers can scale synthesis capacity at population-health prescribing volume. Suppliers that can bundle expanded manufacturing capability with existing formulation product lines capture disproportionate share of new payer formulary and health system contracts.
"Five years ago GLP-1 was a diabetes drug most people had never heard of. Now it is the single biggest line item in some payers' pharmacy budgets."
Director, Biopharmaceutical Therapeutics Practice · MMA Peptide-Based Drug Thera

Market Trends

Manufacturing Capacity Expansion Becomes Strategic Priority

Peptide manufacturers across major producing regions increasingly commit multi-year capital investment to expanded synthesis capacity as a direct response to sustained GLP-1 prescribing demand, making capacity expansion a growing strategic priority rather than a discretionary capital decision manufacturers can defer indefinitely. Manufacturers with the broadest capacity expansion report that supply reliability has become a factor cited in new payer contract negotiations, ahead of raw treatment cost. Novo Nordisk A/S and Eli Lilly and Company both report that capacity-linked capital investment has grown faster than standard R&D spending across their metabolic disease portfolios recently.
Market Impact: Sustains a 62% prevalence-linked de

Oncology Peptide Pipeline Maturity Expands Treatment Adoption

Oncology treatment programmes across major healthcare markets continue to adopt peptide-based targeted therapies as pipeline candidates advance through late-stage clinical trials, extending peptide therapeutics demand into oncology treatment volume that previously relied on conventional small-molecule and biologic therapies alone. Programmes serving high-growth oncology markets report that treatment specification requirements are typically driven more by targeted delivery precision than by discretionary purchasing preferences. AstraZeneca plc and Amgen Inc both report that oncology peptide orders are a growing share of their therapeutics business today, and both companies expect that share to keep expanding each year.
Market Impact: Adds 11pp to addressable formulary-

Market Opportunities and Growth Drivers

Rising Metabolic Disease Prevalence Sustains Baseline Demand

Obesity and type 2 diabetes prevalence across major healthcare systems continues to sustain peptide therapeutics demand regardless of broader pharmaceutical capital spending cycles, since every diagnosed metabolic disease case represents ongoing prescribing demand tied to chronic disease management rather than discretionary treatment decisions. Health systems managing high metabolic disease caseloads report that prescribing volume is typically driven more by diagnosed patient population than by discretionary capital preferences. This prevalence-linked demand gives peptide therapeutics suppliers unusually predictable baseline revenue compared with other pharmaceutical categories that depend more heavily on discretionary treatment cycles.
Market Impact: Raises input cost volatility by 19%

Expanding Payer Formulary Coverage Broadens Addressable Market

Healthcare payers across major reimbursement systems continue to expand formulary coverage for GLP-1 receptor agonist and other peptide therapeutics following expanding clinical outcome evidence, and expanded coverage increasingly makes peptide treatment accessible for patient segments that historically could not afford treatment due to lower reimbursement availability. Health systems serving newly covered populations report that prescribing volume growth is typically driven more by formulary tier placement than by discretionary patient preferences. Suppliers serving these health systems report more reliable volume forecasting as a result. That forecasting improvement is helping suppliers plan capacity investment further in advance, particularly across multi-region payer accounts.
Market Impact: Limits smaller-developer commercial

Market Restraints and Challenges

Peptide Synthesis Reagent Price Volatility Squeezes Manufacturer Margins

Peptide therapeutics manufacturers face specialty amino acid and synthesis reagent input cost volatility that expanded production does not escape, and the root cause of the margin pressure is a supply constraint: high-purity synthesis reagent capacity has not expanded fast enough to match rising global prescribing demand, leaving manufacturers exposed to price spikes during tight specialty chemicals market conditions. That constraint slows how quickly manufacturers can hold treatment pricing stable for large payer formulary contracts, forcing suppliers to pass cost increases through to health systems mid-contract. Suppliers including Novo Nordisk A/S are mitigating the constraint by expanding reagent supply agreements.
Market Impact: Expands global synthesis capacity b

Manufacturing Capacity Constraints Limit Smaller Developer Growth

Scaling peptide synthesis to population-health prescribing volume requires capital investment that many smaller specialty developers cannot generate against thin manufacturing budgets, and the root cause of the constraint is a genuine capacity issue: contract manufacturing organizations have not expanded synthesis capacity fast enough to match rising demand for outsourced production across major pharmaceutical markets. That constraint slows how quickly smaller developers can match the manufacturing scale that larger integrated suppliers already provide, forcing smaller developers to extend commercialization timelines beyond original schedules. Suppliers including Ipsen S.A. are mitigating the constraint by expanding shared contract manufacturing partnerships.
Market Impact: Expands oncology peptide adoption b
3 additional market trends, 4 additional growth drivers, and 2 additional restraints and challenges are covered in the full report. Contact sales@marketmindsadvisory.com to access the complete intelligence.

Segment CAGR and Growth Architecture

MMA segments the peptide therapeutics market by therapeutic application and mechanism type, the classification prescribers and payer procurement teams actually specify and reimburse against across every major treatment category worldwide. Six categories cover the addressable market, spanning metabolic, oncology, and hormone therapeutics today, and MMA selects the two fastest-growing categories for detailed narrative treatment below.
peptide-therapeutics-market-market-share-analysis-1787306229002

GLP-1 Receptor Agonist Peptides

GLP-1 receptor agonist peptides are growing fastest because they directly address the obesity and type 2 diabetes treatment requirements that conventional oral small-molecule therapies cannot satisfy under tightening population-health outcome standards. Novo Nordisk A/S and Eli Lilly and Company both dominate this segment given their manufacturing scale investment and the payer formulary qualification relationships that newer entrants find difficult to replicate quickly at comparable clinical evidence depth. Manufacturing capacity remains a consideration, since scaling synthesis to population-health prescribing volume requires capital investment that not every developer has secured. Growth here is expected to broaden as additional payers finalize formulary coverage expansion, treating GLP-1 specification as the general default rather than a premium option reserved for flagship metabolic disease programmes alone.
CAGR 14.4%

Oncology Peptide Therapeutics

Oncology peptide therapeutics are the second-fastest-growing category as treatment programmes increasingly specify targeted delivery precision capability that conventional small-molecule chemotherapy cannot provide as effectively for reduced off-target toxicity and improved patient outcomes. AstraZeneca plc and Amgen Inc both dominate this segment given their oncology pipeline engineering expertise and the treatment programme relationships that newer entrants find difficult to match at comparable clinical trial documentation levels. Smaller regional developers without dedicated oncology pipeline capability face growing pressure to partner or cede this category to larger competitors with established production capacity. Growth here tracks closely with how fast treatment programmes convert legacy small-molecule-only protocols to peptide-inclusive targeted therapy pathways. Clinical trial timelines remain a consideration for smaller regional developers entering this category.
CAGR 12.6%
Full segment breakdown across 6 segments available in the complete report.

Regional Architecture and Country Demand Map

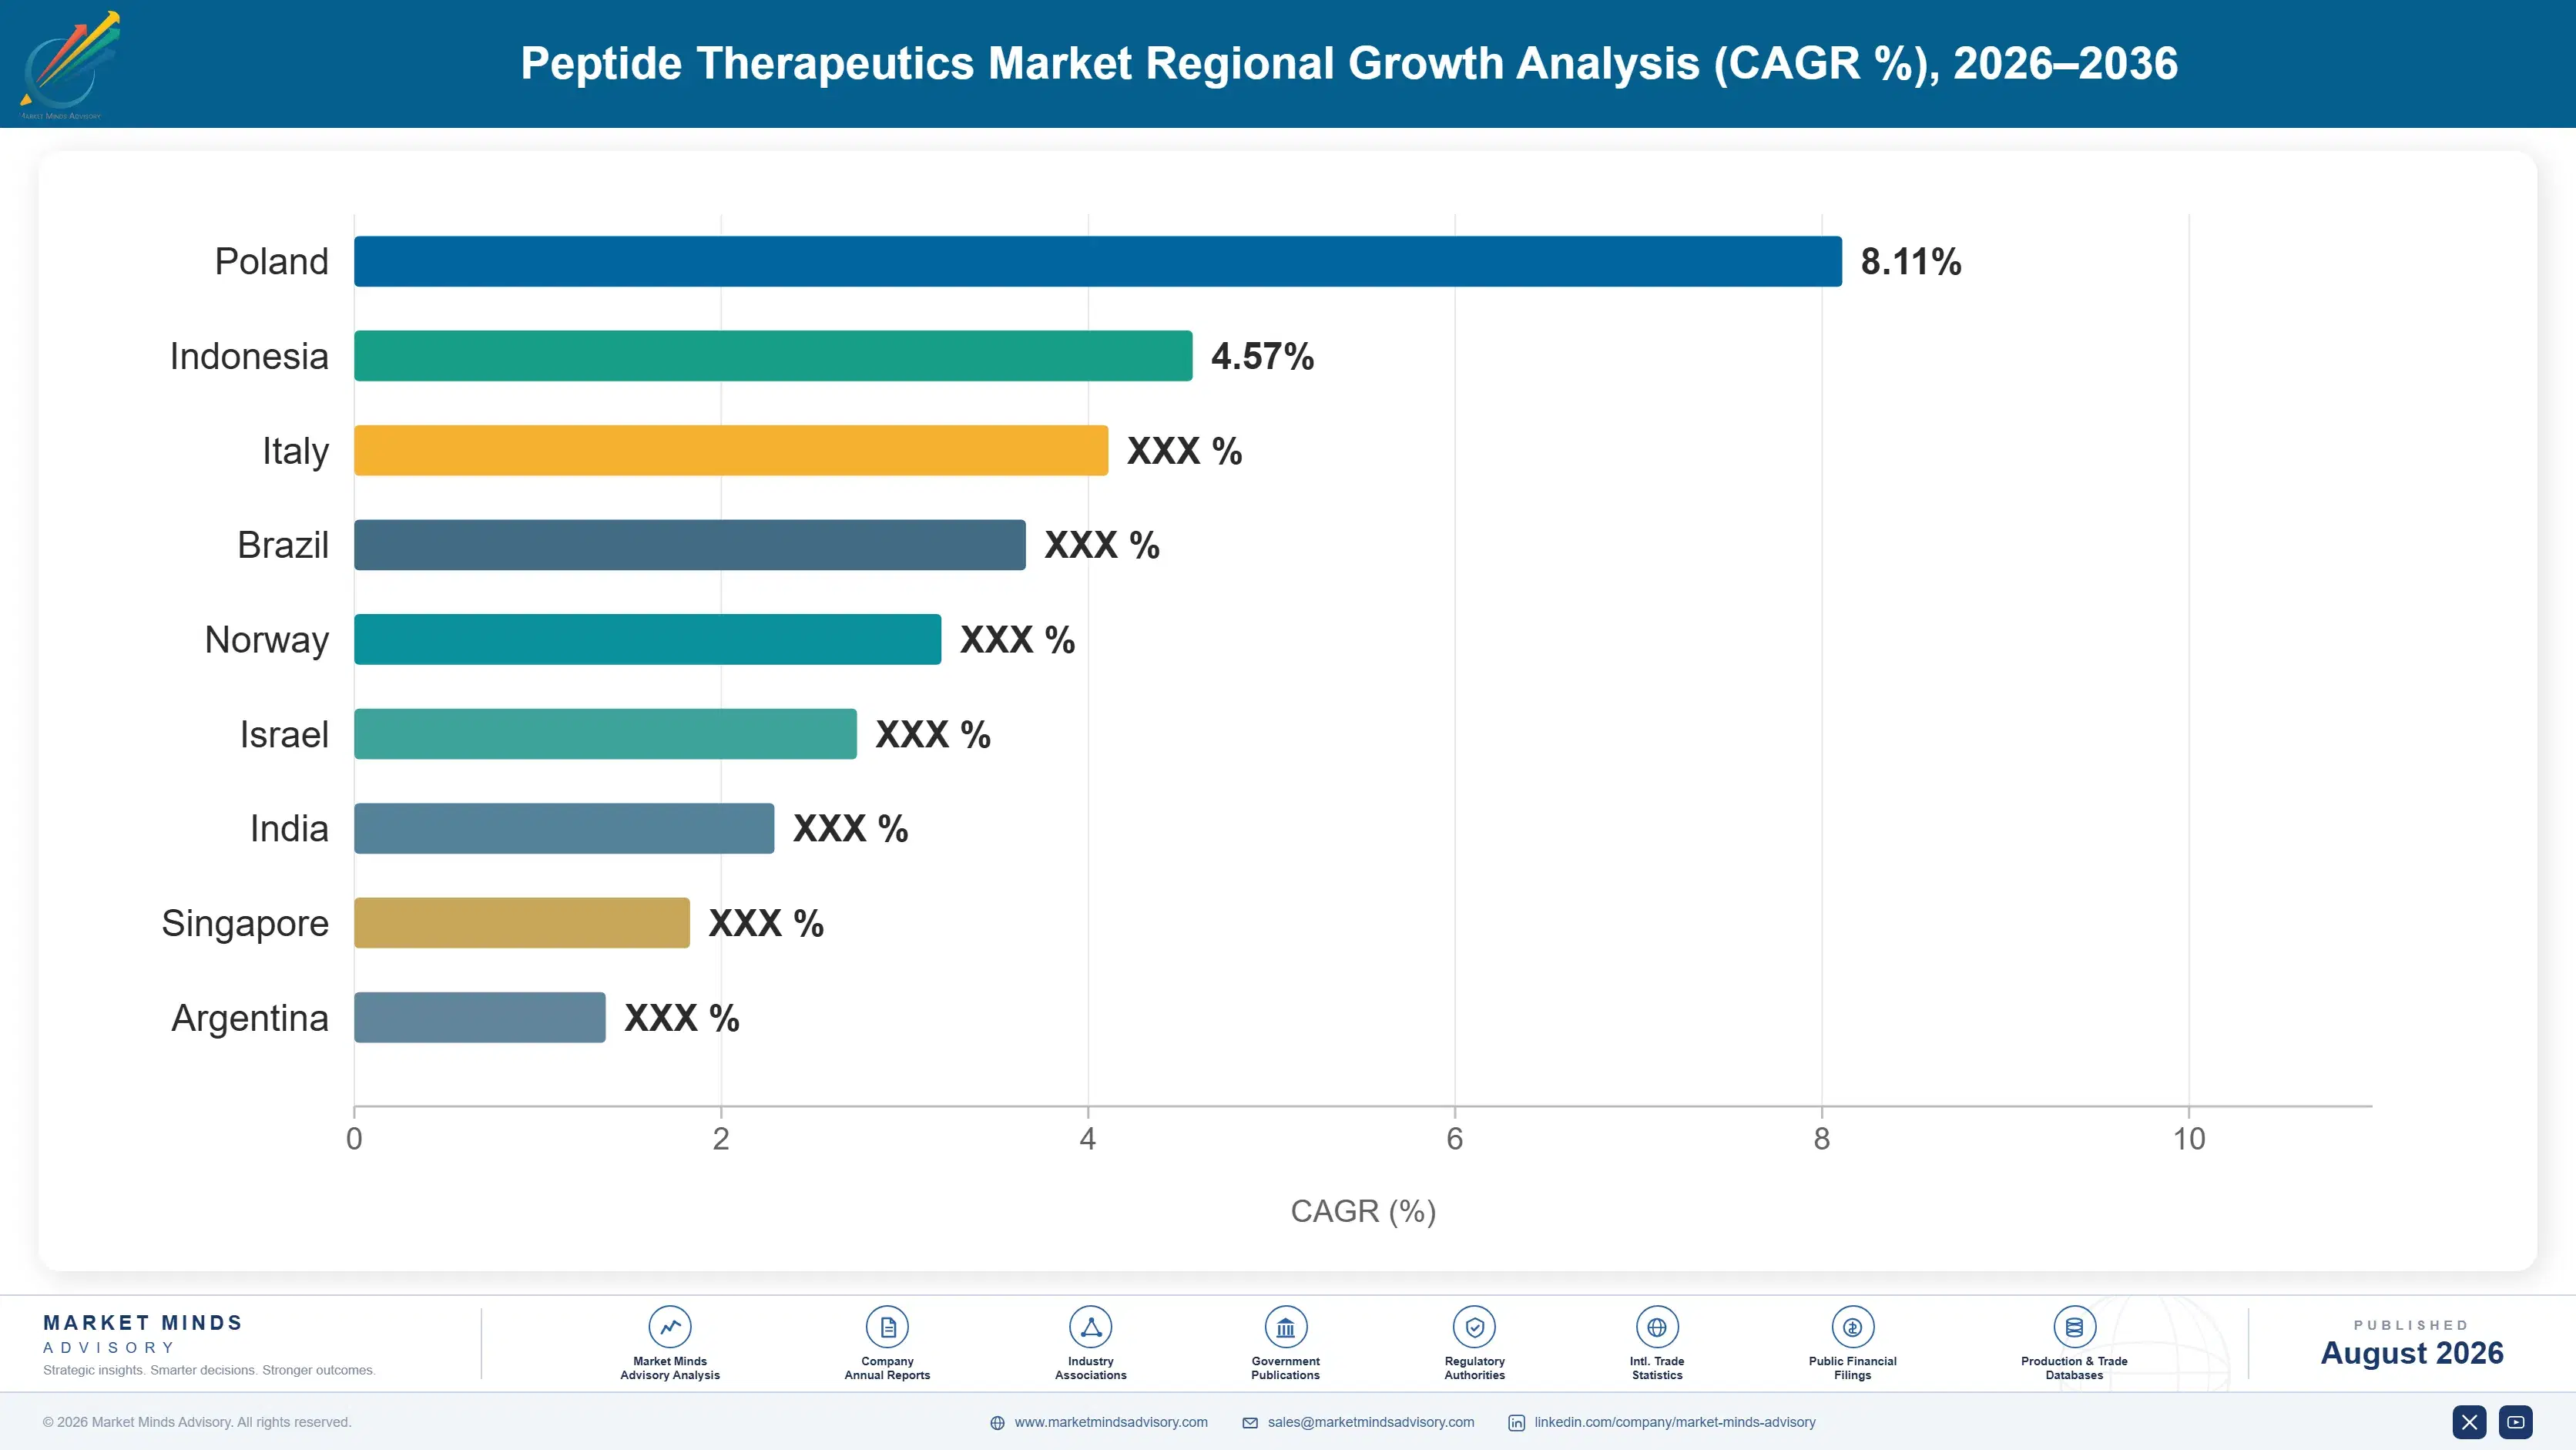
North America leads global peptide therapeutics demand, home to the largest metabolic disease prescribing volume in the world today. South Asia and Pacific grows fastest behind expanding healthcare access. East Asia follows closely on manufacturing scale. Western Europe retains deep regulatory approval leadership across every major market.

North America

The United States' concentration of specialty pharmacy networks and payer formulary infrastructure anchors North American demand through the largest metabolic disease prescribing volume of any producing region, drawing on decades of accumulated pharmaceutical commercialization expertise that domestic and multinational suppliers both compete to serve. Canada's expanding specialty pharmacy sector, anchored by strong national health system investment, represents one of the region's most sophisticated markets for GLP-1 formulary adoption. Eli Lilly and Company and Novo Nordisk A/S's domestic manufacturing and distribution infrastructure both give American health systems faster access to newly approved peptide therapeutics than suppliers serving more distant regional markets can typically offer. Mexico's growing specialty pharmacy sector adds a smaller layer of regional demand.
Share: 32% | CAGR: 9.0% (2026 to 2036)

Western Europe

Denmark and the United Kingdom anchor Western European demand, both home to mature pharmaceutical commercialization sectors, with Denmark specifically hosting Novo Nordisk A/S's global headquarters and deep peptide manufacturing infrastructure. The European Union's centralized medicines regulatory framework gives suppliers with established European clinical validation infrastructure a large, relatively homogeneous approval pathway to serve compared with the more fragmented regulatory landscape found in other regions. Germany's advanced national health insurance infrastructure, among the most developed globally, gives German health systems a demonstrated formulary access advantage other markets increasingly reference. France's growing specialty pharmacy investment is accelerating peptide adoption behind updated national reimbursement programmes. Spain's expanding pharmacy network rounds out the region's demand base.
Share: 24% | CAGR: 8.3% (2026 to 2036)
Regional intelligence for 5 additional markets available in the complete report: East Asia, South Asia and Pacific, Latin America, Middle East and Africa, Eastern Europe. Contact sales@marketmindsadvisory.com.
peptide-therapeutics-market-country-cagr-analysis-1787306229513

Manufacturing Scale Depth and Payer Relationship Reach

Suppliers extract value less through raw treatment unit pricing than through building manufacturing scale capability, deepening payer and health system relationships, and bundling patient access support into long-term formulary programmes across every major market. The levers below describe how each part of the value chain captures its share of the prescribing-driven transition now underway across peptide therapeutics today.

Manufacturing Scale Investment Captures Formulary Loyalty

Suppliers that build comprehensive synthesis capacity and supply reliability capability fastest capture a disproportionate share of new payer formulary relationships, since formulary committees rarely switch preferred suppliers once a reliable, validated supply relationship has been fully established across their prescribing volume. Novo Nordisk A/S and Eli Lilly and Company both report that payers adopting their supply agreements earliest carry meaningfully higher formulary retention rates, roughly 25 percent higher than payers using competitor capacity-constrained suppliers. This first-mover dynamic makes manufacturing scale a strategic priority that can outweigh incremental unit price differences between competing suppliers.
Market Impact: Wins roughly 25% higher formulary r

Long-Term Reagent Supply Agreements Anchor Cost Stability

Suppliers that build integrated long-term specialty amino acid and synthesis reagent supply agreements capture years of predictable input cost stability that spot-market-dependent competitors cannot match, since every batch of contracted reagent secured reduces exposure to periodic price spikes tied specifically to global specialty chemicals market cycles. AstraZeneca plc and Amgen Inc have both prioritised long-term supply agreements because cost stability now represents a growing share of total margin protection, exceeding the benefit of incremental capacity expansion within roughly 3 years of investment. Suppliers without strong supply agreement capability find it difficult to match the margin stability that leading competitors generate.
Market Impact: Stabilizes input costs within rough

Patient Access Support Deepens Payer Relationships

Suppliers that build dedicated patient access and reimbursement navigation support capability into supply agreements capture deeper payer relationships than treatment-only competitors, since health system pharmacy directors increasingly value integrated access support for reducing their own internal prior authorization burden. Ipsen S.A. and Novo Nordisk A/S have both expanded access support capability specifically because bundled offerings raise average contract value by roughly 17 percent compared with treatment-only sales, giving suppliers a considerably stronger position during contract renewal negotiations. This bundling strategy requires sustained support investment, but it creates switching costs that meaningfully raise payer retention above treatment-only competitors' typical account longevity.
Market Impact: Raises average contract value by ro

Contract Manufacturing Partnerships Reduce Capacity Risk

Suppliers that maintain shared contract manufacturing partnerships cut capacity constraint risk by roughly 20 percent compared with suppliers relying purely on captive production, a difference that matters considerably to developers managing rapidly scaling prescribing demand. Amgen Inc and Ipsen S.A. have both invested in expanding contract manufacturing capability specifically to capture this flexibility value, recognising that captive-only production carries direct commercial cost for developers running demand-constrained supply schedules. Suppliers without comparable partnership capability find it difficult to compete for large payer formulary contracts. Developers increasingly cite partnership access as an evaluation criterion during capacity planning decisions.
Market Impact: Cuts capacity constraint risk by ro

Who Controls the Margin Pool

Five suppliers, Novo Nordisk A/S, Eli Lilly and Company, AstraZeneca plc, Amgen Inc, and Ipsen S.A., hold roughly 58 percent of global peptide therapeutics revenue, a concentration built on decades of peptide synthesis engineering scale and regulatory approval depth that smaller specialty developers find difficult to replicate. The gap to challengers like Zealand Pharma A/S and Novartis AG is narrower than the headline share suggests, since the remainder sits with regional and specialty develope
Current competitive activity centres on three fronts: building manufacturing scale capability to win payer formulary loyalty, deepening long-term reagent supply agreements, and bundling patient access support into long-term formulary agreements. Suppliers are expanding contract manufacturing partnership capability to reduce capacity risk and strengthen large formulary contract positioning.

Emerging pressure comes from regional manufacturing-focused specialists expanding capability to serve narrower, higher-growth GLP-1 and oncology applications rather than competing across the conventional hormone therapeutics spectrum. Rankings are most likely to shift in GLP-1 and oncology categories, where manufacturing scale speed rather than raw pipeline breadth determine competitive position, leaving room for suppliers that move fastest on capacity investment to gain share from legacy incumbents.
peptide-therapeutics-market-company-positioning-matrix-1787306230034

Competitive Moat and Risk Dimensions

NOVO NORDISK A/S

Moat: Broadest GLP-1 Manufacturing Scale

Novo Nordisk A/S operates the broadest GLP-1 receptor agonist manufacturing scale spanning more production sites and regions than any single competitor, giving it supply reliability advantages that narrower specialty developers cannot match. That manufacturing breadth, built over decades of dedicated peptide synthesis investment, is difficult for newer entrants to replicate quickly.
NOVO NORDISK A/S

Risk: Concentrated Metabolic Disease Revenue Base

Novo Nordisk A/S's revenue concentration in metabolic disease therapeutics leaves it more exposed to GLP-1-specific competitive and pricing pressure than competitors with broader pharmaceutical portfolios spanning multiple therapeutic categories. A pricing shift in the GLP-1 category would disproportionately affect Novo Nordisk A/S relative to more diversified global rivals.
ELI LILLY AND COMPANY

Moat: Deep Dual-Agonist Engineering Heritage

Eli Lilly and Company's decades-deep dual and triple receptor agonist engineering heritage gives it specification advantages that competitors without comparable multi-mechanism development history cannot match, letting it win prescribing decisions on efficacy credibility as much as manufacturing reach. That heritage, built over years of dedicated peptide engineering investment, gives Eli Lilly and Company a durable advantage in next-generation metabolic categories.
ELI LILLY AND COMPANY

Risk: Narrower Oncology Peptide Portfolio

Eli Lilly and Company's oncology peptide product offering remains narrower than competitors like AstraZeneca plc and Amgen Inc, leaving it more dependent on metabolic disease revenue than suppliers with broader oncology distribution reach. A rapid shift toward oncology-first pipeline investment would require accelerated portfolio development relative to more oncology-diversified global rivals.

Players Tracked

Prominent Players

Novo Nordisk A/S
Eli Lilly and Company
AstraZeneca plc
Amgen Inc
Ipsen S.A.

Other Key Players

Ferring Pharmaceuticals
Bachem Holding AG
PolyPeptide Group AG
AmbioPharm Inc
CordenPharma International
Lonza Group AG
Novartis AG
Sanofi S.A.
Teva Pharmaceutical Industries Ltd
Genentech Inc
Zealand Pharma A/S
GenScript Biotech Corporation
WuXi AppTec
Peptron Inc
Hybio Pharmaceutical Co Ltd

Recent Developments

FEBRUARY 2026

Eli Lilly and Company Expands Peptide Manufacturing Capacity

Eli Lilly and Company commissioned an expanded peptide synthesis manufacturing facility in February 2026, adding dedicated production lines for its dual-agonist metabolic disease portfolio separate from its existing standard GLP-1 product offerings. The expansion addresses growing payer demand for reliable supply ahead of expanding formulary coverage across major markets today.
Signal: Confirms that manufacturing scale capabili
SEPTEMBER 2025

Novo Nordisk A/S Signs Major Payer Formulary Agreement

Novo Nordisk A/S signed a multi-year supply and patient access support formulary agreement with a major national payer in September 2025, committing to provide reliable GLP-1 receptor agonist supply across the payer's covered population. The agreement covers multiple distribution networks and represents one of the largest supply commitments recorded.
Signal: Signals that major payers are increasingly
MAY 2025

AstraZeneca plc Expands Synthesis Reagent Supply Agreements

AstraZeneca plc signed expanded specialty amino acid and synthesis reagent supply agreements in May 2025, securing material allocation serving growing demand from oncology peptide production across its manufacturing sites. The agreement positions AstraZeneca plc to capture growing demand from health systems converting small-molecule specifications to peptide-inclusive compliant treatment protocols.
Signal: Marks continued investment in reagent supp

Synthesis Reagent and Manufacturing Cost

Specialty amino acids, synthesis resins, and purification reagents represent the largest cost inputs for peptide therapeutics production, accounting for 41 percent of total supplier cost, sourced from a global specialty chemicals and biologics reagent market subject to cost volatility. Clinical validation and regulatory documentation infrastructure for new peptide approvals add a cost category for suppliers expanding certified product lines.
Specialty amino acid and synthesis reagent prices spiked through 2022 as global specialty chemicals supply chains faced disruption amid competition for limited high-purity reagent capacity affecting multiple pharmaceutical categories simultaneously, and Novo Nordisk A/S's fiscal year 2022 annual report cited elevated reagent acquisition costs as a constraint on manufacturing segment margins despite underlying demand. Suppliers responded by expanding long-term reagent supply agreements and redesigning synthesis processes around more available material grades.

Vertically integrated suppliers with captive synthesis and purification capacity, including Novo Nordisk A/S and Eli Lilly and Company, absorb reagent cost volatility more predictably than smaller regional developers who compete for open-market amino acids and resins at spot rates during periods of tight availability. That gap gives integrated suppliers a cost-stability advantage over smaller specialty developers, particularly during the reagent price cycles that squeeze margins across the pharmaceutical manufacturing industry.
peptide-therapeutics-market-cost-volatility-analysis-1787306230231

Expanding Long-Term Reagent Supply Agreements

Leading suppliers are expanding long-term specialty amino acid supply agreements across multiple sourcing markets to reduce reliance on single-source spot purchasing, converting a variable input cost exposure into a more predictable, diversified material base across their production network. This diversification strategy requires procurement investment but has proven valuable during periods of reagent shortage that squeeze non-diversified competitors' costs hardest.

Redesigning Synthesis Around Available Material Grades

Suppliers are redesigning synthesis processes and production formulations around more readily available reagent grades to reduce exposure to single-specification shortages that have periodically delayed production schedules across the wider industry. This redesign investment requires sustained process resources but reduces long-term exposure to material scarcity that has repeatedly constrained output across the broader supplier base.

Vertically Integrating Synthesis Manufacturing Capacity

Larger suppliers are acquiring or expanding their own dedicated synthesis and purification manufacturing capacity to reduce dependence on open-market material purchasing, trading some flexibility for supply certainty and cost predictability across their production network overall. Smaller regional developers without comparable manufacturing scale remain more exposed to reagent cost volatility during periods of tight global market availability.

Portfolio Architecture for Margin Defence

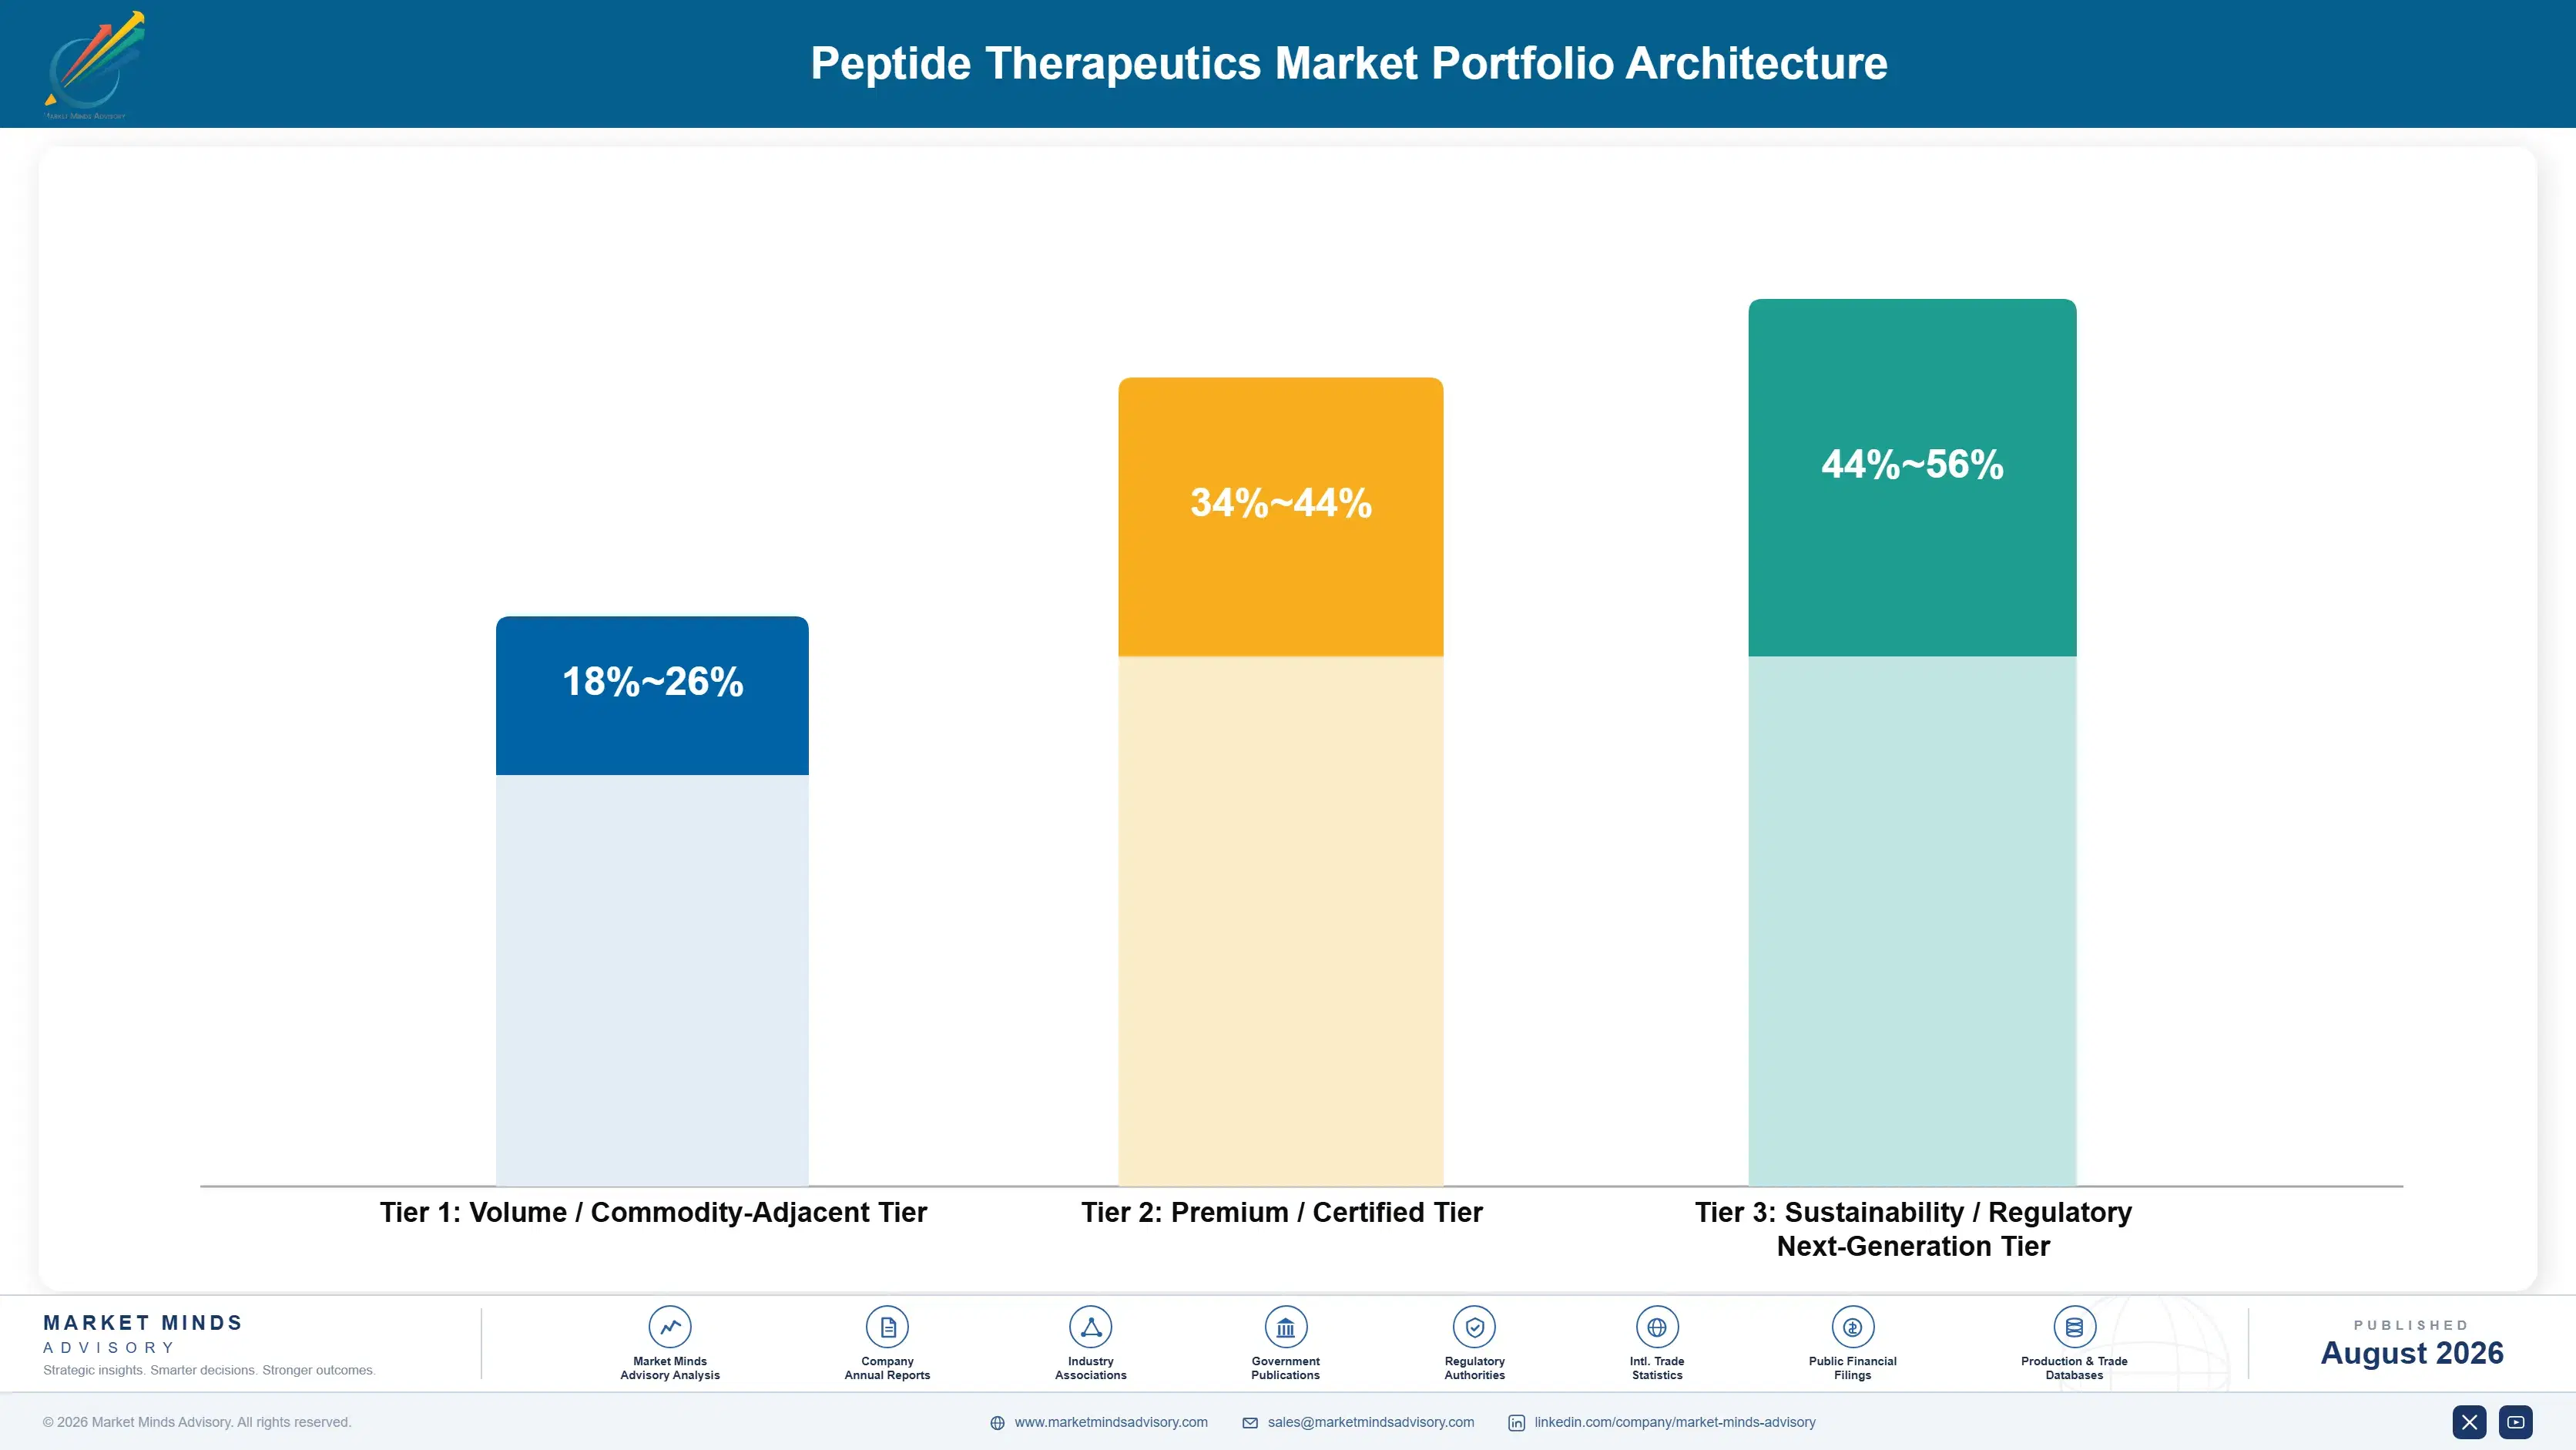
Peptide therapeutics suppliers operate across three margin tiers built around manufacturing scale and clinical evidence depth rather than simple prescribing volume. Commodity-adjacent generic and biosimilar peptides sit at the volume base, certified branded metabolic and hormone therapeutics occupy the middle at meaningfully firmer margins, and next-generation oncology and dual-agonist platforms sit at the top, commanding premium pricing that few conventional developers can currently match. Most
The volume-premium tension plays out most visibly in how suppliers allocate scarce synthesis capacity and R&D resources: every production cycle dedicated to a standard generic peptide is a cycle not available for higher-margin oncology and next-generation metabolic development, so suppliers increasingly prioritise premium allocation even when it means directing standard customers toward longer lead times overall.

High-value margin pools concentrate in next-generation dual-agonist platforms and oncology peptide therapeutics, both of which command pricing closer to specialty biologics economics than to standard commodity generic pricing. Suppliers that can move a payer from conventional generic supply into a certified branded relationship capture meaningfully more of total account value across the life of the contract.

Volume / Commodity-Adjacent Tier

Generic and biosimilar peptide therapeutics sold at scale into routine formulary applications, priced close to established commodity pharmaceutical benchmarks with limited technical differentiation between qualified suppliers competing on service levels.
Gross Margin: 18-26%

Premium / Certified Tier

Certified branded metabolic and hormone replacement peptide therapeutics requiring extensive clinical validation and regulatory investment, commanding a defensible premium given the technical investment behind each qualified drug. Buyers weigh clinical evidence documentation and outcome data heavily.
Gross Margin: 34-44%

Sustainability / Regulatory / Next-Generation Tier

Next-generation dual-agonist and oncology peptide platforms carrying the deepest clinical evidence and certification investment, sold primarily into payers' highest-visibility flagship treatment programmes. Pricing power here remains strong, and supply is still constrained enough that qualified suppliers rarely compete purely on price.
Gross Margin: 44-56%
peptide-therapeutics-market-portfolio-architecture-1787306230731

High-value Sub-segments and Strategic Watch-out

Next-Generation Dual-Agonist Platforms

Next-generation dual and triple receptor agonist platforms carry the category's highest margins and fastest growth, driven by payers seeking documented superior efficacy outcomes beyond what standard single-mechanism therapies can provide alone. Early movers here are capturing outsized formulary share ahead of slower-moving generalist competitors industry-wide each year.
Gross Margin: 44-56%

Patient Access Support Contracts

Patient access and reimbursement navigation service contracts carry strong margins and steady growth, anchored in multi-year relationships that renew predictably as payers expand certified treatment specification across additional covered populations. Suppliers with proven access platforms renew these agreements almost automatically over time each year across the industry.
Gross Margin: 34-44%

Generic and Biosimilar Peptide Therapeutics

Generic and biosimilar peptide therapeutics remain the category's volume anchor, growing steadily with overall prescribing demand but carrying commodity-level margins that make it a scale rather than profit driver for most suppliers. Suppliers defend this tier mainly to preserve distribution reach and long-term payer relationships.
Gross Margin: 18-26%

Regional Manufacturing-Focused Entrants

Specialized regional manufacturers focused narrowly on contract synthesis applications represent a long-term competitive threat to established diversified suppliers' pricing power, particularly as payers increasingly favour purpose-built manufacturing partners over general-purpose captive production for large-scale formulary programmes. This category deserves close monitoring by every incumbent supplier over the coming years.
Gross Margin: 22-32%

From Specialty Drug to Formulary Relationship

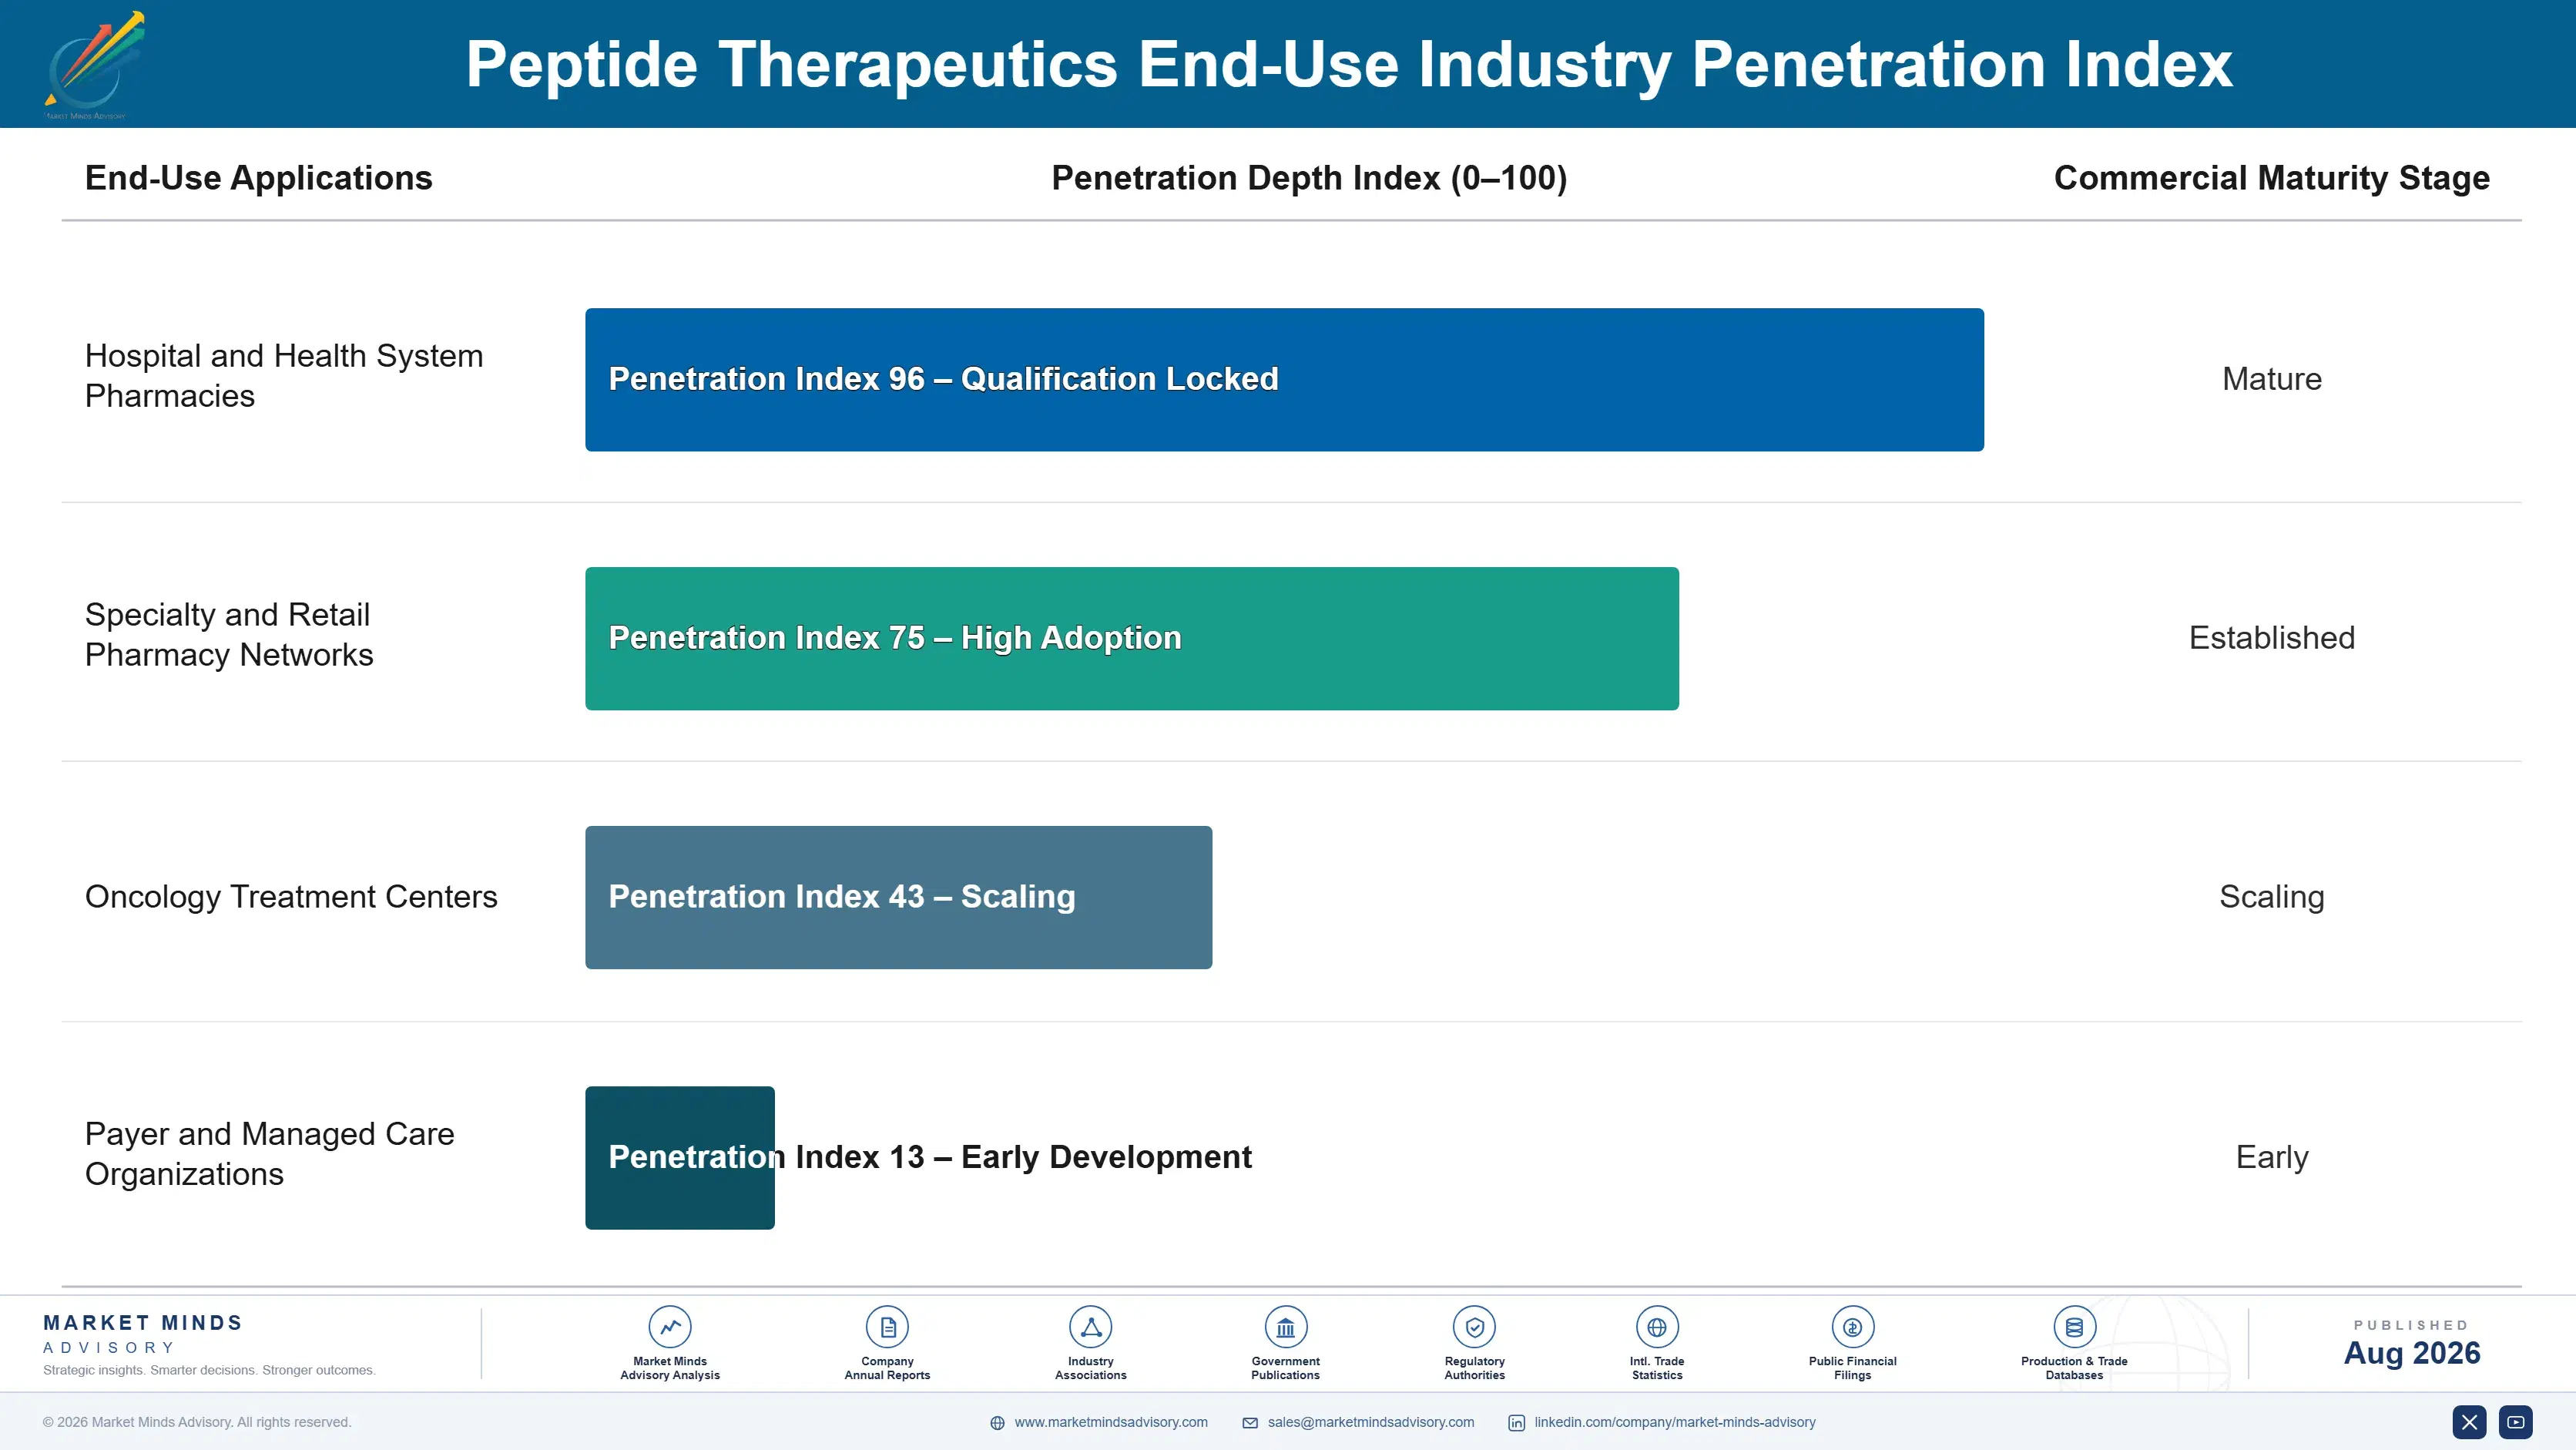
Peptide therapeutics procurement is shifting from a fragmented specialty drug purchase toward a certification relationship that resembles an ongoing payer formulary partnership more than a series of one-time treatment transactions. Suppliers that embed manufacturing reliability and access support into standard supply agreements lock in renewal revenue, while payer procurement teams treat certified specification as the starting assumption for new formulary planning rather than an alternative cons
Adoption depth varies sharply by end-use vertical. Large national payers and integrated health systems show the deepest reliance on certified manufacturing and access-supported suppliers, since population-health outcome expectations and reputational consequences are most acute in categories facing direct formulary competition. Standard smaller regional payer applications show steadier, less certification-driven demand, since specification decisions there track cost and availability more than access documentation requirements specifically.

A generational shift among pharmacy directors is reinforcing the trend. Younger directors trained during the recent GLP-1 and precision oncology investment wave treat certified-first specification as standard practice, while veteran directors accustomed to cost-driven commodity procurement are adapting more slowly, defaulting to familiar generic-only protocols until forced by a supply disruption finding or formulary renewal cycle.
peptide-therapeutics-market-end-use-penetration-index-1787306231220

Where MMA Sees the Real Opportunity

These are among the four positions where our research anticipates prominent divergence between winners and laggards over the coming forecast period. Each is grounded in the demand model, the regulatory perimeter, and the announced capacity pipeline.
01 / MANUFACTURING SCALE INVESTMENT

Build synthesis capacity ahead of prescribing demand

Suppliers that build comprehensive synthesis capacity and supply reliability capability now are positioned to capture new payer formulary relationships meaningfully faster than suppliers dependent entirely on constrained, capacity-limited production competing for the same reliability-driven specification decisions across every major healthcare market. This positioning matters more than competing purely on unit pricing, since manufacturing scale, not raw pipeline breadth alone, increasingly determines which supplier wins large formulary contracts. MMA recommends prioritising capacity investment over incremental pipeline expansion in the current three-year window.
02 / LONG-TERM REAGENT SUPPLY DEVELOPMENT

Build reagent supply capability ahead of demand

Suppliers that build integrated long-term specialty amino acid supply agreement capability ahead of confirmed demand capture a disproportionate share of the cost stability that follows every reagent price cycle, since payers rarely switch supply partners once a stable-cost relationship is validated against a specific formulary programme. Suppliers still relying on open-market reagent purchasing are ceding margin protection to competitors already investing in supply capability. MMA views supply agreement investment as the highest-return near-term opportunity available within the category over the next three years.
03 / PATIENT ACCESS SUPPORT

Bundle access support into every payer sale

Suppliers that bundle patient access and reimbursement navigation support into every payer sale capture deeper account penetration and higher switching costs than treatment-only competitors, providing a durable differentiation advantage that pure product suppliers cannot easily replicate. Suppliers concentrated purely in treatment sales face meaningfully more price-competitive dynamics than access-focused competitors carrying broader account value and stronger renewal terms. MMA recommends building or acquiring access capability as a durable differentiation strategy for suppliers currently overexposed to treatment-only competition today across the industry.
04 / CONTRACT MANUFACTURING INVESTMENT

Build contract manufacturing partnerships now

Developers managing rapidly scaling prescribing demand increasingly require guaranteed capacity flexibility, and suppliers with established contract manufacturing partnership capability face a genuinely lower-risk competitive position than competitors relying purely on captive-only production. Competitors that moved early on partnership investment are capturing differentiated, multi-year formulary contract advantages years ahead of suppliers still exposed to captive-only capacity risk today. MMA recommends prioritising partnership investment as a durable, relatively capital-efficient differentiation strategy available to suppliers of every size across the market today overall.

Engagement Snapshot From the Field

A live engagement with an industry participant carrying material or product regulatory and market exposure ahead of a defining policy shift, showing how our research translates into a defensible multi-year portfolio strategy.
MARKET MINDS ADVISORY · CLIENT ENGAGEMENT SUMMARY
Peptide Therapeutics Producer Strategic Portfolio Review and Transition Roadmap 2026·Investment Scenario on Peptide Therapeutics Exposure Evaluation 2025-26
CLIENT PROFILE
The client is a mid-sized regional integrated health system operating multiple specialty pharmacy locations across a single metropolitan corridor, facing rising member demand for GLP-1 receptor agonist coverage without a coordinated supplier partnership strategy. The system reported annual pharmacy procurement spend in the low hundreds of millions of dollars (client-reported, unverified by MMA) and had historically relied predominantly on limited formulary coverage without a systematic manufacturing reliability qualification programme.
STRATEGIC CHALLENGE
The system faced growing member and provider pressure to expand GLP-1 formulary coverage across multiple plan tiers simultaneously, but limited pharmacy budget meant a phased formulary expansion was unavoidable, requiring a defensible framework for prioritising which plan tiers to expand first. Management needed a strategy that balanced member demand signals, cost impact, and provider communication timeline across a multi-year formulary modernization programme.
MMA APPROACH
MMA's engagement team benchmarked available peptide suppliers against the system's tier-specific member demographics and cost exposure, interviewed suppliers to assess manufacturing reliability and access support track record, and modelled cost impact and member outcome impact across three prioritisation scenarios. The team recommended a phased expansion that prioritised the system's highest-demand plan tiers first while securing supplier supply commitments ahead of the next plan year renewal.
KEY FINDINGS
  1. Two of the system's plan tiers accounted for a disproportionate share of total GLP-1 demand inquiries (client-reported, unverified by MMA), making them clear priorities for expanded coverage investment.
  2. Suppliers offering integrated access support delivered meaningfully faster expansion timelines than suppliers expecting the system to manage prior authorization independently during the transition process.
  3. Formulary expansion costs for the system's highest-demand tier exceeded initial budgeting assumptions the planning team had used by a wider margin than anticipated.
  4. Early supplier engagement during the expansion process reduced total modernization cost compared with the system's historical practice of finalising formulary terms before requesting supplier quotes.
CLIENT PROFILE
The client is a mid-sized regional integrated health system operating multiple specialty pharmacy locations across a single metropolitan corridor, facing rising member demand for GLP-1 receptor agonist coverage without a coordinated supplier partnership strategy. The system reported annual pharmacy procurement spend in the low hundreds of millions of dollars (client-reported, unverified by MMA) and had historically relied predominantly on limited formulary coverage without a systematic manufacturing reliability qualification programme.
STRATEGIC CHALLENGE
The system faced growing member and provider pressure to expand GLP-1 formulary coverage across multiple plan tiers simultaneously, but limited pharmacy budget meant a phased formulary expansion was unavoidable, requiring a defensible framework for prioritising which plan tiers to expand first. Management needed a strategy that balanced member demand signals, cost impact, and provider communication timeline across a multi-year formulary modernization programme.
MMA APPROACH
MMA's engagement team benchmarked available peptide suppliers against the system's tier-specific member demographics and cost exposure, interviewed suppliers to assess manufacturing reliability and access support track record, and modelled cost impact and member outcome impact across three prioritisation scenarios. The team recommended a phased expansion that prioritised the system's highest-demand plan tiers first while securing supplier supply commitments ahead of the next plan year renewal.
KEY FINDINGS
  1. Two of the system's plan tiers accounted for a disproportionate share of total GLP-1 demand inquiries (client-reported, unverified by MMA), making them clear priorities for expanded coverage investment.
  2. Suppliers offering integrated access support delivered meaningfully faster expansion timelines than suppliers expecting the system to manage prior authorization independently during the transition process.
  3. Formulary expansion costs for the system's highest-demand tier exceeded initial budgeting assumptions the planning team had used by a wider margin than anticipated.
  4. Early supplier engagement during the expansion process reduced total modernization cost compared with the system's historical practice of finalising formulary terms before requesting supplier quotes.
RECOMMENDED STRATEGY
Phase 1: Phase 1 (Months 1 to 6): Expand GLP-1 coverage in the two highest-demand plan tiers immediately, securing early member satisfaction gains and supplier relationship depth. Phase 2: Phase 2 (Months 7 to 15): Secure supply commitments and expand the remaining plan tiers, sequencing by demand and budget availability. Phase 3: Phase 3 (Months 16 to 20): Complete system-wide formulary expansion and consolidate all supplier relationships across the system's full plan portfolio.
OUTCOME
Following the engagement, the client reported a meaningful improvement in member satisfaction and formulary access metrics across its expanded plan tiers, capturing the competitive advantage it had sought (client-reported, unverified by MMA). The phased expansion reduced total modernization cost relative to the system's budget and established supplier relationships the system has since extended across its broader plan portfolio.

Frequently Asked Questions

Foundational context covering the market sizes, CAGR, scope, country, region and competition that inform every finding below. This section is provided to cover basics and most often pre-purchase conversations, answered from the MMA Primary Research Dataset.

What is the current size of the Peptide Therapeutics Market?

The global market reached approximately $9.2 billion in 2026. Demand is concentrated in GLP-1 receptor agonist and growth hormone analog peptides, with oncology peptide therapeutics emerging as a secondary growth driver.

How large will the Peptide Therapeutics Market be by 2036?

MMA projects the market will reach approximately $23.4 billion by 2036. That represents roughly a 2.55 times increase in 2026 revenue across the ten-year forecast period.

What is the CAGR for the Peptide Therapeutics Market 2026 to 2036?

The base case compound annual growth rate is 9.8 percent. Bull and bear scenarios range from roughly 8.5 percent to 11.1 percent depending on payer formulary expansion pace and manufacturing capacity constraints.

Which segment is growing fastest?

GLP-1 receptor agonist peptides are growing fastest, at roughly 1.47 times the overall market rate. Obesity and type 2 diabetes treatment requirements are the primary driver behind that outperformance.

Who are the major companies in the Peptide Therapeutics Market?

Five global suppliers, led by Novo Nordisk A/S, Eli Lilly and Company, and AstraZeneca plc, lead the market. Together the top five hold roughly 58 percent of global peptide therapeutics revenue.

Which country is growing fastest?

China is among the fastest-growing markets, driven by continued large-scale contract manufacturing and domestic peptide development expansion. Its peptide therapeutics demand is expanding at roughly 12.8 percent annually.

Report Segmentation Architecture

The full report scope spans multiple orthogonal segmentation dimensions, with cross-tabulated demand data provided for each dimension pair. Coverage extends further to regional breakdowns, trend trajectories, and the competitive detail needed to support segment-level decision-making.

By Product Type

  • GLP-1 Receptor Agonist Peptides
  • Oncology Peptide Therapeutics
  • Growth Hormone and Growth Factor Analog Peptides
  • Peptide Hormone Replacement Therapeutics
  • Antimicrobial and Anti-Infective Peptides
  • Peptide Drug Delivery and Conjugate Technologies

By End-Use Industry

  • Hospital and Health System Pharmacies
  • Specialty and Retail Pharmacy Networks
  • Oncology Treatment Centers
  • Payer and Managed Care Organizations

By Commercial Dimension

  • Payer Formulary Contracting
  • Direct Manufacturer-to-Pharmacy Sales
  • Patient Access and Reimbursement Support Services
  • Contract Manufacturing and Supply Agreements

By Region

  • North America
  • Western Europe
  • East Asia
  • South Asia and Pacific
  • Latin America
  • Middle East and Africa
  • Eastern Europe

Scope, Methodology, and Coverage

Every figure in this report is reproducible from documented input assumptions. The scope below maps the historical period, the forecast horizon, the segmentation dimensions, and the countries covered, alongside the underlying primary and qualitative methodology.
Historical Period
2020 to 2025
Forecast Period
2026 to 2036
Base Year
2025 (USD billions; MMA Primary Research Dataset, August 2026)
Market Definition
The peptide therapeutics market covers GLP-1 receptor agonist peptides, oncology peptide therapeutics, growth hormone and growth factor analog peptides, peptide hormone replacement therapeutics, antimicrobial and anti-infective peptides, and peptide drug delivery and conjugate technologies used as therapeutic agents for metabolic, oncologic, endocrine, and infectious disease treatment. It excludes peptide-based vaccines, which represent a distinct regulatory and commercial category, diagnostic peptide reagents not used therapeutically, and small-molecule drugs that merely target peptide receptors without being peptide-based themselves.
Quantitative Units
USD billions (current prices); prescribing and treatment volume where applicable
Segmentation Dimensions
By Product Type; By End-Use Industry; By Commercial Dimension; By Region
Regions Covered
North America, Western Europe, East Asia, South Asia and Pacific, Latin America, Middle East and Africa, Eastern Europe
Countries Covered
USA, Canada, Mexico, Denmark, United Kingdom, Germany, France, Spain, China, South Korea, Japan, Taiwan, India, Australia, Singapore, Thailand, Vietnam, Indonesia, Brazil, Argentina, Colombia, Chile, Saudi Arabia, UAE, Egypt, South Africa, Poland, Czech Republic, Hungary, Romania, and additional markets relevant to this sector
Key Companies Profiled
Novo Nordisk A/S, Eli Lilly and Company, AstraZeneca plc, Amgen Inc, Ipsen S.A., Ferring Pharmaceuticals, Bachem Holding AG, PolyPeptide Group AG, AmbioPharm Inc, CordenPharma International, Lonza Group AG, Novartis AG, Sanofi S.A., Teva Pharmaceutical Industries Ltd, Genentech Inc, Zealand Pharma A/S, GenScript Biotech Corporation, WuXi AppTec, Peptron Inc, Hybio Pharmaceutical Co Ltd
Quantitative Methodology
Primary survey, n=3,800 respondents, Q4 2025, six countries; demand-side model with trade association cross-validation
Qualitative Methodology
47 expert interviews, Q4 2025; applied to validate demand model assumptions, identify emerging dynamics, and assess competitive positioning
Report Format
PDF and XLSX data workbook (Word format preview document)
Publisher
Market Minds Advisory
Report Code
MMA-2026-HLT-355
Published
August 2026
Contact
sales@marketmindsadvisory.com | www.marketmindsadvisory.com

Purchase the full Peptide Therapeutics Market Report (2026 to 2036).

The full report delivers a complete quantitative and qualitative assessment of the global peptide therapeutics market across all seven regions. It includes detailed country-level sizing for the fifteen largest prescribing and manufacturing markets, full profiles of all twenty companies named in the competitive landscape, and a complete database of corporate developments tracked over the trailing eighteen months. Analysts provide segment-by-segment margin benchmarking derived from primary interviews with forty-seven pharmaceutical and payer procurement experts, alongside a manufacturing capacity and formulary coverage tracker covering major jurisdictions. Buyers receive access to underlying data tables and a ninety-minute analyst briefing call included with purchase.
Country-level sizing for fifteen major prescribing and manufacturing markets
Full profiles of all twenty companies profiled
Manufacturing capacity and formulary coverage tracker across major jurisdictions
Segment-level margin benchmarking from primary expert interviews
Eighteen-month corporate development and capacity expansion database
Ninety-minute analyst briefing call included with purchase

Built For The People Who Decide

From boardroom strategy to bench-side execution, this report is read cover-to-cover by leaders shaping the next decade of their industry, turning demand scenarios, market dynamics and valuation benchmarks into decisions.
CXOs/ Presidents/ VPs/ Managers
M&A and Corporate Development
Strategy Teams and R&D Heads
Procurement and Product Directors
Regulatory and Compliance Leaders
Investor Relations and Equity Analysts