Market Minds Advisory
Pediatric Tube Feeding Market

Pediatric Tube Feeding Market: Reimbursement Listing, Blenderised Demand From Parents and the Shift Into Home Care

Parents blending real food at home forced a clinical conversation manufacturers had avoided for years, while reimbursement listing rather than product performance still decides which formulas reach the children who need them.

Lead Analyst

Lisa Gevelber

Published

September 2026

Make Smarter Decisions with Customized Research Insights

Request a free sample report and evaluate market opportunities, growth trends, and competitive dynamics relevant to your business needs.

2025 MARKET VALUE$2.8BMarket Size 2025
2036 FORECAST VALUE$6.3BBase Case , 2026 to 2036
CAGR 2026 TO 20367.6 %Bull 8.8% / Bear 6.4%
INCREMENTAL OPPORTUNITY$3.2BNet 10- year value creation
EXPANSION MULTIPLE2.08x2036 value over 2026 base
Strategic Levers
M&A Pipeline
Regional Outlook
Country Rankings
Competitive Intelligence
Segmental Deep-dive
Call-Us : 91 93563 13602

Executive Snapshot and Market Trajectory

The most consequential change in pediatric tube feeding came from parents, not from clinicians or manufacturers. Families blending real food at home and pushing it through tubes forced a conversation the industry had spent years avoiding, and the commercial products followed. It took about a decade of argument.
Blenderised whole food formulas carry the growth on tolerance improvements dietitians can measure, with retching and reflux falling in many children. Peptide-based formulas grow nearly as fast on clinical indication rather than preference. North America holds the largest share because home enteral nutrition is reimbursed there rather than paid out of pocket, which is what makes formula a funded therapy instead of a household expense.
Concentration reads at 62% for the top five, high because reimbursement listing and clinical qualification both narrow the field severely before price is ever discussed. Roughly 58% of volume is now delivered at home rather than in hospital, which changed the customer from a procurement department to a family working through a home care supplier and a dietitian together. Specialists built real positions while established companies hesitated over a category they had spent years discouraging.
Market Definition
This market covers enteral nutrition formulas and delivery consumables for children fed by tube, spanning standard polymeric formulas, peptide-based and semi-elemental formulas, amino acid-based elemental formulas, blenderised whole food formulas, and modular and specialty metabolic products, together with pediatric feeding sets and pumps. Adult enteral nutrition, parenteral nutrition, infant formula for oral feeding, and surgical tube placement procedures are excluded.
Base Year Value
$2.8B in 2025 (MMA Primary Research Dataset, August 2026)
Forecast Period
2026 to 2036, eleven discrete annual values
CAGR
7.6% base case. Bull 8.8%. Bear 6.4%.
Fastest Growth Segment
Blenderised Whole Food Formulas: 11.4% CAGR
Fastest Growth Country
India: 11.9% CAGR
Fastest Growth Region
South Asia and Pacific: 9.9% CAGR
Largest Region
North America: 31% of 2025 global value
Market Leaders
Abbott Laboratories, Nestlé Health Science, Danone, Fresenius Kabi and Avanos Medical lead on pediatric enteral nutrition revenue. Source: MMA Primary Research Dataset, July 2026.
Primary Survey
n=3,800 procurement and R&D decision-makers, Q4 2025, six countries
Methodology
Demand-side build-up, cross-validated against public data, 47 expert interviews

Pediatric Tube Feeding Market Forecast Scenarios

pediatric-tube-feeding-market-trends-size-forecast-scenario-1787375344069
Growth ran at 6.5% annually between 2020 and 2025, and the character of it shifted partway through. The early period was steady clinical volume growth as survival rates for complex pediatric conditions continued improving. The later period added something new, as blenderised formulas moved from a practice clinicians tolerated reluctantly into a commercial category with proper products behind it.
The base case at 7.6% rests on three mechanisms. Blenderised whole food adoption keeps rising as tolerance evidence accumulates and dietitians become comfortable recommending commercial versions rather than discouraging home preparation. Home enteral nutrition continues displacing hospital feeding as care models shift and reimbursement follows. And Indian and Southeast Asian demand grows as tertiary pediatric care expands and formulas that were previously unavailable reach children who need them. None of the three depends on a new product.
The bull case at 8.8% turns on broader reimbursement listing for blenderised formulas, which several payers still classify as food rather than medical nutrition. The bear case at 6.4% reflects reimbursement tightening on formula categories generally, since payers reviewing enteral nutrition spending tend to restrict newer products first and defend established polymeric listings longest. Payers restrict newer products first.

Reimbursement Listing Decides Which Formulas Reach Children

A pediatric formula that is not on a reimbursement list is not really on the market. Roughly 71% of formula value is paid by insurers or health systems rather than by families, and a product outside that coverage asks a household to fund a therapy their child needs daily. Clinical performance matters, but listing decides whether performance ever gets tested.
TOP FIVE CONCENTRATION62%High, reflecting clinical qualification and reimbursement listing requirements
HOME FEEDING SHARE58%Portion of volume delivered outside hospital and clinical settings
DAILY FORMULA COST$28Typical daily outlay per child on full tube feeds
BLENDERISED ADOPTION34%Share of home-fed children receiving whole food formulations
REIMBURSEMENT COVERAGE71%Portion of formula value paid by insurers or systems
INGREDIENT COST SHARE43% of COGSIngredient contribution to finished pediatric formula manufactured cost
The customer moved. Around 58% of volume is now delivered at home rather than in hospital, which shifted the buying relationship from a hospital procurement department to a triangle of family, home care supplier and community dietitian. Manufacturers built commercial organisations to sell to hospitals and have had to rebuild them to reach dietitians and home care distributors instead, which several have found genuinely difficult.
Blenderised formulas are the interesting commercial story because the demand came from below. Parents were already blending food and pushing it through tubes, frequently against clinical advice, and reporting tolerance improvements that eventually became too consistent to dismiss. Manufacturers responded with sterile, nutritionally specified whole food products. Roughly 34% of home-fed children now receive them in some form, and several payers still classify them as food.
"This is one of the few clinical nutrition categories where the patients' families led and the manufacturers followed. It took about a decade and quite a lot of institutional resistance, but the parents were right about tolerance."
Director, Clinical Nutrition and Pediatric Care Practice · MMA Clinical Nutrition Practice · August 2026

Market Trends

Blenderised Whole Food Moves From Tolerated Practice To Category

Families were blending food at home and delivering it through feeding tubes long before any manufacturer offered a commercial product, frequently against clinical advice they chose to ignore. Reported tolerance improvements became too consistent to dismiss, with retching, reflux and gagging falling measurably in many children. Manufacturers responded with sterile whole food formulas carrying proper nutritional specification, and roughly 34% of home-fed children now receive them in some form. The segment grows at 11.4% annually, faster than anything else in the market. Institutional resistance delayed the whole category by several years.
Market Impact: Long-term users exceed 60% of volume
Home Care Displaces Hospital As The Commercial Relationship

Around 58% of pediatric enteral volume is now delivered at home rather than in a clinical setting, which changed who a manufacturer actually sells to. Hospital procurement departments gave way to a triangle of family, home care supplier and community dietitian, each with different information needs and none with the purchasing authority a hospital buyer held. Commercial organisations built for hospital selling have had to be rebuilt entirely. Several manufacturers have found that considerably harder than the product development itself. Product development turned out to be the easy part of it.
Market Impact: India grows at 11.9% annually

Market Opportunities and Growth Drivers

Improving Survival In Complex Pediatric Conditions Expands The Population

Children with neurological impairment, congenital heart disease, short bowel syndrome and extreme prematurity survive considerably longer than they did two decades ago, and many of them require tube feeding for years rather than weeks. That produces a growing population of long-term users rather than a series of short clinical episodes. The commercial character of the market changes accordingly, since a child fed for a decade generates volume no acute hospital case approaches. Clinical improvement is what drives the underlying demand. A decade of daily feeding is a very different commercial proposition.
Market Impact: Coverage reaches only 71% of value

Tertiary Pediatric Care Expansion Reaches Previously Underserved Populations

Indian and Southeast Asian tertiary pediatric capacity has expanded considerably, and specialised formulas that were simply unavailable a decade ago now reach children who need them. Indian demand grows near 11.9% annually as neonatal intensive care and pediatric gastroenterology services extend beyond the largest metropolitan hospitals. Out-of-pocket payment remains the norm rather than reimbursement, which shapes product mix toward affordable polymeric formulas. Local manufacturing is developing alongside the clinical capacity rather than trailing behind it. Specialised peptide and elemental formulas remain largely imported and are priced accordingly for the families buying them.
Market Impact: Coverage costs 18% of selling expense

Market Restraints and Challenges

Reimbursement Classification Excludes Products Payers Consider Food

Several payers classify blenderised whole food formulas as food rather than medical nutrition, which removes reimbursement even where clinicians recommend the product. The root cause is that coverage frameworks were written around synthetic formulas and have not been revised as the category changed. Commercially this caps adoption of the fastest growing segment and pushes cost onto families least able to absorb it. Participants are responding with clinical evidence submissions, payer engagement, and formulations positioned explicitly as medical nutrition rather than as food. Families least able to absorb the cost carry it.
Market Impact: Adoption reaches 34% of home feeds

Fragmented Home Care Distribution Complicates Reaching The Actual Decision

Home enteral nutrition reaches families through regional home care suppliers, durable medical equipment distributors and pharmacy channels that vary enormously by country and often by state. The root cause is that these networks grew around equipment rather than nutrition and were never designed for it. Commercially this makes national coverage expensive and inconsistent for any manufacturer. Participants are responding with dietitian-facing clinical teams, direct-to-family support programmes, and selective distributor partnerships rather than attempting comprehensive coverage everywhere. National coverage is expensive to attempt and stays inconsistent even once it is achieved.
Market Impact: Home delivery covers 58% of volume
4 additional market trends, 2 additional growth drivers, and 3 additional restraints and challenges are covered in the full report. Contact sales@marketmindsadvisory.com to access the complete intelligence.

Segment CAGR and Growth Architecture

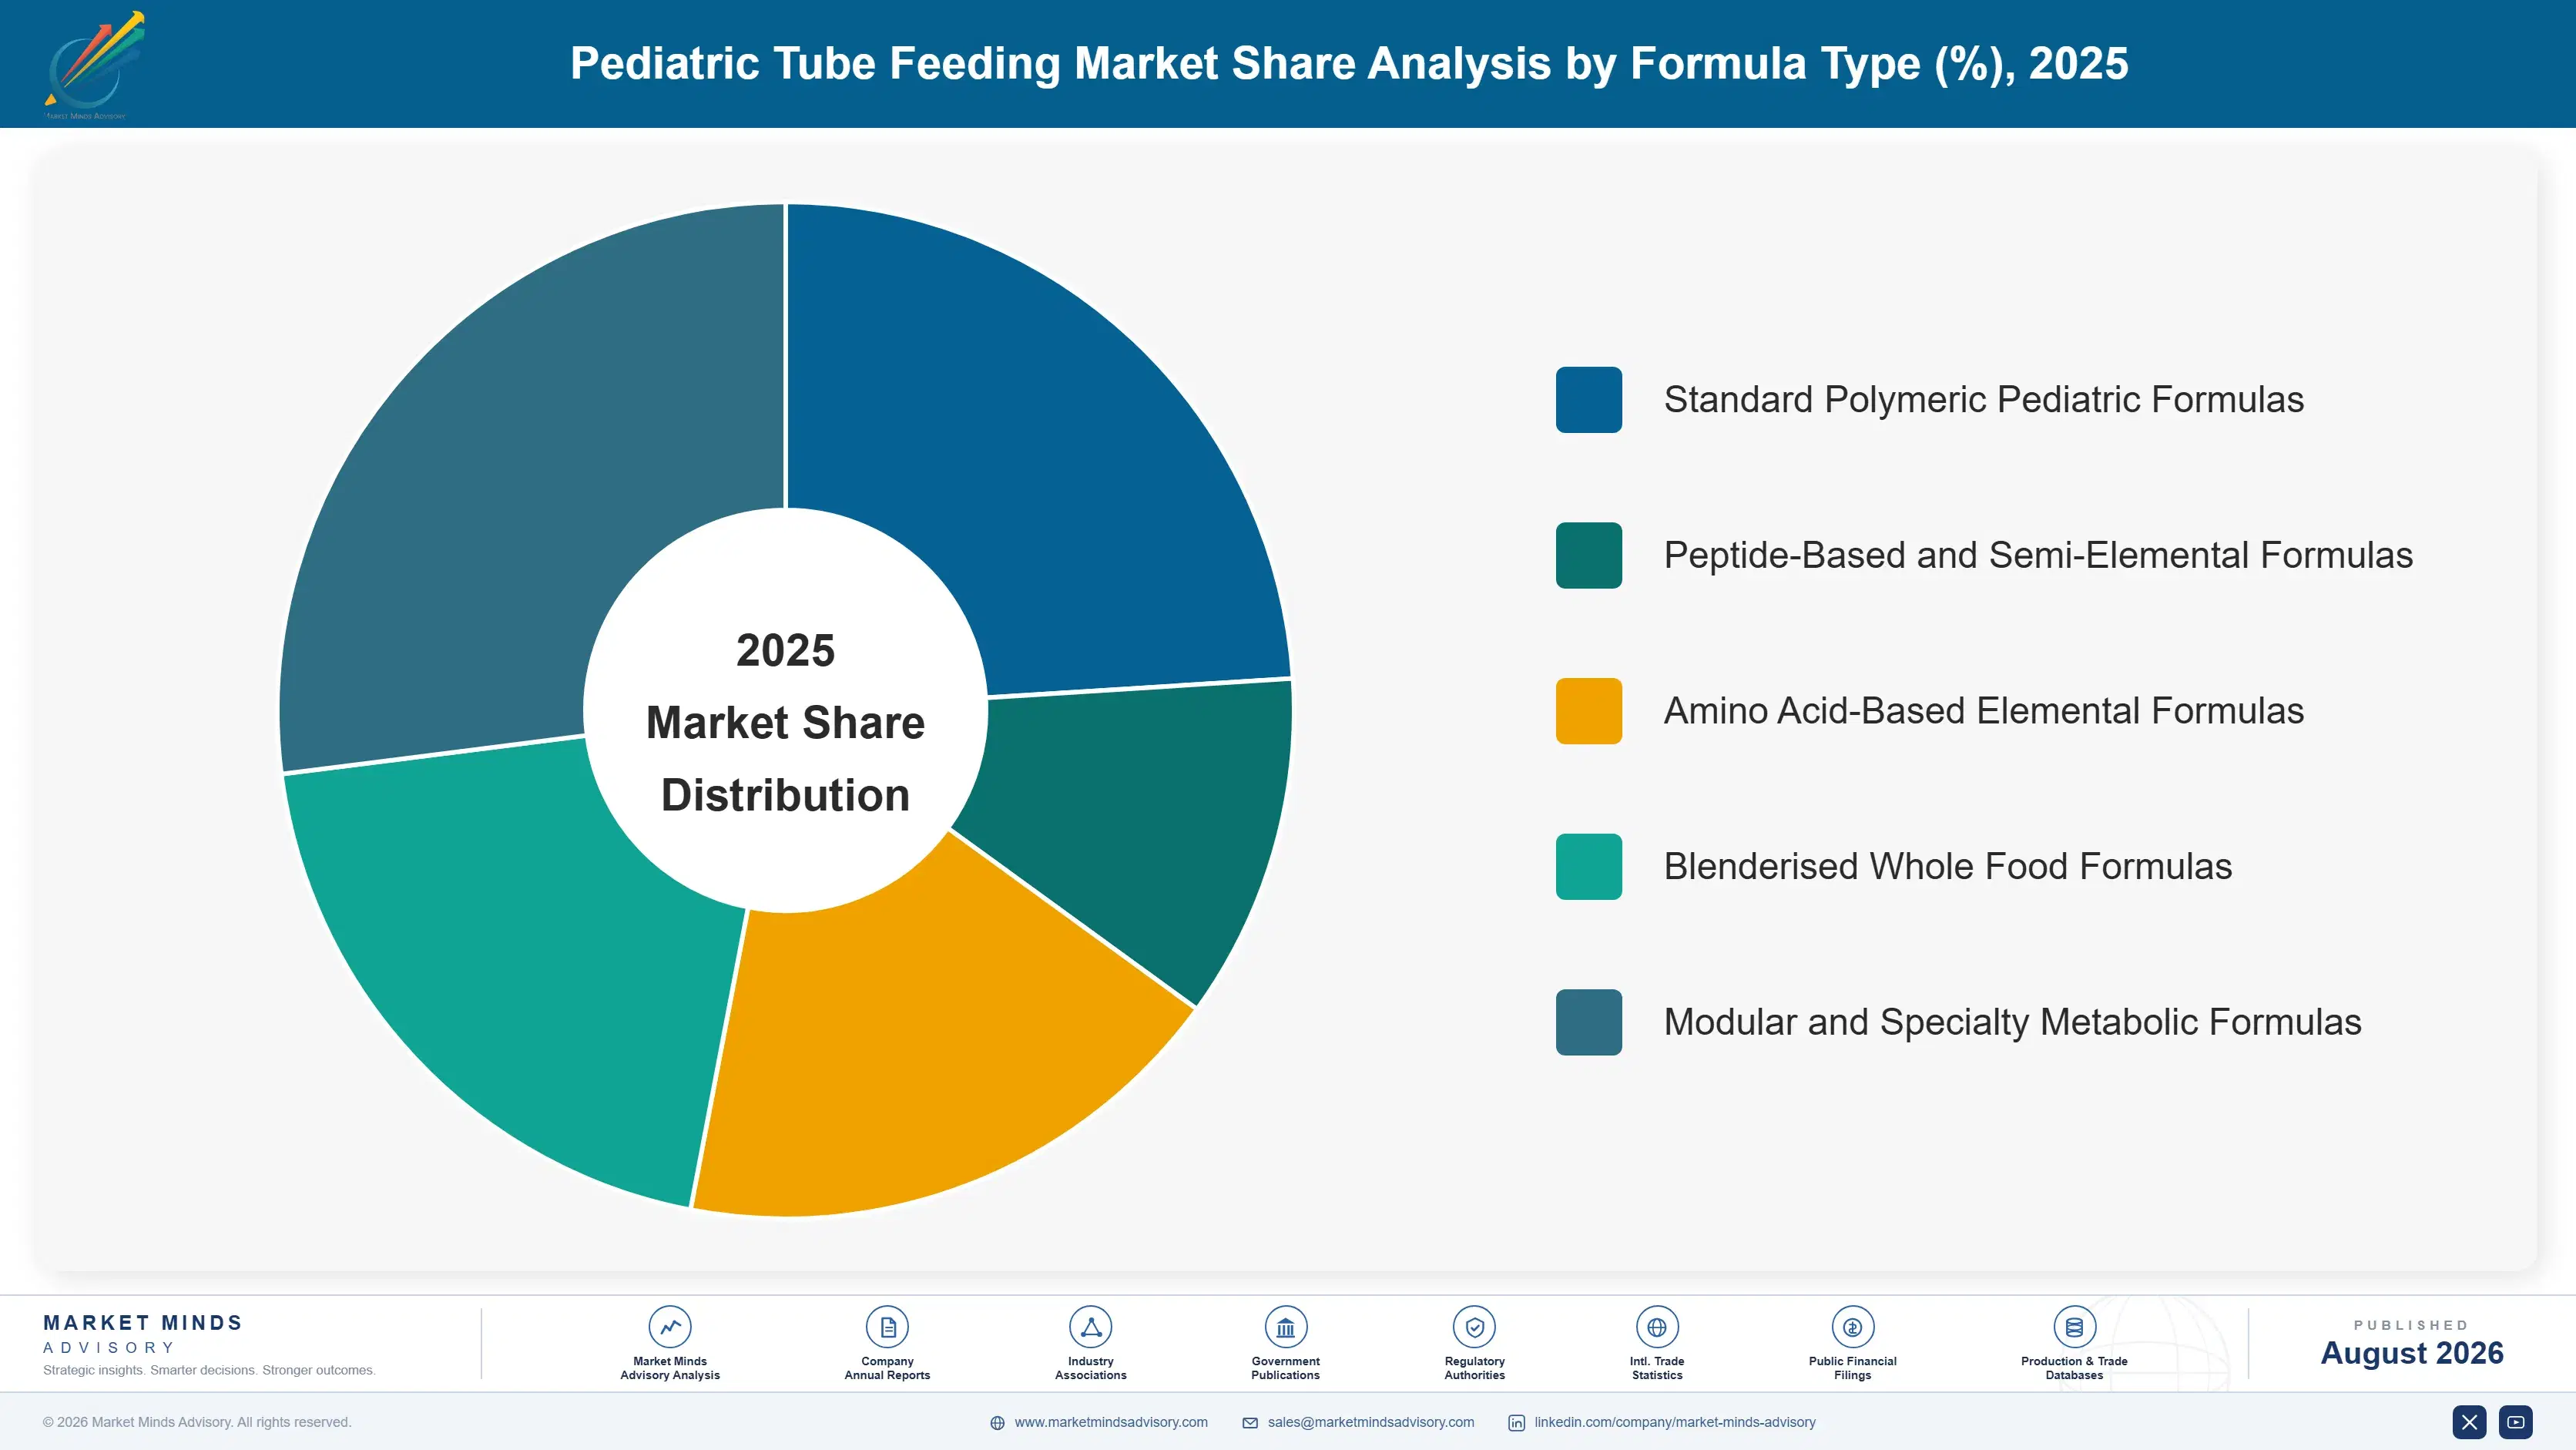
Five formula types divide this market on protein form and food composition rather than on the condition being treated. That choice reflects how prescribing actually works, since a dietitian selects on what a particular child's gut can absorb and tolerate, and the same formula serves several diagnoses while one diagnosis may need several formulas.
pediatric-tube-feeding-market-trends-market-share-analysis-1787375344707

Blenderised Whole Food Formulas

Growing at 11.4% and the fastest part of this market by a clear margin. Blenderised whole food formulas deliver real food through a feeding tube rather than a synthetic formulation, and the demand for them came from parents rather than from clinicians or manufacturers. Families were already blending food at home and pushing it through tubes, which forced the clinical conversation into the open and eventually produced commercial products with proper nutritional specification and sterility. Tolerance improvements are the argument that carries weight with dietitians, since retching, reflux and gagging fall measurably in many children. The constraint is nutritional consistency, because whole food ingredients vary in a way manufactured formula does not.
CAGR 11.4%

Peptide-Based and Semi-Elemental Formulas

Growing at 9.5% on peptide-based and semi-elemental formulas where protein is hydrolysed into short chains that a compromised gut can absorb without doing the digestive work itself. These are prescribed for malabsorption, short bowel syndrome, food protein intolerance and children recovering from intestinal surgery, which makes the clinical indication rather than parental preference the deciding factor. Dietitians specify them, insurers reimburse them on documented indication, and switching requires clinical justification rather than a purchasing decision. Manufacturing is considerably more demanding than standard polymeric formula, since hydrolysis adds process cost and the resulting products taste bad enough to matter for orally fed children. Clinical justification is required to switch away from them.
CAGR 9.5%
Full segment breakdown across 5 segments available in the complete report.

Regional Architecture and Country Demand Map

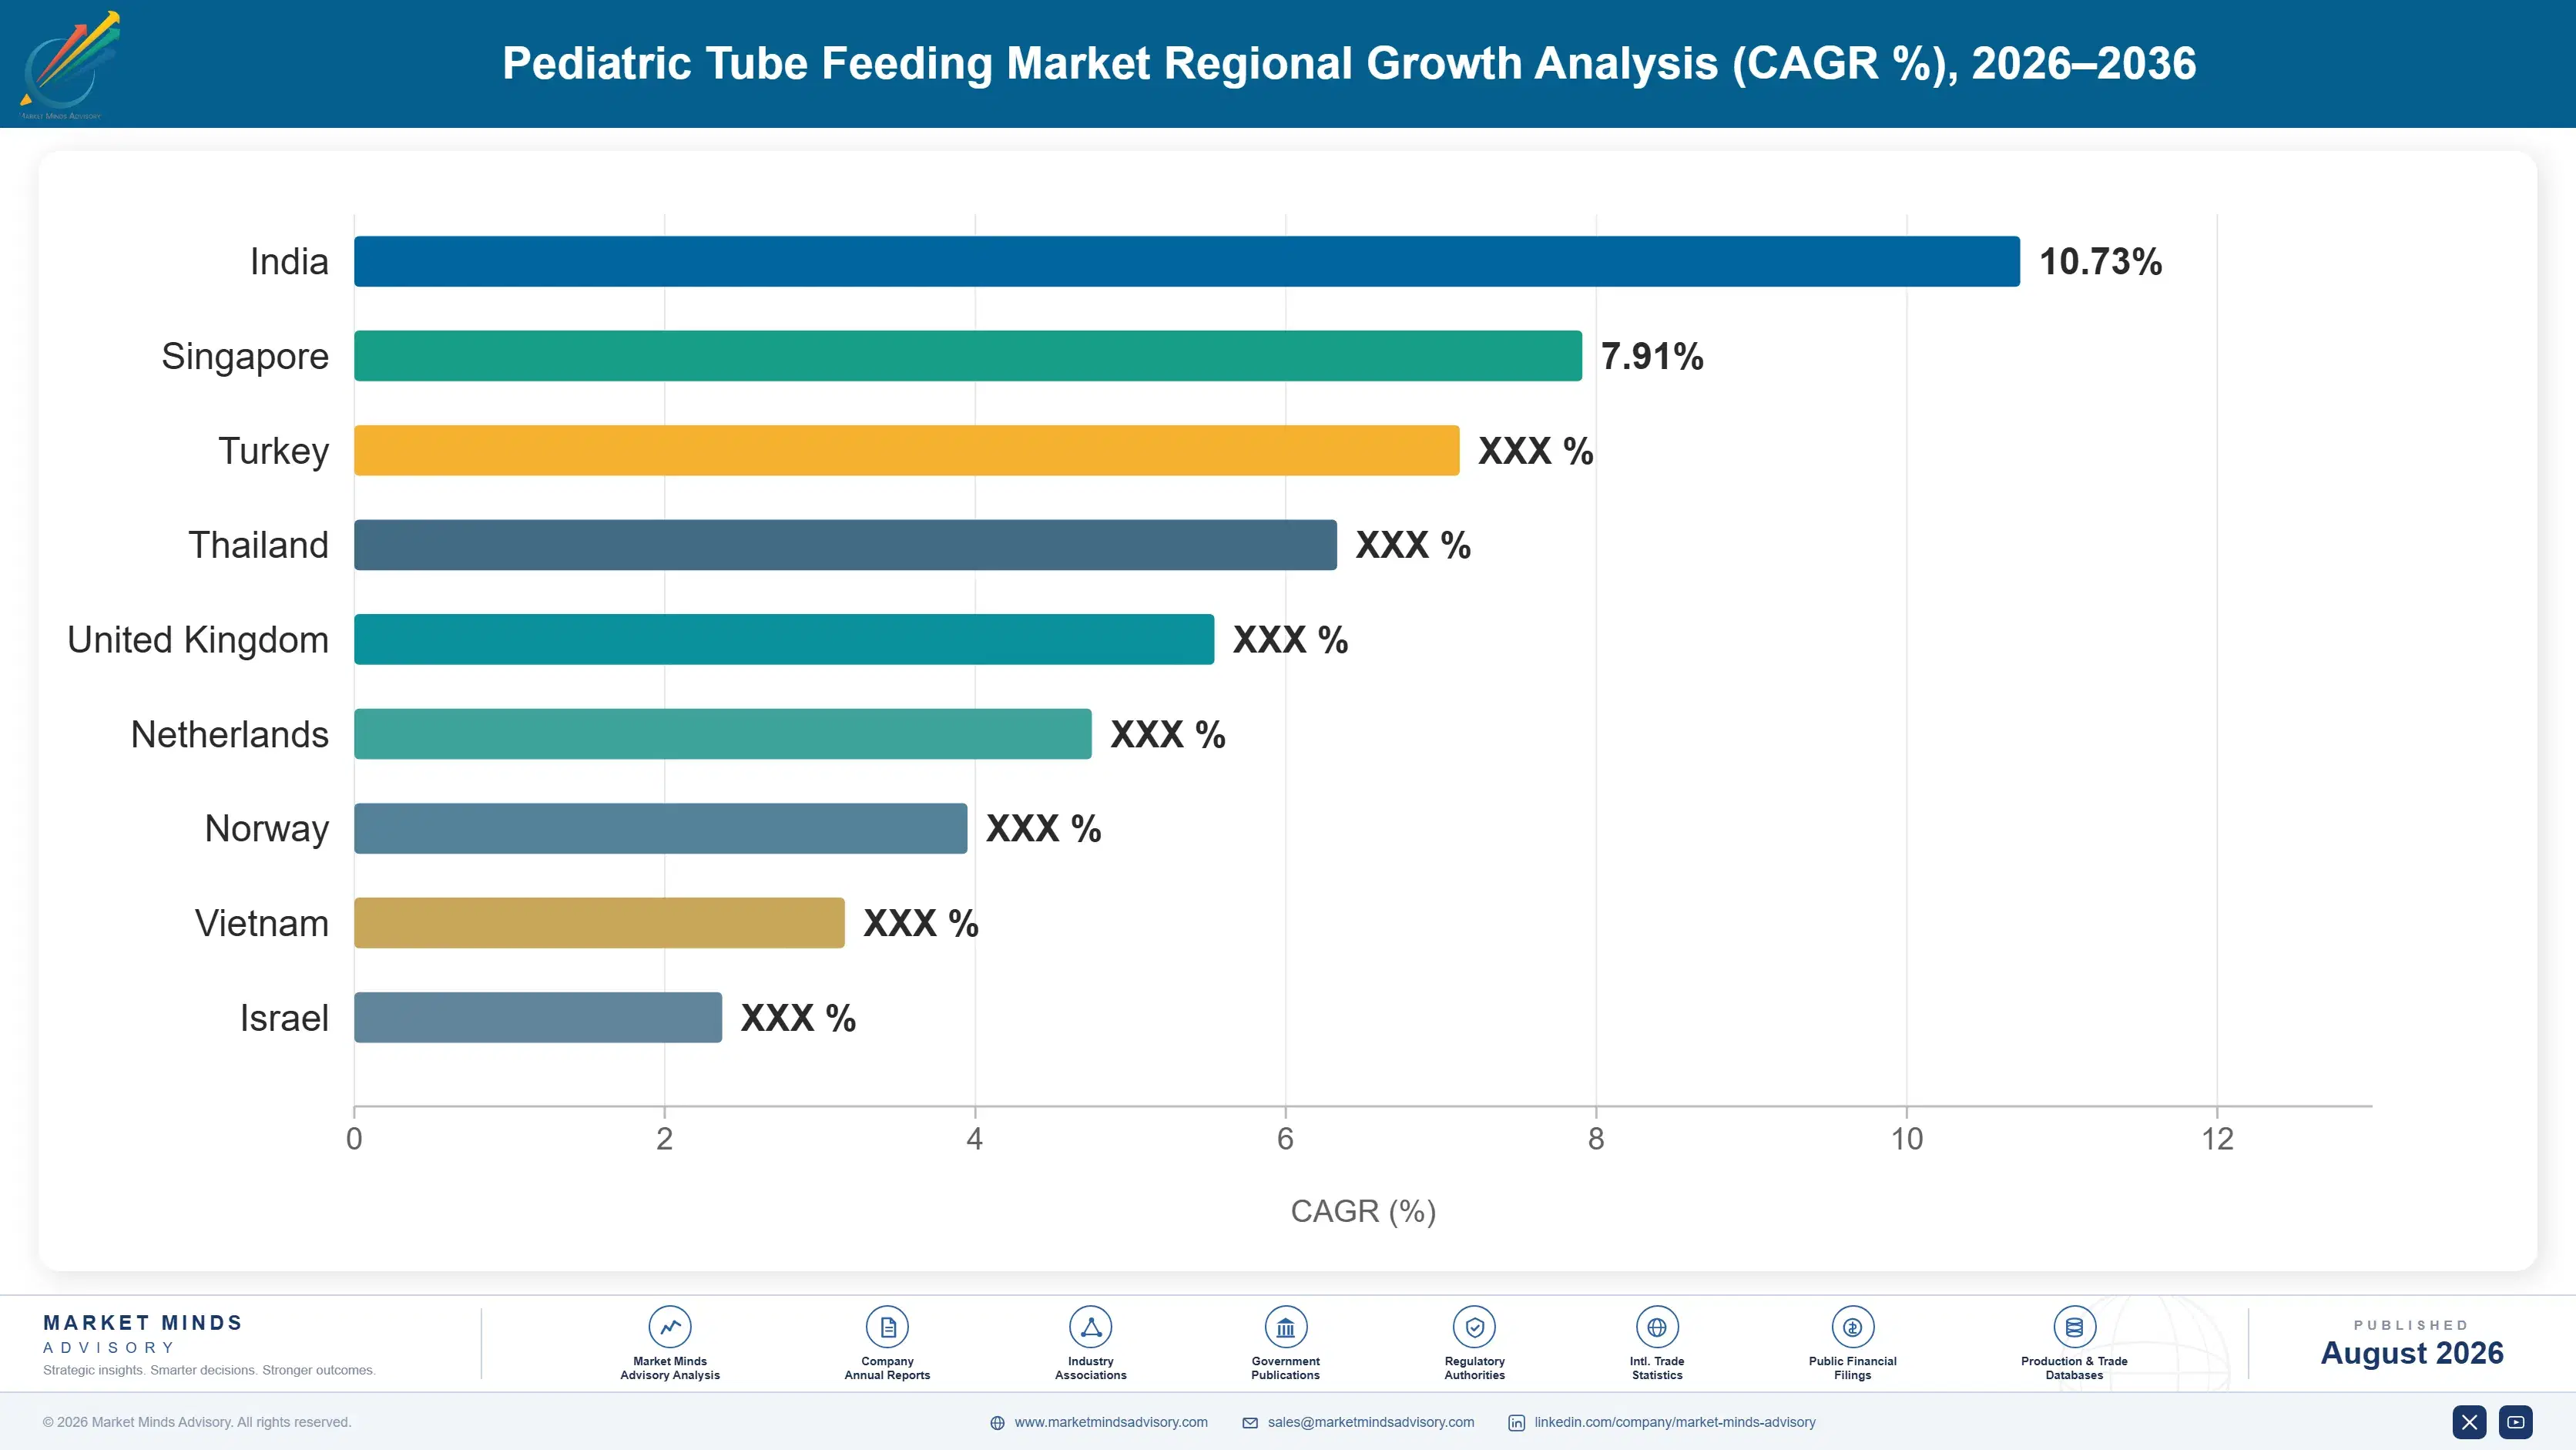
North America holds 31% of global value because home enteral nutrition is reimbursed there rather than paid out of pocket, which turns formula into a funded therapy. East Asia follows at 24% on hospital volume, while South Asia and Pacific grows fastest as tertiary pediatric care expands.

North America

Reimbursement is what puts this region ahead rather than patient numbers, which are considerably smaller than Asian populations. Home enteral nutrition is covered by Medicaid, commercial insurance and state programmes, which converts formula from a household expense into a funded therapy and supports pricing no out-of-pocket market sustains. Blenderised adoption is also furthest advanced here, driven by parent advocacy that eventually shifted clinical practice. Home care distribution is fragmented across regional suppliers and varies by state, which makes national coverage expensive. Canadian provincial coverage differs by province, producing a similar patchwork on a smaller scale across the country. Parent advocacy is what eventually shifted clinical practice here rather than manufacturer promotion.
Share: 31% | CAGR: 7.0% (2026 to 2036)

East Asia

Hospital-delivered feeding accounts for a much larger share of volume here than in North America, which shapes both product mix and the commercial relationship considerably. Chinese tertiary pediatric capacity has expanded quickly and neonatal intensive care survival has improved alongside it, producing a growing long-term feeding population that barely existed twenty years ago. Domestic manufacturers supply most standard polymeric volume while specialised peptide and elemental formulas remain largely imported. Japanese and Korean practice is closer to Western European models with established home feeding programmes. Reimbursement frameworks differ sharply across the three markets and determine which formulas are genuinely accessible. Long-term feeding populations in this region barely existed a generation ago.
Share: 24% | CAGR: 8.7% (2026 to 2036)
Regional intelligence for 5 additional markets available in the complete report: Western Europe, South Asia and Pacific, Latin America, Middle East and Africa, Eastern Europe. Contact sales@marketmindsadvisory.com.
pediatric-tube-feeding-market-trends-country-cagr-analysis-1787375345313

Where Pediatric Formula Margin Is Won

Four positions separate manufacturers building durable pediatric businesses from those defending hospital tenders on cost per calorie: securing reimbursement listing, building dietitian-facing clinical teams, funding tolerance evidence for blenderised products, and supporting families directly rather than relying on fragmented home care distribution. Only the first of those is genuinely non-negotiable, and it has to come first.

Secure Reimbursement Listing Before Clinical Promotion Begins

Roughly 71% of formula value is paid by insurers or health systems, and a product outside that coverage asks a family to fund a daily therapy their child cannot go without. Listed products realise 40% to 48% higher volume per prescribing dietitian than unlisted equivalents, because the recommendation converts rather than stalling on affordability. Clinical promotion ahead of listing wastes the promotional spend entirely and frequently damages the relationship with dietitians who then cannot prescribe. Dietitians who were asked to recommend a product they could not prescribe tend to remember it.
Market Impact: Lifts volume per prescribing dietitian by up to 48%

Build Dietitian-Facing Clinical Teams Rather Than Hospital Sales

Around 58% of volume now moves through home feeding, where a community dietitian rather than a hospital buyer selects the formula and a home care supplier fulfils it. Commercial organisations built for hospital tender selling reach none of those people. Manufacturers rebuilding around dietitian education and clinical support see prescribing share rise 25% to 32% in covered territories. The rebuild is expensive and slow, and it is the single clearest predictor of who grows in home feeding. There is no point selling to a hospital buyer who no longer makes the decision.
Market Impact: Raises prescribing share by as much as 32%

Fund Tolerance Evidence For Blenderised Whole Food Products

Parents drove blenderised adoption on reported tolerance improvements, and dietitians moved once the reports became too consistent to dismiss. Payers have not moved, with several still classifying these formulas as food rather than medical nutrition. Controlled tolerance evidence is what converts a payer, and the segment growing at 11.4% annually is worth the study cost several times over. Manufacturers funding that work now will hold listings competitors spend years trying to obtain afterwards. Payers move on controlled evidence rather than on accumulated parental testimony, however consistent that testimony eventually becomes.
Market Impact: Supports the segment growing at 11.4% each year

Support Families Directly Around Fragmented Home Care Distribution

Home enteral distribution runs through regional suppliers and equipment distributors that vary by country and often by state, and comprehensive coverage costs roughly 18% of selling expense to attempt. Direct family support programmes covering training, troubleshooting and reorder reminders reach the household regardless of which distributor serves it. Manufacturers running them report retention 20% to 28% above products relying on distribution alone, because the family stops switching when somebody answers the phone. Distributors change and households do not, so the relationship follows whichever manufacturer actually stayed in contact with them.
Market Impact: Improves family retention by as much as 28%

Who Controls the Margin Pool

Concentration reads at 62% for the top five measured on pediatric enteral nutrition revenue, the basis used throughout this section, and it reflects reimbursement listing more than manufacturing scale. Abbott, Nestlé Health Science and Danone hold the established formula positions across most markets. Fresenius Kabi brings clinical nutrition breadth. Avanos supplies the delivery consumables that every one of those formulas passes through.
Competition runs on three fronts. Reimbursement listing is the first and by some distance the most decisive, since an unlisted product is not commercially available whatever its clinical merit. Dietitian relationships are the second, and they replaced hospital procurement as the practical decision point. Blenderised capability is the third and the only genuinely open contest in the market. Nothing on that list is a tender argument.

Pressure arrives from two directions. Specialist blenderised manufacturers built real positions while the established companies hesitated over a category their clinical teams had spent years discouraging. Separately, regional manufacturers in Asia and Latin America are supplying standard polymeric volume at prices imported product cannot reach. Rankings will shift toward participants holding blenderised listings and dietitian coverage together. Hesitation over blenderised proved expensive for the incumbents.
pediatric-tube-feeding-market-trends-company-positioning-matrix-1787375345862

Competitive Moat and Risk Dimensions

ABBOTT LABORATORIES

Moat: Reimbursement listing breadth

Listings across payers and health systems in most major markets give the group commercial availability that a clinically superior but unlisted product simply does not have, and those listings took years of evidence submission to obtain. Clinical trial capability and pediatric specialist relationships built over decades also support the prescribing recommendations that actually move volume in home feeding.
ABBOTT LABORATORIES

Risk: Late to blenderised category

Clinical and commercial teams spent years discouraging home blending before the tolerance evidence became undeniable, which let specialist manufacturers build genuine positions in the fastest growing segment. Institutional caution around a category the organisation previously opposed is also difficult to reverse quickly, particularly where the same dietitians heard the earlier argument.
NESTLÉ HEALTH SCIENCE

Moat: Clinical nutrition portfolio depth

Breadth across peptide, elemental, polymeric and metabolic formulas lets the group serve a child through changing clinical needs without the family or dietitian moving to another manufacturer, which matters enormously in a category where feeding continues for years. Research capability also supports the evidence submissions that reimbursement listing decisions genuinely depend on.
NESTLÉ HEALTH SCIENCE

Risk: Hospital-weighted commercial structure

Commercial organisation built around hospital and institutional selling reaches community dietitians and home care suppliers less effectively than the home feeding shift now requires, and rebuilding that structure is slow and expensive. Regional manufacturers are also taking standard polymeric volume in emerging markets at prices the group cannot profitably match.

Players Tracked

Prominent Players

Abbott Laboratories
Nestlé Health Science
Danone
Fresenius Kabi
Avanos Medical

Other Key Players

Perrigo Company
Reckitt Benckiser
Cardinal Health
B. Braun Melsungen
Moog Inc
Applied Medical Technology
Cook Medical
Functional Formularies
Real Food Blends
Kate Farms
Victus Inc
Medela
ConvaTec
Amsino International
Vygon

Recent Developments

FEBRUARY 2025

Payer grants medical nutrition classification to blenderised formula

A national payer reclassified a commercial blenderised whole food formula from food to medical nutrition following a controlled tolerance evidence submission, extending reimbursement to a product category that families had previously been funding entirely from their own resources. Two further payers opened their own reviews afterwards.
Signal: Payer classification rather than clinical acceptance is the remaining barrier holding blenderised adoption back in most markets
JUNE 2025

Manufacturer restructures commercial team toward community dietitians

A clinical nutrition manufacturer restructured its pediatric commercial organisation away from hospital tender selling and toward community dietitian education and home care support, acknowledging that most volume now moves through households rather than through institutional procurement. Hospital field coverage was reduced in order to fund the change.
Signal: Commercial structures built for hospital selling reach almost none of the people who now choose formulas
OCTOBER 2025

Specialist blenderised producer expands sterile manufacturing capacity

A specialist whole food formula producer expanded sterile manufacturing capacity to meet demand that had outrun supply, having built the position while established clinical nutrition companies were still advising families against home blending entirely. Demand had been exceeding available supply across several consecutive quarters before the expansion.
Signal: Specialists captured the fastest growing segment while incumbents defended a clinical position they subsequently abandoned entirely

What Drives Pediatric Formula Cost

Ingredients account for roughly 43% of manufactured cost, with hydrolysed whey and casein protein, free amino acids and medium chain triglyceride oils the principal lines and each priced well above ordinary food ingredients. Sterile processing and packaging contribute around 21%, which is high because ready-to-hang presentation and shelf stability are both clinical requirements. Quality, testing and regulatory documentation add about 11%, and distribution roughly 13%.
Dairy protein pricing rose sharply through 2022 and 2023 on herd contraction and feed cost inflation across Europe and North America, with United States Department of Agriculture dairy data showing farmgate movement well outside historical range, which fed directly into hydrolysed whey and casein costs. Free amino acid pricing followed fermentation feedstock and energy markets separately, compounding pressure across two consecutive years of formula manufacture.

The disadvantage mechanism is that reimbursed pricing does not move when input costs do, and it falls hardest on manufacturers weighted toward listed products. A payer price is set on a schedule and revised on a payer's timetable rather than a manufacturer's, so input inflation is absorbed rather than passed through. Exposure varies by portfolio, since elemental and peptide formulas carry considerably higher ingredient cost than polymeric products do.
pediatric-tube-feeding-market-trends-cost-volatility-analysis-1787375346072

Contract dairy protein fractions on multi-year committed terms

Hydrolysed whey and casein represent the largest ingredient exposure in most pediatric portfolios and price on dairy markets that pay no attention to clinical nutrition demand. Multi-year committed volume smooths the swing and secures allocation during the tightness that follows every herd contraction. The commitment carries volume risk, which is the honest cost of predictability against pricing that cannot move.

Negotiate indexation into payer pricing schedules where possible

Reimbursed prices are revised on a payer timetable rather than a manufacturer one, which leaves input inflation absorbed between reviews. Building an input index into the pricing schedule at negotiation converts that from a margin risk into a mechanic. Payers resist it and most schedules carry no such provision, so the argument must be made when a listing is granted.

Weight the portfolio toward products with headroom above cost

Elemental and peptide formulas carry considerably higher ingredient cost than polymeric products, and where reimbursed pricing has not tracked that gap the margin is thin regardless. Portfolio weighting toward products with genuine headroom protects the business without abandoning any clinical need. The limit is that prescribing follows the child's condition, so mix can be influenced but never chosen.

Portfolio Architecture for Margin Defence

Portfolio economics here divide on reimbursement status rather than on clinical sophistication. Unlisted product asks a family to fund a daily therapy out of pocket, and however good the formula is that conversation ends most prescriptions before they start, which makes the position close to commercially inert whatever the clinical data shows. Clinical data does not pay for a daily therapy.
The middle tier is listed polymeric formula in hospital and home supply. Coverage makes the product genuinely available and prescribing follows clinical need rather than affordability, though tender pricing in hospital channels and payer schedules both cap what can be realised. Margins reach the high twenties and hold steady, with volume predictable across years rather than quarters. Displacement is uncommon once a child is settled.

Above both sits listed specialty formula, whether peptide, elemental or blenderised, supported by clinical evidence and dietitian relationships. Prescribing rests on documented indication, switching requires clinical justification, and margins reach the low forties. The position requires evidence generation and a dietitian-facing organisation that hospital-built commercial teams do not have, which is why so few manufacturers hold it properly. Evidence generation is the entry cost here.

Volume / Commodity-Adjacent

Unlisted product funded out of pocket by families. The range reflects ingredient cost rather than any commercial decision, and prescribing converts poorly because affordability ends the conversation before clinical merit is discussed.
Gross Margin: 12 to 19%

Premium / Certified

Listed polymeric formula across hospital and home supply. The range reflects tender pricing in institutional channels against payer schedules in home feeding, which differ considerably by market and by payer.
Gross Margin: 25 to 33%

Sustainability / Regulatory / Next-Generation

Listed specialty formula supported by clinical evidence and dietitian relationships. The wide range reflects whether blenderised products carry medical nutrition classification or remain treated as food by the payer. Few manufacturers hold it.
Gross Margin: 37 to 46%
pediatric-tube-feeding-market-trends-portfolio-architecture-1787375346582

High-value Sub-segments and Strategic Watch-out

Listed Blenderised Whole Food Formulas

High value and high growth together, and the only genuinely open contest here. The wide range reflects whether a payer classifies the product as medical nutrition or as food, which changes the economics entirely between markets. Specialists reached it first while the incumbents were still hesitating.
Gross Margin: 37 to 46%

Peptide And Elemental Specialty Formulas

High value on steady growth with prescribing resting on documented clinical indication. The range reflects ingredient cost against payer schedules, since hydrolysis and free amino acids both carry considerable manufacturing expense above polymeric equivalents. Switching here requires a clinical justification rather than any purchasing decision.
Gross Margin: 34 to 43%

Listed Polymeric Home Feeding Volume

The volume core of this market and where long-term feeding populations sit. The range reflects payer schedule pricing and whether the manufacturer holds a dietitian-facing organisation reaching the community prescribers who actually decide. A child fed for a decade generates volume that no acute case approaches.
Gross Margin: 25 to 33%

Unlisted And Out-Of-Pocket Supply

The strategic watch-out. Clinical merit counts for little when a family funds a daily therapy themselves, conversion is poor, and promotional spending ahead of listing is generally wasted entirely. The range reflects ingredient cost alone. Promotion ahead of listing is generally just money thrown away.
Gross Margin: 12 to 19%

How Pediatric Feeding Demand Repeats

This is among the most durable repeat businesses in clinical nutrition and the reason is medical rather than commercial. A child with neurological impairment, short bowel syndrome or congenital heart disease may be tube fed for a decade, which turns each prescription into years of daily volume rather than a course of treatment. Long-term users account for more than 60% of volume across most developed markets.
Stickiness varies sharply by formula type. Elemental and peptide formulas hold best, since switching requires clinical justification and a child tolerating a specific product is not experimented with casually. Blenderised formulas hold well once a family has settled on them, because the tolerance improvement was the reason for changing in the first place. Standard polymeric volume in hospital tender channels holds worst, moving on price at each renewal.

The decision maker has changed completely. Hospital dietitians and procurement departments once selected formulas within institutional formularies, and the manufacturer sold to an institution. Community dietitians now make most prescribing decisions for home-fed children, with families holding genuine influence and considerable information of their own, which rewards manufacturers who support both and disadvantages those still selling to hospitals alone.
pediatric-tube-feeding-market-trends-end-use-penetration-index-1787375347070

Where To Compete And Why

These are among the four positions where our research anticipates prominent divergence between winners and laggards over the coming forecast period. Each is grounded in the demand model, the regulatory perimeter, and the announced capacity pipeline.
01 / REIMBURSEMENT LISTING SEQUENCING

Unlisted product is not available

Roughly 71% of formula value is paid by insurers or health systems, so a product outside coverage asks a family to fund a daily therapy their child cannot go without and most prescriptions end there. Listed products realise 40% to 48% higher volume per prescribing dietitian, because the recommendation converts instead of stalling on affordability. Clinical promotion ahead of listing wastes the spend and damages relationships with dietitians who then cannot actually prescribe what has just been recommended to them at all.
02 / DIETITIAN ORGANISATION REBUILDING

Hospital selling reaches nobody now

Around 58% of volume moves through home feeding where a community dietitian selects the formula and a home care supplier fulfils it, which means commercial organisations built for hospital tenders reach almost none of the people deciding. Manufacturers rebuilding around dietitian education and clinical support see prescribing share rise 25% to 32% in covered territories. The rebuild is slow and expensive, and it predicts who grows in home feeding better than any product attribute does, which is not a comfortable finding for a research team.
03 / BLENDERISED EVIDENCE FUNDING

Parents convinced clinicians, not payers

Families drove blenderised adoption on reported tolerance improvements and dietitians moved once those reports became too consistent to keep dismissing, but payers have not followed and several still classify the formulas as food. Controlled tolerance evidence is what converts a payer, and a segment growing at 11.4% annually justifies the study cost several times over. Manufacturers funding it now will hold listings that competitors spend years trying to obtain afterwards, by which point the segment has largely settled around whoever moved first.
04 / DIRECT FAMILY SUPPORT

Somebody has to answer the phone

Home enteral distribution runs through regional suppliers and equipment distributors varying by country and often by state, and attempting comprehensive coverage costs roughly 18% of selling expense without ever reaching every household. Direct family support covering training, troubleshooting and reorder reminders reaches the home regardless of which distributor happens to serve it that month. Manufacturers running those programmes report retention 20% to 28% above products relying on distribution alone, because a family stops looking elsewhere once somebody actually answers the phone.

Engagement Snapshot From the Field

A live engagement with an industry participant carrying material or product regulatory and market exposure ahead of a defining policy shift, showing how our research translates into a defensible multi-year portfolio strategy.
MARKET MINDS ADVISORY · CLIENT ENGAGEMENT SUMMARY
Pediatric Tube Feeding Producer Strategic Portfolio Review and Transition Roadmap 2026·Investment Scenario on Pediatric Tube Feeding Exposure Evaluation 2025-26
CLIENT PROFILE
A European specialty clinical nutrition manufacturer with annual revenue near $186 million (client-reported, unverified by MMA), roughly 64% of it from pediatric peptide and elemental formulas supplied into hospital channels across six countries. The business held strong clinical evidence and good hospital relationships, but almost no presence in home feeding and no blenderised product at all.
STRATEGIC CHALLENGE
Hospital volume was flat while home feeding grew, and the client's commercial organisation had no route to community dietitians who were making most prescribing decisions. Management needed to decide between defending hospital tenders, rebuilding the commercial team around home care, or acquiring blenderised capability in a segment it had previously advised families against.
MMA APPROACH
MMA modelled prescribing volume and contribution by channel across four years of the client's own data, benchmarked commercial coverage against competitors reaching community dietitians, and assessed blenderised entry through build, partner and acquire routes. Twenty-five expert interviews with community dietitians, home care suppliers and parents of tube-fed children tested how formula decisions are genuinely made.
KEY FINDINGS
  1. Community dietitians in three of the six countries could not name the client as a supplier at all, despite the client holding strong hospital positions and clinical evidence in exactly those markets.
  2. Home-fed children generated roughly four times the lifetime volume of hospital episodes, and the client was capturing a small fraction of that population in every territory examined.
  3. Parents interviewed described switching formulas on tolerance rather than on clinical advice alone, and several had moved to blenderised products without telling their dietitian beforehand.
  4. Blenderised entry was assessed as feasible through partnership within eighteen months, while building sterile whole food capability internally would have taken considerably longer than the segment allowed.
CLIENT PROFILE
A European specialty clinical nutrition manufacturer with annual revenue near $186 million (client-reported, unverified by MMA), roughly 64% of it from pediatric peptide and elemental formulas supplied into hospital channels across six countries. The business held strong clinical evidence and good hospital relationships, but almost no presence in home feeding and no blenderised product at all.
STRATEGIC CHALLENGE
Hospital volume was flat while home feeding grew, and the client's commercial organisation had no route to community dietitians who were making most prescribing decisions. Management needed to decide between defending hospital tenders, rebuilding the commercial team around home care, or acquiring blenderised capability in a segment it had previously advised families against.
MMA APPROACH
MMA modelled prescribing volume and contribution by channel across four years of the client's own data, benchmarked commercial coverage against competitors reaching community dietitians, and assessed blenderised entry through build, partner and acquire routes. Twenty-five expert interviews with community dietitians, home care suppliers and parents of tube-fed children tested how formula decisions are genuinely made.
KEY FINDINGS
  1. Community dietitians in three of the six countries could not name the client as a supplier at all, despite the client holding strong hospital positions and clinical evidence in exactly those markets.
  2. Home-fed children generated roughly four times the lifetime volume of hospital episodes, and the client was capturing a small fraction of that population in every territory examined.
  3. Parents interviewed described switching formulas on tolerance rather than on clinical advice alone, and several had moved to blenderised products without telling their dietitian beforehand.
  4. Blenderised entry was assessed as feasible through partnership within eighteen months, while building sterile whole food capability internally would have taken considerably longer than the segment allowed.
RECOMMENDED STRATEGY
Phase 1: Phase one: build a community dietitian-facing clinical team in the three countries where recognition is absent, since the products and evidence already exist and only the coverage is missing. Phase 2: Phase two: launch direct family support covering training and reorder assistance, reaching households regardless of which home care distributor happens to serve them. Phase 3: Phase three: enter blenderised through partnership rather than internal build, accepting shared economics as the price of reaching the segment while it still grows.
OUTCOME
The client lifted home feeding from 14% to 33% of pediatric volume within sixteen months and established dietitian coverage across all six countries (client-reported, unverified by MMA). A blenderised partnership was signed in late 2025, retention on supported families ran roughly 24% above unsupported accounts, and blended gross margin improved by about six points.

Frequently Asked Questions

Foundational context covering the market sizes, CAGR, scope, country, region and competition that inform every finding below. This section is provided to cover basics and most often pre-purchase conversations, answered from the MMA Primary Research Dataset.

What is the current size of the Pediatric Tube Feeding Market?

The global pediatric tube feeding market was valued at $2.80 billion in 2025, reaching an estimated $3.01 billion in 2026. That covers enteral formulas and delivery consumables for children fed by tube.

How large will the Pediatric Tube Feeding Market be by 2036?

MMA forecasts the market reaching $6.26 billion by 2036, an increase of $3.25 billion over the 2026 base. That represents an expansion multiple of 2.08 times across the forecast period.

What is the CAGR for the Pediatric Tube Feeding Market 2026 to 2036?

The base case compound annual growth rate is 7.6%, with a bull case of 8.8% and a bear case of 6.4%. Historical growth between 2020 and 2025 ran at 6.5% annually.

Which segment is growing fastest?

Blenderised whole food formulas grow at 11.4%, a full 1.50 times the market rate, on tolerance improvements that parents identified before clinicians did. Peptide-based formulas follow at 9.5% annually.

Who are the major companies in the Pediatric Tube Feeding Market?

Abbott Laboratories, Nestlé Health Science, Danone, Fresenius Kabi and Avanos Medical lead on pediatric enteral nutrition revenue. Together they account for roughly 62% of global value.

Which country is growing fastest?

India grows fastest at 11.9% annually, driven by tertiary pediatric care expanding well beyond the largest metropolitan hospitals. Indonesia and Vietnam follow on similar clinical capacity growth.

Report Segmentation Architecture

The full report scope spans multiple orthogonal segmentation dimensions, with cross-tabulated demand data provided for each dimension pair. Coverage extends further to regional breakdowns, trend trajectories, and the competitive detail needed to support segment-level decision-making.

By Formula Type

  • Standard Polymeric Pediatric Formulas
  • Peptide-Based and Semi-Elemental Formulas
  • Amino Acid-Based Elemental Formulas
  • Blenderised Whole Food Formulas
  • Modular and Specialty Metabolic Formulas

By End-Use Industry

  • Neurological Impairment and Cerebral Palsy
  • Prematurity and Neonatal Intensive Care
  • Short Bowel Syndrome and Intestinal Failure
  • Congenital Heart Disease
  • Oncology and Treatment Support
  • Metabolic and Genetic Disorders

By Commercial Dimension

  • Hospital and Institutional Supply
  • Home Care Distributor Channel
  • Retail and Specialty Pharmacy
  • Direct-to-Family Supply Programmes
  • Public Tender and Health System Procurement

By Region

  • North America
  • Western Europe
  • East Asia
  • South Asia and Pacific
  • Latin America
  • Middle East and Africa
  • Eastern Europe

Scope, Methodology, and Coverage

Every figure in this report is reproducible from documented input assumptions. The scope below maps the historical period, the forecast horizon, the segmentation dimensions, and the countries covered, alongside the underlying primary and qualitative methodology.
Historical Period
2020 to 2025
Forecast Period
2026 to 2036
Base Year
2025 (USD billions; MMA Primary Research Dataset, August 2026)
Market Definition
This report covers enteral nutrition formulas and delivery consumables for children fed by tube, spanning standard polymeric formulas, peptide-based and semi-elemental formulas, amino acid-based elemental formulas, blenderised whole food formulas, and modular and specialty metabolic products, together with pediatric feeding sets, syringes and pumps, across hospital, home care, pharmacy and direct channels. Adult enteral nutrition, parenteral and intravenous nutrition, infant formula intended for oral feeding, oral nutritional supplements, and surgical tube placement procedures are excluded from the sizing.
Quantitative Units
USD billions at manufacturer realised value; volume in million feeding days; daily formula cost in USD per child.
Segmentation Dimensions
By formula type; by end-use industry; by commercial dimension; by region.
Regions Covered
North America, Western Europe, East Asia, South Asia and Pacific, Latin America, Middle East and Africa, Eastern Europe
Countries Covered
United States, Canada, Mexico, Brazil, Argentina, United Kingdom, Germany, France, Netherlands, Italy, Spain, Poland, Turkey, Saudi Arabia, China, Japan, South Korea, India, Australia, South Africa.
Key Companies Profiled
Abbott Laboratories, Nestlé Health Science, Danone, Fresenius Kabi, Avanos Medical, Perrigo Company, Reckitt Benckiser, Cardinal Health, B. Braun Melsungen, Moog Inc, Applied Medical Technology, Functional Formularies, Kate Farms, Medela and others.
Quantitative Methodology
Primary survey, n=3,800 respondents, Q4 2025, six countries; demand-side model with trade association cross-validation
Qualitative Methodology
47 expert interviews, Q4 2025; applied to validate demand model assumptions, identify emerging dynamics, and assess competitive positioning
Report Format
PDF and XLSX data workbook (Word format preview document)
Publisher
Market Minds Advisory
Report Code
MMA-2026-HLT-124
Published
August 2026
Contact
sales@marketmindsadvisory.com | www.marketmindsadvisory.com

Purchase the full Pediatric Tube Feeding Market Report (2026 to 2036).

The full report sizes the pediatric tube feeding market across five formula types, six clinical indications and seven regions, with feeding day volume and daily cost detail behind every value estimate. It profiles twenty companies on reimbursement listing breadth, dietitian coverage and blenderised capability. Regional chapters cover reimbursement frameworks, home feeding programme structure and distribution by market. Cost analysis quantifies protein, amino acid and sterile processing exposure by formula type. Payer analysis maps listing status and classification decisions across the major reimbursement systems in detail.
Feeding day volume and daily cost by formula
Reimbursement listing status across major payer systems
Home feeding programme structure and distribution by market
Blenderised adoption and payer classification decisions tracked
Competitive position assessments across twenty companies
Dietitian coverage and prescribing influence benchmarking analysis

Built For The People Who Decide

From boardroom strategy to bench-side execution, this report is read cover-to-cover by leaders shaping the next decade of their industry, turning demand scenarios, market dynamics and valuation benchmarks into decisions.
CXOs/ Presidents/ VPs/ Managers
M&A and Corporate Development
Strategy Teams and R&D Heads
Procurement and Product Directors
Regulatory and Compliance Leaders
Investor Relations and Equity Analysts