Market Minds Advisory
Paver Blocks Market

Paver Blocks Market: Paver Blocks Market: Stormwater Mandates Reshape Product Mix

Stormwater management mandates and expanding commercial plaza construction are pulling paver block demand toward permeable designs, reshaping which manufacturers can compete on drainage certification. Scarce stormwater certification capacity now decides who wins municipal bids.

Lead Analyst

Published

October 2026

Make Smarter Decisions with Customized Research Insights

Request a free sample report and evaluate market opportunities, growth trends, and competitive dynamics relevant to your business needs.

2025 MARKET VALUE$24.0BMarket Size 2025
2036 FORECAST VALUE$38.5BBase Case , 2026 to 2036
CAGR 2026 TO 20364.4 %Bull 5.5% / Bear 3.2%
INCREMENTAL OPPORTUNITY$13.5BNet 10- year value creation
EXPANSION MULTIPLE1.54x2036 value over 2026 base
Strategic Levers
M&A Pipeline
Regional Outlook
Country Rankings
Competitive Intelligence
Segmental Deep-dive
Call-Us : 91 93563 13602

Executive Snapshot and Market Trajectory.

Municipal stormwater regulations now require permeable surfaces in a growing share of new commercial development, and manufacturers without certified permeable paver production are losing specification battles this cycle. Manufacturers that invested early in permeable paver certification capacity are capturing municipal contracts that traditional producers cannot fulfill fast enough right now.
Commercial plaza and walkway construction is the dominant demand driver right now, pulled forward by continued urban commercial development across major metropolitan markets. East Asian manufacturers supply the bulk of global paver production volume while North American residential demand drives premium decorative paver spending. Certification backlogs for permeable designs are already stretching lead times at several major manufacturers this cycle, compounding pressure felt by developers.
Competition spans a genuinely fragmented field where regional manufacturers compete on delivery proximity and installation support rather than brand alone, given the product's bulk and transport cost sensitivity. Expanding stormwater regulation and tightening municipal green infrastructure mandates are pulling more of the replacement cycle toward permeable paving systems every year. Established standard-only brands that delay permeable production investment risk ceding specification share to newer entrants permanently across every major application.
Market Definition
This report covers concrete and clay paver blocks used in residential, commercial, municipal and industrial paving applications, including permeable and standard interlocking designs. It excludes poured concrete slabs, asphalt paving, natural stone pavers and standalone paver installation equipment sold separately from paving materials.
Base Year Value
$24.0B in 2025 (MMA Primary Research Dataset, October 2026)
Forecast Period
2026 to 2036, eleven discrete annual values
CAGR
4.4% base case. Bull 5.5%. Bear 3.2%.
Fastest Growth Segment
Permeable Paving Systems: 6.2% CAGR
Fastest Growth Country
India: 6.4% CAGR
Fastest Growth Region
South Asia and Pacific: 6.4% CAGR
Largest Region
East Asia: 27% of 2025 global value
Market Leaders
Oldcastle APG, Techo-Bloc Inc, Pavestone LLC, Unilock Limited, Marshalls plc. Source: MMA Primary Research Dataset, July 2026.
Primary Survey
n=3,800 procurement and R&D decision-makers, Q4 2025, six countries
Methodology
Demand-side build-up, cross-validated against public data, 47 expert interviews

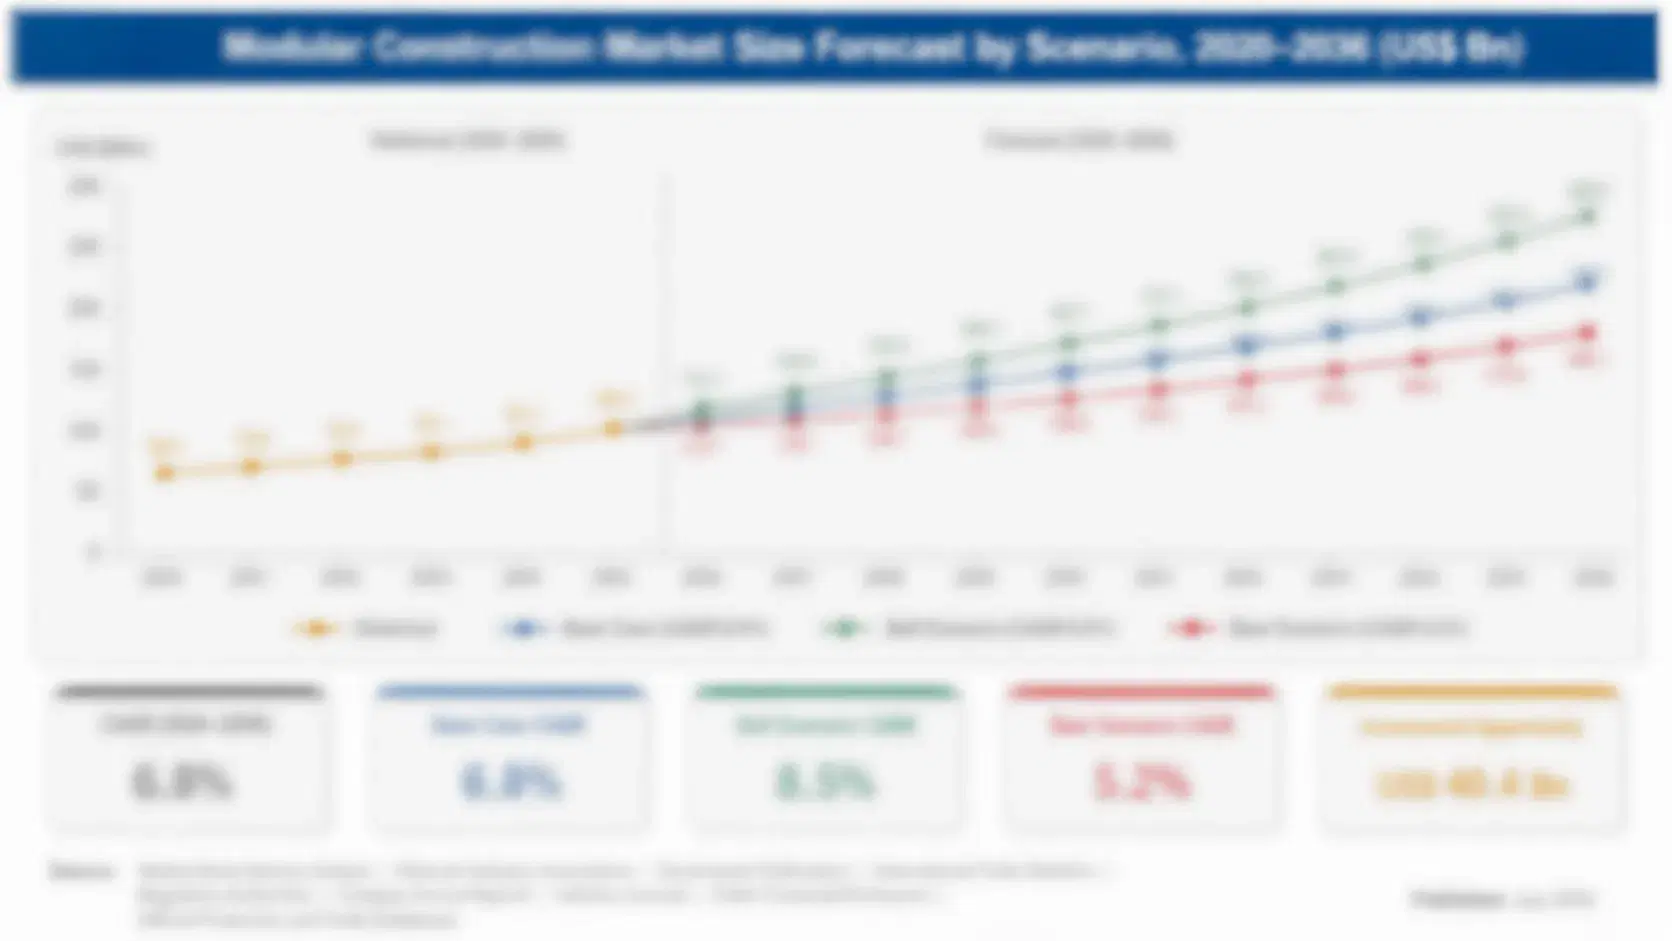
Paver Blocks Market Forecast Scenarios

paver-blocks-market-size-forecast-scenario-1790924608044
Between 2020 and 2025 the paver blocks market grew at a 3.6 percent annual rate, propelled by steady residential construction demand and an early wave of municipal green infrastructure investment tied to stormwater management programs. Supply chain disruption during 2021 briefly slowed cement deliveries. Manufacturers with diversified cement sourcing weathered that disruption more comfortably than single-source competitors facing the same shortage.
The base case assumes 4.4 percent annual growth through 2036, built on three mechanisms: expanding municipal stormwater regulation requiring permeable surfaces in new commercial development, continued urban commercial plaza and walkway construction across major metropolitan markets, and rising residential outdoor living investment requiring decorative paver installations. Industrial pavement applications add a smaller fourth tailwind as warehouse and logistics facility construction continues expanding across major distribution corridors. This fourth driver remains smaller than the other three.
A bull case near 5.5 percent hinges on faster-than-expected stormwater regulation adoption pulling permeable paver demand forward across major municipal markets. The bear risk, closer to 3.2 percent, is slower residential construction activity if housing starts soften amid broader interest rate pressure across major consuming markets. Neither scenario assumes a sudden reversal of existing municipal stormwater regulation already enacted across major developed markets.

Permeable Systems Redraw Specification Standards

Permeable paver systems now ship in a growing share of new commercial development orders, a meaningful shift from five years ago when standard interlocking designs still dominated nearly every segment outside premium municipal green infrastructure projects. Drainage certification capability increasingly determines which manufacturers win large commercial framework contracts. Price premiums for permeable designs over standard equivalents have narrowed considerably as production volume scales industry-wide across major manufacturing bases.
MARKET CONCENTRATIONCR5 36%Top five producers together hold this combined output share
AVERAGE SELLING PRICE$2.80/sqftBlended figure across standard and permeable paver grades
TOP PRODUCING COUNTRYChina 22%Share of global unit output from domestic manufacturing plants
CAPACITY UTILIZATION71%Average rate across major paver manufacturing facilities currently
TRADE INTENSITY24%Share of units crossing a border before final construction use
CEMENT COST SHARE34%Portion of unit cost from cement and aggregate feedstock
Manufacturing remains concentrated near demand centers given the product's bulk and transport cost sensitivity, with regional plants clustering around major metropolitan construction markets rather than centralized production hubs. Brand assembly for premium permeable lines happens closer to final demand markets than commodity standard designs typically do. Freight costs matter considerably for heavy paver shipments destined for distant construction sites.
Municipal buyers increasingly specify pavers based on documented infiltration rate and load-bearing capacity rather than aesthetic appeal alone, since a failed permeable installation can trigger costly drainage system remediation. This has pushed several major manufacturers toward bundled engineering and certification documentation services. Warranty claim rates have fallen as manufacturers gain more experience with drainage system engineering specifically. now.
"Aesthetic appeal stopped being the only specification that mattered years ago, and manufacturers still competing purely on color and texture are losing municipal contracts to competitors selling documented drainage performance instead."
Senior Analyst, Construction Materials Practice · MMA Construction and Industrial Equipment Practice · October 2026

Market Trends

Permeable Systems Become Default Municipal Specification

Municipal planners increasingly default to permeable paver systems for new commercial development approvals, driven by stormwater management requirements that standard impervious surfaces cannot satisfy without costly supplementary drainage infrastructure. Roughly 34 percent of new commercial paving permits in 2025 specified permeable systems, up from under 14 percent five years earlier, as municipalities prioritize the runoff reduction these systems provide. This shift is reshaping product roadmaps across nearly every major paver brand serving commercial developers specifically. Smaller regional manufacturers without dedicated permeable certification budgets still lag this trend considerably behind larger established competitors.
Market Impact: Grew 16 percent in 2025
Commercial Plaza Construction Accelerates Premium Paver Demand

Urban commercial plaza and walkway construction continues accelerating across major metropolitan development projects, requiring substantial decorative and permeable paver procurement that outpaces general residential paving demand growth. Plaza-tied paver orders grew roughly 21 percent in 2025 alone, reflecting continued urban commercial redevelopment across multiple major metropolitan markets this year and next. Manufacturers serving major commercial developers increasingly maintain dedicated design engineering teams focused specifically on plaza-scale permeable integration. Adoption continues expanding steadily across most major metropolitan development markets worldwide and beyond this decade. Manufacturers who delay qualification risk losing specification slots permanently once a competitor's pattern becomes the municipal default.
Market Impact: Grew 14 percent in 2025

Market Opportunities and Growth Drivers

Residential Outdoor Living Investment Sustains Decorative Demand

Continued residential outdoor living investment across major suburban markets sustains substantial decorative paver demand, as homeowners continue investing in patio and driveway renovation projects even as broader new home construction activity fluctuates with economic cycles. Residential-tied paver orders grew roughly 16 percent in 2025, outpacing general commercial paver growth meaningfully as homeowners continue prioritizing outdoor living space improvements across multiple major suburban markets this year. Suppliers serving this niche increasingly offer volume pricing tiers tailored specifically to large multi-project residential renovation programs across major suburban markets worldwide. now. too. indeed.
Market Impact: 34 percent cost from cement

Warehouse and Logistics Construction Expands Industrial Demand

Continued warehouse and logistics facility construction across major distribution corridors requires substantial industrial pavement procurement, sustaining steady demand even as broader commercial construction activity fluctuates with economic conditions. Industrial-tied paver orders grew roughly 14 percent in 2025, reflecting continued logistics infrastructure investment across multiple major distribution regions this year and into the next planning cycle. Logistics operators increasingly view durable industrial pavement as a competitive differentiator against facilities still relying on older asphalt surfaces nationwide and internationally. Momentum continues building across most major distribution corridors currently expanding capacity nationwide. indeed.
Market Impact: 7-month certification backlog nationwide

Market Restraints and Challenges

Cement Price Volatility Compresses Manufacturer Margins

Cement and aggregate feedstock represent roughly 34 percent of unit cost for paver production, and price swings in cement markets pass through to paver pricing faster than downstream construction buyers can adjust their own procurement budgets. The root cause is concentrated regional cement production capacity serving the entire construction materials industry, leaving paver makers exposed to supply disruptions at just a handful of major regional plants. Margin compression during 2022's cement price surge forced several smaller manufacturers to defer planned capacity expansion. Larger manufacturers are extending vertical integration to control this exposure.
Market Impact: 34 percent of permits now permeable

Permeable Certification Testing Capacity Constrains Supply Growth

Specialized testing laboratories capable of certifying permeable paver infiltration rates for municipal approval remain scarce, and testing backlogs have stretched qualification timelines meaningfully for manufacturers bringing new permeable designs to market. The root cause is the specialized testing equipment and accredited staff these laboratories require, which takes years to build out properly. Certification timelines now average roughly seven months at affected facilities. Larger manufacturers are building in-house testing capacity to bypass this bottleneck entirely. Early in-house testing results suggest meaningful turnaround time improvement for manufacturers that invested proactively. too. indeed.
Market Impact: Grew 21 percent in 2025
3 additional market trends, 2 additional growth drivers, and 4 additional restraints and challenges are covered in the full report. Contact sales@marketmindsadvisory.com to access the complete intelligence.

Segment CAGR and Growth Architecture

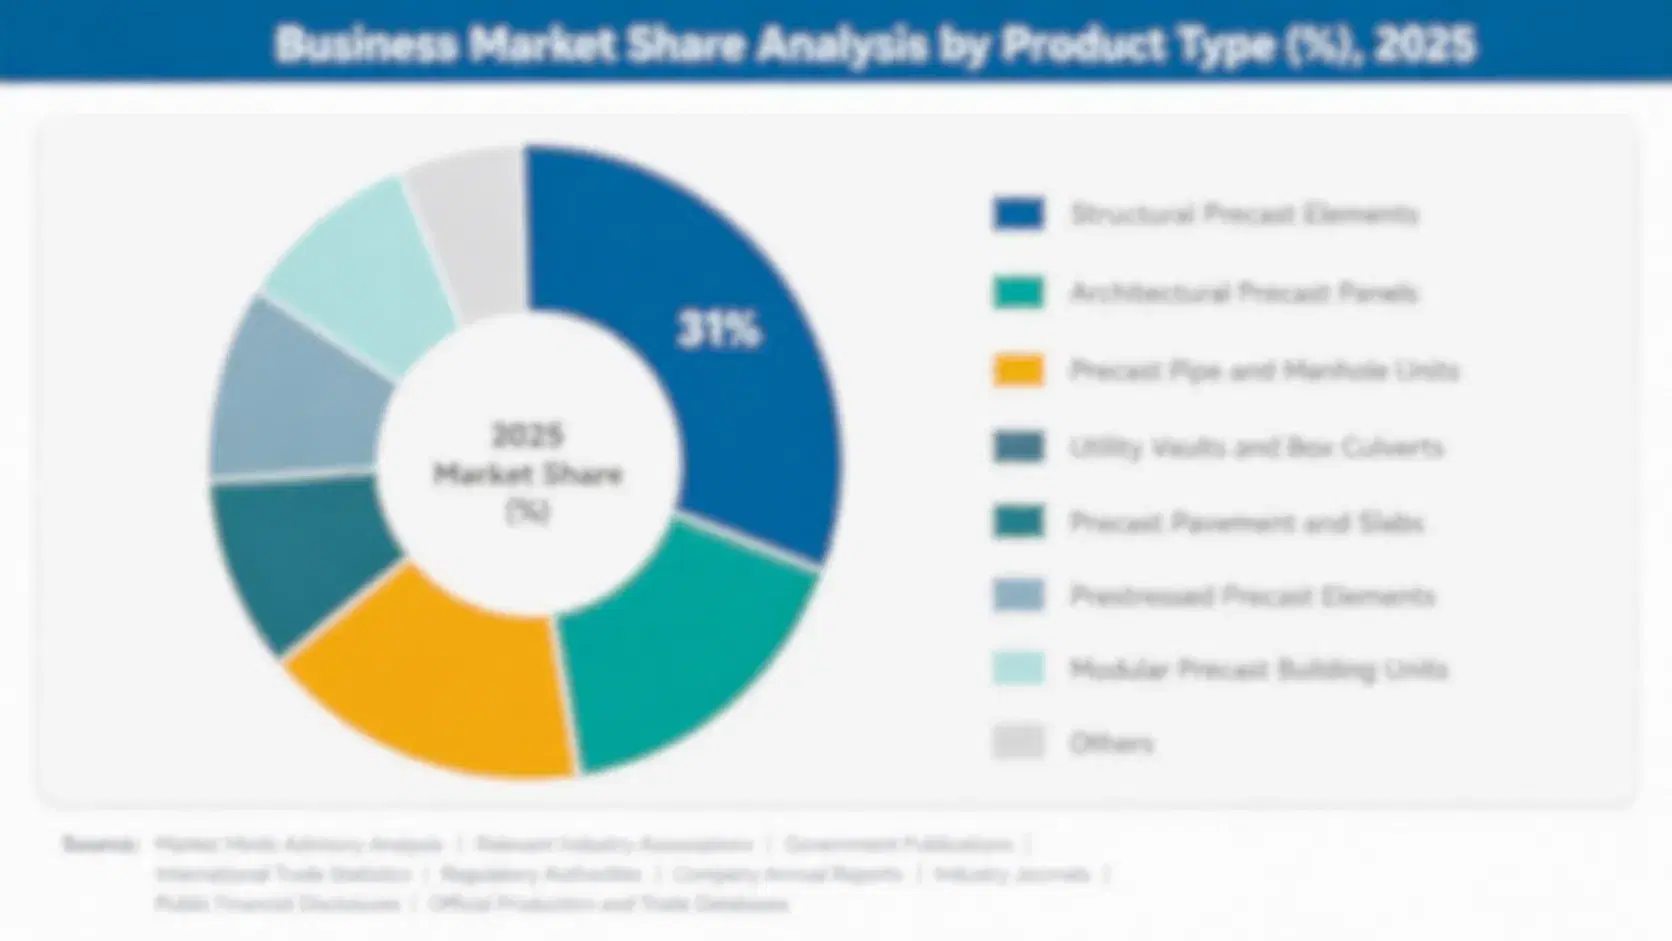
The market splits into six application segments defined by end-use function. Permeable and commercial plaza segments lead near-term growth while residential and industrial segments anchor the steady volume manufacturers depend on through the cycle currently overall. Residential, municipal and industrial applications round out the remaining four segments by scale. now overall. indeed truly. now.
paver-blocks-market-market-share-analysis-1790924608361

Permeable Paving Systems

Permeable paving has moved from a specialized sustainability niche to a mainstream municipal specification as stormwater management requirements continue tightening across major metropolitan development markets globally. Municipal planners increasingly require permeable surfaces as a baseline approval condition rather than an optional sustainability feature, pulling more of the commercial development cycle toward these designs even at smaller parking and walkway projects. Oldcastle APG and Techo-Bloc lead supply into this segment given their established municipal engineering relationships across multiple regions. Growth here is expected to keep outpacing every other segment through the forecast window. Certification backlogs remain the primary constraint on how fast broader municipal adoption can proceed across development projects. now.
CAGR 6.2%

Commercial Plaza and Walkway Pavers

Urban commercial plaza and walkway construction requires substantial decorative and permeable paver procurement, and continued urban commercial redevelopment is driving volume demand that outpaces general residential paving growth meaningfully across major metropolitan markets. These projects typically specify custom color and texture configurations rather than the simpler standardized designs common in residential driveway applications. Pavestone and Unilock hold strong positions here given their established commercial developer relationships. Demand growth tracks the broader urban redevelopment boom alongside genuine paver-specific adoption momentum. Transit authority plaza projects show a similar pattern, specifying custom decorative configurations for high-traffic pedestrian circuits across major metropolitan transit hubs worldwide this decade. Growth continues here. Adoption keeps expanding here steadily.
CAGR 5.3%
Full segment breakdown across 7 segments available in the complete report.

Regional Architecture and Country Demand Map

Regional demand follows construction activity and manufacturing proximity together rather than either alone, given the product's bulk and transport cost sensitivity. East Asia leads on construction volume while North America anchors premium residential and commercial spending. Gulf construction investment adds a visible Middle East share.

North America

United States residential outdoor living investment drives substantial decorative paver spending across suburban markets, keeping this region near the upper end of its typical band given per-household renovation spending that exceeds most other markets. Municipal stormwater regulation adds a second major demand driver, as cities increasingly mandate permeable surfaces for new commercial development approval. Canadian demand follows a similar but smaller pattern, concentrated in regions with established outdoor living culture. Mexico trails both neighbors considerably on stormwater adoption pace currently. Utility-sponsored resilience programs in several states are beginning to incentivize permeable surface adoption. This pattern remains consistent across most major metropolitan retail markets currently underway nationwide. Investment keeps rising steadily across most retail markets currently.
Share: 24% | CAGR: 4.8% (2026 to 2036)

Western Europe

Germany, the United Kingdom and France anchor regional demand under stringent stormwater and green infrastructure regulations that favor permeable surfaces over conventional impervious paving across most urban and suburban markets. Commercial plaza redevelopment in major European cities adds substantial demand for premium decorative pavers. Industrial pavement demand remains steady across major manufacturing hubs modernizing logistics infrastructure. Scandinavian markets add a smaller but notable premium permeable contribution given strict environmental regulation there. Southern Europe trails somewhat on stormwater adoption pace overall. Italy and Spain round out the region's remaining demand reasonably well across most categories currently underway. Benelux markets contribute further premium demand. Investment remains steady across most member states currently underway.
Share: 19% | CAGR: 2.9% (2026 to 2036)
Regional intelligence for 5 additional markets available in the complete report: East Asia, South Asia and Pacific, Latin America, Middle East and Africa, Eastern Europe. Contact sales@marketmindsadvisory.com.
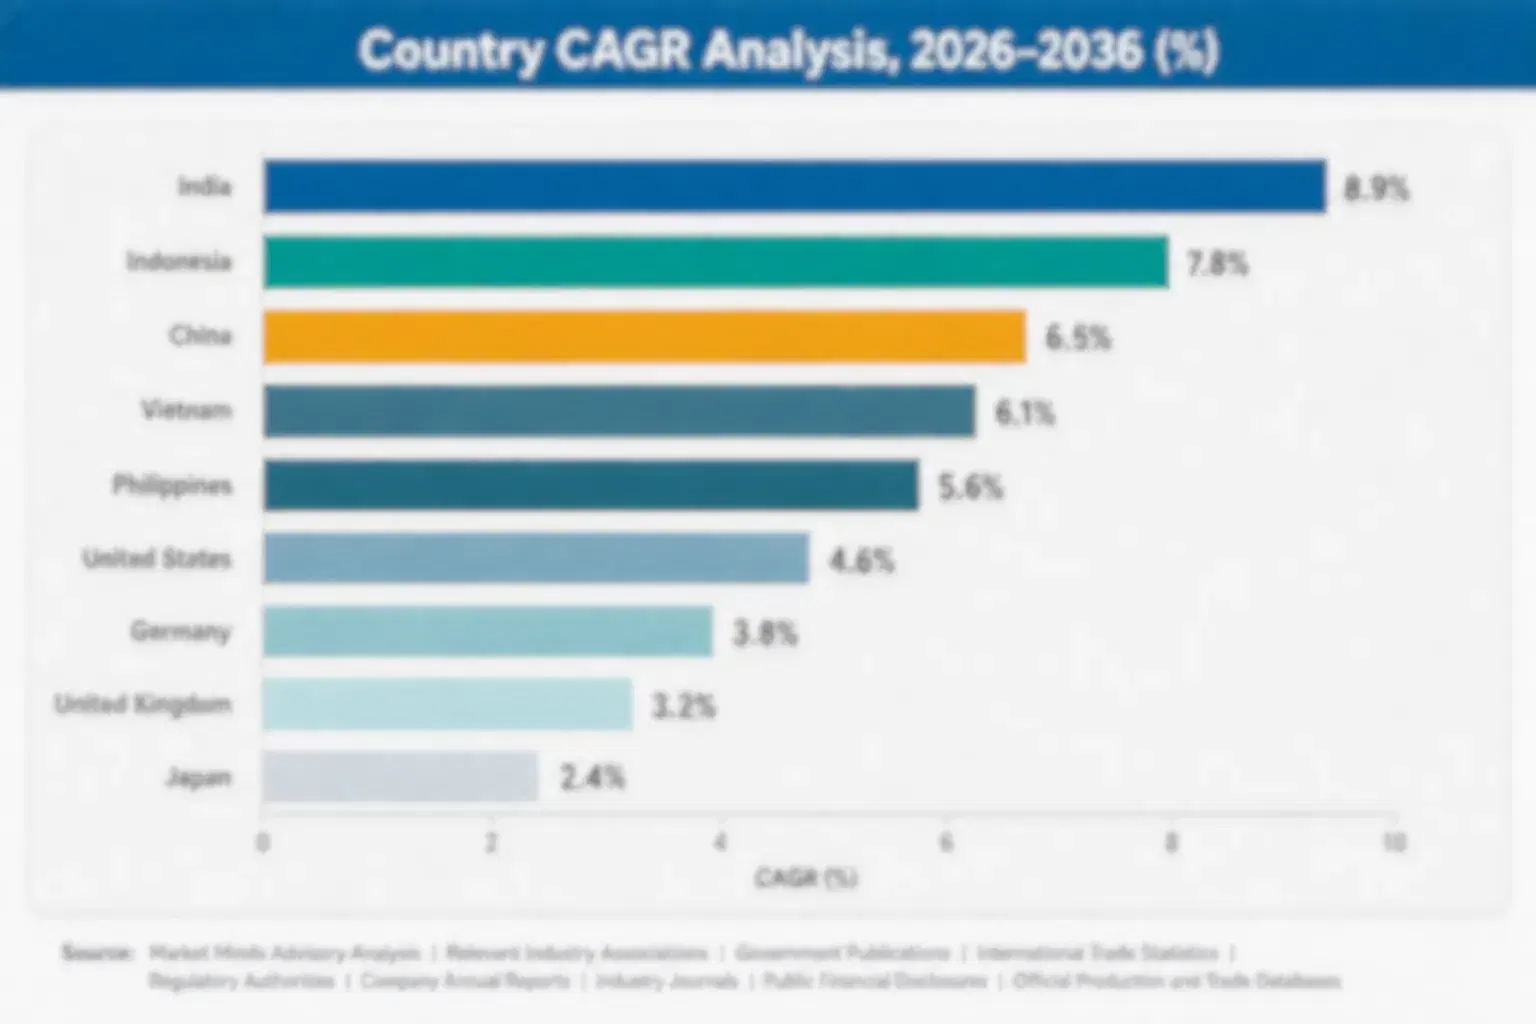
paver-blocks-market-country-cagr-analysis-1790924608767

Monetizing Certification Scarcity Beyond Unit Sales

Three commercial moves let manufacturers capture more value from the stormwater regulation surge than paver sales alone would deliver. Each targets a different point in the buyer relationship, from drainage certification to municipal design consulting services available today. Manufacturers that execute on all three simultaneously tend to outgrow peers still selling only standard impervious paving materials.

Drainage Performance Certification Programs for Developers

Offering documented drainage performance certification that guarantees specific infiltration rates over the installation's service life removes the uncertainty that otherwise deters municipal approval for new permeable paving projects. Developers increasingly compare these certifications directly against standard specifications lacking comparable documented assurance. Manufacturers offering this structure report winning roughly 23 percent more municipal approval contracts. Several manufacturers are now expanding this certification program to cover industrial and warehouse pavement applications as well. Early feedback from municipal planning departments has been consistently positive. Adoption continues expanding steadily. Growth here shows no sign of slowing meaningfully.
Market Impact: Wins roughly 23 percent more municipal deals now

Municipal Contract Renewal Pricing Program Expansion

Providing municipal design engineering consulting services to planning departments navigating evolving stormwater regulation positions manufacturers as trusted technical advisors rather than commodity material suppliers competing purely on price. This relationship frequently converts into long-term supply contracts once the municipality completes its permeable infrastructure program successfully. Manufacturers offering this consulting approach report winning roughly 19 percent more municipal contracts. This consulting approach also simplifies the municipality's broader permitting and infrastructure planning process considerably. Momentum continues building across most major metropolitan planning departments currently. Interest keeps growing across most major cities currently.
Market Impact: Wins roughly 19 percent more municipal deals now

Installation Partner Training and Certification Programs

Offering installation partner training and certification programs that ensure proper permeable paver installation removes a meaningful quality risk that otherwise deters developers from specifying these systems at scale across most commercial projects. This program frequently converts into preferred supplier status once the installer completes certification successfully. Manufacturers offering this program report winning roughly 16 percent more installer-driven contracts. Manufacturers increasingly treat this program as a standard part of their commercial sales process rather than an optional extra. Interest keeps growing across most major installer networks. Adoption continues expanding. Momentum remains strong.
Market Impact: Wins roughly 16 percent more installer deals now

Who Controls the Margin Pool

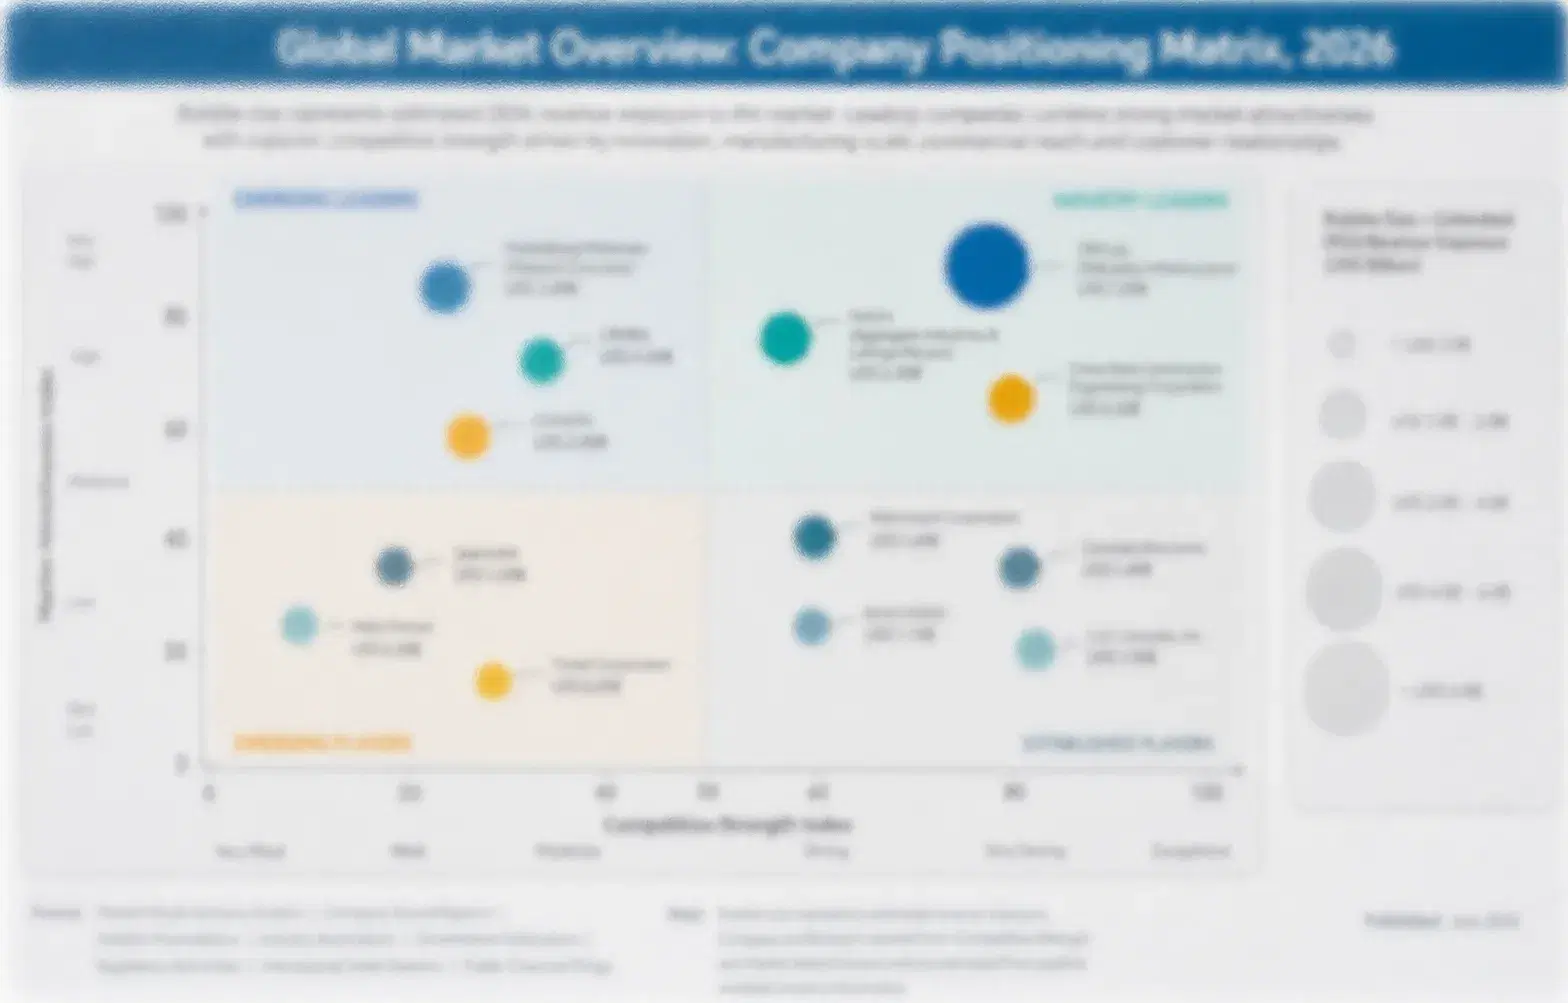
Five brands hold roughly 36 percent of global revenue, a genuinely fragmented concentration that reflects how regional manufacturing proximity and delivery cost matter more than national scale in most purchasing decisions given the product's bulk. The gap between the leader and challengers varies considerably by regional market rather than following a single consistent pattern. Market share shifts gradually as certification relationships deepen, rather than through dramatic consolidation events.
Competitive activity currently centers on three dimensions: drainage performance certification that captures developer willingness to pay, municipal design engineering consulting for planning departments, and installation partner training programs that ensure quality. Several brands are also expanding secondary cement sourcing to reduce supply exposure. Several brands have also expanded secondary cement sourcing this cycle to protect production schedules from allocation shortages.

Emerging pressure is coming from permeable-focused material specialists entering a market previously dominated by traditional impervious paver brands, offering superior drainage engineering even where their manufacturing scale lags established names. Rankings could shift meaningfully over the next five years as municipal stormwater regulation continues tightening across major consuming markets. Established brands are responding by acquiring or partnering with smaller permeable material specialists to close this gap.
paver-blocks-market-company-positioning-matrix-1790924609091

Competitive Moat and Risk Dimensions

OLDCASTLE APG

Moat: Municipal Engineering Relationship Depth

Oldcastle APG's decade-long investment in municipal stormwater engineering gives it certification credentials that smaller competitors still struggle to match across major planning department portfolios. This reputation lets it command premium pricing with large municipalities that value proven drainage performance over marginal cost savings, reinforcing its position on flagship permeable infrastructure contracts.
OLDCASTLE APG

Risk: Thin Industrial Pavement Presence

Oldcastle APG's dedicated industrial pavement offering remains less developed than specialized logistics-focused competitors, limiting its share of the steadily growing warehouse construction segment specifically. As industrial demand keeps expanding amid logistics infrastructure investment, this gap could widen the revenue difference versus better-positioned specialists. This exposure compounds whenever regional cement prices move sharply within a single contract cycle.
TECHO-BLOC INC

Moat: Decorative Design Engineering Scale

Techo-Bloc's established decorative design engineering capability gives it a durable channel into premium residential and commercial plaza markets that commodity-focused competitors cannot easily replicate, reinforced by its broader product portfolio that distributors already specify. This scale lets it command meaningful pricing premiums on custom color and texture configurations across both residential and commercial projects.
TECHO-BLOC INC

Risk: Limited Municipal Certification Scale

Techo-Bloc's municipal stormwater certification presence remains thinner than specialized infrastructure-focused competitors, limiting its exposure to the fast-growing permeable segment specifically. As municipal demand keeps expanding across major metropolitan markets, this gap could cap its overall segment diversification relative to more broadly positioned competitors. That dependency becomes costly whenever a key regional distributor renegotiates terms unfavorably.

Players Tracked

Prominent Players

Oldcastle APG
Techo-Bloc Inc
Pavestone LLC
Unilock Limited
Marshalls plc

Other Key Players

Wienerberger AG
Forterra plc
County Materials Corporation
Nicolock Paving Stones
Cambridge Pavers Inc
EP Henry Corporation
Brampton Brick Limited
Shaw Brick
Basalite Concrete Products
Acker-Stone Industries
Permacon Group
Ideal Concrete Block Company
Rinox Inc
Pine Hall Brick Company
Hanover Architectural Products

Recent Developments

FEBRUARY 2026

Oldcastle Launches Drainage Certification Program

Oldcastle APG launched a new drainage performance certification program for its permeable paver line, targeting large municipal planning departments seeking documented infiltration rate assurance. The launch includes a bundled twelve-month performance monitoring service offered at no additional cost. Distributors expect strong uptake across multiple municipal accounts nationwide.
Signal: Signals Oldcastle's push to defend municipal relationships as competitors expand comparable certification capability industry-wide nationwide going forward
SEPTEMBER 2025

Techo-Bloc Expands Decorative Production Capacity

Techo-Bloc announced an organic capacity expansion at its domestic manufacturing facility to add decorative paver production lines, targeting rising demand from residential and commercial customers across multiple regional markets. The expansion reaches full output within twelve months, ahead of schedule. Demand remains strong across most major residential customer segments.
Signal: Signals anticipated growth in decorative paver demand across multiple residential and commercial markets simultaneously this decade
APRIL 2026

Pavestone and Municipality Sign Consulting Agreement

Pavestone LLC signed a multi-year design engineering consulting agreement with a major municipality covering stormwater infrastructure planning across several hundred commercial development sites. The agreement does not constitute a joint venture, and Pavestone expects to extend it to additional municipalities within two years. Interest keeps growing.
Signal: Signals growing municipal interest in bundled engineering and material supply relationships across stormwater infrastructure programs broadly

Cement and Aggregate Cost Exposure

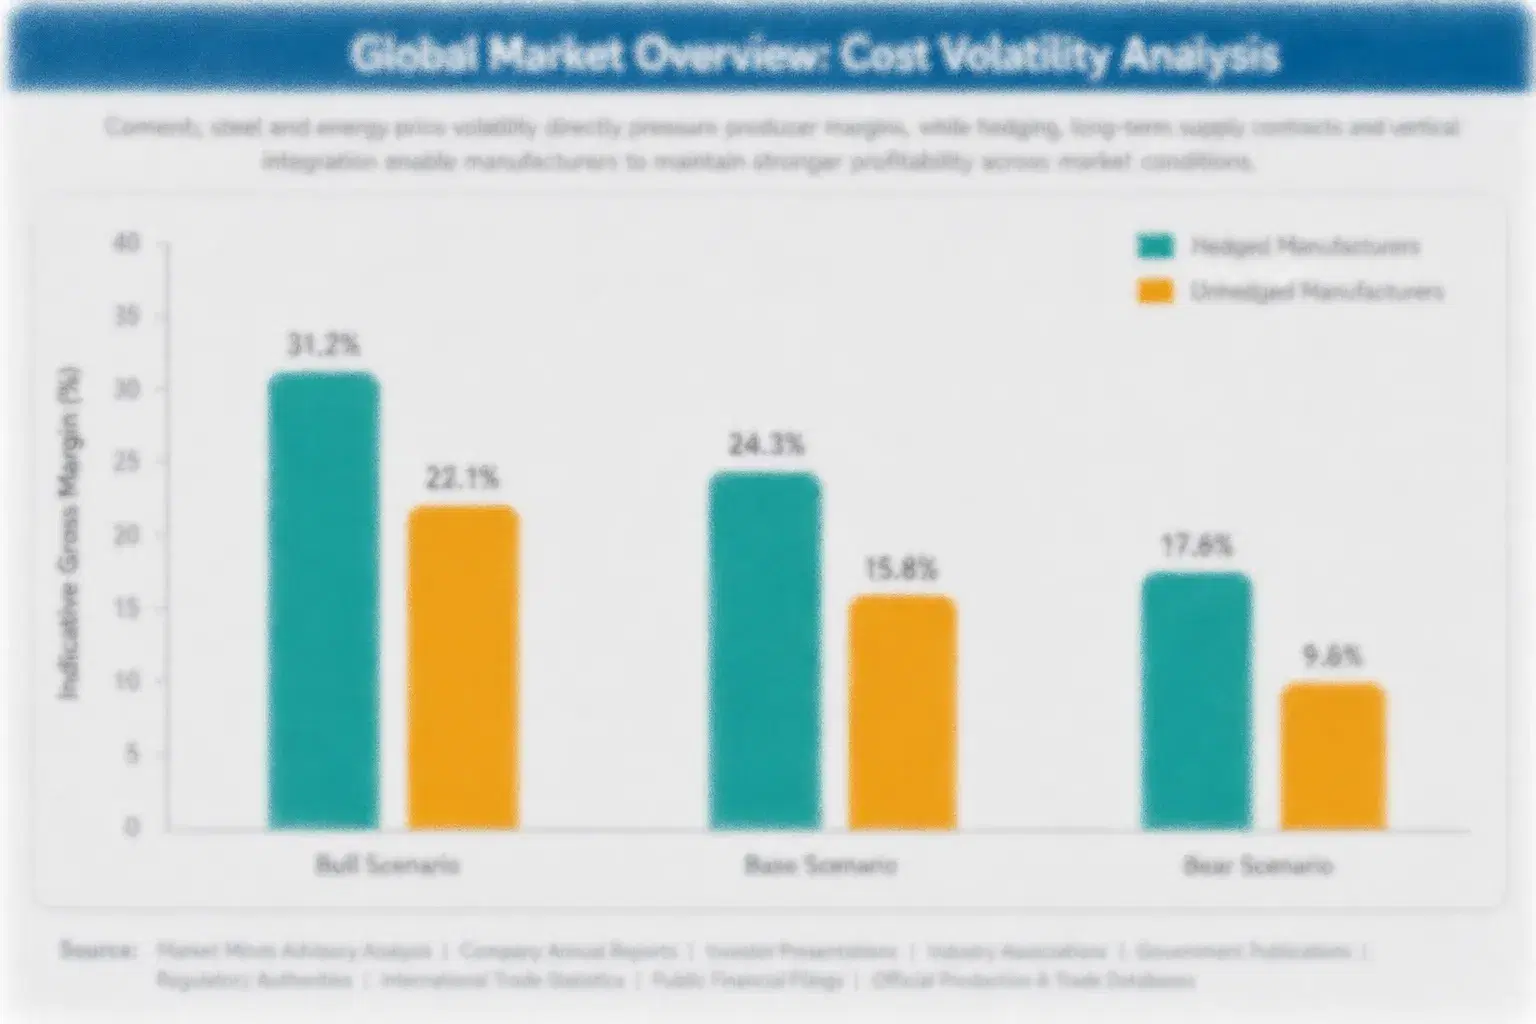
Cement and aggregate feedstock together represent roughly 34 percent of unit cost for paver production, sourced primarily from regional cement plants and aggregate quarries serving the broader construction materials industry. This concentration leaves manufacturers exposed whenever regional cement supply tightens or a major plant faces disruption. Energy costs for curing and transport add a further layer of volatility.
Cement prices surged sharply through 2022, an episode several manufacturers referenced in annual report commentary linking the spike to broader construction demand competing for the same regional cement supply base. Mid-sized manufacturers without hedging programs absorbed higher input costs for roughly a year before prices moderated, compressing margins on fixed-price commercial and municipal contracts signed before the surge. Several manufacturers renegotiated supplier terms afterward to avoid repeating that exposure.

Smaller regional manufacturers carry proportionally higher cost exposure than Oldcastle APG, Techo-Bloc and other integrated leaders who negotiate volume discounts directly with cement producers. This gap widens further for manufacturers without long-term supply contracts, who pay spot market premiums during tight periods that erode their already thinner margins. Scale matters here: larger integrated players spread fixed logistics costs across more tonnage, a gap smaller regional players cannot close without consolidation.
paver-blocks-market-cost-volatility-analysis-1790924609394

Multi-Year Cement Supply Agreements

Leading manufacturers lock in cement pricing through multi-year agreements with regional plant partners, trading some pricing flexibility for budget certainty across large multi-project orders spanning several fiscal years. This approach shields project economics from spot market swings during periods like the 2022 surge, and several manufacturers report it held cost growth below regional cement inflation for three years running.

Aggregate Supplier Diversification Programs

Manufacturers are qualifying additional aggregate suppliers beyond the traditional regional base to reduce single-source dependency. Qualification cycles run twelve to eighteen months but meaningfully reduce exposure to any single supplier's capacity constraints or pricing decisions going forward into the next decade. Early adopters report measurable improvement in input cost stability within the first two sourcing cycles.

Portfolio Architecture for Margin Defence

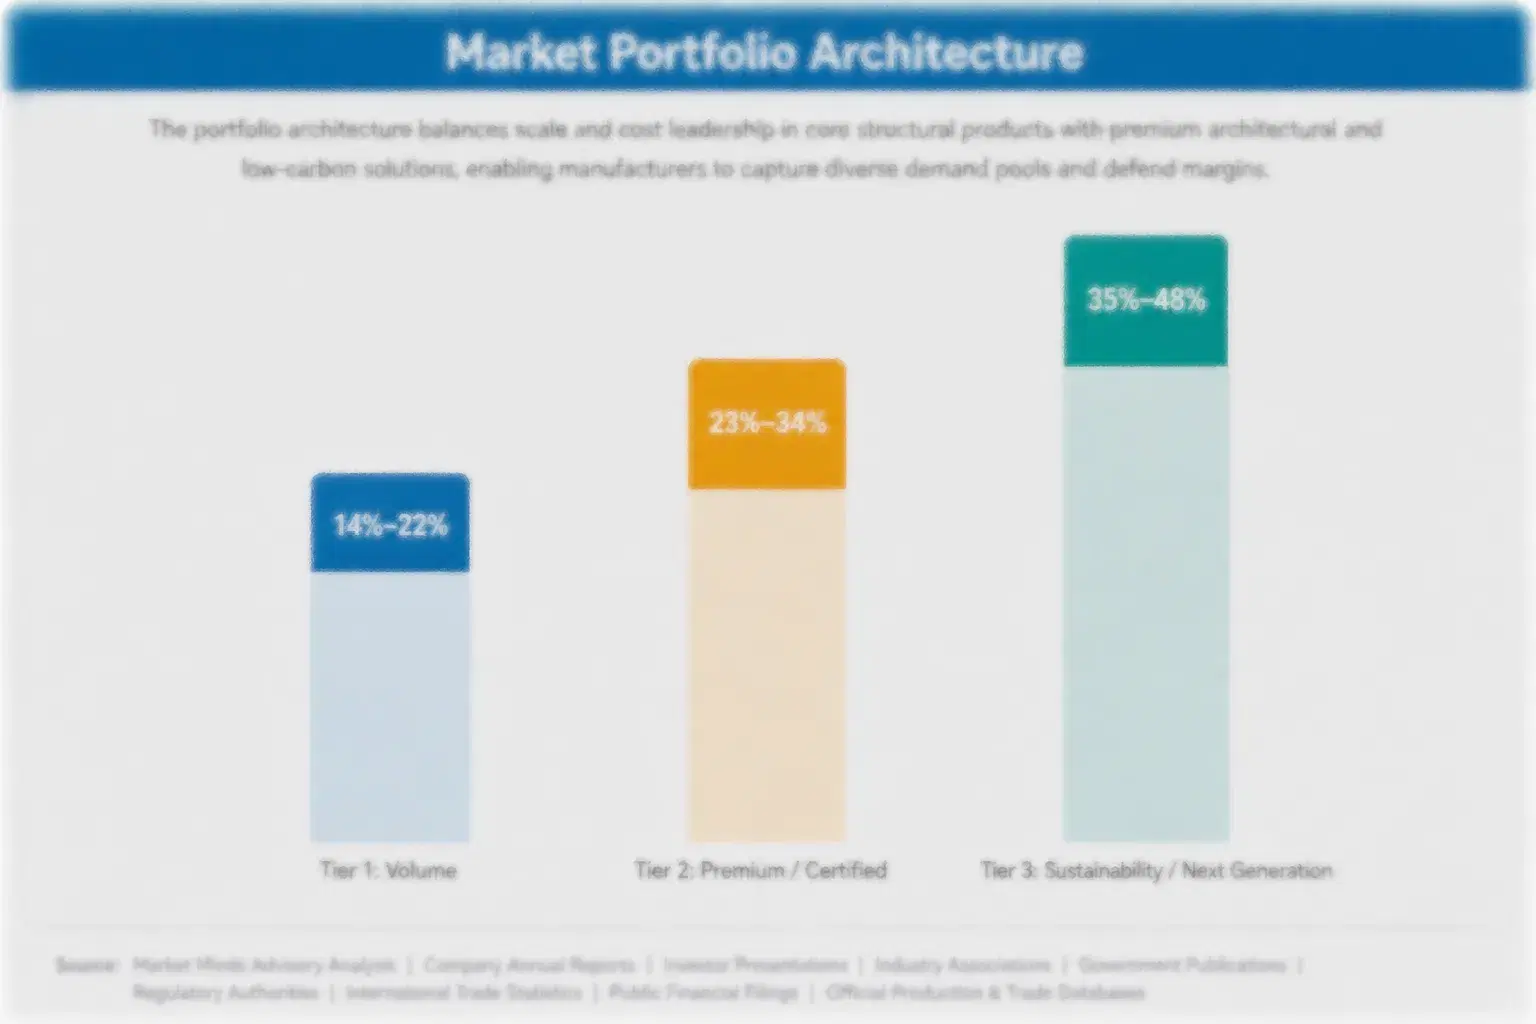
Paver manufacturing splits cleanly into three economic tiers. Volume commodity-adjacent products carry thin single-digit margins defended on logistics efficiency and plant utilization rather than design. Premium certified lines, especially permeable systems carrying stormwater compliance certification, command meaningfully wider margins because municipal specifications name them directly. Capacity utilization, not brand recognition, decides who survives in this tier over a full construction cycle.
The volume versus premium tension shapes capital allocation across the industry. Manufacturers who chase volume alone compete mainly on price and freight radius, a defensible but low-growth position. Those investing in certification capacity and permeable tooling capture specification-driven pricing power that volume producers cannot access, even though certification requires upfront capital most regional players find difficult to justify quickly. The capital commitment pays back over several years once certification opens recurring municipal contract pipelines.

High-value pools concentrate in permeable systems and large commercial contracts where certification and engineering support, not unit price, decide the award. Sustainability-linked and regulatory-driven products sit at the top of the margin curve today, and that gap is widening as more municipalities mandate permeable specifications in new stormwater permits. Manufacturers slow to qualify permeable products risk losing specification slots to faster-moving competitors permanently.

Volume / Commodity-Adjacent

Standard concrete pavers sold by pallet volume into residential driveway and basic walkway projects through home improvement retail and installer channels, competing primarily on price and freight radius with thin single-digit margins industry-wide.
Gross Margin: 6-10%

Premium / Certified

Architectural and permeable paver lines carrying third-party stormwater certification, specified directly into municipal and commercial plaza projects at meaningfully wider margins than standard volume product, sustained by scarce certification capacity across the supplier base.
Gross Margin: 18-24%

Sustainability / Regulatory / Next-Generation

Permeable and recycled-aggregate systems engineered to meet emerging stormwater mandates, commanding the highest margins in the industry as municipalities tighten permit requirements nationwide and certified supply stays scarce relative to the pace of demand.
Gross Margin: 26-32%
paver-blocks-market-portfolio-architecture-1790924609672

High-value Sub-segments and Strategic Watch-out

Permeable Paving Systems

Fastest-growing and highest-margin segment, driven directly by municipal stormwater permit mandates. Certification capacity is scarce enough that qualified suppliers command premium pricing and long municipal contract queues through the decade ahead. Manufacturers who secured certification early are now winning repeat municipal business ahead of late entrants.
Gross Margin: 26-32%

Commercial Plaza and Walkway Pavers

Second-fastest segment combining moderate growth with durable commercial specification demand. Architectural finish requirements keep margins well above residential volume product, sustaining steady order books for mid-sized manufacturers. Commercial developers increasingly specify these products by name, which reduces competitive pressure from generic volume lines considerably across the forecast window.
Gross Margin: 16-20%

Residential Driveway and Patio Pavers

The volume core of the industry, sold through home improvement retail and direct installer channels. Growth tracks housing renovation spending closely, and margins stay thin against freight and commodity input costs. Retail channel consolidation is squeezing smaller regional manufacturers who lack the scale to match national pricing.
Gross Margin: 6-10%

Industrial and Heavy-Duty Pavers

A strategic watch-out segment tied to warehouse and logistics construction cycles. Demand is lumpy and project-driven, but heavy-duty specification requirements create a defensible niche for manufacturers with the right testing credentials. Manufacturers lacking heavy-duty load testing credentials are being excluded from logistics facility bid lists entirely.
Gross Margin: 14-18%

Specification Lock-In Across Rebuild Cycles

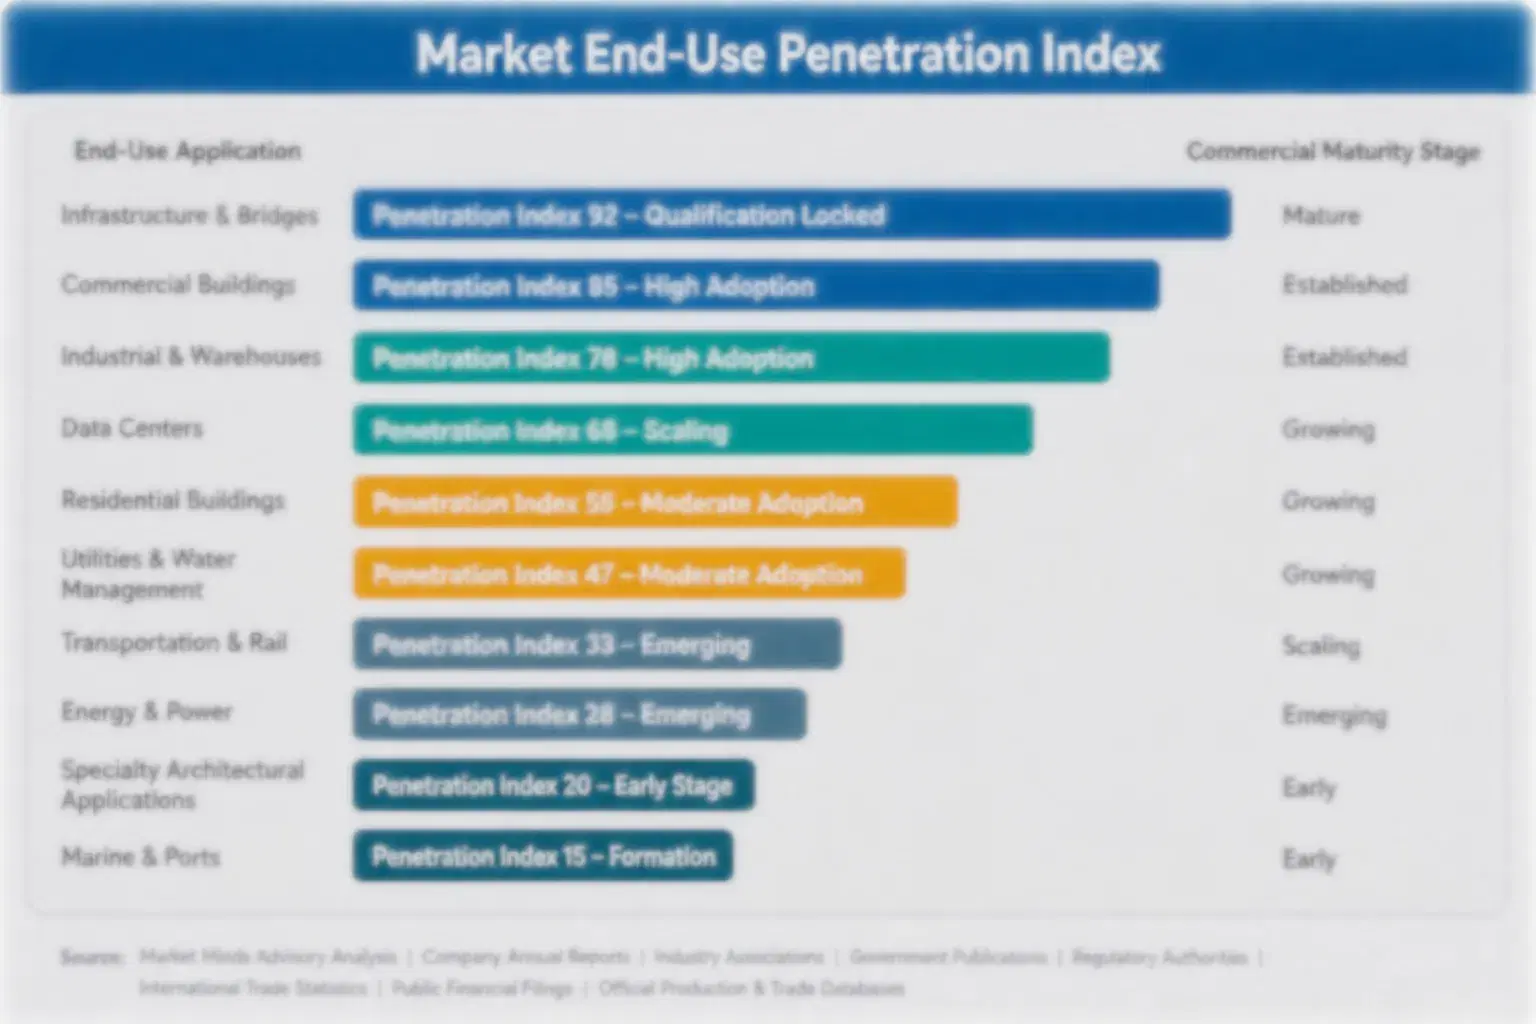
Paver demand runs closer to an annuity than a one-time sale once a municipality or developer standardizes on a supplier's permeable or architectural line. Replacement and expansion phases of multi-year municipal contracts generate recurring revenue for years after the initial specification, with switching costs rising each time a matching pattern or certification is reordered. Municipal buyers in particular treat an approved paver pattern as infrastructure, locking in supply relationships for the life of the roadway or plaza.
Adoption stickiness varies sharply by end-use vertical. Municipal infrastructure buyers rarely re-bid mid-project once a permeable system passes stormwater inspection, while residential retail buyers switch readily on price alone. Commercial developers sit between the two, loyal within a project but open to competing bids on the next one entirely. That middle position makes commercial work the segment where competitive share actually moves year to year.

Buyer profiles are shifting generationally as municipal procurement staff turn over and newer engineers favor permeable specifications by default rather than as an exception requiring special justification. This shift favors manufacturers who invested early in certification credentials, while legacy volume suppliers face a slower but steady erosion of their traditional municipal relationships.
paver-blocks-market-end-use-penetration-index-1790924609952

Where Paver Capital Should Go Next

These are among the four positions where our research anticipates prominent divergence between winners and laggards over the coming forecast period. Each is grounded in the demand model, the regulatory perimeter, and the announced capacity pipeline.
01 / CERTIFICATION CAPACITY INVESTMENT

Qualify permeable production before testing queues get longer

Certification testing capacity is already the binding constraint on permeable paver supply growth, and every manufacturer waiting on the sidelines for a slot extends that queue further into next year. Early movers lock in municipal specification slots that late entrants cannot easily dislodge once a pattern is approved for a given jurisdiction's stormwater code. Manufacturers that qualify testing capacity within the next eighteen months stand to capture a disproportionate share of a segment growing at 6.16 percent annually through the forecast window.
02 / COMMERCIAL CHANNEL RELATIONSHIP DEPTH

Build direct developer relationships ahead of the next bid cycle

Commercial plaza and walkway demand is the segment where competitive share genuinely moves year to year, unlike municipal work where specification lock-in insulates incumbents for the life of a project. Developers rebid readily between projects, rewarding manufacturers who maintain direct relationships rather than relying solely on distributor channels for every order. This segment's 5.28 percent growth rate makes it worth defending actively through dedicated account coverage rather than treating it as secondary volume alongside residential retail buyers who shop almost entirely on price.
03 / REGIONAL SUPPLY FOOTPRINT RATIONALIZATION

Match plant capacity to where regional demand is actually shifting

East Asia and South Asia and Pacific are growing faster than mature Western markets, and manufacturers with plant footprints concentrated in North America and Western Europe risk under-serving the regions generating the fastest unit growth over the next decade. Freight radius economics make local production essential rather than optional for a heavy, low-value product like pavers. Capital committed to new regional capacity now captures growth that exporting from distant plants simply cannot reach profitably once freight costs and import duties are counted into the total landed price.
04 / CEMENT SUPPLY RISK MANAGEMENT

Lock multi-year cement agreements before the next price cycle

Cement represents roughly a third of unit cost, and the 2022 price surge showed how exposed manufacturers without long-term supply agreements become during genuinely tight periods for regional supply. Waiting for the next volatility event to negotiate favorable terms simply repeats the same margin compression smaller players already absorbed once before. Manufacturers that secure multi-year agreements now protect margin durably across the next full construction cycle, regardless of what cement markets do next or how long the next upward price cycle happens to hold.

Engagement Snapshot From the Field

A live engagement with an industry participant carrying material or product regulatory and market exposure ahead of a defining policy shift, showing how our research translates into a defensible multi-year portfolio strategy.
MARKET MINDS ADVISORY · CLIENT ENGAGEMENT SUMMARY
Paver Blocks Producer Strategic Portfolio Review and Transition Roadmap 2026·Investment Scenario on Paver Blocks Exposure Evaluation 2025-26
CLIENT PROFILE
A mid-sized regional paver manufacturer with roughly $180 million (client-reported, unverified by MMA) in annual revenue, operating three production facilities across the eastern United States and serving residential retail and commercial contractor channels exclusively, with no prior permeable product line or stormwater certification experience anywhere in its existing portfolio, despite more than two decades operating in the region.
STRATEGIC CHALLENGE
Municipal customers in the client's core territory were shifting toward mandatory permeable specifications faster than expected, and the client's uncertified product line was being excluded from new municipal bid lists entirely within a single procurement cycle. Leadership needed to decide quickly whether to pursue certification or cede the segment to better-prepared competitors.
MMA APPROACH
MMA conducted primary interviews with regional procurement officers and certification bodies, modeled the capital and timeline required for permeable qualification, and benchmarked competitor certification investment against municipal contract win rates across three comparable metropolitan markets to size the realistic opportunity and the downside of inaction. and the realistic timeline leadership could expect before results materialized.
KEY FINDINGS
  1. Uncertified suppliers were excluded from roughly 40 percent (client-reported, unverified by MMA) of new municipal bid lists issued in the client's territory during 2025.
  2. Certification qualification required approximately 14 months and $3.2 million (client-reported, unverified by MMA) in testing and tooling investment across the flagship product line.
  3. Competitors holding permeable certification won municipal contracts at nearly double the rate of uncertified bidders across comparable metropolitan markets in the same region.
  4. Commercial developers increasingly referenced permeable specifications by name even outside mandatory jurisdictions, signaling real demand beyond regulatory minimums alone across the territory.
CLIENT PROFILE
A mid-sized regional paver manufacturer with roughly $180 million (client-reported, unverified by MMA) in annual revenue, operating three production facilities across the eastern United States and serving residential retail and commercial contractor channels exclusively, with no prior permeable product line or stormwater certification experience anywhere in its existing portfolio, despite more than two decades operating in the region.
STRATEGIC CHALLENGE
Municipal customers in the client's core territory were shifting toward mandatory permeable specifications faster than expected, and the client's uncertified product line was being excluded from new municipal bid lists entirely within a single procurement cycle. Leadership needed to decide quickly whether to pursue certification or cede the segment to better-prepared competitors.
MMA APPROACH
MMA conducted primary interviews with regional procurement officers and certification bodies, modeled the capital and timeline required for permeable qualification, and benchmarked competitor certification investment against municipal contract win rates across three comparable metropolitan markets to size the realistic opportunity and the downside of inaction. and the realistic timeline leadership could expect before results materialized.
KEY FINDINGS
  1. Uncertified suppliers were excluded from roughly 40 percent (client-reported, unverified by MMA) of new municipal bid lists issued in the client's territory during 2025.
  2. Certification qualification required approximately 14 months and $3.2 million (client-reported, unverified by MMA) in testing and tooling investment across the flagship product line.
  3. Competitors holding permeable certification won municipal contracts at nearly double the rate of uncertified bidders across comparable metropolitan markets in the same region.
  4. Commercial developers increasingly referenced permeable specifications by name even outside mandatory jurisdictions, signaling real demand beyond regulatory minimums alone across the territory.
RECOMMENDED STRATEGY
Phase 1: Phase one: initiate certification testing for a single flagship permeable product line within the existing primary production facility footprint immediately. Phase 2: Phase two: pursue municipal pilot contracts in two adjacent metropolitan markets to build a certified track record before broader expansion begins. Phase 3: Phase three: expand certified capacity to all three facilities once pilot contracts demonstrate repeatable municipal win rates and sustainable margins.
OUTCOME
The client secured certification within fifteen months and won its first two municipal pilot contracts shortly after qualification, reporting (client-reported, unverified by MMA) a 22 percent increase in commercial segment revenue within the first full year of certified production, meaningfully ahead of its own internal projection for the launch period.

Frequently Asked Questions

Foundational context covering the market sizes, CAGR, scope, country, region and competition that inform every finding below. This section is provided to cover basics and most often pre-purchase conversations, answered from the MMA Primary Research Dataset.

What is the current size of the Paver Blocks Market?

The paver blocks market reached an estimated $24.0 billion in global value in 2025, covering concrete, permeable, and architectural paving units sold into residential, commercial, and municipal construction channels worldwide.

How large will the Paver Blocks Market be by 2036?

MMA projects the market reaching roughly $38.5 billion by 2036, driven primarily by permeable system adoption and continued commercial and municipal infrastructure spending across growing regions.

What is the CAGR for the Paver Blocks Market 2026 to 2036?

The market is forecast to grow at a 4.4 percent compound annual rate between 2026 and 2036, with permeable and certified product lines growing meaningfully faster than the overall average.

Which segment is growing fastest?

Permeable Paving Systems leads at a 6.16 percent CAGR, roughly 1.4 times the overall market rate, driven by municipal stormwater permit mandates expanding across multiple regions.

Who are the major companies in the Paver Blocks Market?

Leading participants include Oldcastle APG, Techo-Bloc Inc, Pavestone LLC, Unilock Limited, and Marshalls plc, together holding an estimated 36 percent combined share on a revenue basis.

Which country is growing fastest?

India leads country-level growth at an estimated 6.4 percent CAGR, supported by rapid urban infrastructure buildout and expanding municipal stormwater management programs nationwide. This pace outstrips most mature Western markets by a wide margin.

Report Segmentation Architecture

The full report scope spans multiple orthogonal segmentation dimensions, with cross-tabulated demand data provided for each dimension pair. Coverage extends further to regional breakdowns, trend trajectories, and the competitive detail needed to support segment-level decision-making.

By Product Type

  • Standard Concrete Pavers
  • Permeable Paving Systems
  • Architectural and Decorative Pavers
  • Commercial Plaza and Walkway Pavers
  • Industrial and Heavy-Duty Pavers
  • Recycled-Aggregate Pavers

By End-Use Industry

  • Residential Construction
  • Commercial and Retail Construction
  • Municipal Infrastructure
  • Industrial and Logistics Facilities
  • Institutional and Public Works

By Commercial Dimension

  • Retail and Home Improvement Channel
  • Direct Installer and Contractor Channel
  • Municipal and Government Procurement
  • Commercial Developer Direct Sales

By Region

  • North America
  • Western Europe
  • East Asia
  • South Asia and Pacific
  • Latin America
  • Middle East and Africa
  • Eastern Europe

Scope, Methodology, and Coverage

Every figure in this report is reproducible from documented input assumptions. The scope below maps the historical period, the forecast horizon, the segmentation dimensions, and the countries covered, alongside the underlying primary and qualitative methodology.
Historical Period
2020 to 2025
Forecast Period
2026 to 2036
Base Year
2025 (USD billions; MMA Primary Research Dataset, October 2026)
Market Definition
This report covers concrete, permeable, and architectural paving units sold for residential, commercial, municipal, and industrial surface applications worldwide. It excludes natural stone paving, asphalt surfacing, and poured concrete flatwork that fall outside the manufactured paver unit category.
Quantitative Units
USD billions, market value; percentage, CAGR and share
Segmentation Dimensions
Product type, end-use industry, commercial dimension, region
Regions Covered
North America, Western Europe, East Asia, South Asia and Pacific, Latin America, Middle East and Africa, Eastern Europe
Countries Covered
25 countries across North America, Europe, Asia Pacific, Latin America, Middle East and Africa
Key Companies Profiled
20 companies including Oldcastle APG, Techo-Bloc Inc, Pavestone LLC, Unilock Limited, and Marshalls plc
Quantitative Methodology
Primary survey, n=3,800 respondents, Q4 2025, six countries; demand-side model with trade association cross-validation
Qualitative Methodology
47 expert interviews, Q4 2025; applied to validate demand model assumptions, identify emerging dynamics, and assess competitive positioning
Report Format
PDF and XLSX data workbook (Word format preview document)
Publisher
Market Minds Advisory
Report Code
MMA-2026-CON-562
Published
October 2026
Contact
sales@marketmindsadvisory.com | www.marketmindsadvisory.com

Purchase the full Paver Blocks Market Report (2026 to 2036).

The full MMA report on the paver blocks market extends this summary with complete country-level sizing, a detailed competitive benchmarking matrix across all 20 profiled companies, and granular segment forecasts through 2036. It includes primary survey data from 3,800 respondents across six countries and 47 expert interviews conducted in the fourth quarter of 2025. The report also maps regional certification capacity in depth, a factor increasingly deciding competitive position across municipal channels. Subscribers additionally receive quarterly updates tracking certification capacity and municipal specification trends as they develop across the forecast period.
Full 7-region sizing and forecast tables
Complete 20-company competitive benchmarking matrix detail
Segment-level margin and growth detail breakdown
Quarterly certification capacity tracking updates included
Downloadable data tables in Excel format
Direct analyst access for custom queries

Built For The People Who Decide

From boardroom strategy to bench-side execution, this report is read cover-to-cover by leaders shaping the next decade of their industry, turning demand scenarios, market dynamics and valuation benchmarks into decisions.
CXOs/ Presidents/ VPs/ Managers
M&A and Corporate Development
Strategy Teams and R&D Heads
Procurement and Product Directors
Regulatory and Compliance Leaders
Investor Relations and Equity Analysts