Market Minds Advisory
Partially Hydrogenated Oil Market

Partially Hydrogenated Oil Market: Partially Hydrogenated Oil Market. Regulatory Phase-Out, Industrial Redeployment and Edible Oil Cost Pressure

Partially hydrogenated oils are disappearing from regulated food markets, yet industrial uses and emerging economies still sustain demand, and refiners now face trans fat limits, edible oil price swings and reformulation pressure from every customer.

Lead Analyst

Published

September 2026

Make Smarter Decisions with Customized Research Insights

Request a free sample report and evaluate market opportunities, growth trends, and competitive dynamics relevant to your business needs.

2025 MARKET VALUE$9.5BMarket Size 2025
2036 FORECAST VALUE$13.7BBase Case , 2026 to 2036
CAGR 2026 TO 20363.4 %Bull 4.7% / Bear 2.1%
INCREMENTAL OPPORTUNITY$3.9BNet 10- year value creation
EXPANSION MULTIPLE1.40x2036 value over 2026 base
Strategic Levers
M&A Pipeline
Regional Outlook
Country Rankings
Competitive Intelligence
Segmental Deep-dive
Call-Us : 91 93563 13602

Executive Snapshot and Market Trajectory.

Partially hydrogenated oils are vegetable oils treated with hydrogen to raise melting point and stability, and they were once the default fat in shortenings, margarines and frying. Regulators in North America and Europe have largely removed them from food. Emerging markets and industrial uses now hold the demand.
Industrial and Oleochemical Grade grows fastest as non-food uses in candles, lubricants, cosmetics and polymer additives replace shrinking food volumes, while food-grade shortening and vanaspati still carry the largest sales. South Asia and Pacific leads because India, Pakistan, Bangladesh and Indonesia still consume large volumes, with East Asia next. Gross margins run 8% to 24%, and edible oil and hydrogenation costs shape profit. Margins stay thin. Buyers reward reliable supply. Regulation keeps shifting demand.
Five groups hold about 36% of value, led by Wilmar International, Cargill and Bunge, so a concentrated field of global refiners competes with regional vanaspati makers and oleochemical producers. Trans fat limits, food labelling rules, the World Health Organization elimination target and customer reformulation programmes govern demand, and buyers check trans fat analysis, grade consistency and delivery reliability before approving suppliers. Customers compare cost per tonne.
Market Definition
The market covers global production and sale of partially hydrogenated edible and technical oils, defined as vegetable oils hydrogenated to an intermediate degree, in food-grade shortening and vanaspati, frying and confectionery fat, industrial and oleochemical grade, animal feed grade and cosmetic and personal care grade forms, sold to food manufacturers, oleochemical producers, feed mills and cosmetics makers and valued at producer sales revenue. It excludes fully hydrogenated oils, interesterified fats, natural tropical fats and unhydrogenated liquid oils.
Base Year Value
$9.5B in 2025 (MMA Primary Research Dataset, September 2026)
Forecast Period
2026 to 2036, eleven discrete annual values
CAGR
3.4% base case. Bull 4.7%. Bear 2.1%.
Fastest Growth Segment
Industrial and Oleochemical Grade: 4.8% CAGR
Fastest Growth Country
India: 5.9% CAGR
Fastest Growth Region
South Asia and Pacific: 5.4% CAGR
Largest Region
South Asia and Pacific: 34% of 2025 global value
Market Leaders
Wilmar International, Cargill, Bunge, AAK, Archer Daniels Midland. Source: MMA Analysis, company annual reports.
Primary Survey
n=3,800 procurement and R&D decision-makers, Q4 2025, six countries
Methodology
Demand-side build-up, cross-validated against public data, 47 expert interviews

Partially Hydrogenated Oil Market Forecast Scenarios

partially-hydrogenated-oil-market-size-forecast-scenario-1790022968306
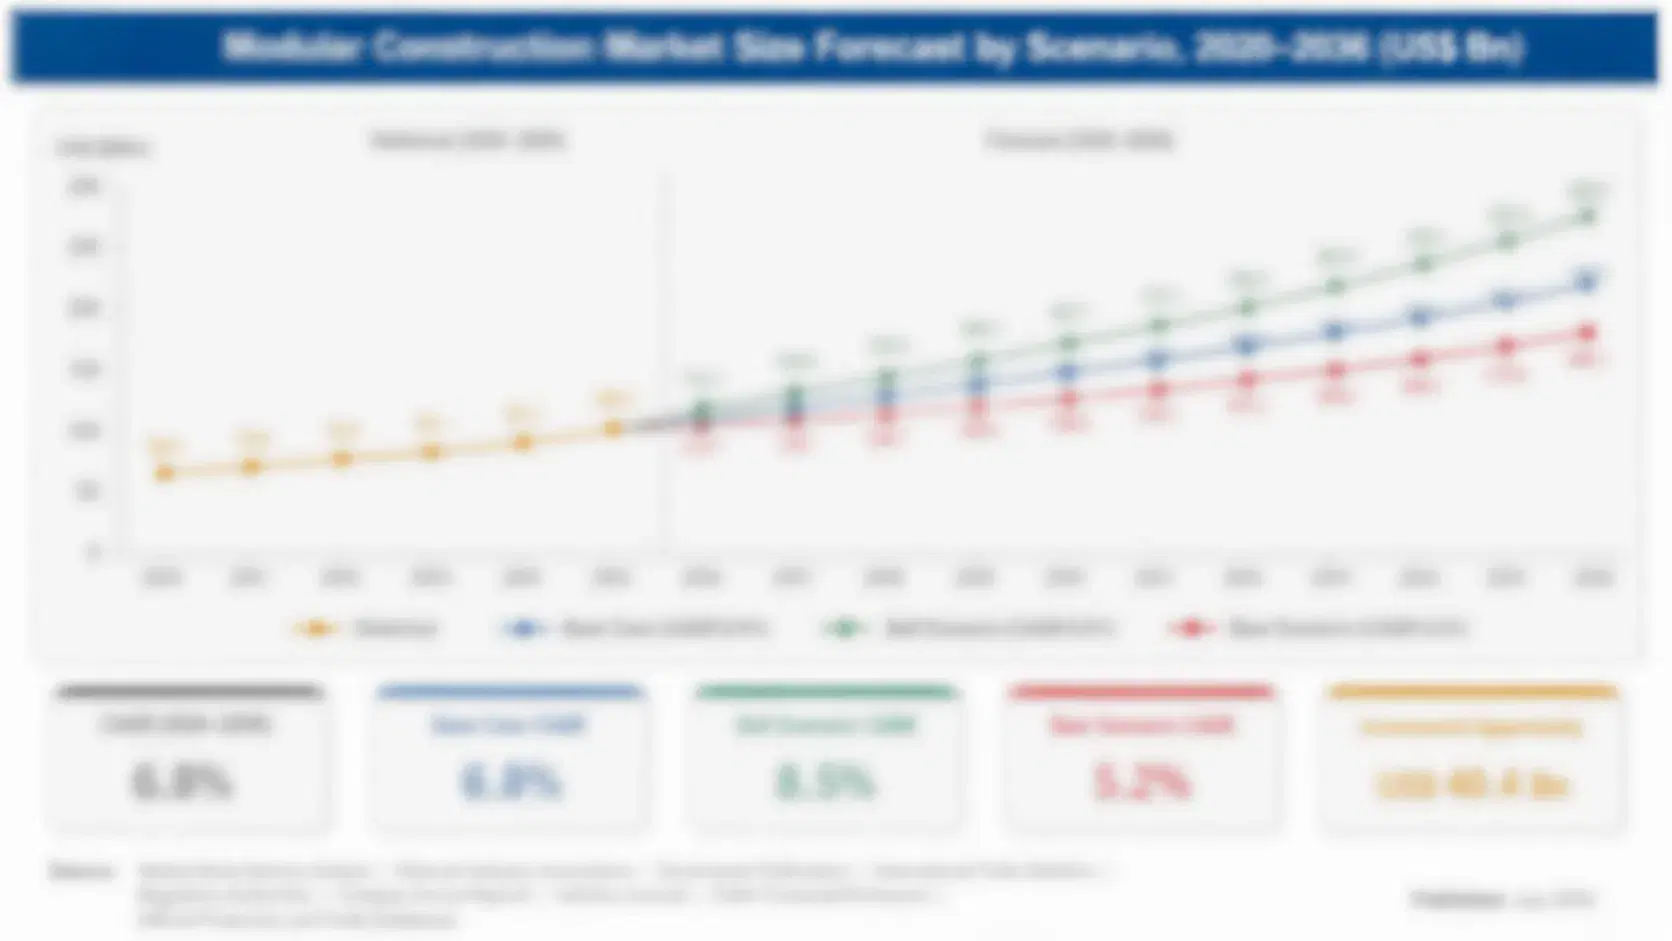
From 2020 to 2025 partially hydrogenated oil sales grew at about 3.4% a year, held up by price inflation rather than volume. Regulated markets cut volumes as the United States and the European Union enforced trans fat limits, while India, Pakistan and Indonesia kept steady demand, and industrial grades expanded. Food-grade volumes fell in developed markets, while prices rose with edible oil costs.
The base case of 3.4% rests on three named mechanisms. Industrial and oleochemical use grows as candles, lubricants, coatings and cosmetics consume more hydrogenated oil. Emerging-market food demand for low-cost, stable fats such as vanaspati continues where regulation lags. Edible oil price inflation lifts value per tonne even when volumes are flat. Each mechanism is visible in trade data, refinery utilisation and regulatory timelines over the last three years. Together they support steady demand.
The bull case reaches 4.7% if regulation stays slow in large emerging markets and industrial demand accelerates. The bear case falls to 2.1% if trans fat limits reach India, Pakistan and Indonesia and food volumes drop faster. Both cases assume stable trade rules and no global ban beyond current elimination plans. Neither case assumes a change in industrial oleochemical demand.

Regulatory Phase-Out, Industrial Demand and Edible Oil Costs Set Hydrogenated Oil Returns

Refiners heat degummed and bleached vegetable oil with hydrogen gas and a nickel catalyst in a pressure vessel, then filter out the catalyst and deodorise the fat. Partial hydrogenation raises the melting point and oxidative stability but creates trans fatty acids, which health authorities link to cardiovascular disease. Iodine value, melting profile and trans content decide grade.
MARKET CONCENTRATION36% CR5Top five groups hold over one third of category value
EU TRANS FAT LIMIT2 g per 100 gRegulatory cap on industrial trans fat in fats and oils
INDUSTRIAL USE SHARE27%Portion of category value sold for non-food industrial uses
BASE OIL COST SHARE74% of COGSRefined soybean and palm oil within total production cost
EMERGING MARKET SHARE58%Portion of value sold in developing economies still permitting use
TYPICAL SHELF LIFE12-18 monthsTypical shelf life of sealed fats with good oxidation stability
Value concentrates in five places. Food-grade shortening and vanaspati carry the largest sales, mainly in South Asia and the Middle East. Frying and confectionery fats serve bakeries and snack makers in markets that still allow them. Industrial and oleochemical grade grows fastest for candles, lubricants, cosmetics and polymer additives, animal feed grade adds a smaller pool, and cosmetic grade serves personal care makers.
Supply combines large edible oil refiners with regional vanaspati makers. Soybean oil comes from the United States, Brazil and Argentina, palm oil from Indonesia and Malaysia, and rapeseed and sunflower oil from Europe and the Black Sea, with hydrogenation plants close to consumers. Regulators, not customers, now decide demand, and qualifying a new industrial supplier takes six to twelve months. Buyers audit plants and lot records every year before renewing approvals.
"Partially hydrogenated oil is the rare food ingredient that regulators have effectively won against. What remains is a two-speed market: shrinking in regulated economies, steady in emerging ones, and quietly growing in industrial uses where nobody eats it."
Senior Analyst, Edible Oils and Specialty Fats Practice · MMA Partially Hydrogenated Oil Practice · September 2026

Market Trends

Industrial and Oleochemical Uses Replace Shrinking Food Volumes

As food use falls in regulated markets, refiners redirect hydrogenated oil to candles, lubricants, coatings, polymer additives, cosmetics and oleochemical intermediates where trans fat rules do not apply. Industrial and Oleochemical Grade grows about 4.8% a year, and gross margins run 14% to 24%. The trend needs technical-grade specifications, separate handling from food lines and industrial customer relationships, and it rewards refiners with oleochemical capability, while industrial demand is cyclical, and prices follow chemical markets. Buyers judge suppliers on consistency, documentation and delivery reliability. Refiners with scale and clear plans hold the strongest positions.
Market Impact: emerging markets hold 58% of value

Reformulation Toward Interesterified, Fractionated and High-Oleic Alternatives Accelerates

Food manufacturers replace partially hydrogenated fats with interesterified fats, fractionated palm, high-oleic oils and blends, following national bans and customer reformulation programmes. Alternatives now supply most shortening and margarine in regulated markets. The trend needs process changes, functionality testing and supply contracts for new fats, and it rewards refiners with flexible plants, while alternatives cost 5% to 20% more, and manufacturers phase change over several years. Refiners with scale and clear plans hold the strongest positions. Early movers set the standard that later entrants must match. Manufacturers reward suppliers that respond quickly to specification changes.
Market Impact: industrial uses take 27% of value

Market Opportunities and Growth Drivers

Low Cost and Stability Keep Hydrogenated Fats in Emerging Markets

In India, Pakistan, Bangladesh and parts of Africa and the Middle East, vanaspati and shortening made with hydrogenated oil remain cheaper and more stable than alternatives, and bakeries and street food vendors rely on them. Emerging markets account for about 58% of category value. The driver rewards refiners with local plants and low-cost supply, and it supports steady volume, while governments are adopting trans fat limits, and health campaigns raise pressure every year. Early movers set the standard that later entrants must match. Manufacturers reward suppliers that respond quickly to specification changes.
Market Impact: EU limit is 2% of fat

Non-Food Industrial Demand Absorbs Hydrogenated Oil Capacity

Candle, lubricant, coating, polymer additive and cosmetic makers use hydrogenated oils and derived stearates because they are stable, low cost and renewable. Industrial uses take about 27% of category value and are growing faster than food. The driver rewards refiners with technical-grade capability and oleochemical partners, and it supports capacity use as food falls, while industrial customers press on price, and competing fully hydrogenated oils serve some uses. Manufacturers reward suppliers that respond quickly to specification changes. Progress should be reviewed every quarter against the agreed targets. Buyers judge suppliers on consistency, documentation and delivery reliability.
Market Impact: edible oil takes 74% of cost

Market Restraints and Challenges

Trans Fat Bans Remove Food Demand in Regulated Markets

The United States revoked the generally recognised as safe status of partially hydrogenated oils in 2015, and the European Union limits industrial trans fat to 2 grams per 100 grams of fat from April 2021, while Canada, Brazil, India and others have followed. The root cause is cardiovascular health evidence. Food-grade volumes have collapsed in these markets, and refiners respond by redirecting capacity to industrial grades and alternative fats. Progress should be reviewed every quarter against the agreed targets. Smaller refiners carry the heaviest exposure and have the least room to adjust.
Market Impact: industrial grade grows 4.8% yearly

Edible Oil Price Swings and Reformulation Costs Squeeze Refiner Margins

Soybean and palm oil make up about 74% of production cost, and prices spiked in 2022 after the war in Ukraine and Indonesia's temporary palm oil export ban. The root cause is weather, trade policy and geopolitics. Buyers resist price rises, so refiners lose two to four margin points until contracts reset, while reformulation programmes shift volume to alternatives. Refiners respond with hedging, index-linked contracts and product mix change. Smaller refiners carry the heaviest exposure and have the least room to adjust. Buyers judge suppliers on consistency, documentation and delivery reliability.
Market Impact: alternatives cost 5-20% more
3 additional market trends, 2 additional growth drivers, and 4 additional restraints and challenges are covered in the full report. Contact sales@marketmindsadvisory.com to access the complete intelligence.

Segment CAGR and Growth Architecture

The partially hydrogenated oil market is segmented by product grade, which shows where regulation, specification and buyer needs differ. Five segments cover food-grade shortening and vanaspati, frying and confectionery fats, industrial and oleochemical grade, animal feed grade and cosmetic and personal care grade. Industrial and oleochemical grade grows fastest, while food-grade shortening and vanaspati carry the largest sales.
partially-hydrogenated-oil-market-market-share-analysis-1790022968563

Industrial and Oleochemical Grade

Industrial and Oleochemical Grade is the fastest-growing segment at 4.8% a year, about 1.40 times the overall market rate. Candle, lubricant, coating, polymer additive and stearate makers buy hydrogenated oil where trans fat rules do not apply, and volume shifts from food lines to technical lines as regulation spreads. Gross margins of 14% to 24% reward refiners with technical-grade capability and oleochemical ties. Growth depends on industrial cycles, feedstock cost and customer specifications, while competing fully hydrogenated oils squeeze price. Refiners with oleochemical partners hold the strongest positions. Early movers set the standard that later entrants must match. Manufacturers reward suppliers that respond quickly to specification changes. Progress should be reviewed every quarter against the agreed targets.
CAGR 4.8%

Animal Feed Grade Fat Supplements

Animal Feed Grade Fat Supplements grows at 4.1% a year, about 1.20 times the overall market rate, because feed mills use hydrogenated fats and fat blends as energy sources in poultry, swine and dairy diets where energy density supports growth, and regulation of trans fat in feed is limited. Refiners use stable, low-cost blends to differentiate. Gross margins of 8% to 16% support high-volume producers. Growth depends on feed demand, fat prices and feed safety rules, and refiners with dependable delivery and consistent iodine value hold the strongest positions with feed mills. Manufacturers reward suppliers that respond quickly to specification changes. Progress should be reviewed every quarter against the agreed targets.
CAGR 4.1%
Full segment breakdown across 5 segments available in the complete report.

Regional Architecture and Country Demand Map

South Asia and Pacific leads at 34% because India, Pakistan, Bangladesh and Indonesia still consume large volumes of vanaspati and shortening, while East Asia holds 22% through industrial and food use. Middle East and Africa holds 14% and Latin America 12%. North America holds 8%.

North America

North America holds 8% share, below its band, which is justified because the United States and Canada banned partially hydrogenated oils in food, so remaining volume is limited to technical, industrial and export grades. Growth runs at 2.5%, below the global rate. Cargill, ADM and Bunge redirect capacity to interesterified fats and industrial products, and demand in candles, lubricants and cosmetics supports some volume, while trace levels in imported foods are checked under FDA rules. Importers also review lot records and trans fat analysis before every annual contract renewal. Volumes stay large, and suppliers compete mainly on price, specification consistency and delivery reliability. Traders handle most shipments and set order sizes.
Share: 8% | CAGR: 2.5% (2026 to 2036)

Western Europe

Western Europe holds 5% share, below its band, which is justified because the European Union caps industrial trans fat at 2 grams per 100 grams of fat, so food use has largely ended and remaining volume serves industrial and technical grades. Growth of 1.8% trails the global rate. Because South Asia and Pacific and East Asia take the top two slots, Western Europe acts as a technology and oleochemical centre. AAK, Vandemoortele and Oleon hold strong positions. Importers also review lot records and trans fat analysis before every annual contract renewal. Volumes stay large, and suppliers compete mainly on price, specification consistency and delivery reliability. Traders handle most shipments and set order sizes.
Share: 5% | CAGR: 1.8% (2026 to 2036)
Regional intelligence for 5 additional markets available in the complete report: East Asia, South Asia and Pacific, Latin America, Middle East and Africa, Eastern Europe. Contact sales@marketmindsadvisory.com.
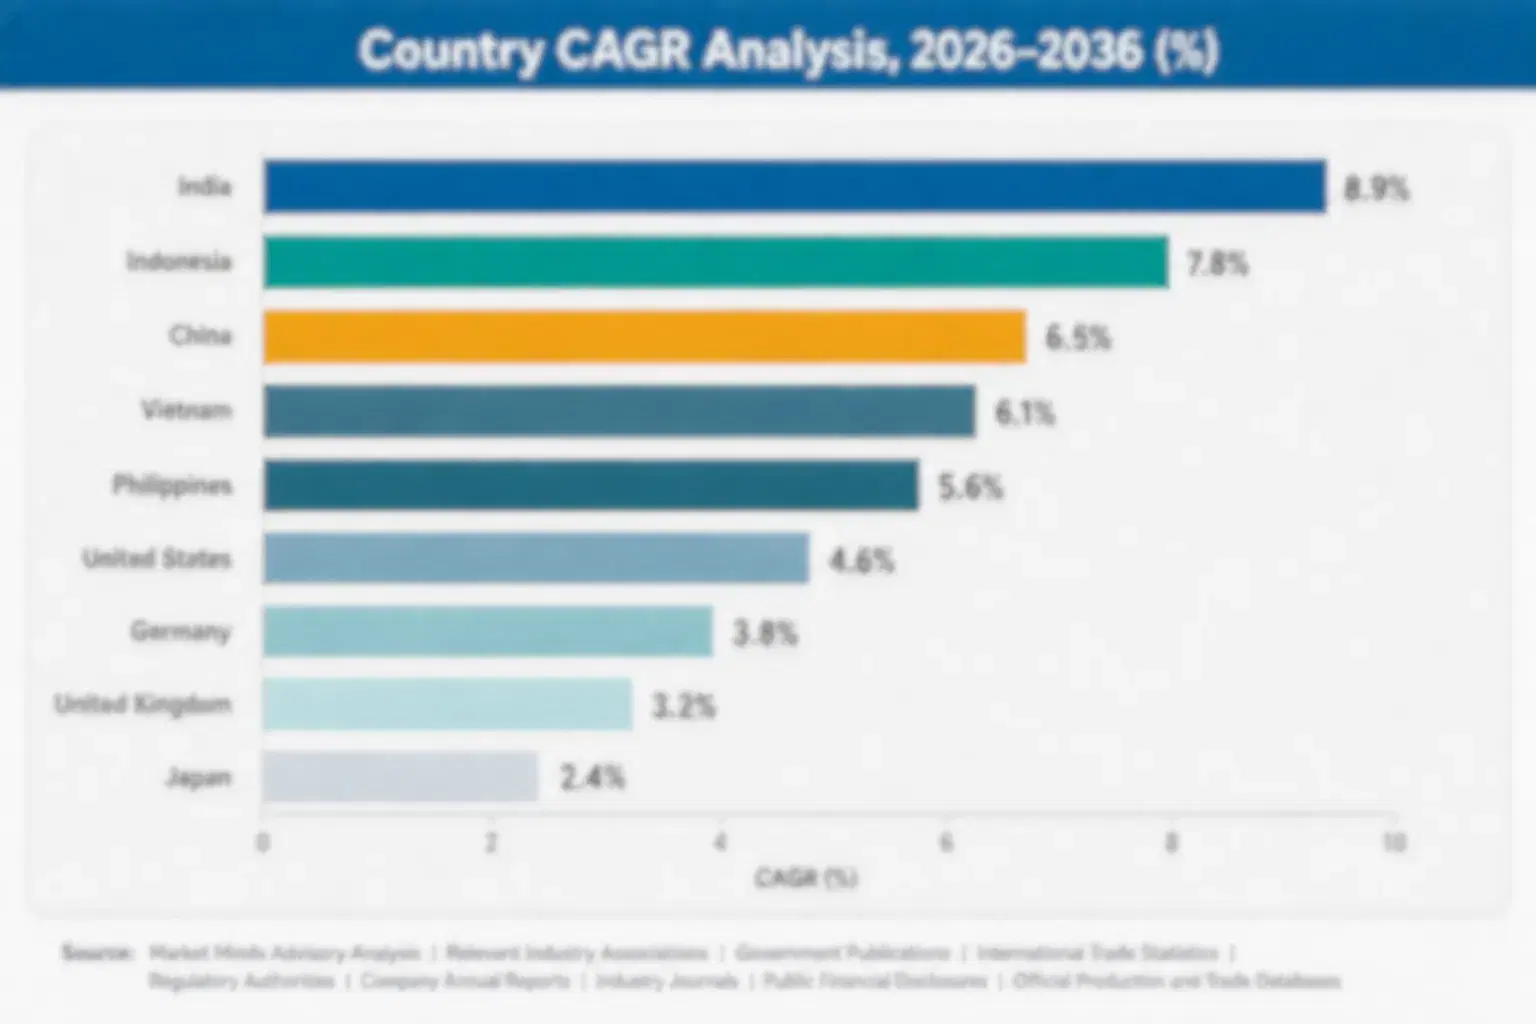
partially-hydrogenated-oil-market-country-cagr-analysis-1790022968830

Four Margin Routes for Hydrogenated Oil Refiners

Margin in partially hydrogenated oils comes from industrial redeployment, alternative fat capability, cost protection and compliance discipline rather than volume alone. The routes below apply to global refiners, regional vanaspati makers and oleochemical producers, and each can start inside one planning cycle, with measures in gross margin points and cost per tonne. Payback runs two to five years.

Redirecting Capacity to Industrial and Oleochemical Customers

As food volumes fall, refiners that qualify technical grades for candle, lubricant, coating and cosmetic customers keep hydrogenation plants full and win contracts worth 10% to 18% of plant output at gross margins of 14% to 24%. Programmes cost $0.5 million to $4 million per plant. Refiners should separate food and technical lines, meet industrial specifications and build oleochemical partnerships, since cross-contamination risks food licences, and industrial buyers reward dependable supply and consistent iodine value. Results should be reviewed every quarter against the agreed targets. Management should assign one owner to each programme from the start.
Market Impact: industrial grades win contracts worth 10-18% of plant output

Building Interesterified and High-Oleic Alternative Fat Capability

Customers in regulated markets need trans-free fats, so refiners that add interesterification and fractionation and offer high-oleic blends win reformulation contracts worth 12% to 20% of food volume at margins of 10% to 20%. Investments cost $5 million to $25 million per plant. Refiners should test functionality with bakers and snack makers, secure alternative oil supply and share analysis, since customers switch quickly, and early movers keep accounts while slower rivals lose them. Management should assign one owner to each programme from the start. Early results also help persuade sceptical buyers. Costs are recovered faster in larger plants.
Market Impact: alternative fats win reformulation contracts worth 12-20% of volume

Locking In Soybean and Palm Oil Contracts to Protect Margins

Base oil makes up about 74% of production cost and prices swing with weather and trade policy, so refiners that sign multi-season contracts and qualify several origins cut margin volatility by 25% to 40%. Programmes cost $0.5 million to $4 million in working capital. Refiners should hold stock, review terms yearly and pass through index changes with a lag of one to two quarters, since spikes otherwise compress margins. Finance teams should track landed cost weekly. Early results also help persuade sceptical buyers. Costs are recovered faster in larger plants.
Market Impact: multi-origin contracts cut margin volatility by 25-40% across crop years

Investing in Trans Fat Analysis and Regulatory Compliance Systems

Trans fat limits differ by country and enforcement is rising, so refiners that test every lot, publish analysis and track rule changes protect export access worth 10% to 16% of sales and avoid penalties. Programmes cost $0.3 million to $2 million per plant. Refiners should train staff, use accredited laboratories and invite customer audits, since one non-compliant shipment can end relationships, and buyers increasingly ask for lot-level trans fat records. Costs are recovered faster in larger plants. Results should be reviewed every quarter against the agreed targets. Management should assign one owner to each programme from the start.
Market Impact: compliance systems protect export access worth 10-16% of sales

Who Controls the Margin Pool

The partially hydrogenated oil market is moderately concentrated, with a CR5 of 36%, because a few global edible oil groups hold refining scale, feedstock access and customer relationships while regional vanaspati makers and oleochemical producers serve local buyers. This assessment measures participants on estimated hydrogenated oil and technical fat sales value, held constant across all players. Wilmar International and Cargill lead through refining scale and origination, Bunge, AAK and Archer Daniels Midland follow, and the gap between the leader and the fifth player is moderate.
Competition runs on four dimensions today: feedstock access and cost, ability to supply trans-free alternatives, industrial and oleochemical reach, and regulatory compliance records. Global groups win on scale and origination, specialty fat makers win on functional alternatives, and regional refiners win on local price and distribution. Buyers compare iodine value consistency, trans fat analysis and delivery reliability.

Emerging pressure comes from tighter trans fat rules in India and other large markets, from oleochemical producers expanding technical grades and from customer reformulation programmes. Rankings shift where a refiner wins alternative fat contracts, secures oil at stable prices or redeploys capacity to industrial grades, and consolidation continues as small refiners face shrinking food demand.
partially-hydrogenated-oil-market-company-positioning-matrix-1790022969092

Competitive Moat and Risk Dimensions

WILMAR INTERNATIONAL

Moat: Integrated Refining and Origination

Wilmar International is a Singapore-based agribusiness that grows, refines and distributes palm, soybean and other edible oils and oleochemicals across Asia, Africa, Europe and the Americas through large refineries and hydrogenation plants. Its integrated supply chain, refining scale and oleochemical business give it strong cost advantage, and its size supports redirection of capacity from food to industrial and specialty fats.
WILMAR INTERNATIONAL

Risk: Regulation and Sustainability Exposure

Wilmar International faces shrinking food demand for partially hydrogenated products as trans fat rules spread, and sustainability scrutiny over palm oil adds compliance cost. Edible oil price swings squeeze profit, and regional rivals compete on price. Investors expect steady returns. Rivals watch every move. Management attention remains the scarcest resource.
CARGILL

Moat: Global Oilseed and Fat Solutions

Cargill is a global agribusiness whose oilseed crushing, refining and specialty fats units supply shortenings, margarines, frying fats and technical fats to food manufacturers and industrial customers worldwide. Its origination scale, application labs and customer relationships give it strong access to reformulation contracts, and its size supports investment in interesterified and high-oleic alternatives.
CARGILL

Risk: Legacy Product Decline

Cargill faces declining demand for legacy hydrogenated products as customers reformulate, so plants must be converted or redeployed. Soybean and palm oil price swings squeeze margins, deforestation scrutiny adds cost, and regional refiners undercut price in emerging markets. Investors expect steady returns. Rivals watch every move.

Players Tracked

Prominent Players

Wilmar International
Cargill
Bunge
AAK
Archer Daniels Midland

Other Key Players

Fuji Oil
Musim Mas
SD Guthrie
Kuala Lumpur Kepong
AWL Agri Business
Patanjali Foods
Emami Agrotech
Nisshin OilliO
J-Oil Mills
COFCO
Golden Agri-Resources
Oleon
Vandemoortele
Savola Group
Mewah International

Recent Developments

JANUARY 2026

Global Edible Oil Refiner Converts Hydrogenation Line to Technical Fat Production for Oleochemical Customers

A global edible oil refiner converted a hydrogenation line to technical fat production for oleochemical customers, according to company communications. It is an organic capacity conversion, not an acquisition, and it tests redeployment strategy. The line serves industrial buyers. Investment terms were not disclosed. Rollout follows plant reviews.
Signal: Confirms refiners are redirecting capacity to industrial grades because food demand for hydrogenated fats keeps falling.
FEBRUARY 2026

Indian Food Safety Regulator Reinforces Trans Fat Limit Inspections for Vanaspati and Bakery Fats

An Indian food safety regulator reinforced trans fat limit inspections for vanaspati and bakery fats, according to public announcements. It is a regulatory action, not a commercial deal, and it tests compliance readiness. The inspections cover refiners and bakers. Timing of penalties remains open. Rollout follows plant reviews.
Signal: Indicates enforcement is tightening in the largest emerging market because health policy now targets industrial trans fat.
MARCH 2026

Specialty Fat Maker Opens Interesterification Plant to Supply Trans-Free Shortening in Southeast Asia

A specialty fat maker opened an interesterification plant to supply trans-free shortening in Southeast Asia, according to company communications. It is an organic capacity expansion, not an acquisition, and it tests reformulation demand. The plant adds fractionation capacity. Investment terms were not disclosed. Rollout follows plant reviews.
Signal: Shows suppliers are building alternative fat capacity because emerging market bans are approaching and customers want trans-free options.

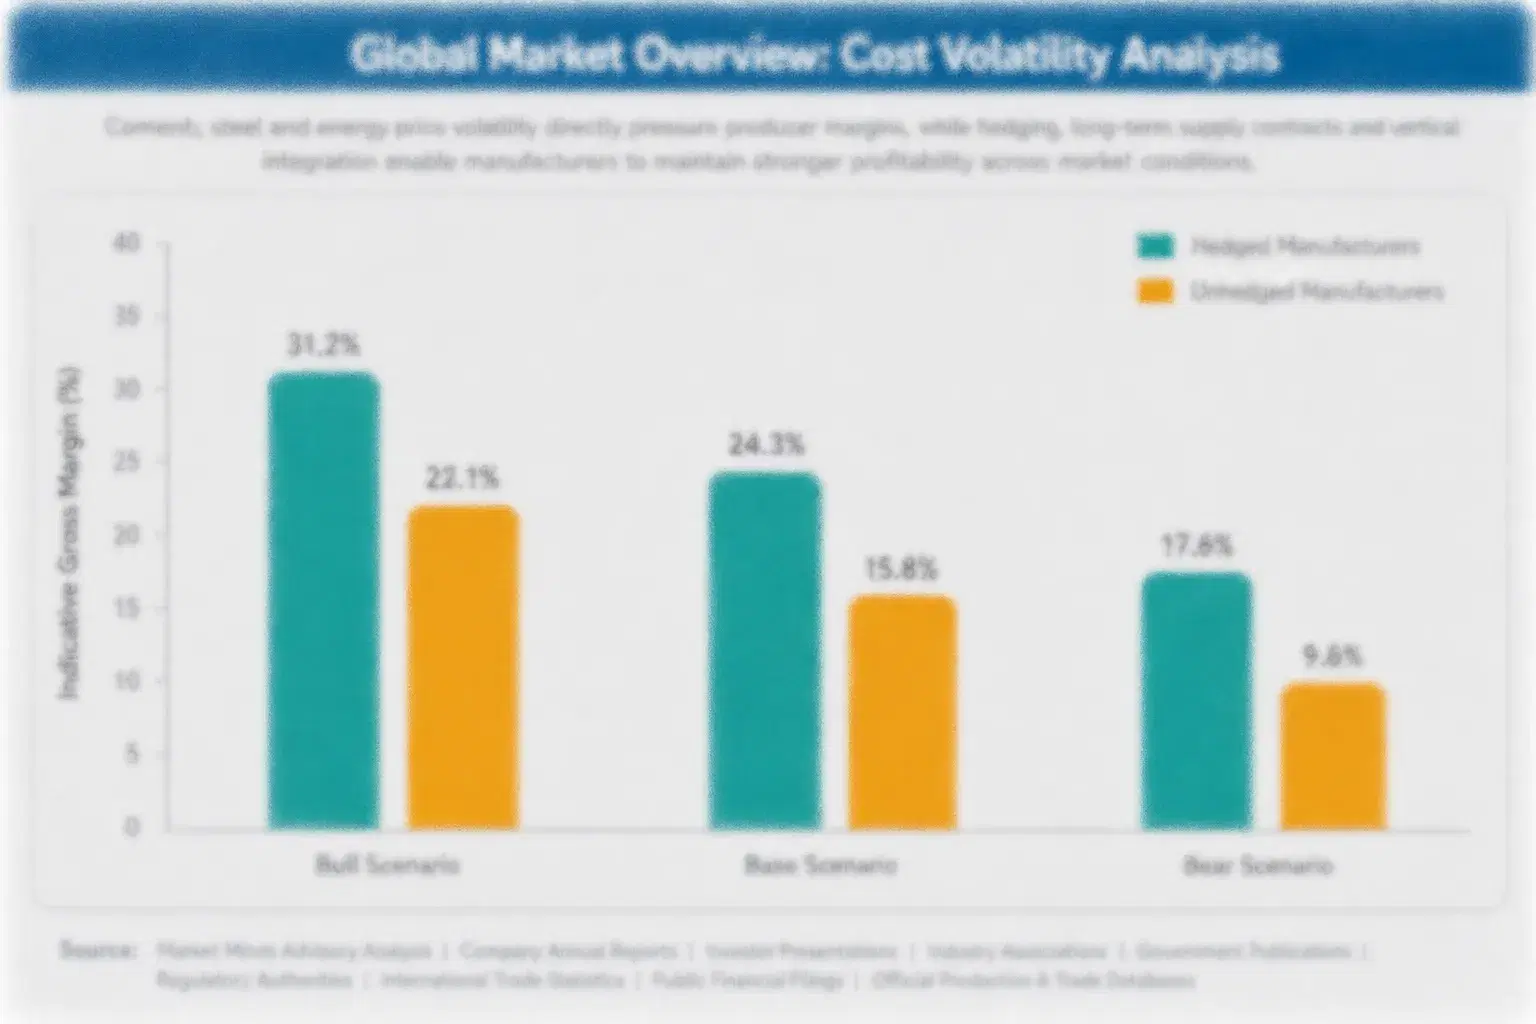
Edible Oil, Hydrogen and Energy Exposure

Refined soybean, palm and other base oils account for roughly 74% of production cost, hydrogen and nickel catalyst about 4%, energy for heating and deodorising about 8%, packaging about 4%, labour and maintenance about 5%, and compliance and overheads about 5%. Soybean oil comes from the United States, Brazil and Argentina, palm oil from Indonesia and Malaysia, and rapeseed and sunflower oil from Europe and the Black Sea.
The clearest recent shock came in 2022. USDA data show vegetable oil prices spiking after the war in Ukraine cut sunflower oil exports, while Malaysian Palm Oil Board data showed palm oil prices surging after Indonesia briefly banned exports in April 2022, and IEA data showed higher energy costs. Refiners absorbed part of the increase, delayed shipments and raised prices, which compressed margins. Some relief came in 2024 and 2025.

The disadvantage falls on small and mid-sized refiners without origination scale, industrial customers or alternative fat capability, because they buy oil at spot prices and face shrinking food demand. Exposure varies by player type: global groups hold origination and hedges, specialty fat makers charge premiums for alternatives, and regional refiners depend on price-sensitive markets and local regulation.
partially-hydrogenated-oil-market-cost-volatility-analysis-1790022969373

Multi-Season Oil Contracts and Hedging

Refiners sign multi-season contracts with crushers and palm producers and use futures hedging to cut cost swings of 15% to 30% between crop years. The main challenge is basis risk and counterparty risk, so refiners split volumes across several origins and review terms each year. Procurement teams monitor positions each quarter against budgets. Buyers sign off first.

Product Mix Shift Toward Industrial and Alternative Fats

Refiners shift plant time toward industrial grades and trans-free alternatives that carry steadier demand and better margins, lifting utilisation by 10 to 20 points. The main challenge is capital of $5 million to $25 million per plant, so refiners stage investment and prioritise the busiest sites. Results are reviewed each year. Managers approve spending.

Index-Linked Pricing With Industrial Buyers

Refiners negotiate price formulas with oleochemical and feed buyers that link prices to base oil and hydrogen indices, recovering 40% to 60% of cost increases. The main challenge is buyer resistance and competing fully hydrogenated oils, so refiners test changes with long-standing customers first. Renewals follow published indices every half year. Managers approve each step.

Portfolio Architecture for Margin Defence

Margins run from thin returns on commodity vanaspati and shortening sold in price-sensitive markets to moderate returns on industrial and oleochemical grades and better returns on trans-free alternatives sold with technical support. Three tiers separate volume products, premium certified lines and next-generation solutions, and each draws on different feedstock access, regulatory credentials and buyer relationships in a moderately concentrated market. Margin gaps between tiers run to 16 points.
The tension between volume and premium is sharp. Commodity vanaspati and shortening fill emerging market demand at low prices and face oil cost swings and tightening rules, while industrial grades and alternative fats earn higher margins on smaller volumes and depend on technical specifications, plant flexibility and buyer trust. Refiners that run only legacy volume suffer when regulation arrives, while premium-only refiners struggle to reach scale beyond specialised customers.

High-value pools concentrate in industrial and oleochemical grade and in cosmetic and personal care grade for candle, lubricant and cosmetic makers. They gather where buyers pay for consistent specification and dependable supply, not for volume alone. Animal feed grade adds a solid volume pool, and strong refiners hold more than one, though each needs different plant configuration and customer relationships to serve well.

Volume / Commodity-Adjacent

Food-grade vanaspati, shortening and frying fats sold in bulk to bakeries, sweet makers and street food vendors on price per tonne in markets that still permit them. Buyers focus on cost and stability, contracts follow monthly reviews, and technical differentiation is limited.
Gross Margin: 8%-14%

Premium / Certified

Industrial, cosmetic and confectionery grades with defined iodine value, melting profile and analysed trans content sold to candle, lubricant, cosmetics and specialty food customers. Buyers value specification consistency and documentation, and approvals run for years with regular audits of plant records.
Gross Margin: 12%-20%

Sustainability / Regulatory / Next-Generation

Trans-free interesterified and fractionated alternatives, and technical fats with certified sustainable oil supply, sold to manufacturers meeting national trans fat limits. Contracts depend on functionality, regulatory compliance and consistent delivery performance across reformulation projects and channels.
Gross Margin: 14%-24%
partially-hydrogenated-oil-market-portfolio-architecture-1790022969652

High-value Sub-segments and Strategic Watch-out

Industrial and Oleochemical Grade

Industrial and oleochemical grade combines the fastest growth with the best pricing in the category, since technical buyers accept gross margins of 14% to 24% for consistent specification. Technical capability, separate handling and oleochemical partnerships form the entry barrier, and refiners with industrial customer ties lead.
Gross Margin: 14%-24%

Animal Feed Grade Fat Supplements

Animal feed grade fat supplements deliver solid growth with thin pricing, since feed mills support gross margins of 8% to 16% for energy density and low cost. Feed safety rules and delivery reliability limit competition, though oil cost adds pressure. Reviews occur each season. Buyers renew contracts each year.
Gross Margin: 8%-16%

Food-Grade Shortening and Vanaspati

Food-grade shortening and vanaspati are the volume core, with value growing about 2.4% a year. Oil cost and regulation decide profit, and regional refiners in South Asia and the Middle East hold most sales. Buyers renew monthly at prices linked to oil indices across bakery and household channels.
Gross Margin: 8%-14%

Frying and Confectionery Fats

Frying and confectionery fats are the strategic watch-out, since growth of about 2.8% a year trails the leaders, regulation removes demand in developed markets and customers reformulate to alternatives. Refiners should manage capacity selectively, avoid heavy capital and steer investment toward industrial and trans-free lines with clearer buyers and margins.
Gross Margin: 10%-18%

Why Buyers Still Order Hydrogenated Oil

Hydrogenated oil demand behaves like an annuity in markets where rules allow it. Once a baker, sweet maker or industrial customer approves a grade, orders repeat every month, and switching means retesting melting behaviour, shelf life and cost. Approved supplier lists follow trials and audits, so refiners with stable iodine values and clean records earn recurring contracts. Regulation, not preference, ends the annuity. Specifications protect supply.
Adoption stickiness differs by end-use vertical. Industrial and oleochemical customers are the deepest, since hydrogenated grades are written into specifications and no health rule applies. Traditional bakeries and sweet makers in emerging markets are moderately sticky, driven by price and habit. Multinational food manufacturers are fluid, and have already replaced hydrogenated fats under reformulation programmes, though some regional lines remain.

Buyer profiles are shifting between generations. Older buyers chose hydrogenated fats for price and stability, while younger technical managers ask about trans fat content, sustainable oil sourcing and clean labels, and follow national elimination plans. Public health teams add a third group that shapes purchasing through rules and campaigns. Refiners that publish clear analysis and sourcing information keep the customers that remain.
partially-hydrogenated-oil-market-end-use-penetration-index-1790022969918

MMA Verdict: Hydrogenated Oil Strategy

These are among the four positions where our research anticipates prominent divergence between winners and laggards over the coming forecast period. Each is grounded in the demand model, the regulatory perimeter, and the announced capacity pipeline.
01 / INDUSTRIAL REDEPLOYMENT STRATEGY

Redirect Capacity to Industrial and Oleochemical Customers Before Food Volumes Fall Further

As food volumes fall, technical grades for candle, lubricant, coating and cosmetic customers keep hydrogenation plants full and win contracts worth 10% to 18% of plant output at gross margins of 14% to 24%. Refiners should invest $0.5 million to $4 million per plant, separate food and technical lines and build oleochemical partnerships. Those that delay will carry idle capacity over the next two years, while early movers hold stronger utilisation, industrial relationships and better margins across every plant review and annual negotiation.
02 / ALTERNATIVE FAT CAPABILITY

Build Interesterified and High-Oleic Capability Before Customers Complete Reformulation Programmes

Customers in regulated markets need trans-free fats, and interesterification, fractionation and high-oleic blends win reformulation contracts worth 12% to 20% of food volume at margins of 10% to 20%. Refiners should invest $5 million to $25 million per plant, test functionality with bakers and secure alternative oil supply. Those that delay will lose accounts over the next two years, while early movers hold customer relationships, stronger margins and lasting presence across every reformulation project, buyer review and annual negotiation with bakers and snack makers.
03 / BASE OIL COST PROTECTION

Lock In Soybean and Palm Oil Contracts Before Price Swings Erase Margins

Base oil makes up about 74% of production cost, and multi-season contracts with several origins cut margin volatility by 25% to 40%. Refiners should invest $0.5 million to $4 million in working capital, hold stock and review terms yearly. Those that delay will absorb spikes over the next two years, while early movers hold protected margins, steady supply and stronger negotiating positions across every crop cycle, price revision and annual budget review for management, lenders and key customers across markets.
04 / TRANS FAT COMPLIANCE DISCIPLINE

Invest in Trans Fat Testing and Compliance Before Enforcement Reaches Emerging Markets

Trans fat limits differ by country and enforcement is rising, and lot-level testing, published analysis and rule tracking protect export access worth 10% to 16% of sales. Refiners should invest $0.3 million to $2 million per plant, train staff and invite customer audits early. Those that delay will risk penalties over the next two years, while early movers hold stronger customer trust, steady access to regulated markets and better margins across every audit cycle, rule change and annual supplier review with importers and industrial buyers.

Engagement Snapshot From the Field

A live engagement with an industry participant carrying material or product regulatory and market exposure ahead of a defining policy shift, showing how our research translates into a defensible multi-year portfolio strategy.
MARKET MINDS ADVISORY · CLIENT ENGAGEMENT SUMMARY
Partially Hydrogenated Oil Producer Strategic Portfolio Review and Transition Roadmap 2026·Investment Scenario on Partially Hydrogenated Oil Exposure Evaluation 2025-26
CLIENT PROFILE
The client is a mid-sized South Asian edible oil refiner with annual sales near $340 million (client-reported, unverified by MMA), producing vanaspati, shortening and refined oils for household, bakery and sweet-maker customers from three refineries. About 46% of sales came from partially hydrogenated products, trans fat rules were tightening, and management wanted a plan to redeploy capacity and build alternative fats.
STRATEGIC CHALLENGE
Hydrogenated product margins sat near 9% (client-reported, unverified by MMA), base oil costs had risen about 26% over two years and two large bakery customers had asked for trans-free alternatives. Management had to decide whether to build interesterification, redirect capacity to industrial grades or upgrade compliance systems, with limited capital and three plants. Key customers wanted samples within nine months.
MMA APPROACH
MMA analysed sales, cost and utilisation data across 30 products, interviewed 14 bakery buyers, oleochemical customers and regulators, and ran a buyer survey on alternatives, compliance and price across four countries. It modelled margin by product and customer, compared interesterification, industrial redeployment and compliance options by payback and execution risk, and tested each against oil price and regulation timing scenarios.
KEY FINDINGS
  1. An interesterification line would win reformulation contracts worth about 14% of revenue at gross margins above 16% within three years (client-reported, unverified by MMA).
  2. Industrial redeployment would keep about 12% of hydrogenation capacity full at gross margins near 15% across two years of operation (client-reported, unverified by MMA).
  3. Multi-season oil contracts would cut margin volatility by about 25% across three years and every product line sold (client-reported, unverified by MMA).
  4. Trans fat analysis and compliance systems would protect approvals with two large customers worth about 17% of sales across two years (client-reported, unverified by MMA).
CLIENT PROFILE
The client is a mid-sized South Asian edible oil refiner with annual sales near $340 million (client-reported, unverified by MMA), producing vanaspati, shortening and refined oils for household, bakery and sweet-maker customers from three refineries. About 46% of sales came from partially hydrogenated products, trans fat rules were tightening, and management wanted a plan to redeploy capacity and build alternative fats.
STRATEGIC CHALLENGE
Hydrogenated product margins sat near 9% (client-reported, unverified by MMA), base oil costs had risen about 26% over two years and two large bakery customers had asked for trans-free alternatives. Management had to decide whether to build interesterification, redirect capacity to industrial grades or upgrade compliance systems, with limited capital and three plants. Key customers wanted samples within nine months.
MMA APPROACH
MMA analysed sales, cost and utilisation data across 30 products, interviewed 14 bakery buyers, oleochemical customers and regulators, and ran a buyer survey on alternatives, compliance and price across four countries. It modelled margin by product and customer, compared interesterification, industrial redeployment and compliance options by payback and execution risk, and tested each against oil price and regulation timing scenarios.
KEY FINDINGS
  1. An interesterification line would win reformulation contracts worth about 14% of revenue at gross margins above 16% within three years (client-reported, unverified by MMA).
  2. Industrial redeployment would keep about 12% of hydrogenation capacity full at gross margins near 15% across two years of operation (client-reported, unverified by MMA).
  3. Multi-season oil contracts would cut margin volatility by about 25% across three years and every product line sold (client-reported, unverified by MMA).
  4. Trans fat analysis and compliance systems would protect approvals with two large customers worth about 17% of sales across two years (client-reported, unverified by MMA).
RECOMMENDED STRATEGY
Phase 1: Phase 1 (Months 1-9): Install trans fat analysis, sign multi-season oil contracts and pilot trans-free shortening with two bakery customers. Phase 2: Phase 2 (Months 10-24): Build the interesterification line, redirect idle hydrogenation capacity to industrial grades and retire the weakest low-margin vanaspati contracts. Phase 3: Phase 3 (Months 25-42): Extend alternative fats across the range, review contracts yearly and decide on further capacity using margin data.
OUTCOME
Within 42 months, alternative and industrial products reached 41% of sales, blended margins rose by about five points and utilisation improved by about 14 points (client-reported, unverified by MMA). Both bakery customers approved the alternatives, oil cost volatility fell, and industrial customers widened the buyer base.

Frequently Asked Questions

Foundational context covering the market sizes, CAGR, scope, country, region and competition that inform every finding below. This section is provided to cover basics and most often pre-purchase conversations, answered from the MMA Primary Research Dataset.

What is the current size of the Partially Hydrogenated Oil Market?

The global partially hydrogenated oil market was valued at $9.5 billion in 2025 on a producer sales revenue basis. Growth comes from industrial uses and emerging markets, and faces trans fat rules and base oil price swings.

How large will the Partially Hydrogenated Oil Market be by 2036?

The market is projected to reach $13.72 billion by 2036, up from $9.82 billion in 2026. The increase of $3.90 billion reflects industrial grades and steady emerging market demand.

What is the CAGR for the Partially Hydrogenated Oil Market 2026 to 2036?

The market is forecast to grow at a 3.4% CAGR from 2026 to 2036. The bull case reaches 4.7% and the bear case 2.1%, depending on trans fat rule timing, industrial demand and edible oil price paths.

Which segment is growing fastest?

Industrial and Oleochemical Grade is the fastest-growing segment at 4.8% CAGR, roughly 1.40 times the overall market rate. Animal Feed Grade Fat Supplements follows at 4.1% CAGR, led by poultry and dairy feed.

Who are the major companies in the Partially Hydrogenated Oil Market?

Major companies include Wilmar International, Cargill, Bunge, AAK and Archer Daniels Midland. AWL Agri Business, Patanjali Foods, Fuji Oil, Musim Mas and Savola Group also hold meaningful positions in specific regions.

Which country is growing fastest?

India is growing fastest at about 5.9% CAGR, because vanaspati demand, industrial uses and oleochemical capacity expand even as regulation tightens. Indonesia and Pakistan follow through steady food and technical demand.

Report Segmentation Architecture

The full report scope spans multiple orthogonal segmentation dimensions, with cross-tabulated demand data provided for each dimension pair. Coverage extends further to regional breakdowns, trend trajectories, and the competitive detail needed to support segment-level decision-making.

By Primary Market Dimension

  • Food-Grade Shortening and Vanaspati
  • Frying and Confectionery Fats
  • Industrial and Oleochemical Grade
  • Animal Feed Grade Fat Supplements
  • Cosmetic and Personal Care Grade

By End-Use Industry

  • Bakery and Confectionery
  • Household and Foodservice Cooking
  • Oleochemicals and Industrial Products
  • Animal Feed

By Commercial Dimension

  • Direct Sales to Manufacturers
  • Distributor and Trader Sales
  • Retail Packed Sales
  • Bulk Tanker Supply
  • Contract Refining

By Region

  • North America
  • Western Europe
  • East Asia
  • South Asia and Pacific
  • Latin America
  • Middle East and Africa
  • Eastern Europe

Scope, Methodology, and Coverage

Every figure in this report is reproducible from documented input assumptions. The scope below maps the historical period, the forecast horizon, the segmentation dimensions, and the countries covered, alongside the underlying primary and qualitative methodology.
Historical Period
2020 to 2025
Forecast Period
2026 to 2036
Base Year
2025 (USD billions; MMA Primary Research Dataset, September 2026)
Market Definition
The market covers global production and sale of partially hydrogenated edible and technical oils, defined as vegetable oils hydrogenated to an intermediate degree, in food-grade shortening and vanaspati, frying and confectionery fat, industrial and oleochemical grade, animal feed grade and cosmetic and personal care grade forms, sold to food manufacturers, oleochemical producers, feed mills and cosmetics makers and valued at producer sales revenue. It excludes fully hydrogenated oils, interesterified fats, natural tropical fats and unhydrogenated liquid oils.
Quantitative Units
USD billions (producer sales revenue); thousand tonnes for volume references
Segmentation Dimensions
By Product Grade; By End-Use Industry; By Commercial Dimension; By Region
Regions Covered
North America, Western Europe, East Asia, South Asia and Pacific, Latin America, Middle East and Africa, Eastern Europe
Countries Covered
India, Pakistan, Bangladesh, Indonesia, Malaysia, Thailand, Vietnam, China, Japan, South Korea, Australia, United States, Canada, Germany, Netherlands, Belgium, United Kingdom, Russia, Ukraine, Poland, Brazil, Argentina, Mexico, Egypt, Nigeria, Saudi Arabia, Turkey, Iran, and additional markets relevant to this sector
Key Companies Profiled
Wilmar International, Cargill, Bunge, AAK, Archer Daniels Midland, Fuji Oil, Musim Mas, SD Guthrie, Kuala Lumpur Kepong, AWL Agri Business, Patanjali Foods, Emami Agrotech, Nisshin OilliO, J-Oil Mills, COFCO, Golden Agri-Resources, Oleon, Vandemoortele, Savola Group, Mewah International
Quantitative Methodology
Primary survey, n=3,800 respondents, Q4 2025, six countries; demand-side model with trade association cross-validation
Qualitative Methodology
47 expert interviews, Q4 2025; applied to validate demand model assumptions, identify emerging dynamics, and assess competitive positioning
Report Format
PDF and XLSX data workbook (Word format preview document)
Publisher
Market Minds Advisory
Report Code
MMA-2026-AGR-277
Published
September 2026
Contact
sales@marketmindsadvisory.com | www.marketmindsadvisory.com

Purchase the full Partially Hydrogenated Oil Market Report (2026 to 2036).

The full report delivers a detailed assessment of the global partially hydrogenated oil market through 2036, covering product grade, end-use, channel and regional forecasts, competitive benchmarking of leading edible oil groups, specialty fat makers and oleochemical producers, and input cost analysis. It combines MMA primary research, including a six-country survey of 3,800 respondents and 47 expert interviews, with public statistical and company data. Analysts also model base oil, regulation and industrial demand scenarios. Clients receive segment margin ranges, supply maps and a case study on portfolio transition. Buyer negotiation frameworks are also included.
Ten-year product grade and end-use demand forecasts
Base oil, hydrogen and energy cost tracking
Competitive benchmarking of leading hydrogenated oil refiners
Trans fat limit and labelling regulation tracker
Regional comparative analysis and forecasts included
Quarterly primary survey data update access

Built For The People Who Decide

From boardroom strategy to bench-side execution, this report is read cover-to-cover by leaders shaping the next decade of their industry, turning demand scenarios, market dynamics and valuation benchmarks into decisions.
CXOs/ Presidents/ VPs/ Managers
M&A and Corporate Development
Strategy Teams and R&D Heads
Procurement and Product Directors
Regulatory and Compliance Leaders
Investor Relations and Equity Analysts