Market Minds Advisory
Parking Management Market

Parking Management Market: Parking Management: Barrier Removal, Collection Risk and the Municipal Revenue Nobody Wants to Discuss

Cities fund their transport budgets from parking charges and fines while pursuing policies that deliberately reduce parking demand, and no municipality has yet explained how both things happen at once.

Lead Analyst

Published

September 2026

Make Smarter Decisions with Customized Research Insights

Request a free sample report and evaluate market opportunities, growth trends, and competitive dynamics relevant to your business needs.

2025 MARKET VALUE$6.8BMarket Size 2025
2036 FORECAST VALUE$16.5BBase Case , 2026 to 2036
CAGR 2026 TO 20368.4 %Bull 9.6% / Bear 7.2%
INCREMENTAL OPPORTUNITY$9.1BNet 10- year value creation
EXPANSION MULTIPLE2.24x2036 value over 2026 base
Strategic Levers
M&A Pipeline
Regional Outlook
Country Rankings
Competitive Intelligence
Segmental Deep-dive
Call-Us : 91 93563 13602

Executive Snapshot and Market Trajectory.

Parking charges and fines fund around 11% of a typical municipal transport budget, which sits awkwardly beside policies designed to reduce driving into city centres. Nobody has explained how both objectives are met simultaneously. Technology is bought inside that tension. Technology procurement quietly optimises for the revenue side.
The operational change is barrier removal. Licence plate recognition without gates grows at 12.6%, half again the market rate of 8.4%, because it improves throughput and removes maintenance, and it transfers every unpaid session into a collection problem where recovery reaches about 83%. Charging-integrated parking follows at 11.4%, since a charging bay yields 2.8 times a conventional space. Western Europe takes 31% of value. Grid capacity rather than charger cost decides who can install one.
Concentration is very low at roughly 27% across the top five on measured equipment, software and services revenue, across equipment makers, payment platforms and enforcement operators who rarely compete directly. Drivers in an average city must hold 3.4 different payment applications, and municipalities rather than the market are now forcing that to consolidate. Municipalities rather than the market are now forcing that to consolidate. Product quality is not deciding these outcomes.
Market Definition
This market covers systems, software and services used to control, charge for and enforce parking, spanning gated access and revenue control equipment, barrier-free licence plate recognition systems, mobile payment and session management platforms, enforcement and compliance services, occupancy guidance and sensing, and charging-integrated parking management. Revenue is measured as equipment, software subscription and attributable service value at supplier level. Parking charges collected from drivers, property ownership and operation, general traffic management systems and standalone electric vehicle charging hardware are excluded.
Base Year Value
$6.8B in 2025 (MMA Primary Research Dataset, September 2026)
Forecast Period
2026 to 2036, eleven discrete annual values
CAGR
8.4% base case. Bull 9.6%. Bear 7.2%.
Fastest Growth Segment
Barrier-Free Licence Plate Recognition Systems: 12.6% CAGR
Fastest Growth Country
India: 13.4% CAGR
Fastest Growth Region
South Asia and Pacific: 10.4% CAGR
Largest Region
Western Europe: 31% of 2025 global value
Market Leaders
SKIDATA, Flowbird, EasyPark Group, Verra Mobility and Amano lead on measured parking management equipment, software and services revenue. Source: MMA Primary Research Dataset, July 2026.
Primary Survey
n=3,800 procurement and R&D decision-makers, Q4 2025, six countries
Methodology
Demand-side build-up, cross-validated against public data, 47 expert interviews

Parking Management Market Forecast Scenarios

parking-management-market-size-forecast-scenario-1788423769345
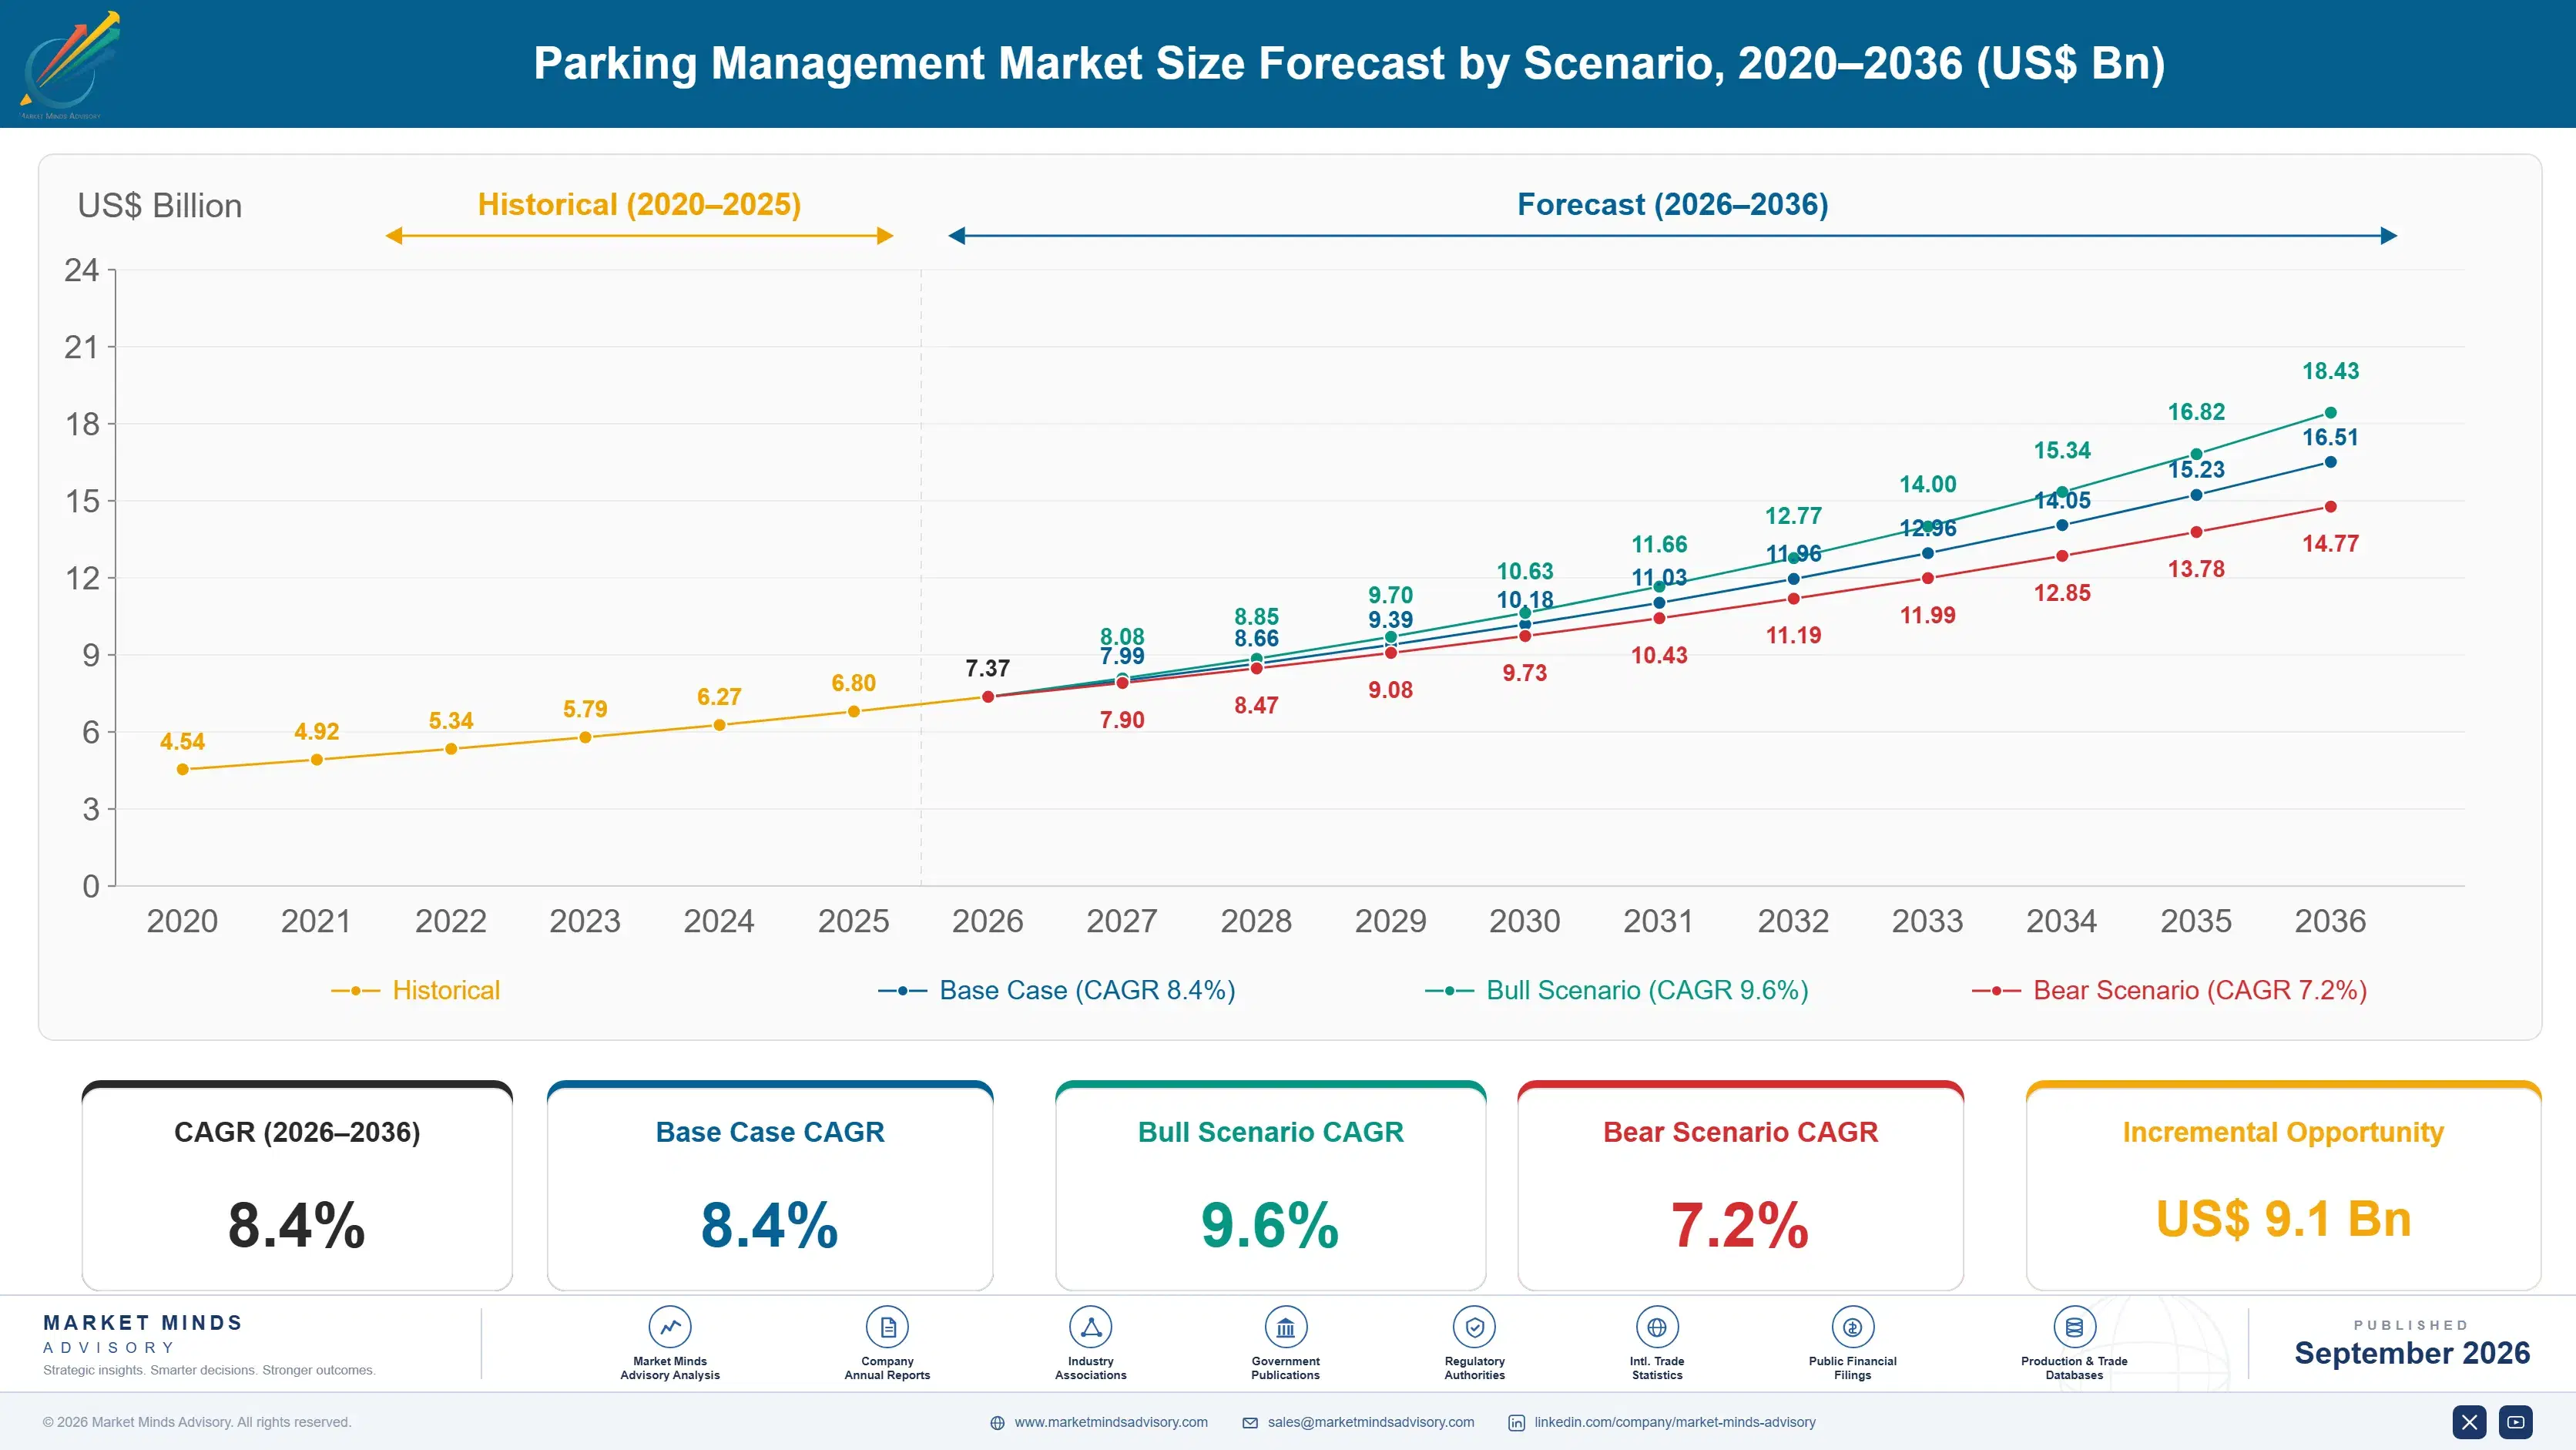
Growth ran at 7.4% from 2020 to 2025 through a period that changed usage patterns permanently. Commuter parking demand fell as office attendance reduced and never fully returned, while destination and residential parking held up better than expected. Cash payment collapsed permanently, removing a cost centre and accelerating mobile adoption by years. Municipal revenue pressure made enforcement a higher priority than before.
The base case at 8.4% rests on three mechanisms. Barrier removal proceeds because gates are the most maintenance-intensive component in any facility, and recognition accuracy now makes barrier-free viable at recovery near 83%. Charging integration is turning parking bays into higher-yielding assets at 2.8 times conventional revenue. Third, municipalities are forcing payment application consolidation, which concentrates platform spending among fewer providers. None of this depends on parking demand growing. Demand growth is not assumed.
The bull case at 9.6% assumes charging integration proceeds faster than vehicle adoption alone would support, as operators install ahead of demand to capture yield. The bear case at 7.2% is that city centre parking demand keeps declining under access restrictions, shrinking the base this equipment serves. That decline is policy rather than accident, which makes it harder to argue against.

Removing the Barrier Moves the Risk

The contradiction at the centre of municipal parking is rarely stated plainly. Cities fund roughly 11% of transport budgets from parking charges and enforcement while pursuing policies intended to reduce the driving that generates it. Both positions are defensible and cannot both succeed. Technology is bought inside that tension, which is why procurement values enforcement alongside the sustainability language.
TOP FIVE CONCENTRATION27%Fragmented across equipment makers, platforms and service operators
BARRIER-FREE RECOVERY RATE83%Unpaid sessions eventually collected without a physical barrier
MUNICIPAL REVENUE DEPENDENCE11%Transport budget share funded by parking charges and fines
APPS PER CITY AVERAGE3.4Payment applications drivers must hold in a single city
CHARGING BAY YIELD PREMIUM2.8 timesRevenue from a charging space against conventional parking
EQUIPMENT REPLACEMENT CYCLE11 yearsInterval before access and payment hardware is renewed
Operationally the significant shift is barrier removal. Gates are the most maintenance-intensive component in any car park, they limit throughput and they fail in ways that block traffic. Licence plate recognition allows entry and exit without them, which improves flow and cuts service cost considerably. It also converts non-payment from a physical impossibility into a collection exercise, with recovery near 83%. That missing share rarely appears in the business case.
Payment has fragmented in a way that irritates everybody involved. A driver in an average city needs 3.4 applications to park across it, because operators, municipalities and property owners each chose separately. Municipalities are now mandating consolidation through procurement. Charging has meanwhile become a parking product rather than a separate one, since a charging bay yields 2.8 times a conventional space.
"Every city I work with wants fewer cars and more parking revenue, and the technology procurement quietly optimises for the second while the policy document describes the first. Nobody is being dishonest. The budget simply has not caught up with the strategy."
Director, Urban Mobility Infrastructure Practice · MMA Construction and Industrial Equipment Practice · September 2026

Market Trends

Barrier Removal Converts Physical Control Into Credit Risk

Gates prevent non-payment absolutely and cost more to maintain than anything else in a car park, while licence plate recognition removes them, improves throughput and turns every unpaid session into a receivable. Recovery reaches about 83%, which means roughly one session in six is never collected and that loss must be priced into the operating model. Operators who modelled barrier removal on maintenance savings alone have generally been disappointed. Those who priced the collection gap properly have found the trade genuinely worthwhile, particularly on high-throughput sites. Priced honestly, the trade works on busy sites.
Market Impact: Funds 11% of transport budgets
Charging Turns a Parking Bay Into a Higher Yielding Asset

A space with a charger attached earns around 2.8 times what a conventional bay generates, because dwell time is longer, pricing is higher and the electricity carries its own margin. That has quietly turned parking operators into charging operators and made charging integration a parking management question rather than a separate infrastructure programme. Grid connection capacity is the practical constraint rather than charger cost, and lead times run into years in constrained locations. Operators securing connections early are acquiring an advantage competitors cannot replicate quickly. Early connection secures a durable advantage.
Market Impact: Fastest segment at 12.6% growth

Market Opportunities and Growth Drivers

Municipal Budgets Depend on Parking Income and Enforcement

Parking charges and penalty income fund around 11% of a typical municipal transport budget, and that dependence has deepened as other revenue sources tightened. Technology that improves compliance, extends enforcement coverage or reduces leakage therefore has a direct and measurable payback that a finance officer can verify within a year. Procurement values it accordingly, whatever the accompanying policy language says about reducing car use. This is the most reliable demand mechanism in the market and the one municipalities discuss least willingly. Finance officers verify the payback within a year, which very few civic technology purchases can offer.
Market Impact: Removes spaces in 40 cities

Gate Maintenance Cost Drives Barrier-Free Conversion

Barriers are struck by vehicles, jam in bad weather, require regular servicing and fail in ways that block an entrance entirely, which makes them the single largest maintenance line in a typical facility. Licence plate recognition removes them and improves throughput at the same time, which matters at sites where queuing is a genuine problem. Barrier-free systems grow at 12.6%, faster than anything else here. The saving is real and it is partly offset by collection losses that operators consistently underestimate at the business case stage. Business cases consistently understate the collection losses.
Market Impact: Loses one session in 6

Market Restraints and Challenges

City Centre Parking Demand Is Being Reduced Deliberately

Low emission zones, road pricing, space reallocation to cycling and public transport, and residential permit restrictions are all reducing the parking that this equipment exists to manage, and they are doing so by design rather than by accident. The root cause is transport policy that most cities have adopted deliberately and will not reverse. Commercially this shrinks the base at the same time that municipalities depend on the revenue it produces. Suppliers mitigate by moving toward enforcement, charging integration and kerbside management rather than parking capacity itself. Kerbside management is where suppliers are moving.
Market Impact: Recovery reaches only 83%

Collection Losses Undermine Barrier-Free Business Cases

Recovery on unpaid barrier-free sessions runs around 83%, so roughly one in six escapes entirely, and operators who modelled the conversion on maintenance savings alone find the arithmetic worse than expected. The root cause is that pursuing small debts across jurisdictions costs more than the debt is worth in a meaningful share of cases. Commercially this has slowed conversion at lower-throughput sites. Mitigation runs through pre-registration, vehicle registry access agreements and pricing that assumes the loss rather than hoping to avoid it. Lower throughput sites are converting far more slowly, and some will simply never convert at all.
Market Impact: Yields 2.8 times conventional bays
3 additional market trends, 4 additional growth drivers, and 2 additional restraints and challenges are covered in the full report. Contact sales@marketmindsadvisory.com to access the complete intelligence.

Segment CAGR and Growth Architecture

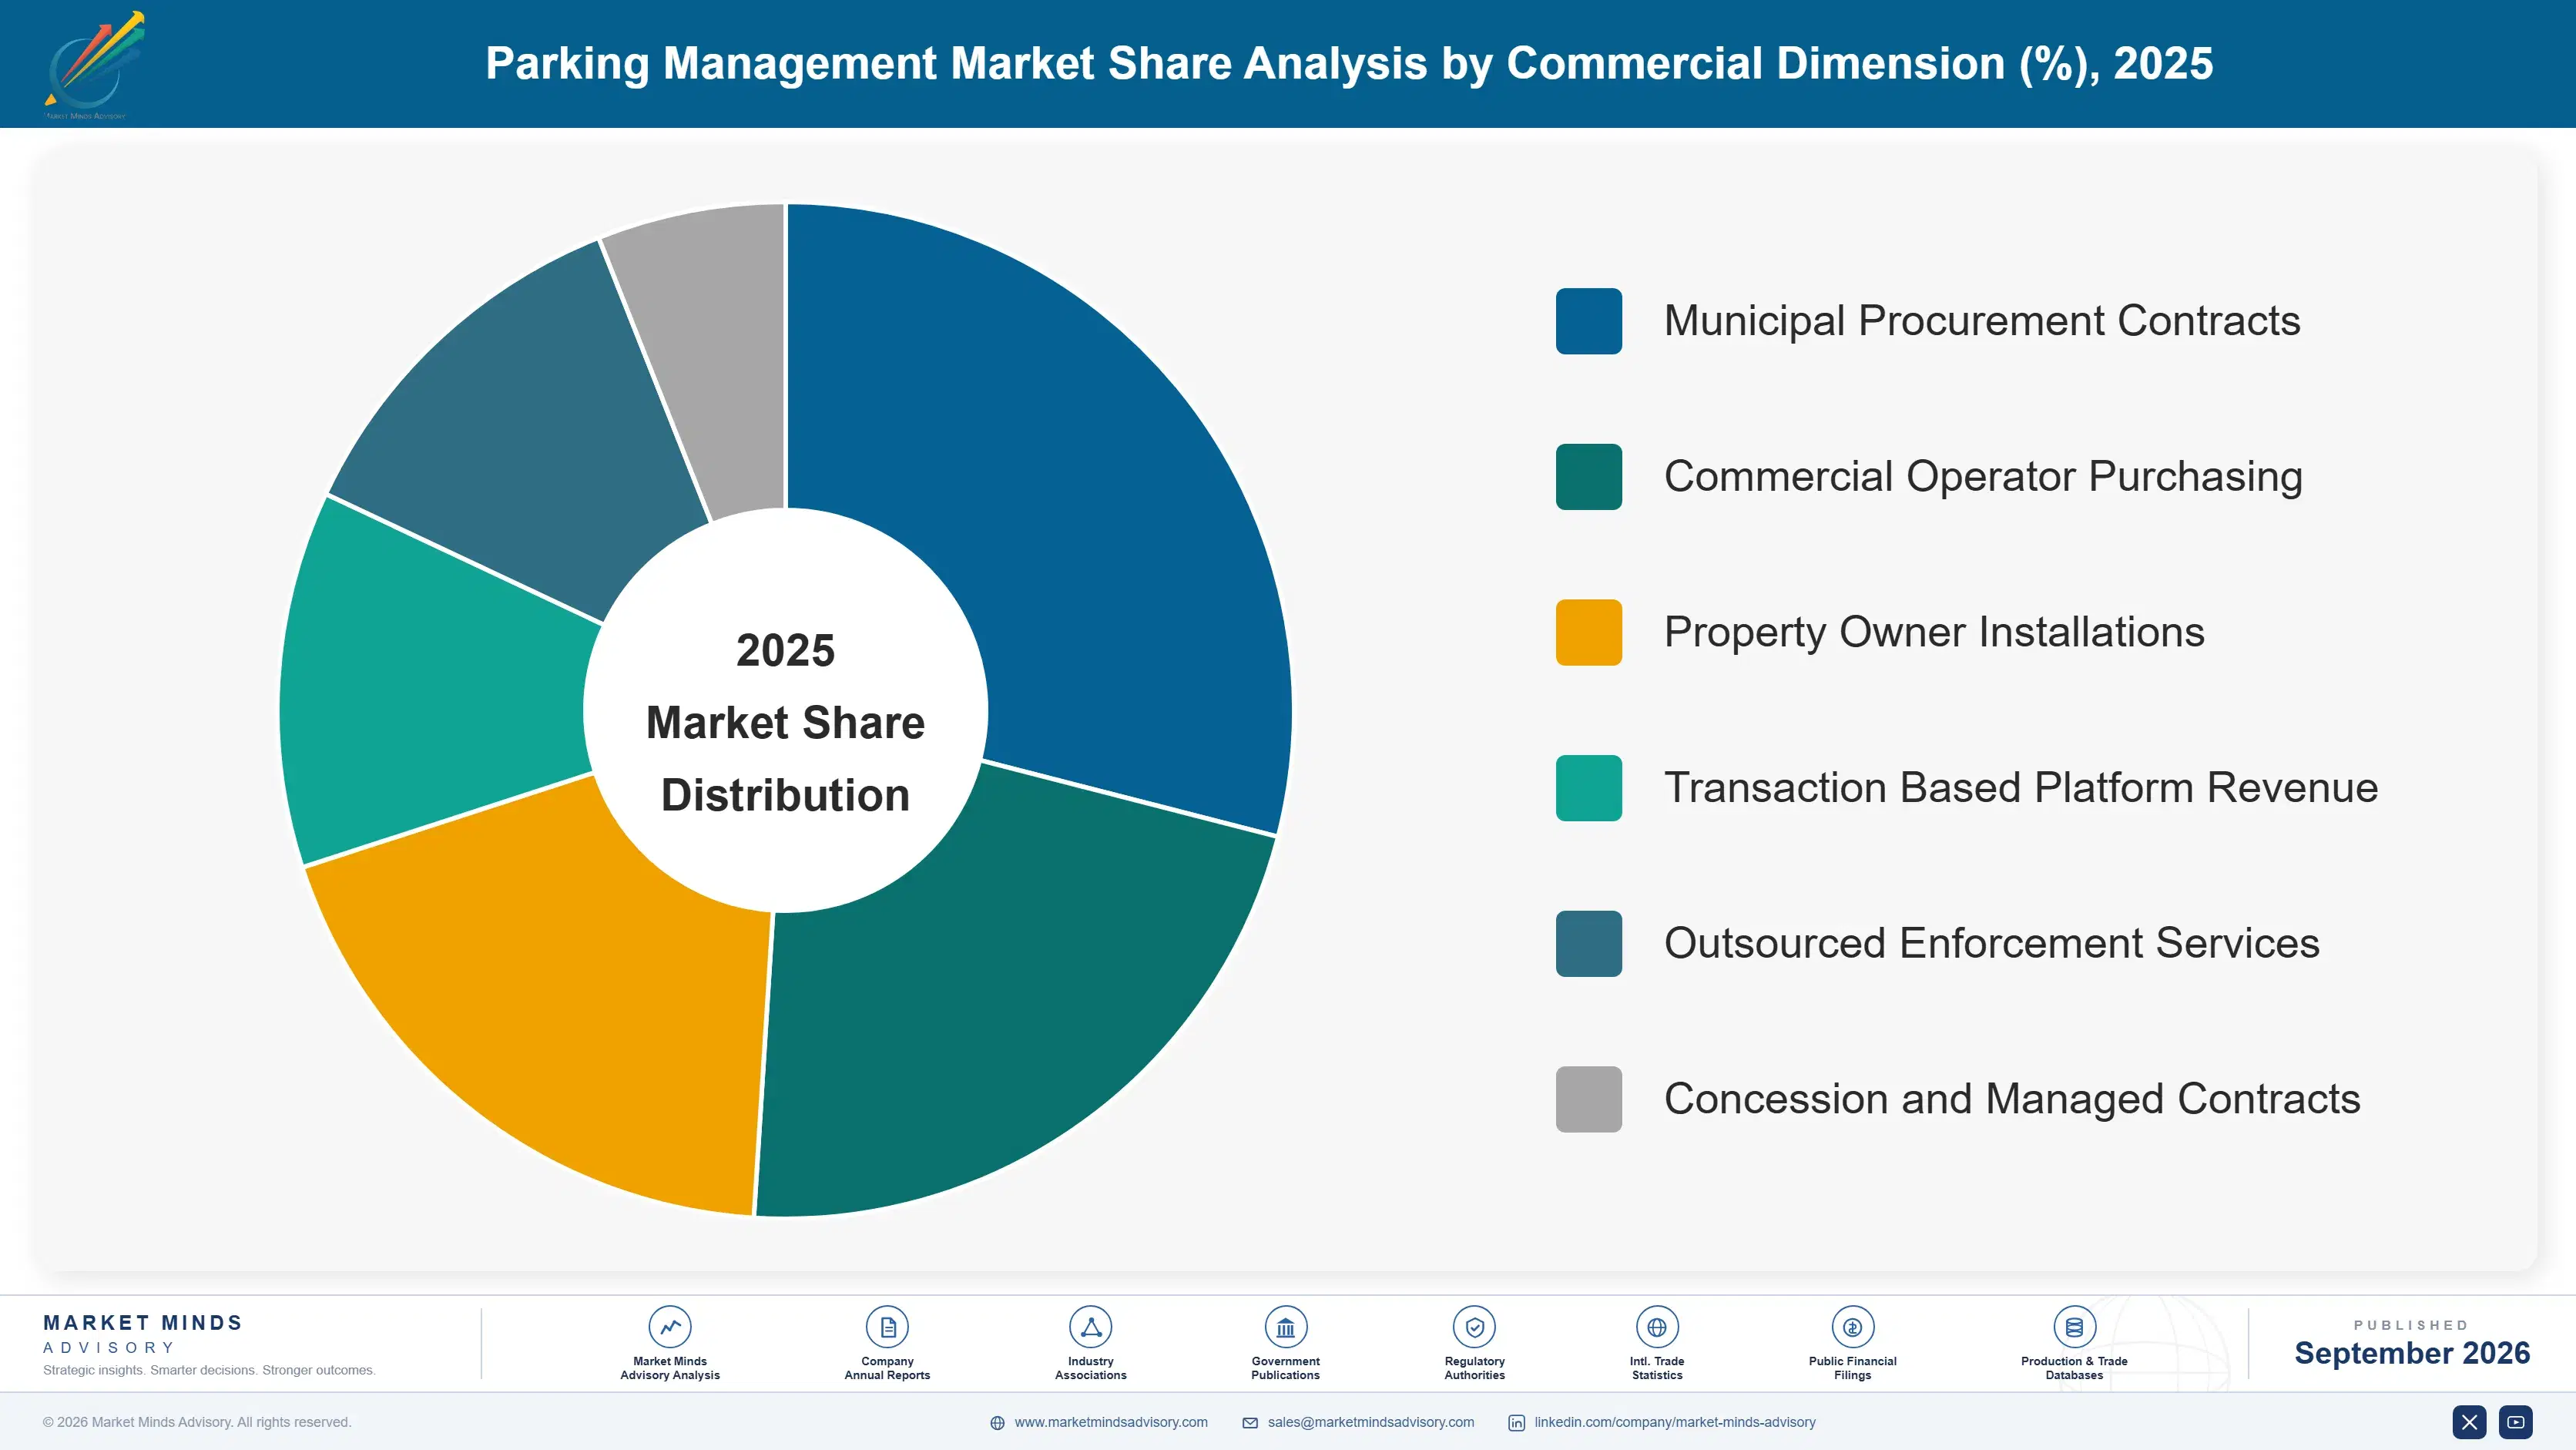
Segmentation follows what the system does rather than where it sits, because access control, payment, enforcement and charging carry entirely different economics and buyers. Equipment sold once on an eleven year cycle behaves nothing like a payment platform earning per transaction, and the two are increasingly supplied by different kinds of company. Buyers differ completely.
parking-management-market-market-share-analysis-1788423769896

Barrier-Free Licence Plate Recognition Systems

Barrier-free systems grow fastest at 12.6%, half again the market rate of 8.4%, and they succeed on maintenance and throughput rather than on any customer experience argument. Gates are struck, jam and fail in ways that block entrances, and removing them eliminates the largest service line in most facilities. The trade is that non-payment becomes a receivable rather than an impossibility, with recovery near 83%, and that loss has to be priced rather than assumed away. High-throughput sites convert readily because queuing costs more than the collection gap; lower volume facilities are converting far more slowly and some will not at all. Throughput decides it rather than technology preference. Some sites will never convert.
CAGR 12.6%

Charging-Integrated Parking Management

Charging integration grows at 11.4% because a bay with a charger earns around 2.8 times a conventional space through longer dwell, higher pricing and electricity margin, which changes what a parking asset is worth. Operators have become charging operators without ever describing it that way. The binding constraint is grid connection capacity rather than charger cost, and connection lead times run into years in dense urban locations where the yield is highest. Operators who secured connections early hold an advantage that competitors cannot replicate on any commercial timescale, which is unusual in this market. Energy companies and parking operators are now arriving in the same market from opposite directions, which is reshaping who owns the customer.
CAGR 11.4%
Full segment breakdown across 6 segments available in the complete report.

Regional Architecture and Country Demand Map

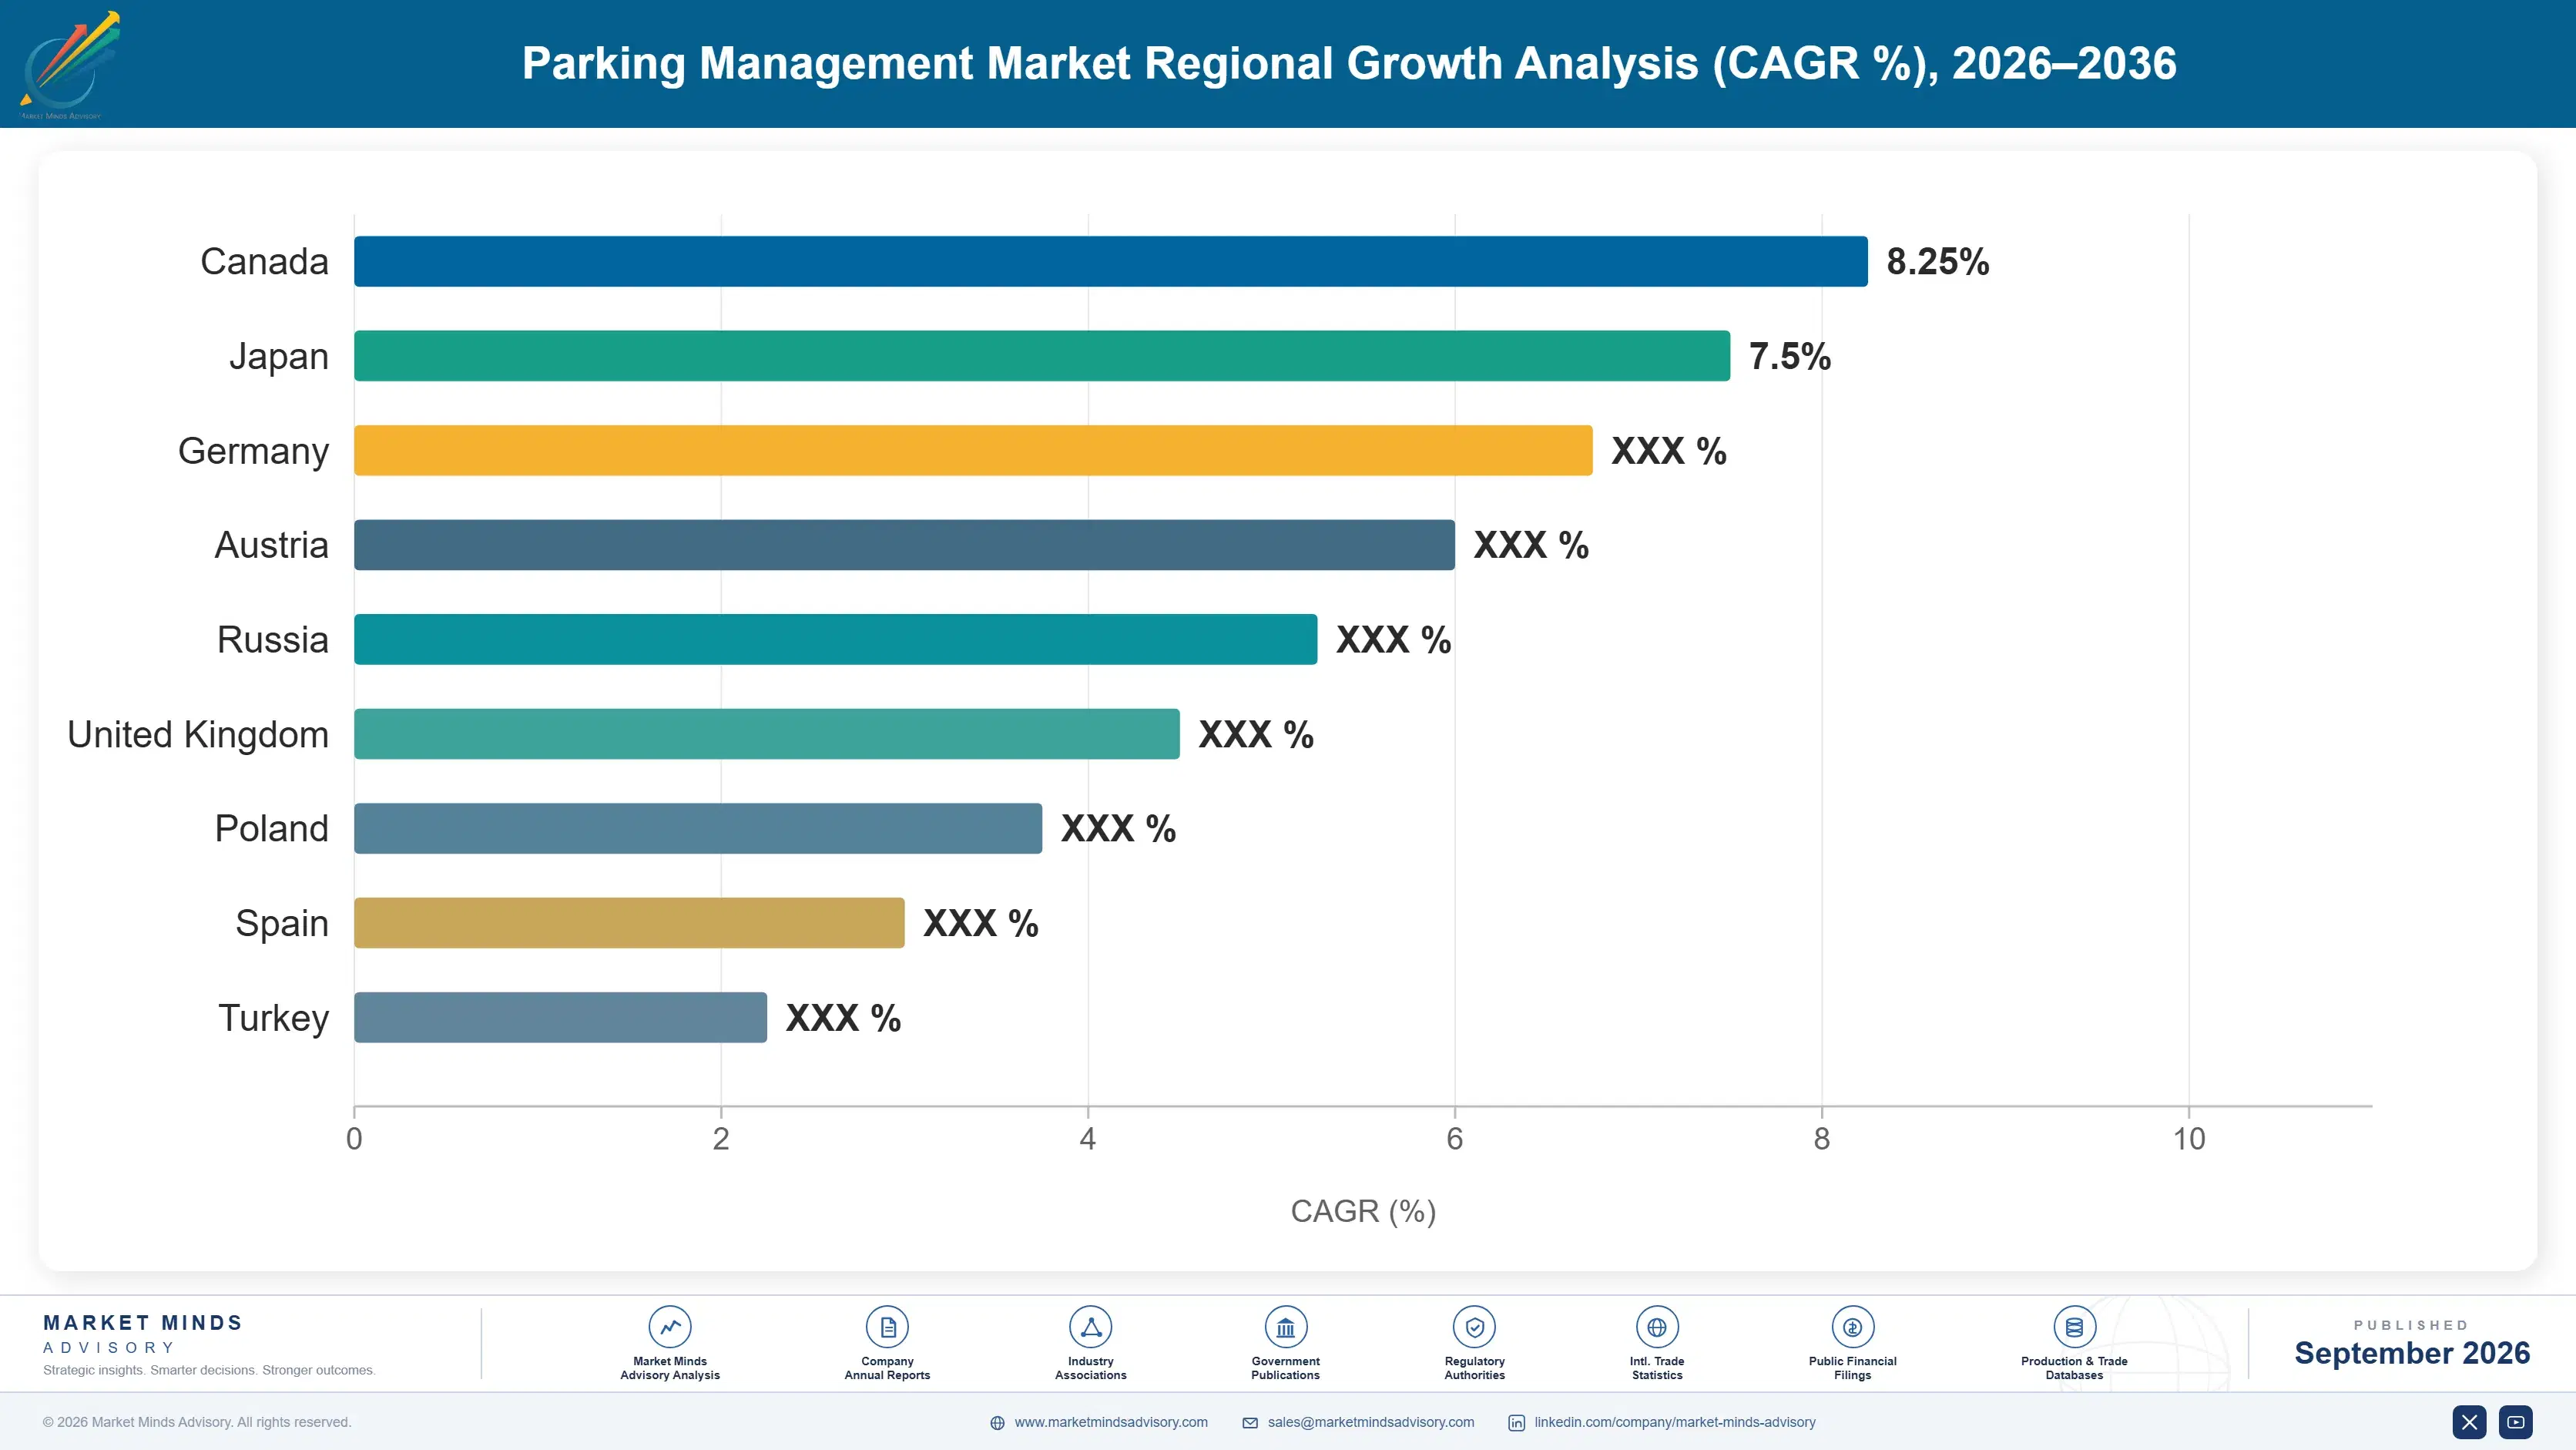
Demand follows the extent of priced parking and the strength of enforcement rather than vehicle numbers. Cities that charge for kerbside space and enforce it generate far more technology spending than cities with abundant free parking, whatever their traffic volumes. Enforcement decides how much is collected.

Western Europe

Western Europe holds 31%, above the regional band, on the most extensively priced and actively enforced parking anywhere: on-street charging covers whole city centres, enforcement is systematic and municipal dependence on the revenue is correspondingly high. Dutch cities pioneered barrier-free operation and scanning vehicle enforcement, and much of the region has followed. Payment application consolidation is furthest advanced here because municipalities began mandating interoperability years ago. Regional growth at 6.8% is the slowest anywhere, since the installed base is mature and access restrictions are actively reducing the parking being managed. Regional growth at 6.8% therefore reflects a mature base facing deliberate reduction rather than any lack of technology adoption. Enforcement is systematic throughout.
Share: 31% | CAGR: 6.8% (2026 to 2036)

North America

American and Canadian demand rests on a very large off-street commercial parking estate operated by specialist companies rather than by cities, which produces different buying behaviour from Europe. Barrier-free conversion is proceeding at high-throughput airport and urban garage sites where queuing costs are real. Enforcement is generally outsourced and technology-led, with automated licence plate recognition widely deployed. On-street pricing is less extensive than in Europe outside major cities, which limits municipal spending. Charging integration is advancing quickly at commercial facilities where operators can capture the yield directly. Regional growth at 7.6% consequently follows commercial operator investment rather than municipal programmes, which are smaller here than in Europe. On-street pricing is far less extensive.
Share: 29% | CAGR: 7.6% (2026 to 2036)
Regional intelligence for 5 additional markets available in the complete report: East Asia, South Asia and Pacific, Latin America, Middle East and Africa, Eastern Europe. Contact sales@marketmindsadvisory.com.
parking-management-market-country-cagr-analysis-1788423770418

Where Parking Technology Actually Earns

Equipment sells once every eleven years into a base that policy is deliberately shrinking. What compounds is transaction revenue on payment platforms, enforcement services that municipalities depend on financially, and charging integration that raises what a parking asset is worth. Equipment sales into a shrinking base are not where this market is going. Shrinking bases do not fund growth.

Earn Per Transaction Rather Than Per Installation

Access and payment hardware replaces on an eleven year cycle into a base that access restrictions are actively reducing, which is a difficult foundation for growth. Payment and session platforms earn on every transaction and grow with usage rather than with equipment replacement, producing roughly 4 times the lifetime revenue per site of a hardware sale. Municipal consolidation mandates are concentrating that revenue among fewer providers, which advantages those with contracting capability. Hardware suppliers without a platform position are watching the recurring revenue accrue elsewhere. Recurring revenue accrues to whoever holds the platform.
Market Impact: Earns 4 times the hardware lifetime revenue overall

Sell Enforcement to the Budget That Depends on It

Parking income funds around 11% of municipal transport budgets, which makes compliance technology one of the few civic purchases with a payback a finance officer verifies inside a year. Enforcement capability sold against that arithmetic reaches a budget that policy objectives do not constrain, at contract values around 3 times what parking operations budgets support. It requires being comfortable with a conversation cities find politically awkward. Suppliers who lead with sustainability framing are addressing a specification while somebody else addresses the budget. The conversation is politically awkward and commercially decisive.
Market Impact: Reaches the 11% that funds municipal transport budgets

Price the Collection Gap Into Barrier-Free Conversion

Recovery on unpaid barrier-free sessions runs about 83%, so roughly one in six escapes, and operators who built the case on gate maintenance savings alone have been disappointed by the outcome. Suppliers modelling the loss honestly and pricing accordingly close conversions that optimistic proposals lose at the second review. It also removes the reference risk that follows a disappointed customer. Registry access agreements and pre-registration lift recovery materially, and selling those alongside the system is what makes the arithmetic work. Optimistic proposals lose at the second review. Reference damage follows a disappointed customer.
Market Impact: Loses roughly one session in every 6 attempted

Secure Grid Connections Before Charging Demand Arrives

A charging bay yields around 2.8 times a conventional space, and the binding constraint is grid connection capacity rather than charger cost, with lead times running into years in exactly the dense locations where yield is highest. Operators and suppliers securing connections ahead of demand hold positions competitors cannot replicate on any commercial timescale. It requires capital commitment against uncertain vehicle adoption in a specific location. That commitment is the difference between participating in charging and watching somebody else install it. Capital committed against uncertain local demand is the barrier here, and it is what separates participants from spectators.
Market Impact: Yields 2.8 times the conventional bay revenue instead

Who Controls the Margin Pool

Concentration is very low at roughly 27% across the top five on measured equipment, software and services revenue, and the field contains companies with almost nothing in common. Access equipment manufacturers sell hardware on long replacement cycles. Payment platforms earn per transaction from drivers and municipalities. Enforcement service providers operate under civic contracts. Parking operators buy from all three, which makes the aggregate a description of scope rather than competition.
Competition runs on three dimensions. Municipal contracting capability is first and increasingly decisive, since consolidation mandates are turning fragmented consumer platforms into a smaller number of large civic contracts. Second is collection and recovery performance, which determines whether barrier-free conversion works commercially. Third is grid connection position for charging integration, which is a property and utility question rather than a technology one.

Two pressures are reshaping the field. Municipalities are consolidating payment platforms through procurement rather than waiting for the market, which will eliminate providers without civic contracting capability regardless of product quality. Meanwhile charging is pulling parking operators and energy companies into the same market from opposite directions. Rankings will move toward participants with transaction revenue and municipal relationships rather than those with the broadest equipment range.
parking-management-market-company-positioning-matrix-1788423770941

Competitive Moat and Risk Dimensions

EASYPARK GROUP

Moat: Municipal payment platform scale

EasyPark Group holds payment platform positions across many European and North American cities, which matters increasingly as municipalities consolidate applications through procurement and prefer providers already operating at scale. Transaction revenue grows with usage rather than with equipment replacement cycles. Its acquisitions across regional platforms give it the city coverage that consolidation mandates now reward directly.
EASYPARK GROUP

Risk: Municipal contract concentration

Revenue depends increasingly on municipal contracts that are periodically retendered and politically exposed, and losing a large city removes substantial transaction volume at once. Consolidation mandates concentrate opportunity and also concentrate risk. Cities are also increasingly aware of the fee structures applied to drivers, which invites the scrutiny that accompanies any service the public pays for directly and notices.
VERRA MOBILITY

Moat: Enforcement and violation processing

Verra Mobility operates enforcement and violation processing under long-term municipal and commercial contracts, which sits directly in the revenue stream cities depend on rather than adjacent to it. That processing capability, including registry access and recovery operations, is what makes barrier-free parking commercially viable. Long civic contracts renew reliably and create relationships that extend well beyond the original scope.
VERRA MOBILITY

Risk: Political and regulatory exposure

Enforcement revenue attracts political attention whenever a city debates fairness in penalty issuance, and contracts can be curtailed for reasons unrelated to performance. Recovery operations across jurisdictions face varying data access rules that constrain what is collectable. Growth also depends on cities expanding enforcement, which sits awkwardly beside their own access reduction policies.

Players Tracked

Prominent Players

SKIDATA
Flowbird
EasyPark Group
Verra Mobility
Amano

Other Key Players

Scheidt and Bachmann
Designa
HUB Parking Technology
SWARCO
PayByPhone
Passport
Genetec
Nedap
Cleverciti
Q-Free
Kapsch TrafficCom
Conduent
Parkopedia
APCOA
Indigo

Recent Developments

MAY 2025

Municipalities mandate payment application interoperability in procurement

Several European and North American cities required interoperability or single-platform provision as a condition of parking payment contracts, following driver complaints about holding multiple applications. The requirement was a procurement condition rather than any regulatory change or industry agreement between providers. Existing contracts were allowed to run to expiry.
Signal: Cities are consolidating a fragmented market that showed no sign of consolidating on its own terms.
SEPTEMBER 2025

Barrier-free conversion slows at lower throughput facilities

Operators reported that barrier removal economics did not support conversion at sites with modest vehicle volumes, since collection losses on unpaid sessions outweighed gate maintenance savings. Conversion continued at airports and high-volume urban garages where queuing costs are substantial. Gate replacement continued at the remaining facilities.
Signal: Barrier removal is a throughput calculation rather than a technology upgrade, and many sites will never convert.
JANUARY 2025

Parking operators expand charging installation ahead of vehicle demand

Commercial parking operators accelerated charger deployment at facilities where grid connection capacity was available, installing ahead of local vehicle adoption to secure connections. Lead times for new connections in dense urban areas had extended well beyond what operators could plan around. Capacity was secured well ahead of demand.
Signal: Grid capacity rather than charger cost decides who participates in the highest yielding parking product available.

What Parking Systems Cost to Deliver

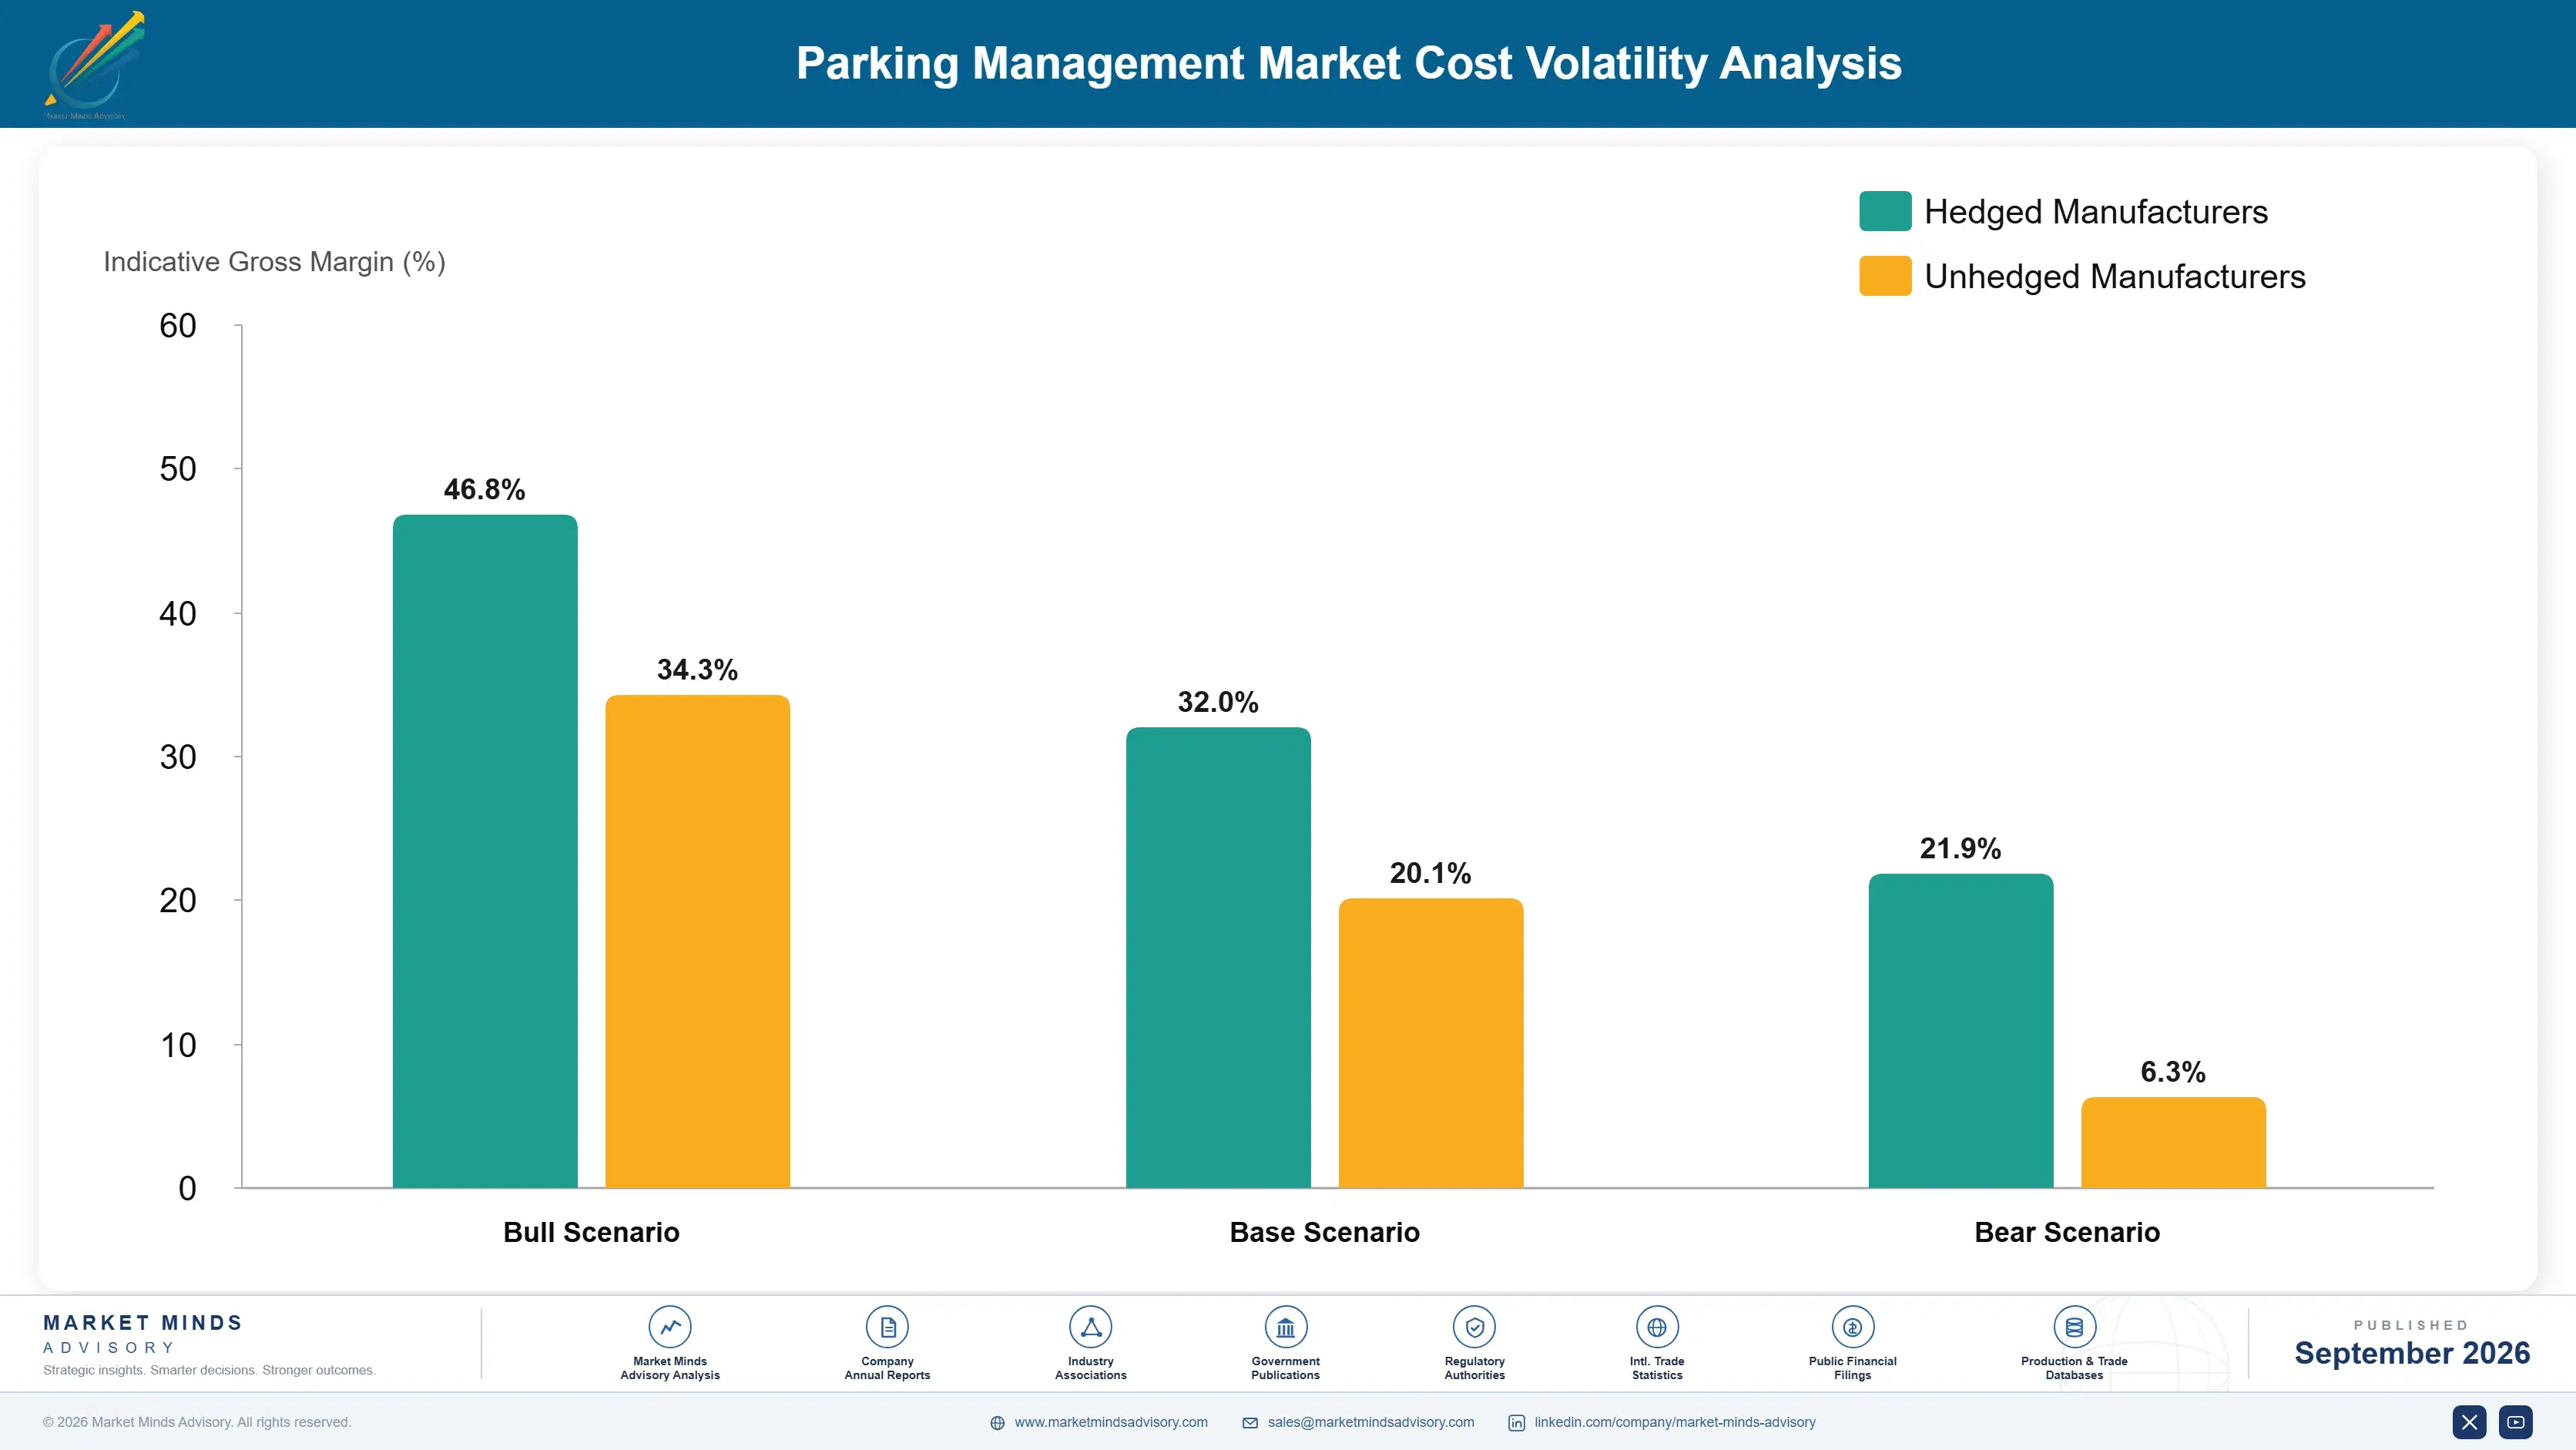
Cost structure differs completely between hardware, platforms and services. Equipment manufacturing runs to mechanical assemblies, cameras, payment terminals and enclosures at roughly 54% of cost of goods. Payment platforms carry payment processing fees at around 31% of revenue, which is the largest single line and largely outside the provider's control. Enforcement services carry field labour, registry access charges and recovery operations, with labour dominating everything else.
Payment processing costs have been the sharpest pressure on platforms. Parking transactions are small and numerous, the worst combination under card economics built for retail baskets, and fees consumed a rising share as cash disappeared. Verra Mobility and Kapsch TrafficCom both referenced processing and operating cost conditions in recent annual reporting. Providers with fixed municipal fee arrangements absorbed the increase rather than raising driver charges.

Exposure varies by business model rather than by scale. Equipment makers carry component cost and long replacement cycles, with revenue arriving in infrequent orders. Platforms carry processing fees on every transaction and face municipal fee caps that limit what can be passed on. Enforcement providers carry field labour and recovery costs against collection rates they only partly control. Small regional providers lack both processing scale and enforcement coverage.
parking-management-market-cost-volatility-analysis-1788423771136

Aggregate parking transactions before processing them

Card processing economics assume retail baskets rather than very small parking payments, which makes per-transaction fees a disproportionate cost line for platforms. Aggregating multiple sessions into a single settlement, or deferring authorisation across a day, cuts processing cost by roughly 40%. It introduces settlement risk the platform carries, which needs deliberate financial design rather than engineering.

Negotiate registry access before promising recovery rates

Barrier-free collection depends entirely on identifying vehicle keepers, and registry access rules differ by jurisdiction in ways that determine what is recoverable at all. Securing access agreements before committing to a recovery rate avoids promising performance the data will not support. Operators assuming access would follow deployment found recovery well below what justified conversion.

Index municipal fee arrangements to processing cost

Cities cap what drivers can be charged for payment convenience, and fixed fee arrangements leave the platform absorbing processing increases it does not control. Indexation against published processing costs moves that exposure to the municipality, which has far more capacity to absorb it. Cities resist because driver charges are politically visible, making this a negotiation about who carries the cost.

Portfolio Architecture for Margin Defence

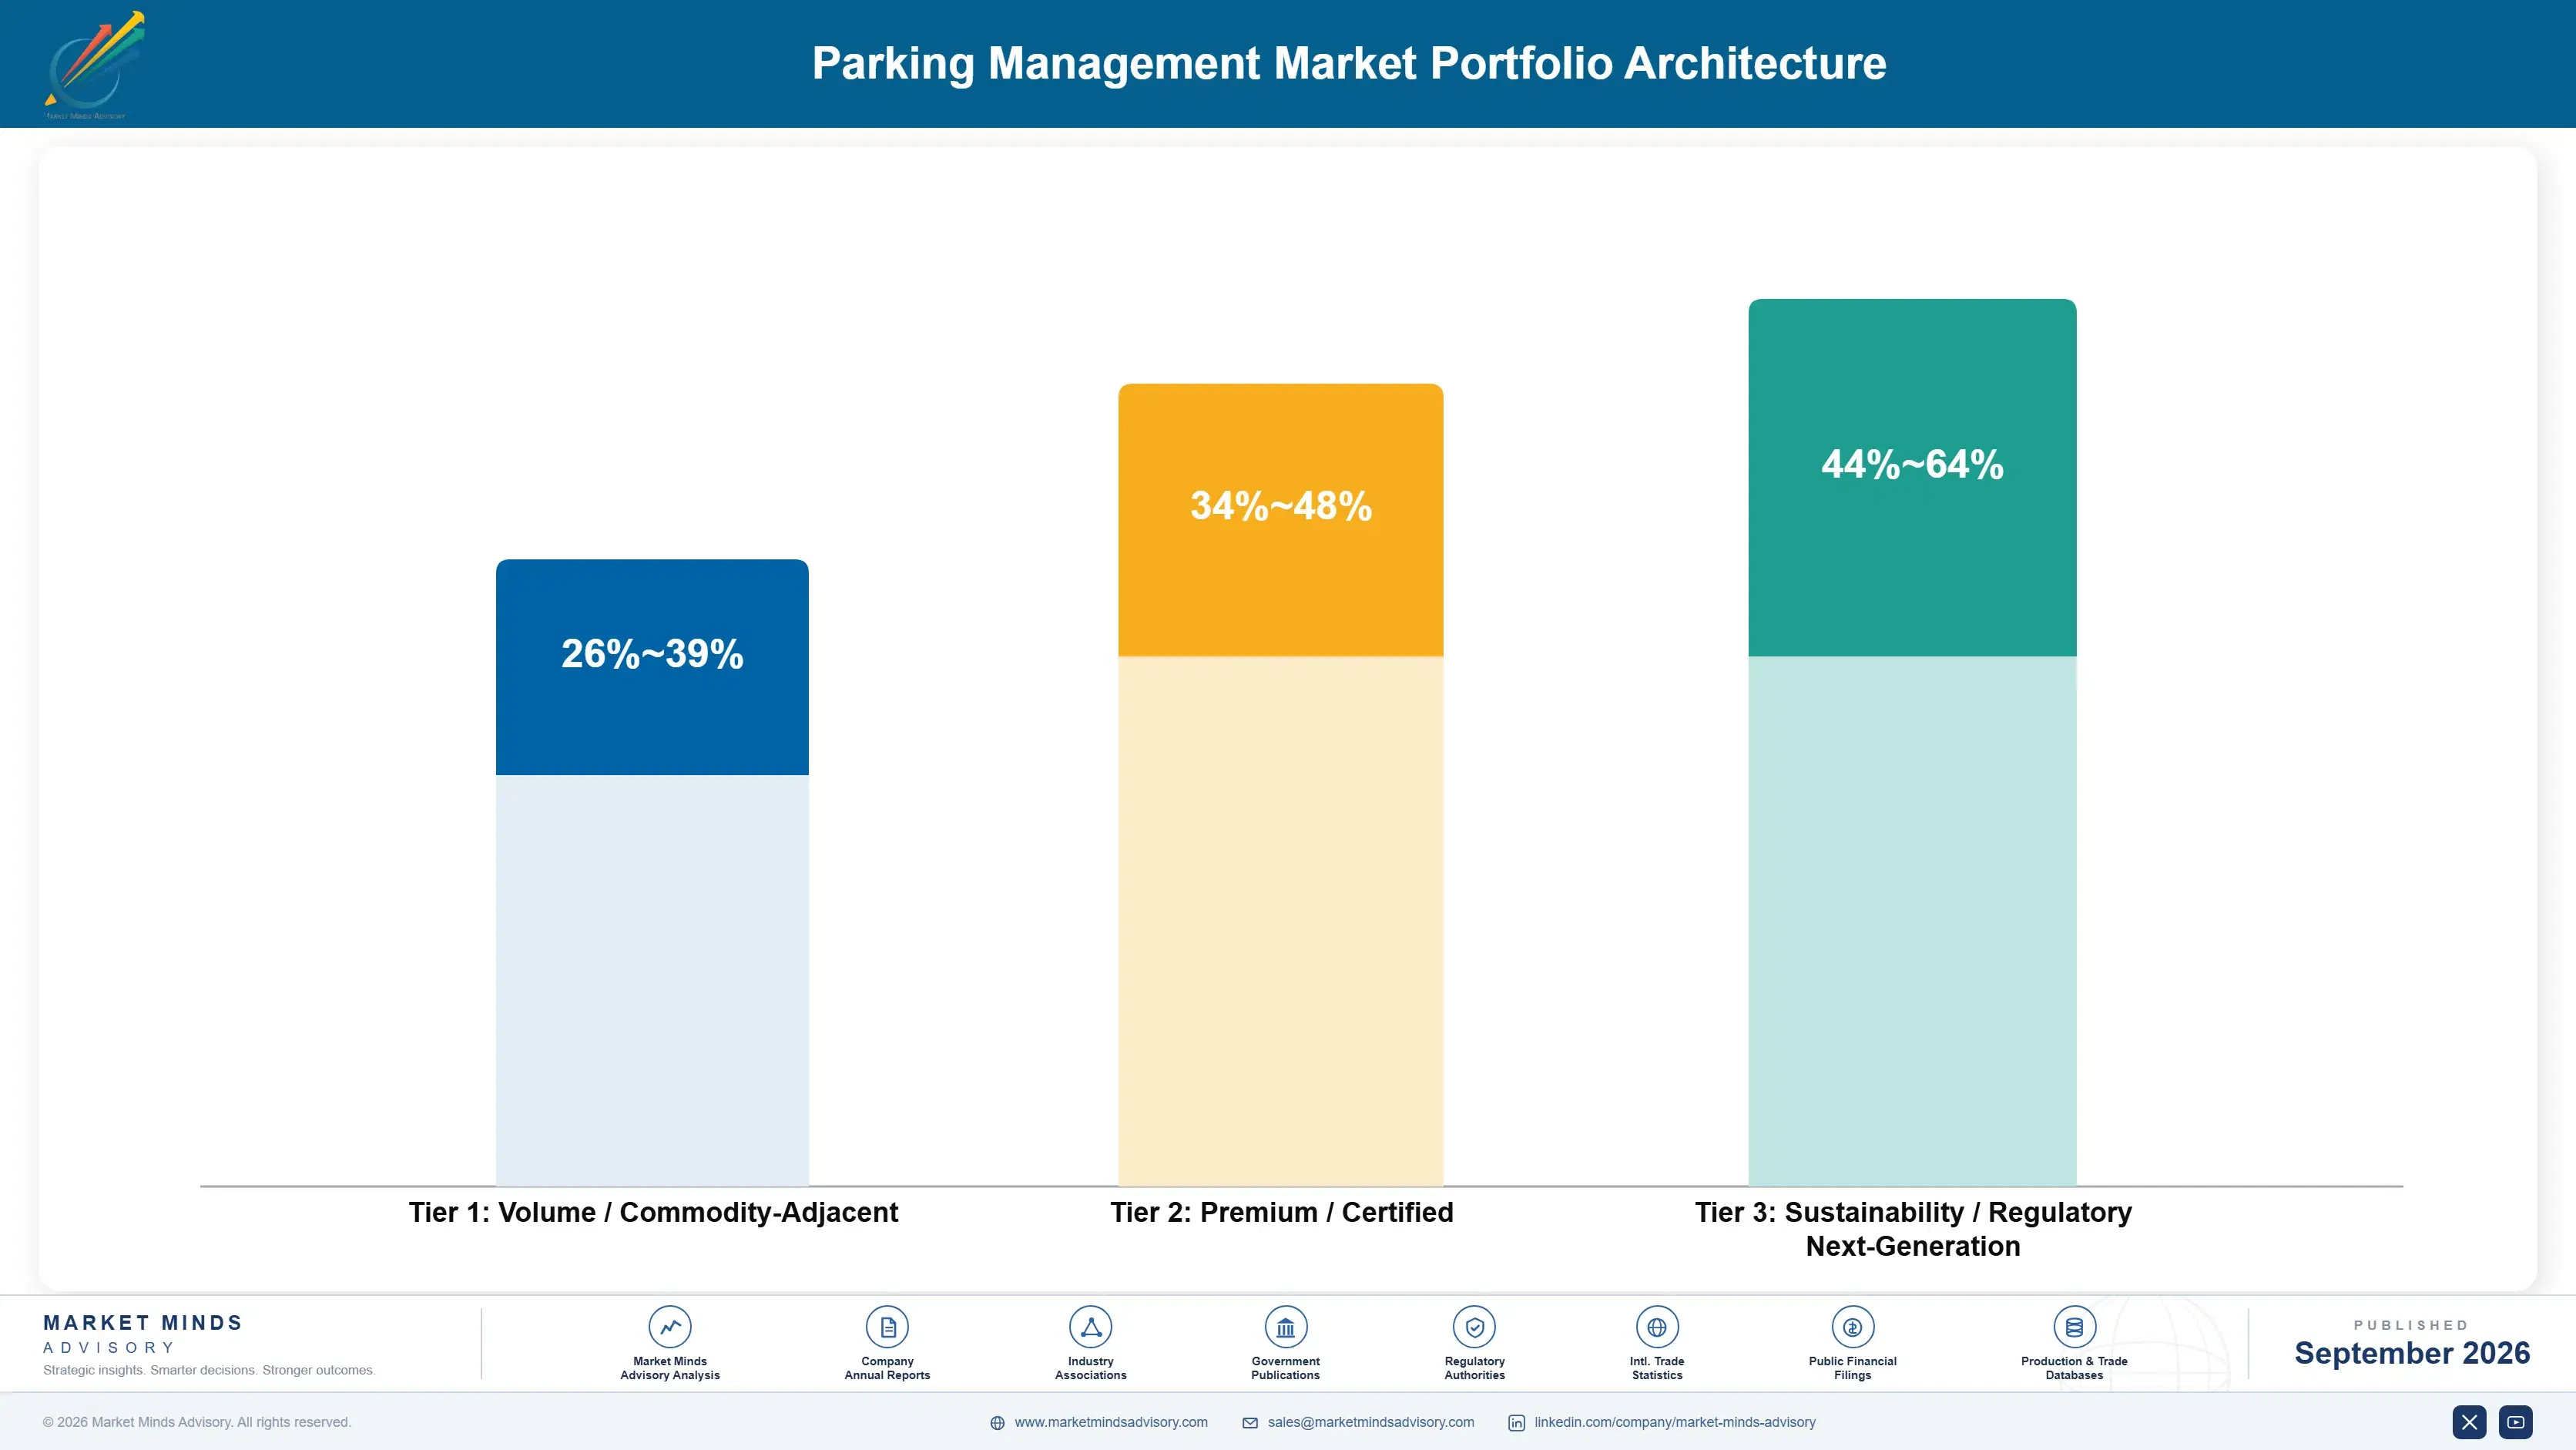
Margin architecture separates on whether revenue arrives once or continuously. Access and payment equipment sells on an eleven year replacement cycle into a base that policy is deliberately shrinking, earning respectable hardware margins that do not compound. Payment platforms earn per transaction and grow with usage, though processing fees consume a third of revenue before anything else. Enforcement services earn well and carry political exposure that hardware never faces.
The volume tension is between commercial facilities and municipal contracts. Commercial car parks and property owners are numerous, buy equipment straightforwardly and make decisions on operating cost. Municipalities are fewer, buy larger and increasingly bundle payment, enforcement and policy objectives into single contracts that smaller providers cannot bid for. Consolidation mandates are pushing the market toward the second, which advantages scale and contracting capability over product differentiation.

High-value revenue concentrates in enforcement services and in charging-integrated management. Both share the property that the customer is protecting or growing a revenue stream rather than reducing an operating cost. Access equipment occupies the volume position, provides the site presence that other revenue is sold alongside, and faces a replacement cycle stretching against a base of spaces that cities are actively reducing.

Volume / Commodity-Adjacent

Gated access equipment, payment terminals and occupancy sensing hardware. The wide range separates established manufacturers from those assembling purchased components. Replacement cycles near eleven years and a shrinking managed space base both work against this tier.
Gross Margin: 26-39%

Premium / Certified

Payment and session platforms earning per transaction across municipal and commercial estates. Margin is constrained by processing fees at roughly a third of revenue rather than by competitive pricing. Municipal fee caps limit what can be passed through to drivers.
Gross Margin: 34-48%

Sustainability / Regulatory / Next-Generation

Enforcement and violation processing, and charging-integrated parking management. The widest range in the portfolio, reflecting recovery performance and grid connection position. Highest margin and the closest to the revenue streams customers actually care about.
Gross Margin: 44-64%
parking-management-market-portfolio-architecture-1788423771638

High-value Sub-segments and Strategic Watch-out

Enforcement and Violation Processing

High value with steady growth, sitting directly inside the revenue that funds around 11% of municipal transport budgets rather than adjacent to it. The margin range reflects recovery performance and registry access by jurisdiction. Political exposure is genuine, since penalty issuance attracts scrutiny that no equipment purchase ever does.
Gross Margin: 48-64%

Charging-Integrated Management

High value with strong growth, since a charging bay yields around 2.8 times a conventional space through dwell, pricing and electricity margin together. The range reflects grid connection cost and whether the operator owns the supply. Connection capacity rather than charger cost decides who can participate at all.
Gross Margin: 44-60%

Access and Payment Equipment

The volume core of installations and the weakest position commercially, replacing every eleven years into a base that access restrictions are deliberately reducing. It provides the site presence platforms and services are sold alongside. Barrier removal is shrinking the largest product category within it. Barrier removal shrinks it further.
Gross Margin: 25-38%

Municipal Platform Consolidation

The strategic watch-out, carried at zero because it removes providers rather than generating revenue. Cities mandating single-platform provision eliminate competitors through procurement rather than competition. Providers without municipal contracting capability are being excluded regardless of how good their consumer product happens to be. Product quality is not the deciding factor.
Gross Margin: 0-0%

How This Revenue Recurs

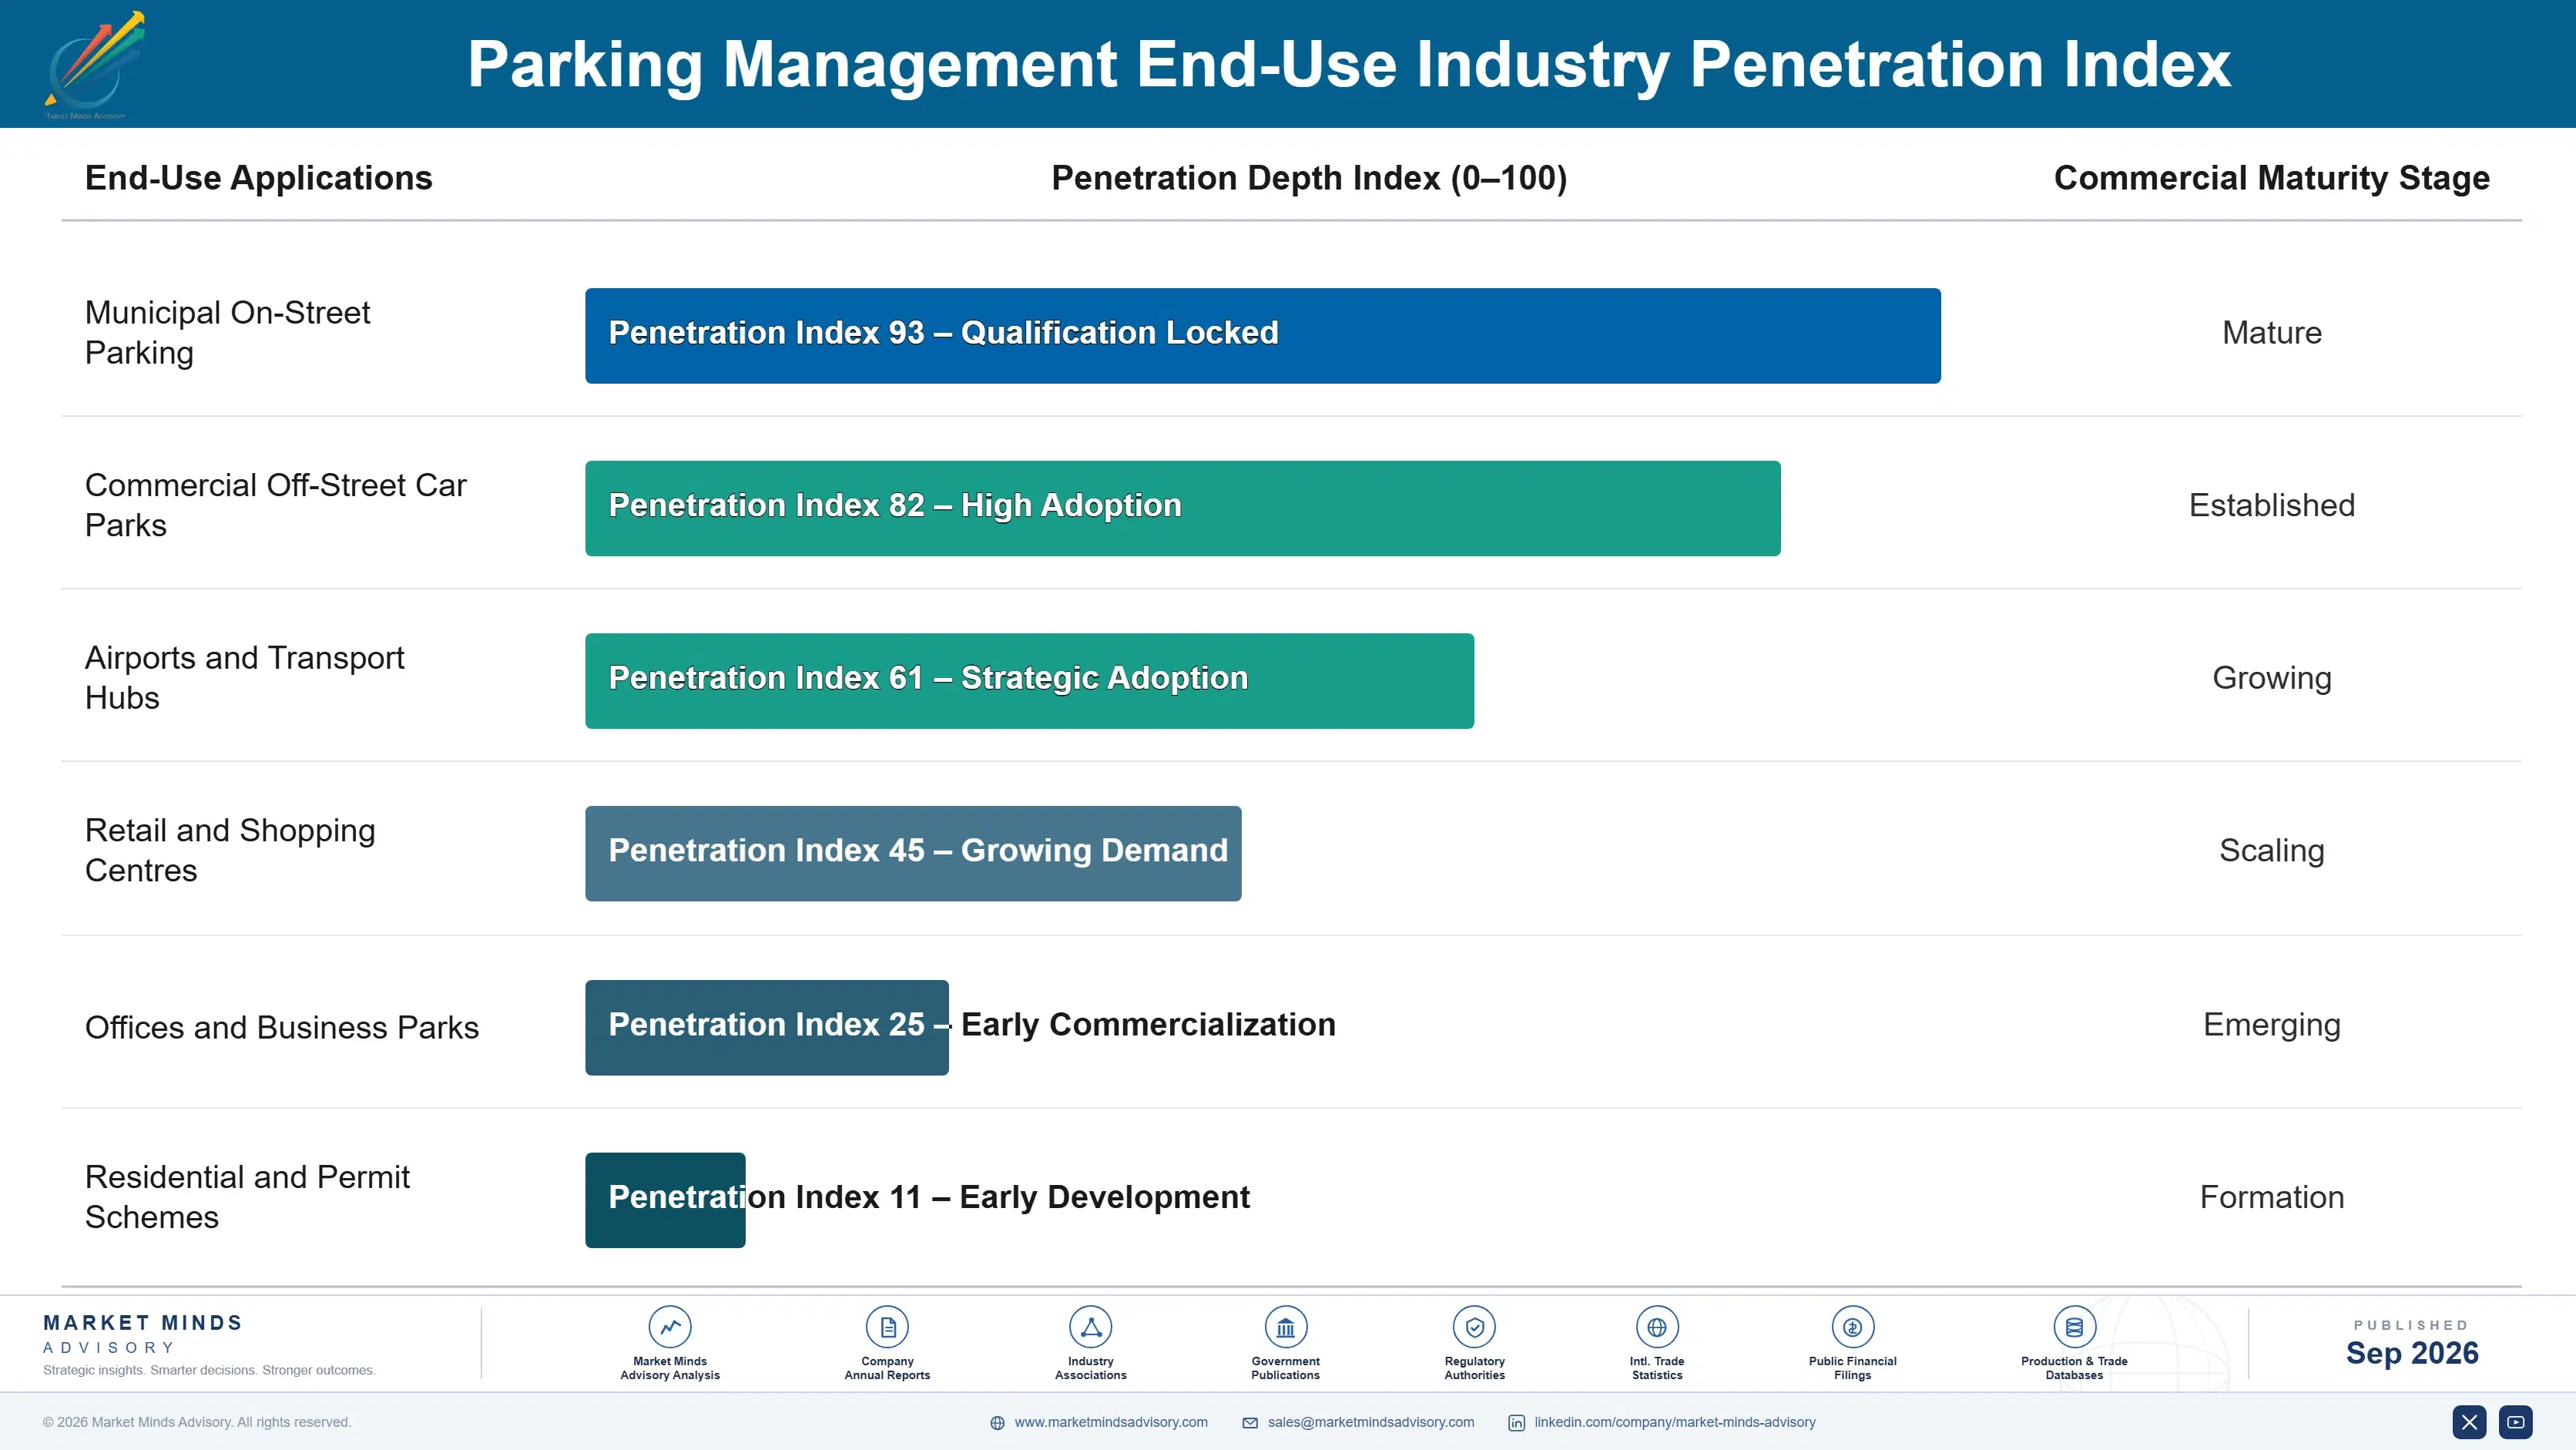
Recurrence divides sharply by revenue type. Equipment recurs every eleven years, and only if the site still exists and still needs a barrier. Payment platform revenue recurs with every parking session and grows with usage rather than with any purchasing decision. Enforcement contracts run for years and renew reliably because cities depend on the income. Charging revenue recurs continuously and grows with vehicle adoption in that specific location.
Adoption depth varies sharply by site type. Airports and high-volume urban garages use every capability, since throughput and revenue both justify it. Shopping centres use access control and payment and little else. On-street municipal parking uses payment and enforcement intensively and no access equipment. Residential permit schemes use enforcement almost exclusively. Office parking usage fell sharply when attendance patterns changed and invests very little now.

The buyer has shifted from facilities toward municipal and commercial finance. A car park manager once bought equipment to control access and reduce operating cost within a modest budget. Today a municipal finance or transport authority buys payment and enforcement against a revenue stream, and a commercial operator buys charging against asset yield. Suppliers selling access control to facilities managers address the smallest budget in this market.
parking-management-market-end-use-penetration-index-1788423772127

Where This Market Rewards

These are among the four positions where our research anticipates prominent divergence between winners and laggards over the coming forecast period. Each is grounded in the demand model, the regulatory perimeter, and the announced capacity pipeline.
01 / TRANSACTION REVENUE POSITION

Earn on every session, not every eleven years

Access and payment hardware replaces on an eleven year cycle into a base that access restrictions and space reallocation are deliberately shrinking, which is a poor foundation for anything. Payment and session platforms earn on each transaction and grow with usage rather than replacement, generating roughly 4 times the lifetime revenue per site that a hardware sale produces. Municipal consolidation is concentrating that revenue among fewer providers, and hardware suppliers without a platform position are watching it accrue somewhere else entirely.
02 / MUNICIPAL REVENUE ALIGNMENT

Sell enforcement to the budget it actually funds

Parking charges and penalties fund around 11% of a typical municipal transport budget, which makes compliance technology one of very few civic purchases with a payback a finance officer can verify inside a single year. Enforcement capability sold against that arithmetic reaches contract values around 3 times what parking operations budgets support. It requires being comfortable with a conversation cities find politically awkward, and suppliers who lead with sustainability framing end up addressing the specification while somebody else addresses the money.
03 / COLLECTION GAP HONESTY

Model the losses barrier removal actually creates

Recovery on unpaid barrier-free sessions runs about 83%, so roughly one session in 6 escapes entirely, and operators who built their case on gate maintenance savings alone have consistently been disappointed by what followed. Suppliers who model that loss honestly and price accordingly close conversions that optimistic proposals lose at the second review, and they avoid the reference damage a disappointed customer causes. Registry access agreements and pre-registration lift recovery materially, and they should be sold alongside the system itself.
04 / GRID CONNECTION TIMING

Secure the connection before the demand appears

A charging bay yields around 2.8 times a conventional space, and the constraint on installing one is grid connection capacity rather than charger cost, with lead times running into years in exactly the dense locations where the yield is highest. Operators and suppliers securing connections ahead of local vehicle adoption hold positions that competitors cannot replicate on any commercial timescale. It requires capital committed against genuinely uncertain local demand, which is the difference between participating in charging and watching somebody else do it.

Engagement Snapshot From the Field

A live engagement with an industry participant carrying material or product regulatory and market exposure ahead of a defining policy shift, showing how our research translates into a defensible multi-year portfolio strategy.
MARKET MINDS ADVISORY · CLIENT ENGAGEMENT SUMMARY
Parking Management Producer Strategic Portfolio Review and Transition Roadmap 2026·Investment Scenario on Parking Management Exposure Evaluation 2025-26
CLIENT PROFILE
A European city authority managing roughly 41,000 priced on-street spaces and eleven municipal car parks (client-reported, unverified by MMA), serving a population near 780,000. Parking charges and penalties contributed approximately 13% of the transport budget, and drivers were obliged to use four separate payment applications across the city depending on which operator ran the space.
STRATEGIC CHALLENGE
The authority had adopted a transport strategy reducing city centre parking by 15% over five years while its budget assumed parking income would grow (client-reported, unverified by MMA). A barrier-free conversion programme for the municipal car parks had also stalled after the first site recovered only 71% of unpaid sessions against a business case assuming 92%.
MMA APPROACH
MMA modelled parking income against the space reduction actually planned rather than against historical trends, which the authority had not reconciled. We examined the failed barrier-free conversion in detail, interviewed 15 authority staff, four suppliers and the national vehicle registry. Options were evaluated against net income after collection losses rather than against gross transaction volume or headline compliance rates.
KEY FINDINGS
  1. Planned space reduction and assumed income growth were arithmetically incompatible, and no part of the authority had ever reconciled the two documents against each other.
  2. The failed conversion recovered 71% because registry access for private operators had never been secured, while the authority's own enforcement achieved considerably better rates.
  3. Four payment applications produced a compliance rate roughly 9 points below comparable cities with a single mandated platform, which was costing more than the fragmentation saved.
  4. Charging installation at three municipal car parks would have replaced most of the income lost to space reduction, and grid capacity was available at two of the sites immediately.
CLIENT PROFILE
A European city authority managing roughly 41,000 priced on-street spaces and eleven municipal car parks (client-reported, unverified by MMA), serving a population near 780,000. Parking charges and penalties contributed approximately 13% of the transport budget, and drivers were obliged to use four separate payment applications across the city depending on which operator ran the space.
STRATEGIC CHALLENGE
The authority had adopted a transport strategy reducing city centre parking by 15% over five years while its budget assumed parking income would grow (client-reported, unverified by MMA). A barrier-free conversion programme for the municipal car parks had also stalled after the first site recovered only 71% of unpaid sessions against a business case assuming 92%.
MMA APPROACH
MMA modelled parking income against the space reduction actually planned rather than against historical trends, which the authority had not reconciled. We examined the failed barrier-free conversion in detail, interviewed 15 authority staff, four suppliers and the national vehicle registry. Options were evaluated against net income after collection losses rather than against gross transaction volume or headline compliance rates.
KEY FINDINGS
  1. Planned space reduction and assumed income growth were arithmetically incompatible, and no part of the authority had ever reconciled the two documents against each other.
  2. The failed conversion recovered 71% because registry access for private operators had never been secured, while the authority's own enforcement achieved considerably better rates.
  3. Four payment applications produced a compliance rate roughly 9 points below comparable cities with a single mandated platform, which was costing more than the fragmentation saved.
  4. Charging installation at three municipal car parks would have replaced most of the income lost to space reduction, and grid capacity was available at two of the sites immediately.
RECOMMENDED STRATEGY
Phase 1: Reconcile the transport strategy and the budget explicitly, since planned space reduction and assumed income growth cannot both be delivered as currently written. Phase 2: Mandate a single payment platform through procurement, since fragmentation is costing more in lost compliance than it saves in contracting flexibility. Phase 3: Convert car parks to barrier-free only where authority enforcement handles recovery, and install charging at the two sites with available grid capacity now.
OUTCOME
The authority mandated a single platform and compliance rose by roughly 8 points within a year (client-reported, unverified by MMA). Charging installation at two sites produced income exceeding the loss from the first phase of space reduction, and the barrier-free conversion programme resumed under authority-managed enforcement rather than operator recovery.

Frequently Asked Questions

Foundational context covering the market sizes, CAGR, scope, country, region and competition that inform every finding below. This section is provided to cover basics and most often pre-purchase conversations, answered from the MMA Primary Research Dataset.

What is the current size of the Parking Management Market?

The market was worth USD 6.8 billion in 2025 and reaches USD 7.37 billion in 2026. Payment platforms and enforcement services account for most of the growth.

How large will the Parking Management Market be by 2036?

MMA forecasts USD 16.51 billion by 2036, an expansion of 2.24 times over the forecast period. That represents USD 9.14 billion of incremental annual revenue against 2026.

What is the CAGR for the Parking Management Market 2026 to 2036?

The base case is 8.4% compound annual growth, with a bull case at 9.6% and a bear case at 7.2%. How far cities reduce parking capacity separates the three scenarios.

Which segment is growing fastest?

Barrier-free licence plate recognition grows at 12.6%, half again the market rate of 8.4%. Gates are the largest maintenance line in most facilities and removing them improves throughput.

Who are the major companies in the Parking Management Market?

SKIDATA, Flowbird, EasyPark Group, Verra Mobility and Amano lead on measured equipment, software and services revenue. Together they hold roughly 27% across quite different business models.

Which country is growing fastest?

India grows fastest at 13.4%, on formalisation of parking that was previously informal, which creates first-time equipment and platform demand rather than any replacement cycle.

Report Segmentation Architecture

The full report scope spans multiple orthogonal segmentation dimensions, with cross-tabulated demand data provided for each dimension pair. Coverage extends further to regional breakdowns, trend trajectories, and the competitive detail needed to support segment-level decision-making.

By Primary Market Dimension

  • Gated Access and Revenue Control Equipment
  • Barrier-Free Licence Plate Recognition Systems
  • Mobile Payment and Session Management Platforms
  • Enforcement and Compliance Services
  • Occupancy Guidance and Sensing
  • Charging-Integrated Parking Management

By End-Use Industry

  • Municipal On-Street Parking
  • Commercial Off-Street Car Parks
  • Airports and Transport Hubs
  • Retail and Shopping Centres
  • Offices and Business Parks
  • Residential and Permit Schemes

By Commercial Dimension

  • Municipal Procurement Contracts
  • Commercial Operator Purchasing
  • Property Owner Installations
  • Transaction Based Platform Revenue
  • Outsourced Enforcement Services
  • Concession and Managed Contracts

By Region

  • Western Europe
  • North America
  • East Asia
  • South Asia and Pacific
  • Latin America
  • Middle East and Africa
  • Eastern Europe

Scope, Methodology, and Coverage

Every figure in this report is reproducible from documented input assumptions. The scope below maps the historical period, the forecast horizon, the segmentation dimensions, and the countries covered, alongside the underlying primary and qualitative methodology.
Historical Period
2020 to 2025
Forecast Period
2026 to 2036
Base Year
2025 (USD billions; MMA Primary Research Dataset, September 2026)
Market Definition
This market covers systems, software and services used to control access to, charge for and enforce parking, spanning gated access and revenue control equipment, barrier-free licence plate recognition systems, mobile payment and session management platforms, enforcement and compliance services, occupancy guidance and sensing, and charging-integrated parking management. Revenue is measured as equipment shipment value, software and platform revenue, and directly attributable enforcement and managed service value at supplier level. Parking charges collected from drivers, parking property ownership and operation, general traffic management and tolling systems, and standalone electric vehicle charging hardware sold outside parking facilities are excluded.
Quantitative Units
USD billions, equipment, platform and attributable service revenue
Segmentation Dimensions
System and service type, facility type, commercial model, region
Regions Covered
Western Europe, North America, East Asia, South Asia and Pacific, Latin America, Middle East and Africa, Eastern Europe
Countries Covered
Netherlands, United Kingdom, Germany, France, Spain, Italy, Sweden, Norway, Denmark, Belgium, Poland, Czechia, Hungary, United States, Canada, Mexico, Brazil, Chile, Colombia, Japan, South Korea, China, Taiwan, Singapore, India, Australia, United Arab Emirates, Saudi Arabia, South Africa
Key Companies Profiled
SKIDATA, Flowbird, EasyPark Group, Verra Mobility, Amano, Scheidt and Bachmann, Designa, HUB Parking Technology, SWARCO, PayByPhone, Passport, Genetec, Nedap, Cleverciti, Q-Free, Kapsch TrafficCom, Conduent, Parkopedia, APCOA, Indigo
Quantitative Methodology
Primary survey, n=3,800 respondents, Q4 2025, six countries; demand-side model with trade association cross-validation
Qualitative Methodology
47 expert interviews, Q4 2025; applied to validate demand model assumptions, identify emerging dynamics, and assess competitive positioning
Report Format
PDF and XLSX data workbook (Word format preview document)
Publisher
Market Minds Advisory
Report Code
MMA-2026-CON-631
Published
September 2026
Contact
sales@marketmindsadvisory.com | www.marketmindsadvisory.com

Purchase the full Parking Management Market Report (2026 to 2036).

The full MMA report examines the contradiction between municipal parking revenue and the policies reducing the driving that produces it, and what that means for where technology spending goes. It sizes the market to 2036 across six system and service types, seven regions and 29 countries, with segment growth rates and regional demand mechanisms set out in full. Competitive analysis covers 20 participants assessed on measured equipment, software and services revenue, including moat and risk assessment for the two leaders. The report quantifies cost structure, collection recovery economics and margin architecture across three portfolio tiers. It closes with four strategic verdicts and an anonymised city authority engagement.
Six system and service types sized to 2036
Seven regions with demand mechanism analysis
Twenty participants on consistent revenue basis
Collection recovery and processing cost benchmarks
Margin architecture across three portfolio tiers
Anonymised city authority parking strategy engagement

Built For The People Who Decide

From boardroom strategy to bench-side execution, this report is read cover-to-cover by leaders shaping the next decade of their industry, turning demand scenarios, market dynamics and valuation benchmarks into decisions.
CXOs/ Presidents/ VPs/ Managers
M&A and Corporate Development
Strategy Teams and R&D Heads
Procurement and Product Directors
Regulatory and Compliance Leaders
Investor Relations and Equity Analysts