Market Minds Advisory
Paper Pigments Market

Paper Pigments Market: Lightweight Coating Demand Meets Mineral Supply Consolidation

Lightweight coated packaging grades and plastic pigment substitution are pulling paper pigment volume away from traditional filler-grade calcium carbonate, forcing mineral processors to defend legacy paper mill contracts while chasing specialty coating capacity.

Lead Analyst

Bilal Shaikh

Published

September 2026

Make Smarter Decisions with Customized Research Insights

Request a free sample report and evaluate market opportunities, growth trends, and competitive dynamics relevant to your business needs.

2025 MARKET VALUE$9.8BMarket Size 2025
2036 FORECAST VALUE$15.1BBase Case , 2026 to 2036
CAGR 2026 TO 20364.0 %Bull 5.2% / Bear 2.8%
INCREMENTAL OPPORTUNITY$4.9BNet 10- year value creation
EXPANSION MULTIPLE1.48x2036 value over 2026 base
Strategic Levers
M&A Pipeline
Regional Outlook
Country Rankings
Competitive Intelligence
Segmental Deep-dive
Call-Us : 91 93563 13602

Executive Snapshot and Market Trajectory

Paper pigments are shifting from commodity filler volume toward specialty coating formulations as packaging grades replace declining graphic paper demand across most developed printing markets. Producers unable to redirect capacity toward packaging-grade formulations are losing volume steadily to more specialized rivals. Reformulation investment is accelerating in response.
Lightweight coated packaging board and premium print applications are pulling demand toward precipitated calcium carbonate and engineered plastic pigments, both of which command materially better margin than ground calcium carbonate filler grades. East Asia has emerged as the largest single regional market given China's dominant paper and packaging manufacturing base and continued capacity investment across the region. Producers there have also been quickest to add precipitated calcium carbonate capacity dedicated to packaging board coating.
Competitively, the category remains moderately concentrated among a handful of global mineral processors that also supply coatings and plastics industries. Declining graphic paper volume in mature print markets is forcing producers to redirect capacity toward packaging board and specialty coating grades to defend total volume. Consolidation among mid-sized regional processors is expected to continue as scale increasingly determines who can serve multinational packaging board customers. Scale favors majors here.
Market Definition
This report covers mineral and synthetic pigments used in paper coating and filling, including calcium carbonate, kaolin, titanium dioxide, talc, and plastic pigments. It excludes pulp bleaching chemicals and paper-specific process additives unrelated to pigmentation.
Base Year Value
$9.8B in 2025 (MMA Primary Research Dataset, August 2026)
Forecast Period
2026 to 2036, eleven discrete annual values
CAGR
4.0% base case. Bull 5.2%. Bear 2.8%.
Fastest Growth Segment
Plastic Pigments (Polystyrene-Based): 7.0% CAGR
Fastest Growth Country
India: 6.5% CAGR
Fastest Growth Region
South Asia and Pacific: 6.0% CAGR
Largest Region
East Asia: 30% of 2025 global value
Market Leaders
Omya AG, Imerys S.A., Minerals Technologies Inc., LKAB Minerals, Huber Engineered Materials. Source: MMA Analysis based on company annual reports.
Primary Survey
n=3,800 procurement and R&D decision-makers, Q4 2025, six countries
Methodology
Demand-side build-up, cross-validated against public data, 47 expert interviews

Paper Pigments Market Forecast Scenarios

paper-pigments-market-trends-size-forecast-scenario-1787558506628
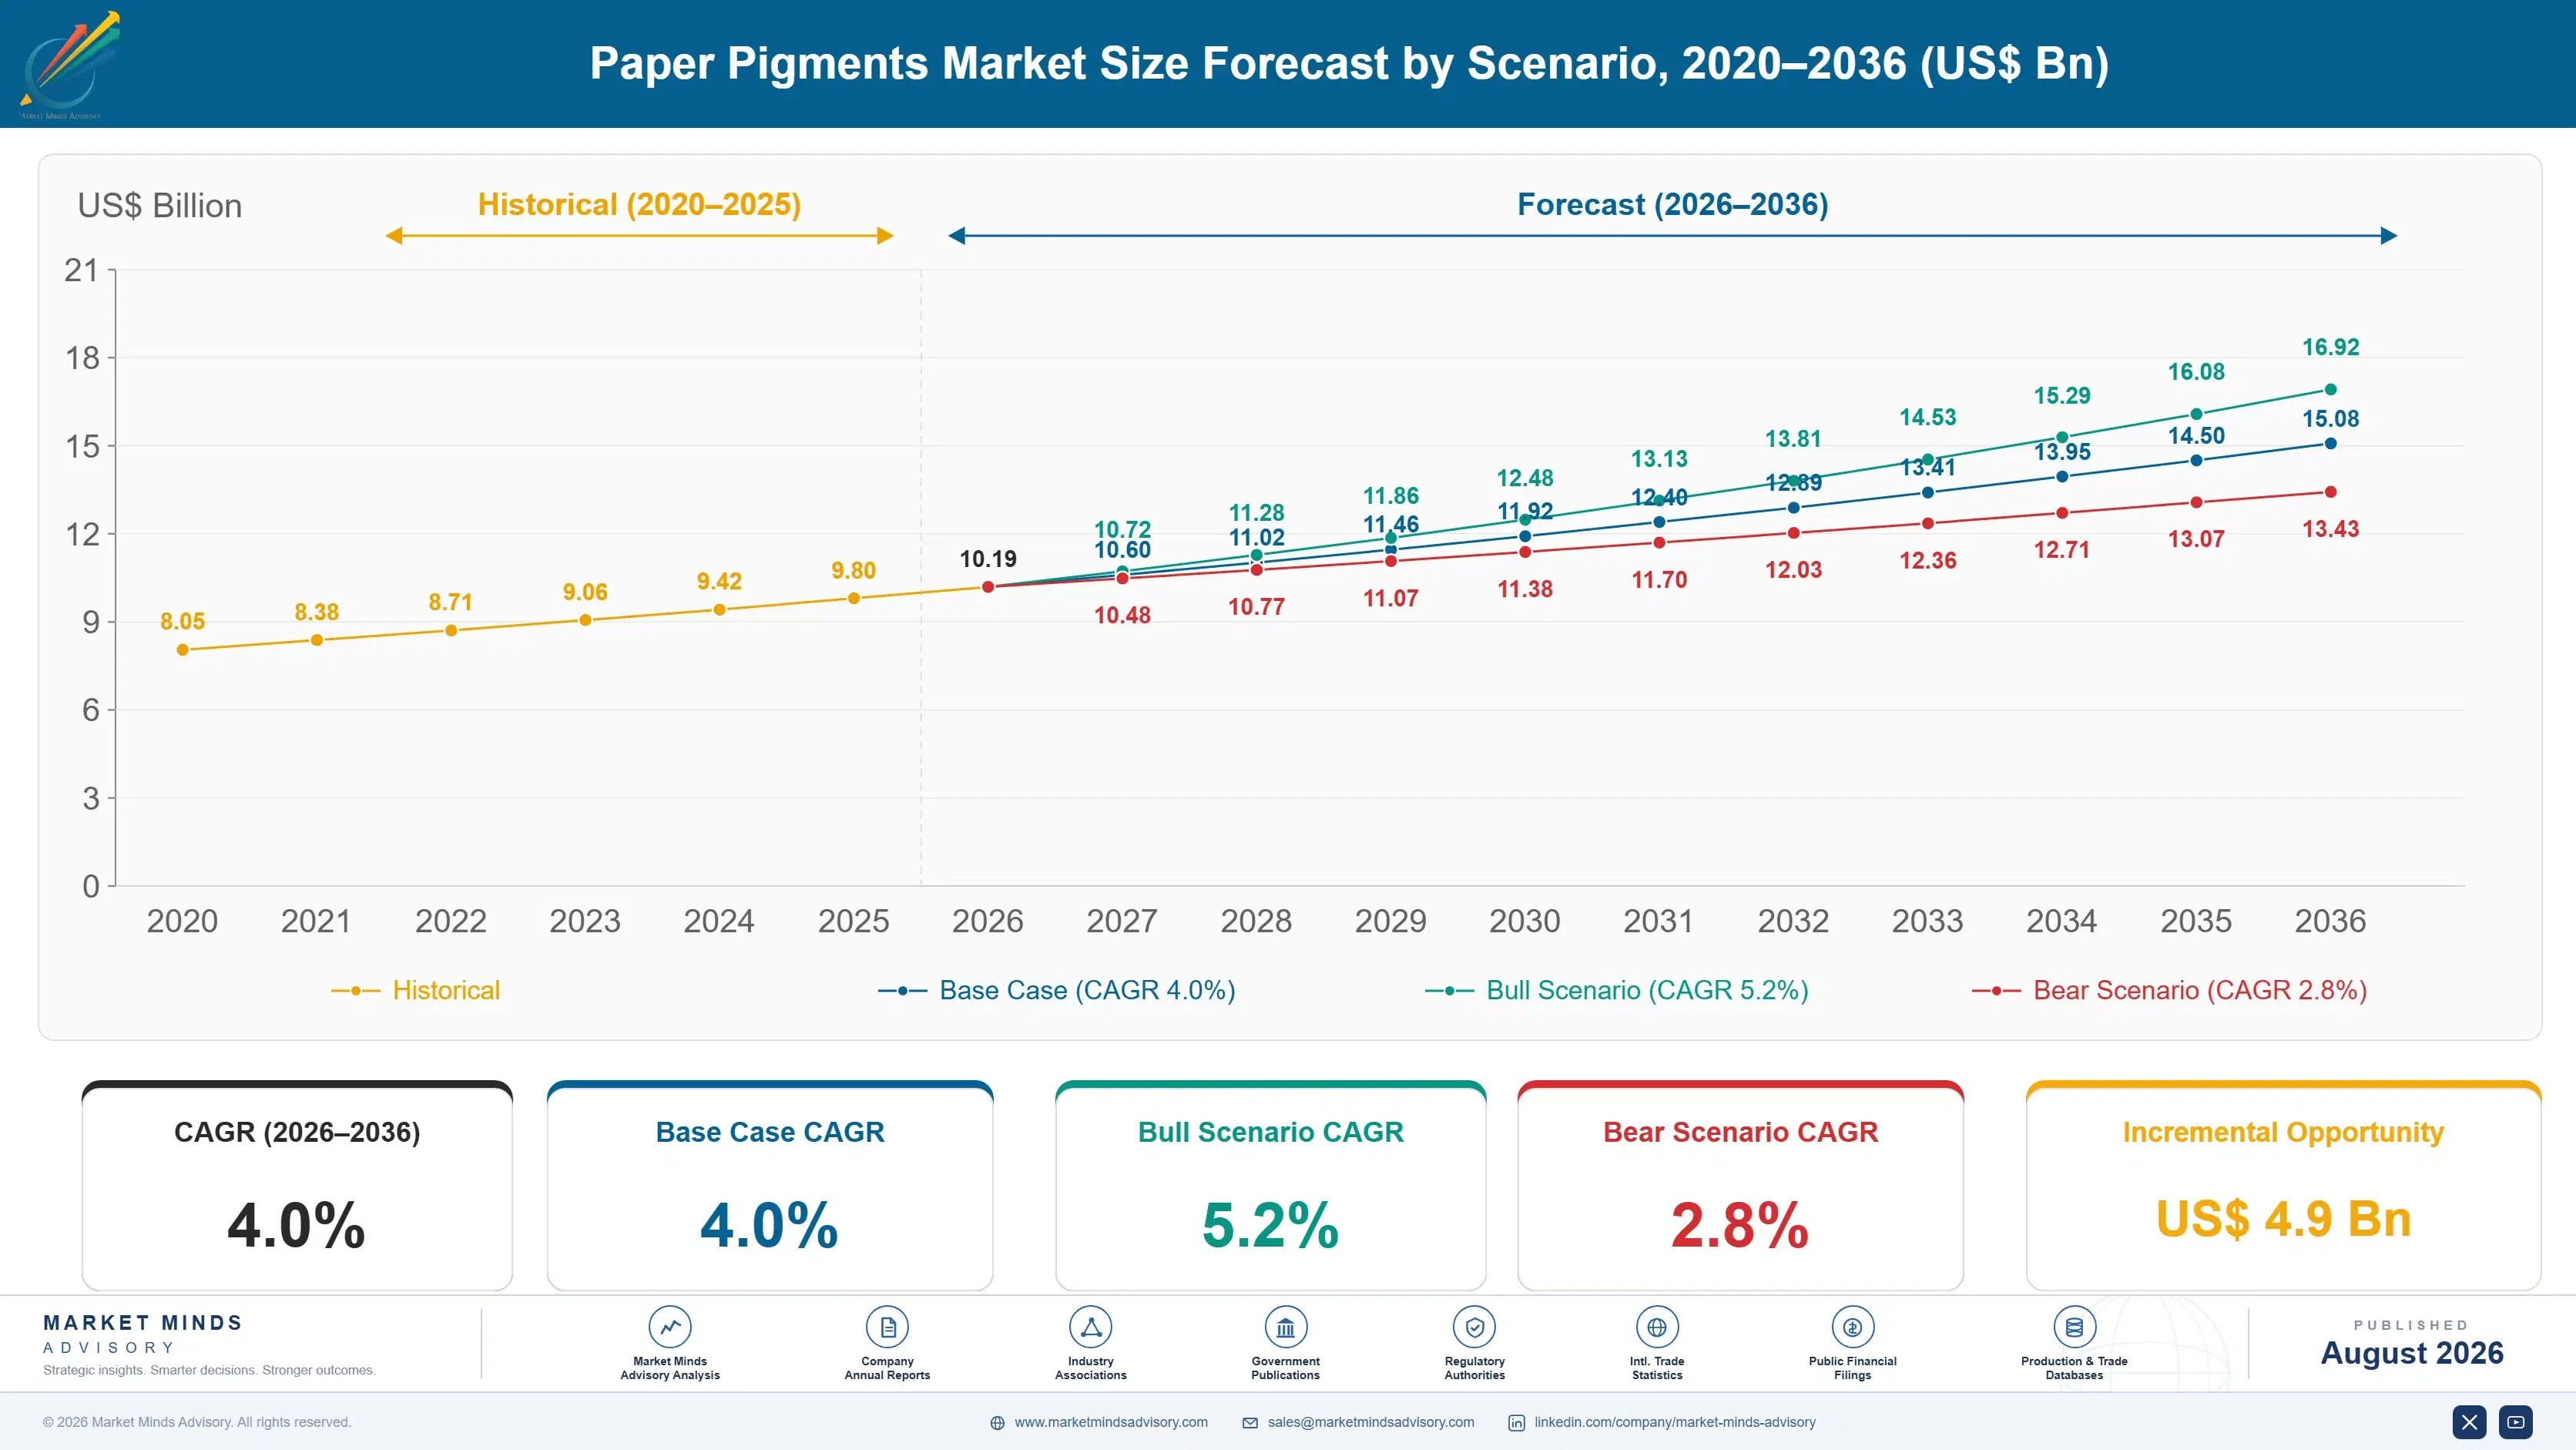
Between 2020 and 2025, paper pigment volume grew modestly as declining graphic paper demand in mature print markets offset steady packaging board growth, leaving the category's overall trajectory considerably flatter than adjacent specialty mineral categories. Producers that redirected capacity toward packaging board coatings during this period are better positioned for the growth phase now underway.
The base case assumes 4.0 percent annual growth to 2036, anchored by three mechanisms: packaging board capacity expansion across East Asia absorbing pigment volume previously destined for graphic paper, precipitated calcium carbonate substitution improving coating performance economics for mill operators, and plastic pigment adoption expanding in premium print and specialty packaging applications requiring superior opacity. Capacity investment announcements across East Asia and South Asia are reinforcing each of these mechanisms simultaneously.
A bull case near 5.2 percent depends on packaging board capacity investment accelerating faster than currently planned across East Asia and South Asia. The bear case near 2.8 percent assumes graphic paper decline outpaces packaging growth, pressuring filler-grade volume across mature print markets specifically. Both scenarios hinge on how quickly packaging board capacity can absorb pigment volume freed up by graphic paper decline.

Coating Economics and Packaging Substitution Dynamics

Paper pigments sit at the intersection of declining graphic paper demand and expanding packaging board capacity, and that tension is reshaping which mineral grades producers prioritize. Precipitated calcium carbonate and engineered plastic pigments increasingly command the margin that ground calcium carbonate filler grades cannot match, and mill operators are rewarding suppliers who can deliver both coating performance and consistent supply reliability across large-volume packaging contracts.
MARKET CONCENTRATION (CR5)42%Top five mineral processors together hold this combined share
AVERAGE SELLING PRICE$310/tonReflects blended pricing across coating and filler grades nationally
TOP PRODUCING COUNTRY SHAREChina 26%Largest single national source of paper pigment output
FEEDSTOCK COST SHARE38%Limestone and kaolin mining costs dominate production expense structure
CAPACITY UTILIZATION RATE78%Reflects current mineral processing plant operating rate broadly
TRADE INTENSITY24% cross-borderShare of output moving through international mineral trade channels
Commercially, the category rewards producers with integrated mining and processing capability: mineral rights, processing plant proximity to paper mills, and logistics cost all matter more here than pure formulation chemistry. Producers straddling both filler and specialty coating grades capture materially better negotiating position with large multinational packaging board customers than single-grade specialists limited to one mineral type.
Over the next decade, continued graphic paper decline and packaging board capacity investment across East Asia will keep reshaping regional demand patterns. Producers slow to redirect mining and processing capacity toward packaging-grade minerals risk losing volume to more specialized competitors already positioned in growth markets. Consolidation among mid-sized regional processors is likely to accelerate as scale increasingly determines access to the largest multinational packaging contracts.
"Calcium carbonate used to be a commodity nobody thought about twice. Now coating performance decides which mill gets your material, and producers still selling on price alone are losing that argument."
Director, Industrial Minerals and Materials Practice · MMA Chemicals and Materials Practice · August 2026

Market Trends

Precipitated Calcium Carbonate Substitution in Packaging Coating

Paper mills producing lightweight coated packaging board have shifted meaningfully toward precipitated calcium carbonate since 2023, since its finer particle structure delivers better opacity and print quality at lower basis weight than ground calcium carbonate can achieve. This substitution trend is expanding PCC capacity investment across East Asia specifically, where packaging board manufacturing has grown fastest, and mineral processors without dedicated PCC production lines are increasingly losing large packaging board contracts to competitors that invested earlier in this capability. Retailers specifying premium packaging finishes are reinforcing this shift further. Capacity utilization has climbed accordingly.
Market Impact: Adds 18% new packaging board capacity
Plastic Pigment Adoption in Premium Print Applications

Engineered plastic pigments, primarily hollow polystyrene spheres, are gaining share in premium print and specialty packaging applications requiring superior opacity and brightness beyond what mineral pigments alone can deliver. MMA's primary survey found roughly 28 percent of premium packaging producers now specify plastic pigment blends in their coating formulations, up meaningfully from prior years, and several major coating chemical suppliers have expanded dedicated plastic pigment production capacity in response to this rising specification rate. Coating chemical suppliers are racing to secure long-term plastic pigment supply agreements to meet this demand.
Market Impact: Lifts lightweight specification share to 33%

Market Opportunities and Growth Drivers

Packaging Board Capacity Expansion Across East Asia

China and Southeast Asian paper producers have added roughly 18 percent new packaging board capacity since 2023, directly benefiting pigment suppliers positioned to serve that expanding coating demand. This capacity investment is redirecting mineral pigment volume that would otherwise decline alongside graphic paper, and producers with established relationships at these expanding mills are capturing disproportionate share of the incremental packaging board pigment demand emerging across the region. Established mill relationships are proving decisive in capturing this incremental packaging board demand. Smaller suppliers lacking those relationships face a steeper path to capturing this growth.
Market Impact: Cuts graphic paper demand 4 percent

Rising Specification of Lightweight Coating Formulations

MMA's primary survey found 33 percent of packaging board producers now actively specify lightweight coating formulations to reduce basis weight and shipping cost, up from roughly 19 percent five years earlier, pushing pigment suppliers to reformulate toward finer particle-size mineral grades. Several major packaging board producers have begun requiring documented coating performance data before approving new pigment suppliers, further accelerating this specification trend across the industry. That documentation requirement is raising the qualification bar for smaller regional pigment suppliers. Compliance costs are rising for smaller suppliers as a result. Adoption keeps broadening.
Market Impact: Adds 38 percent mining cost exposure

Market Restraints and Challenges

Persistent Decline in Graphic Paper Demand

Graphic paper consumption in mature print markets has declined roughly 4 percent annually since 2020 as digital media substitution continues, directly compressing filler-grade calcium carbonate volume that historically anchored category demand. The root cause is a lasting generational shift away from printed media consumption that shows no sign of reversing, and producers unable to redirect capacity toward packaging board applications face shrinking addressable volume. Some producers are mitigating this by converting graphic-paper-focused processing lines toward packaging board specifications instead. Regional impact varies considerably depending on how quickly local packaging board capacity absorbs displaced pigment volume.
Market Impact: Expands PCC capacity by 25 percent

Limestone and Kaolin Mining Cost Volatility

Limestone and kaolin mining costs represent roughly 38 percent of production expense, and energy costs tied to mineral processing have swung considerably since 2022 amid broader industrial energy price volatility affecting major mining regions. The underlying driver is mineral processing's energy intensity, which producers cannot easily reduce without capital investment in more efficient grinding and drying equipment. Some producers are responding by investing in energy-efficient processing technology to reduce long-term exposure to this volatility. Smaller processors lacking capital for this upgrade remain more exposed to ongoing energy cost swings. Energy costs remain the single largest variable.
Market Impact: Lifts plastic pigment specification to 28%
3 additional market trends, 3 additional growth drivers, and 4 additional restraints and challenges are covered in the full report. Contact sales@marketmindsadvisory.com to access the complete intelligence.

Segment CAGR and Growth Architecture

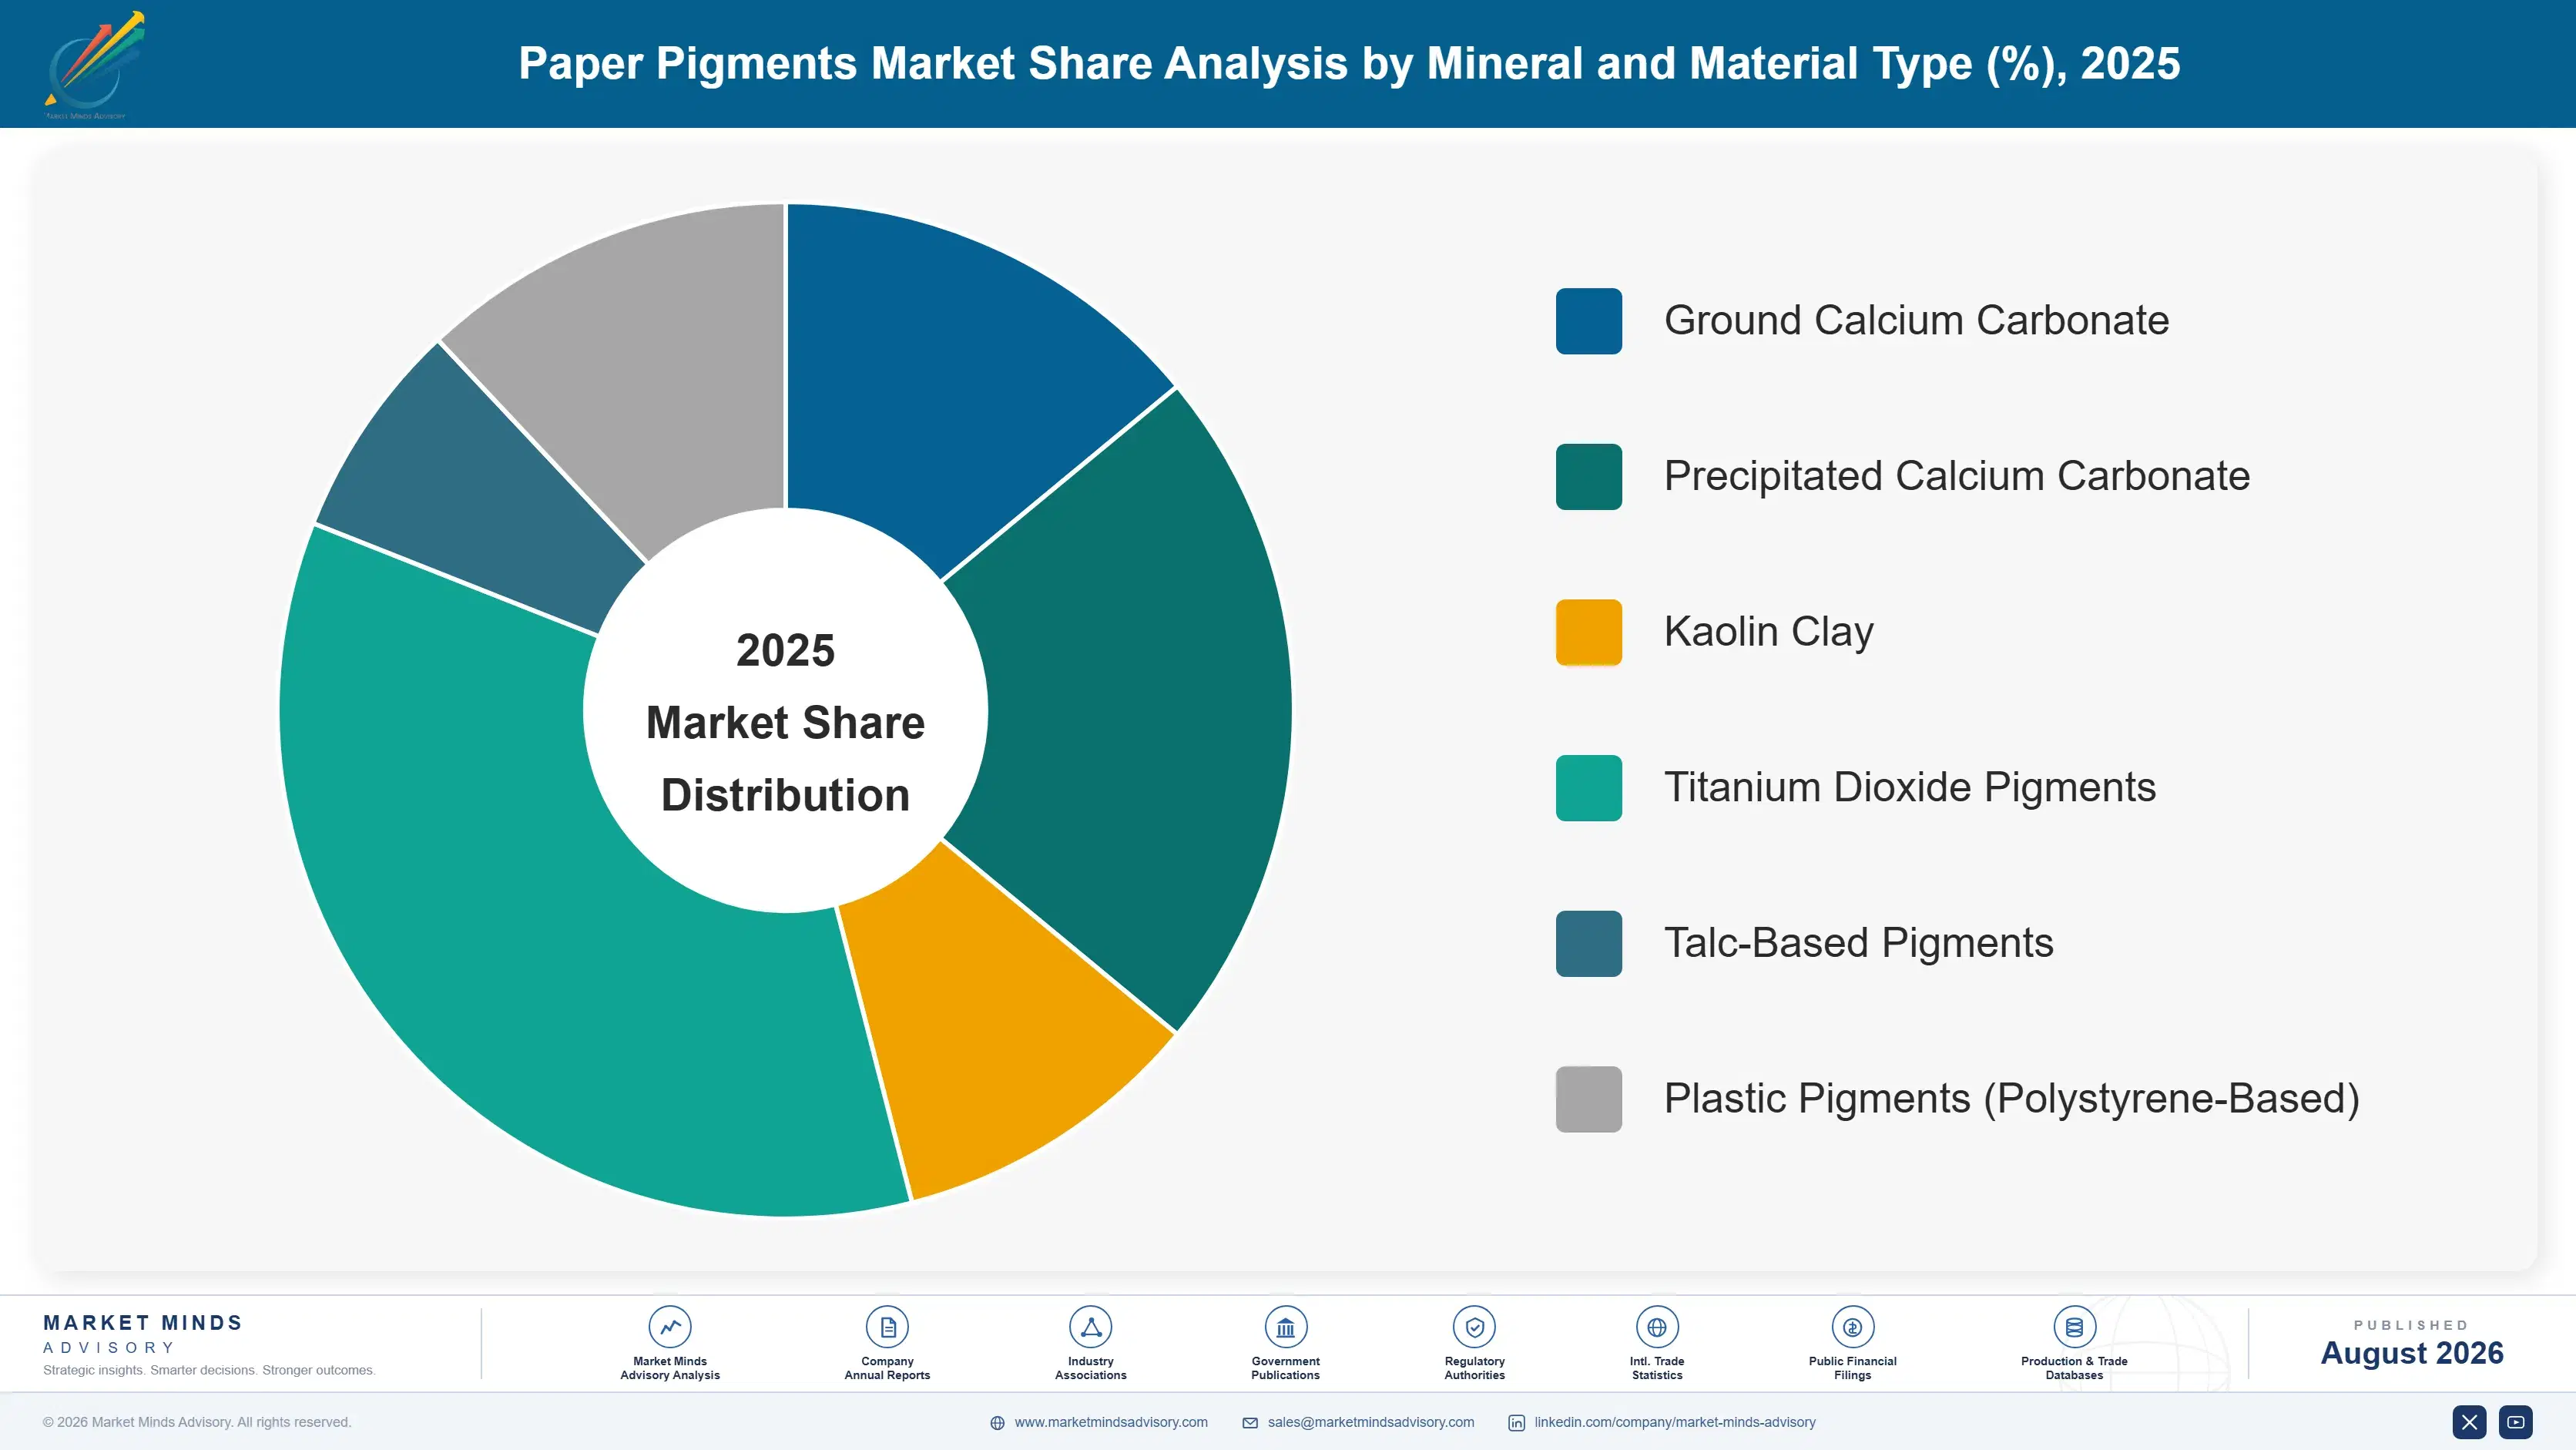
MMA segments the paper pigments market by mineral and material type, the classification producers, mills, and buyers actually use for procurement and formulation decisions across calcium carbonate, kaolin, titanium dioxide, talc, and plastic pigment grades, rather than mixing in application or process logic. This lens keeps upstream mineral sourcing and downstream coating application decisions cleanly separated throughout the analysis.
paper-pigments-market-trends-market-share-analysis-1787558507164

Plastic Pigments (Polystyrene-Based)

This segment covers hollow polystyrene sphere pigments used in premium print and specialty packaging coating applications requiring superior opacity and brightness beyond what mineral pigments alone deliver. Growth here outpaces every other segment because premium packaging producers increasingly specify plastic pigment blends to meet brand-owner brightness and print-quality requirements, and coating chemical suppliers have expanded dedicated production capacity in response. Manufacturing plastic pigments requires distinct polymer chemistry expertise separate from mineral processing, favoring producers already active in the broader specialty chemicals space and creating a meaningful barrier for mineral-only processors trying to enter this segment quickly. Several major coating chemical suppliers have signed long-term supply agreements with polystyrene pigment manufacturers specifically to secure capacity ahead of anticipated demand growth.
CAGR 7.0%

Precipitated Calcium Carbonate (PCC)

Precipitated calcium carbonate is the second-fastest growing segment, favored by packaging board producers for its finer particle structure and superior opacity performance at lower basis weight than ground calcium carbonate can achieve. Producers have invested heavily in dedicated PCC production lines since 2023 to capture packaging board demand shifting away from graphic paper applications. This segment commands meaningfully better margin than ground calcium carbonate filler grades, since packaging board customers show less price sensitivity than graphic paper mills historically did, giving producers investing in PCC capacity materially better economics per ton sold. Several major producers are now marketing PCC capacity investment as a strategic differentiator when competing for new multinational packaging board supply contracts.
CAGR 5.5%
Full segment breakdown across 6 segments available in the complete report.

Regional Architecture and Country Demand Map

East Asia leads on paper and packaging manufacturing scale, while South Asia and Pacific posts the fastest growth as packaging capacity expands rapidly across the wider region. North America and Western Europe trail on volume given ongoing graphic paper decline. Latin America and Eastern Europe remain the smallest markets tracked.

North America

US paper mills have consolidated meaningfully over the past decade as graphic paper demand declined, concentrating remaining pigment demand among fewer, larger integrated packaging board operations. Canada's smaller but stable kraft packaging sector supplements US demand, particularly for filler-grade calcium carbonate. Producers here have been quicker than most regions to redirect processing capacity toward packaging board coating grades, reflecting the severity of graphic paper decline in this market, and several major mineral processors have announced further capacity conversion plans through 2028. Producers with strong packaging board relationships are using that credibility to negotiate premium coating supply contracts ahead of smaller regional competitors still focused primarily on legacy filler grades. That repositioning is expected to continue through the decade.
Share: 24% | CAGR: 3.5% (2026 to 2036)

Western Europe

German, French, and Scandinavian paper mills have carried some of the world's most advanced coating technology for decades, and EU packaging sustainability regulation introduced since 2023 has pushed faster adoption of recyclable coating formulations here than in most other regions tracked in this report. Graphic paper decline has been steeper here than in North America, forcing faster capacity conversion toward packaging board grades. Nordic pulp and paper integration gives regional producers unusually tight control over pigment sourcing logistics. Producers here have also begun disclosing pigment carbon footprint data on request, a transparency standard not yet common in most other regions covered in this report. Recyclability requirements are tightening further each year across most member states.
Share: 20% | CAGR: 2.5% (2026 to 2036)
Regional intelligence for 5 additional markets available in the complete report: East Asia, South Asia and Pacific, Latin America, Middle East and Africa, Eastern Europe. Contact sales@marketmindsadvisory.com.
paper-pigments-market-trends-country-cagr-analysis-1787558507685

Coating Depth and Capacity Redirection Priorities

Producers seeking margin expansion beyond volume growth are pursuing four commercial levers: PCC and plastic pigment capacity investment, packaging board contract development, export capacity expansion, and mining integration that captures more value than selling standard filler-grade minerals alone provides. These levers matter most for mid-sized processors competing against integrated majors, since coating capability increasingly determines which suppliers mills choose.

Precipitated Calcium Carbonate Capacity Investment Program

Producers investing in dedicated PCC production lines are capturing an additional 15 to 20 percent margin premium over ground calcium carbonate filler grades, driven by packaging board customers' willingness to pay for superior coating performance at lower basis weight. This lever requires significant capital investment in precipitation reactor infrastructure, but it opens access to premium packaging board contracts that filler-grade producers cannot compete for, and several major processors have already secured multi-year supply agreements with expanding packaging board mills specifically. Retailers specifying premium coated packaging are reinforcing that demand further each year.
Market Impact: Adds 15 to 20 percent margin premium overall

Plastic Pigment Production Line Extension Strategy

Producers extending into plastic pigment manufacturing are accessing premium print and specialty packaging applications commanding materially better margin than standard mineral pigments, capturing an estimated 20 percent price premium according to MMA's primary survey. This lever requires distinct polymer chemistry capability separate from mineral processing, favoring producers already active in specialty chemicals, but the payoff has proven substantial for early movers securing dedicated supply agreements with premium coating chemical formulators. Several coating chemical formulators have expanded purchasing specifically to secure that supply. Retailers specifying premium finish quality are reinforcing demand for this capability further.
Market Impact: Captures roughly 20 percent price premium industry-wide overall

Direct Packaging Board Mill Contract Development

Producers bypassing distributor intermediaries by contracting directly with expanding packaging board mills are capturing 10 to 15 percent better margin per ton than through standard wholesale distribution channels. This requires dedicated technical account management and reliable large-volume supply, which favors larger integrated producers, but mid-sized processors are increasingly forming regional supply consortiums to meet the volume commitments large packaging board mills typically require before signing direct contracts. Consistency across large-volume orders matters considerably to these mill customers. Several mid-sized producers have formed regional consortiums specifically to meet these volume thresholds.
Market Impact: Improves per-ton margin by 10 to 15 percent

Mineral Reserve Integration and Mining Consolidation

Producers acquiring or leasing dedicated limestone and kaolin mineral reserves directly are removing exposure to third-party mining cost volatility entirely for a meaningful share of total feedstock requirements going forward. This strategy demands significant upfront capital but has proven especially attractive to the largest processors already operating integrated mining and processing operations across multiple countries, securing roughly 30 percent of their feedstock needs through owned reserves rather than third-party purchase agreements. That security matters increasingly as third-party mining costs keep rising. Several major processors are pursuing further acquisitions to extend this integration advantage.
Market Impact: Secures roughly 30 percent of feedstock needs directly

Who Controls the Margin Pool

The top five paper pigment producers hold roughly 42 percent combined share, a moderate-to-high concentration level reflecting the capital intensity of mineral processing infrastructure. Omya and Imerys operate at a scale challengers cannot easily match, but the gap to mid-sized specialty coating producers is narrowing as PCC and plastic pigment capability increasingly rivals raw mineral reserve scale in mill negotiations. Regional Chinese players are gaining ground on cost.
Competitive activity currently centers on three dimensions: expanding precipitated calcium carbonate and plastic pigment production capacity to capture packaging board demand, securing direct long-term supply contracts with expanding East Asian packaging mills, and integrating mineral reserve ownership to reduce feedstock cost exposure. Producers are also racing to establish processing capacity in Southeast Asia ahead of competitors. That race is intensifying in Southeast Asian corridors.

Emerging pressure is coming from regional Chinese mineral processors expanding domestic capacity rapidly, which compete on cost and proximity to packaging mills rather than global brand recognition, and from specialty plastic pigment manufacturers entering from adjacent coatings industries. Rankings could shift meaningfully over the next several years if these challengers keep converting share from producers slower to redirect capacity toward packaging grades. Investors are watching this closely.
paper-pigments-market-trends-company-positioning-matrix-1787558508209

Competitive Moat and Risk Dimensions

OMYA AG

Moat: Global Mineral Reserve Scale

Omya controls extensive limestone and calcium carbonate mineral reserves across dozens of countries, giving it feedstock cost advantages regional competitors cannot replicate quickly. This scale lets it supply both filler-grade and PCC formulations from the same integrated operations, spreading capital cost over far greater volume than smaller producers can achieve, and it commands leverage major mills that specialty producers lack.
OMYA AG

Risk: Slower Plastic Pigment Pivot

Omya's mineral processing heritage creates organizational inertia that slows its pivot toward plastic pigment manufacturing, a capability requiring distinct polymer chemistry expertise outside its core competency. Premium packaging customers increasingly specify plastic pigment blends for superior brightness, which puts Omya at a competitive disadvantage in this fastest-growing segment despite its mineral processing scale advantage.
MINERALS TECHNOLOGIES INC.

Moat: PCC Technical Expertise

Minerals Technologies built deep precipitated calcium carbonate process engineering expertise over decades, giving it technical credibility with packaging board mills that newer PCC entrants struggle to replicate quickly. Its on-site PCC satellite plant model, embedding production directly at customer mill locations, creates switching costs that lock in long-term supply relationships more durably than standard commercial contracts.
MINERALS TECHNOLOGIES INC.

Risk: Limited Plastic Pigment Presence

Minerals Technologies' relatively limited plastic pigment product line constrains its ability to capture premium print applications increasingly demanding synthetic pigment blends alongside mineral formulations. This leaves growth concentrated in PCC capacity expansion alone, exposing the company more directly to packaging board cycle risk than more diversified competitors.

Players Tracked

Prominent Players

Omya AG
Imerys S.A.
Minerals Technologies Inc.
LKAB Minerals
Huber Engineered Materials

Other Key Players

Sibelco
KaMin LLC
Thiele Kaolin Company
Nordkalk Corporation
Sinocalcite
Longcliffe Quarries
Calcium Products Inc
Schaefer Kalk
Carmeuse Group
Lhoist Group
Mississippi Lime Company
China Kaolin Co Ltd
Guangxi Comephy Company
Ashapura Minechem
Golcha Associated Malanpur

Recent Developments

APRIL 2025

Omya Expands Precipitated Calcium Carbonate Capacity in China

Omya announced expanded precipitated calcium carbonate production capacity at its Chinese satellite plant network, aiming to secure additional packaging board mill supply contracts across the region. The expansion targets mills converting from graphic paper toward packaging board production specifically. Analysts expect competitors to respond with similar capacity announcements within months.
Signal: Confirms East Asian packaging demand is driving capacity investment across the industry. Rivals are expected to follow with comparable investments.
NOVEMBER 2024

Minerals Technologies Signs Long-Term Mill Supply Agreement

Minerals Technologies signed a long-term on-site PCC supply agreement with a major Southeast Asian packaging board mill, embedding dedicated production capacity directly at the customer's facility. The agreement is a long-term supply contract, not an acquisition or joint venture. Terms of the multi-year commitment were not fully disclosed publicly.
Signal: Shows on-site satellite production remains the preferred model for securing large mill contracts. Expect similar on-site deals to follow.
JANUARY 2025

Imerys Acquires Regional Kaolin Processing Assets

Imerys completed the acquisition of a mid-sized kaolin processing operation in Southeast Asia, expanding its regional mineral reserve base and processing capacity to serve growing packaging board demand in the area directly. Financial terms of the transaction were not disclosed publicly by either party. Scale mattered here.
Signal: Signals global majors are pursuing regional acquisition to secure mineral reserve access. Further consolidation in Southeast Asia appears increasingly likely.

Mineral Extraction and Energy Cost Pressure

Limestone and kaolin mining costs represent roughly 38 percent of processor cost of goods sold, sourced primarily from dedicated mineral reserves in Europe, North America, and China. Energy costs tied to grinding, drying, and precipitation processing add a further meaningful slice of total input cost that less energy-intensive specialty chemical categories simply do not carry.
The 2022 to 2023 European energy price cycle pushed mineral processing energy costs up roughly 45 percent year over year according to IEA data, forcing several smaller processors to absorb margin compression rather than pass costs through to price-sensitive packaging board buyers. Natural gas price spikes tracked by the European Commission during the same period compounded pressure on drying and calcination processes specifically, since these steps are especially energy intensive.

Exposure varies considerably by player type: producers with owned mineral reserves and modern energy-efficient processing equipment are materially better insulated than those relying on third-party mineral purchases and older equipment, and this gap has widened since the 2022 energy cycle. Smaller regional processors lacking capital to modernize processing lines face a durable cost disadvantage against Omya and Imerys that is difficult to close without external financing support.
paper-pigments-market-trends-cost-volatility-analysis-1787558508406

Mineral Reserve Ownership Expansion

Producers are increasingly acquiring or leasing dedicated limestone and kaolin reserves directly, removing exposure to third-party mineral price volatility for a growing share of total feedstock requirements across their operations. This approach has become standard among mid-sized processors seeking predictable long-term feedstock cost. Several major producers have prioritized this route specifically over the past two years.

Energy-Efficient Processing Equipment Upgrades

Investing in modern grinding, drying, and precipitation equipment reduces energy consumption per ton processed meaningfully, insulating margin from the energy price volatility that hit smaller producers hardest during the 2022 cycle. Payback periods for these upgrades typically run three to five years depending on plant scale. Several producers report meaningful energy savings within the first year of installation.

Long-Term Energy Supply Contracts

Several major processors have signed multi-year fixed-price energy supply agreements directly with utilities, smoothing cost volatility across multiple years rather than buying energy on the spot market season to season. Terms typically run three to five years, giving processors meaningful cost certainty. Utilities have shown willingness to negotiate favorable rates for large industrial customers.

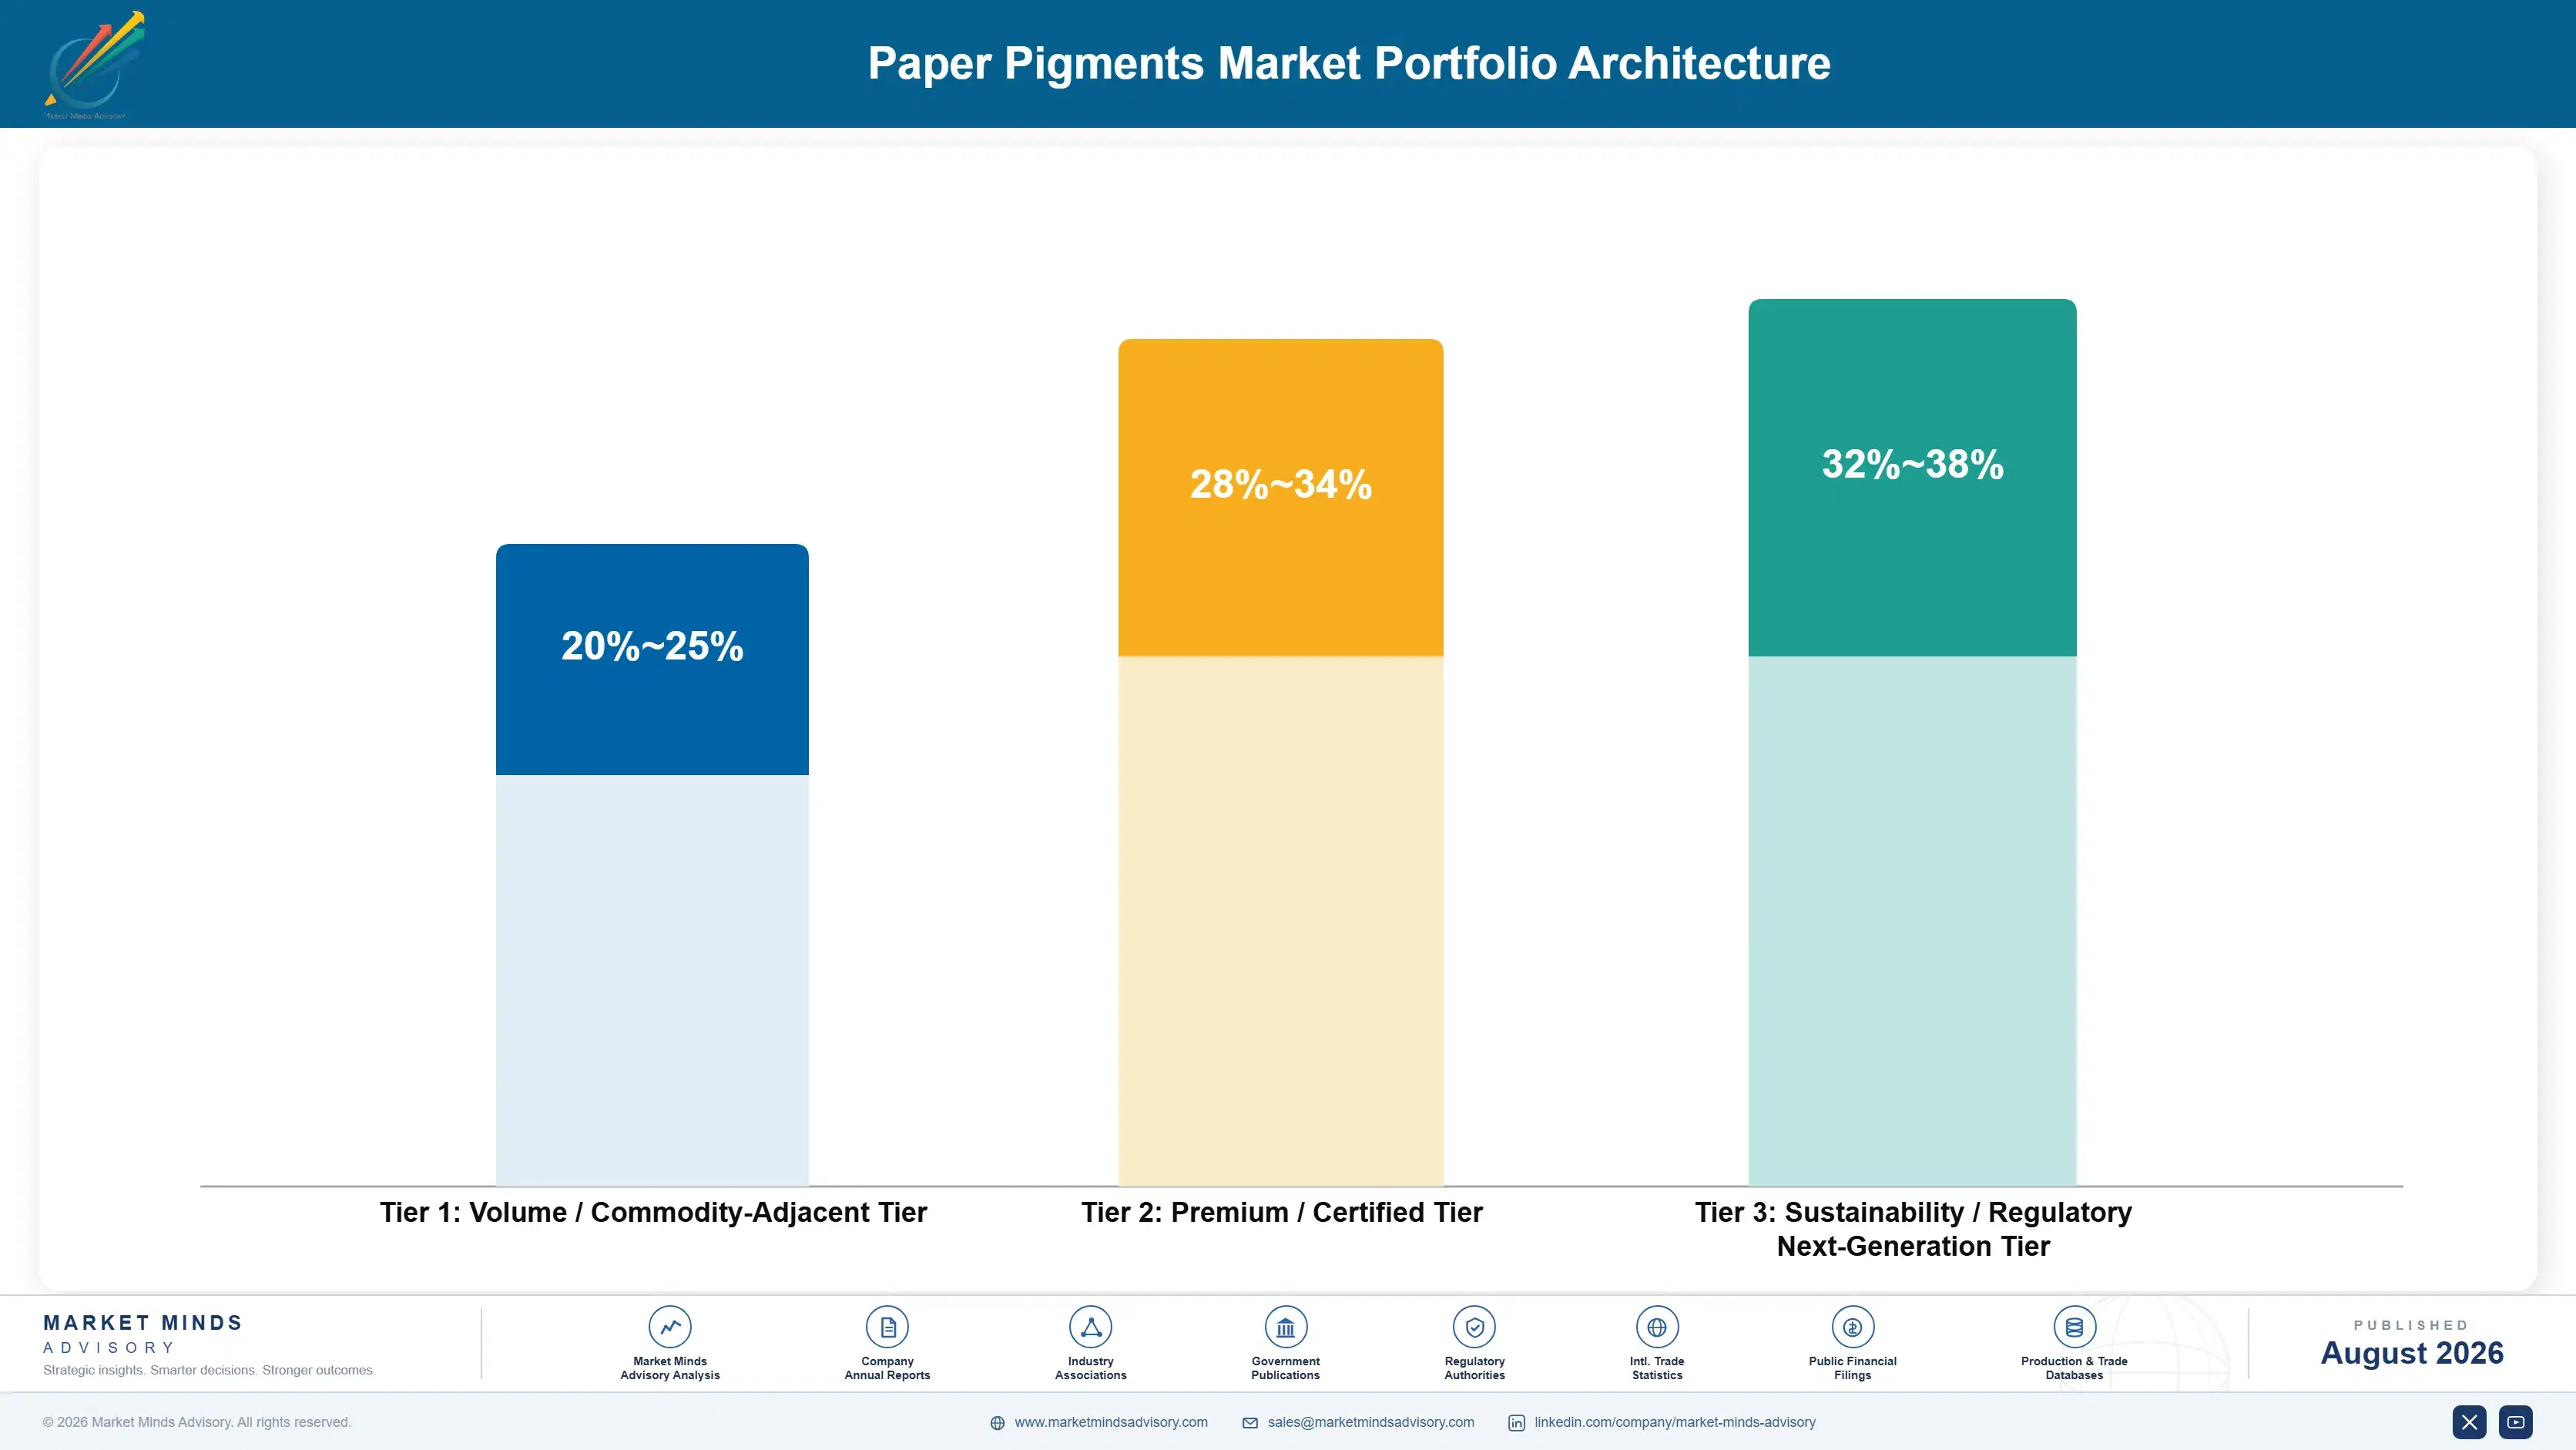
Portfolio Architecture for Margin Defence

MMA's three-tier portfolio architecture separates volume-oriented filler-grade minerals from certified premium coating formulations and next-generation plastic pigment products, with gross margins ranging from the low twenties for volume formats to well above 30 percent for specialty coating and plastic pigment lines. Producers positioned across all three tiers capture more total margin than single-tier specialists. Segment-level margin data is drawn from MMA Estimate, derived from primary survey data covering 47 expert interviews in Q4 2025 alone.
The tension between volume and premium is built into how the category operates: chasing volume growth through mainstream filler-grade contracts tends to compress margin per ton, while specialty coating and plastic pigment formats sacrifice total addressable volume for materially better unit economics. Mid-sized processors attempting to serve both ends simultaneously often end up under-resourced in each, losing volume-tier price competitiveness while failing to match premium-tier credibility.

High-value margin pools concentrate in precipitated calcium carbonate and plastic pigment products, both of which command premiums the standard filler-grade channel cannot match. Producers that under-invest in these pools risk ceding the most profitable share of the category to smaller, more nimble specialists. Building dedicated coating lines and technical account teams requires patient capital, which favors larger integrated producers.

Volume / Commodity-Adjacent Tier

Standard ground calcium carbonate and kaolin filler grades sold through mainstream paper mill contracts, competing primarily on price and delivery reliability rather than differentiated coating performance. Retail buyers select primarily on price within this tier.
Gross Margin: 20-25%

Premium / Certified Tier

Precipitated calcium carbonate and specialty coating formulations carrying documented performance data, commanding a meaningful step-up in both mill contract price and gross margin over commodity formats. Documentation increasingly matters here as much as pricing.
Gross Margin: 28-34%

Sustainability / Regulatory / Next-Generation Tier

Plastic pigments and engineered specialty coating products targeting the most demanding premium print customers, commanding the category's highest margins but requiring distinct manufacturing capability. Buyer volume commitments remain comparatively modest for now.
Gross Margin: 32-38%
paper-pigments-market-trends-portfolio-architecture-1787558508903

High-value Sub-segments and Strategic Watch-out

Plastic Pigments for Premium Print

The highest-margin, fastest-growing pool in the category, combining engineered polymer chemistry with premium brightness positioning to command premiums standard mineral pigments cannot match, though volume remains modest relative to the broader category today. Investment here is expected to accelerate meaningfully over the coming several years.
Gross Margin: 32-38%

Precipitated Calcium Carbonate for Packaging

A high-value pool growing at a rapid pace, driven by packaging board mill demand for finer particle structure and superior opacity performance, with margin well above standard ground calcium carbonate wholesale rates. Mills investing early are capturing preferred supplier status ahead of slower rivals. Scale matters.
Gross Margin: 28-33%

Standard Ground Calcium Carbonate Filler

The volume core of the category, carrying the thinnest margins but the largest absolute revenue base, and the segment most producers depend on to fund investment into higher-margin PCC and plastic pigment lines. Efficiency gains here matter more than premium positioning for most participants. Volume wins here.
Gross Margin: 18-22%

Graphic Paper Filler Grade Volume

A strategic watch-out segment: graphic paper decline is steadily eroding this once-anchor volume base, and producers that fail to redirect capacity toward packaging grades risk losing volume they cannot easily replace elsewhere. Redirecting capacity quickly is now a defensive necessity for legacy producers. Time is short.
Gross Margin: 16-20%

Long-Term Mill Contract Dynamics

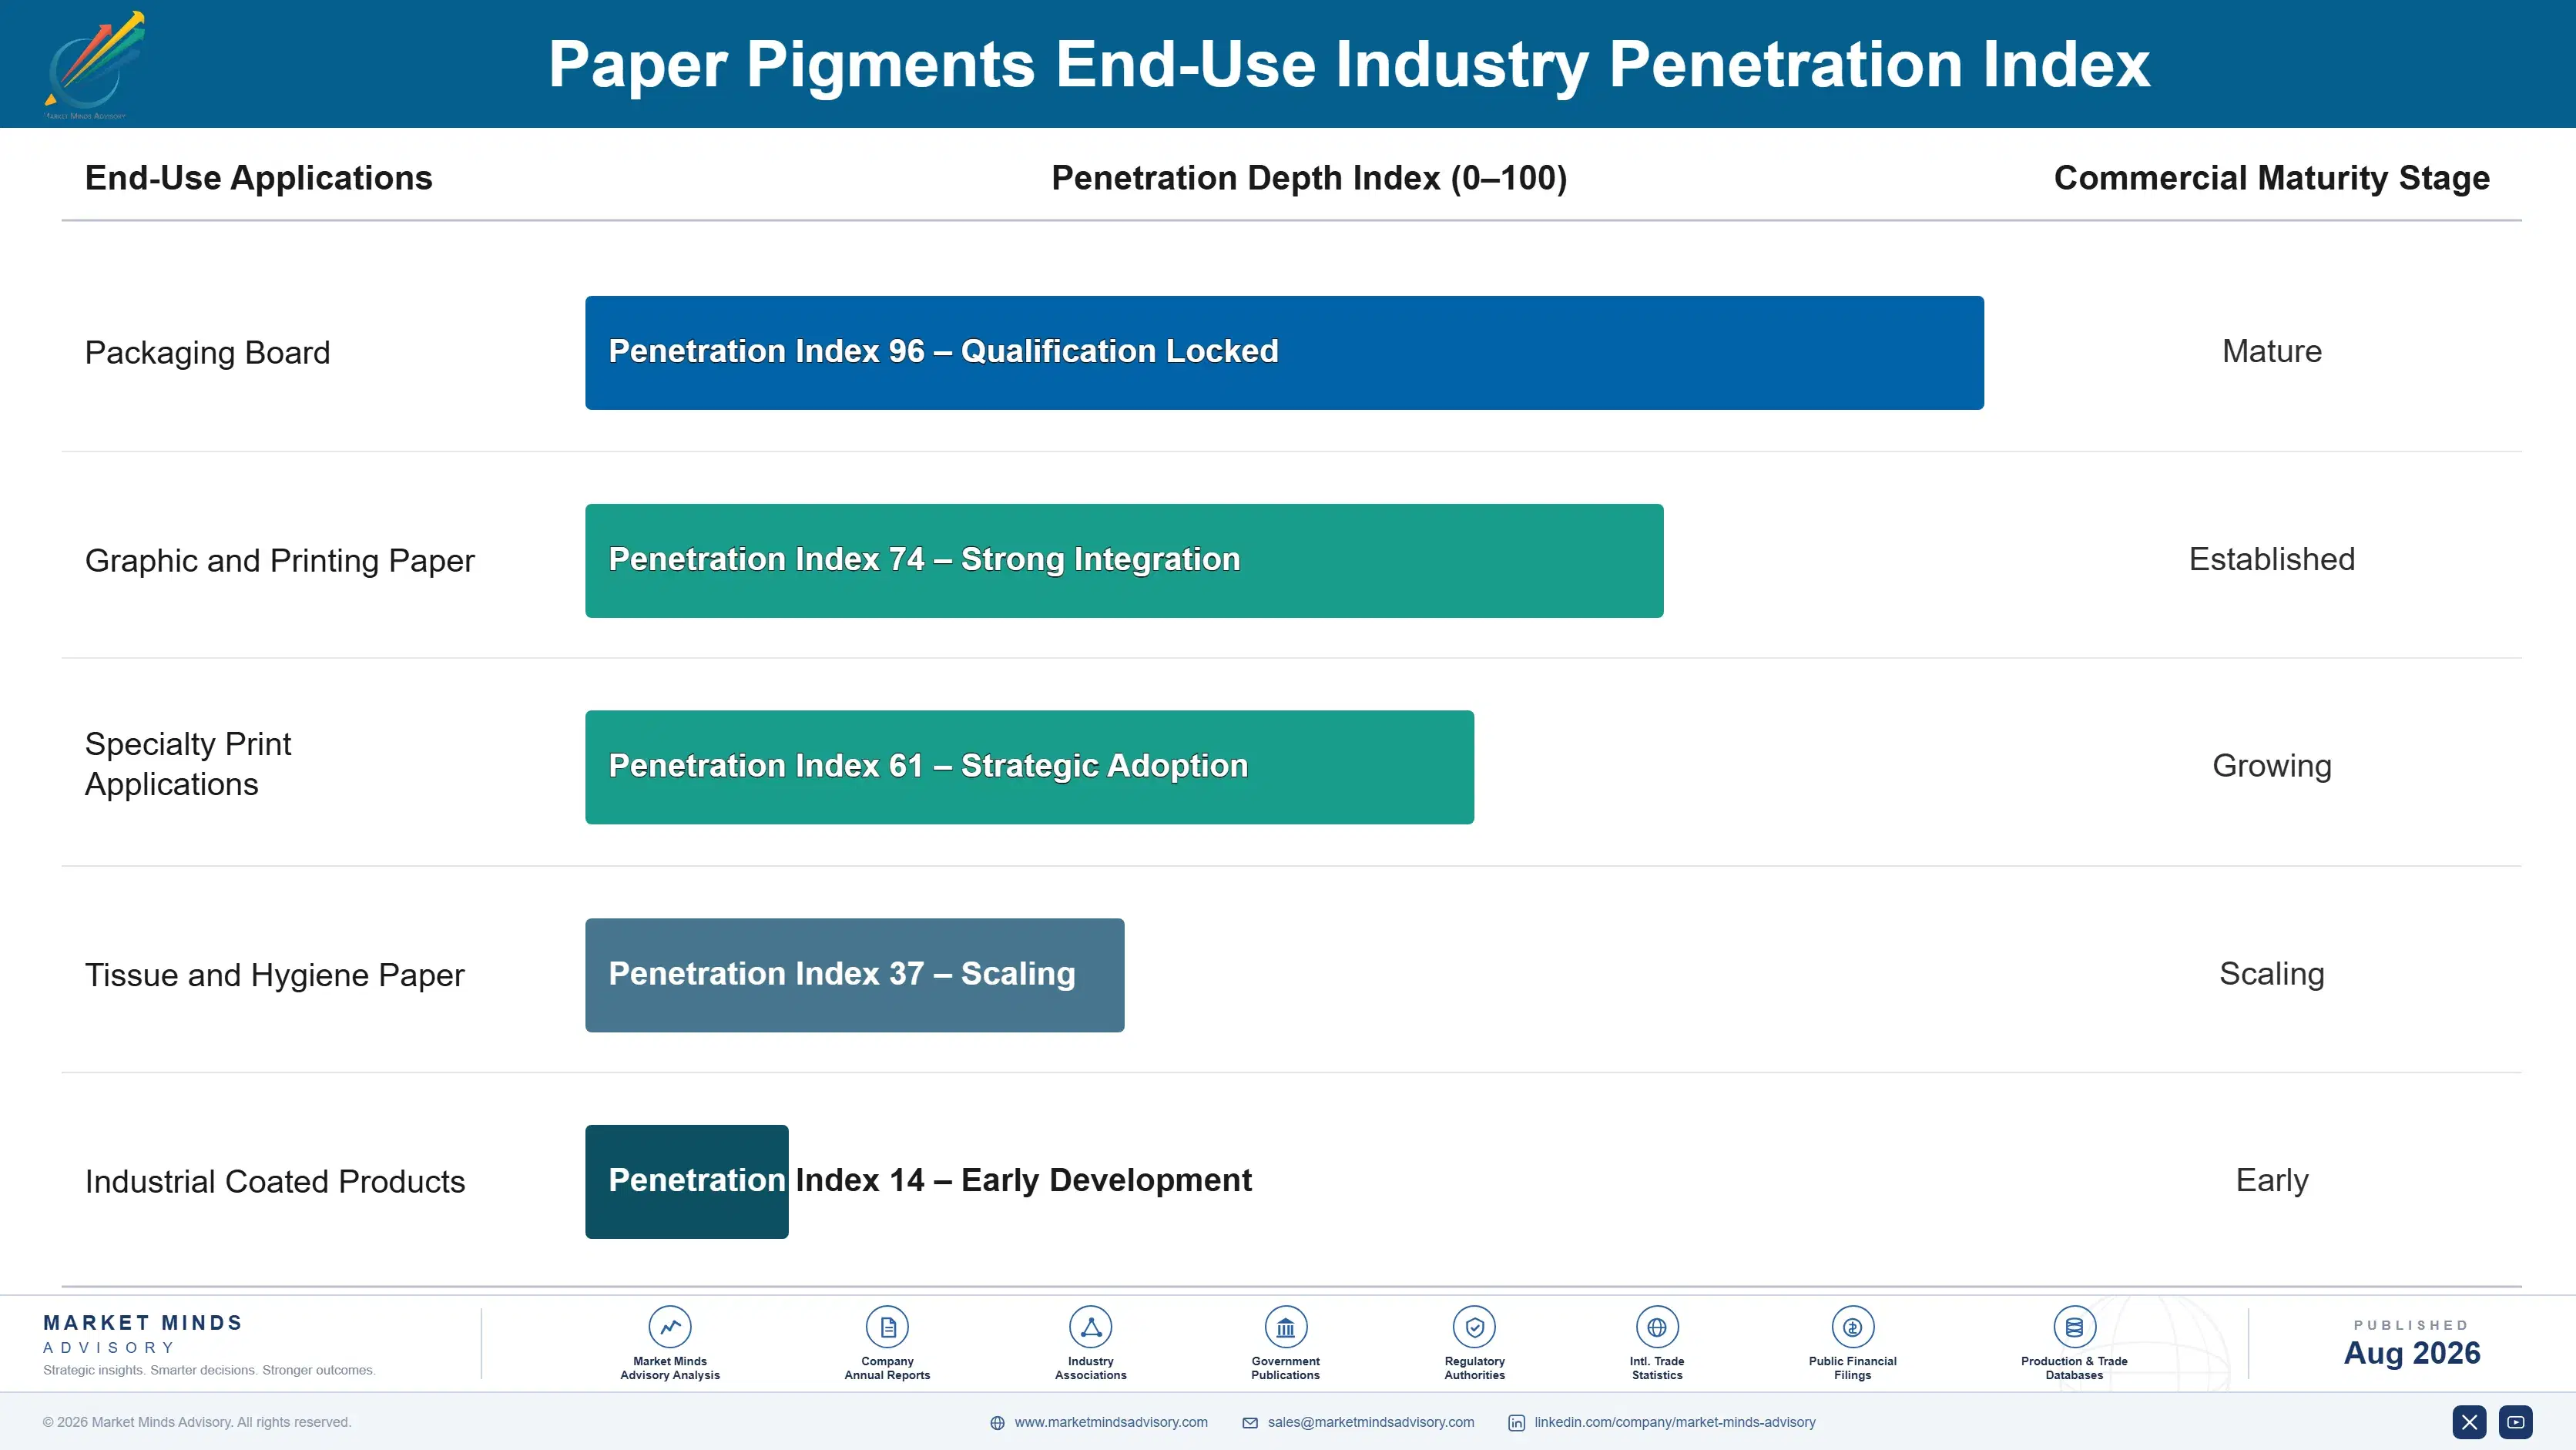
Paper pigment supply behaves closer to an annuity business than a one-time transaction category once a mill qualifies a producer's mineral grade for its coating formulation: repeat purchase rates run considerably higher than in commodity chemical categories, since requalifying a new pigment supplier requires costly production trials and coating performance validation that mills avoid repeating without strong reason.
Adoption depth varies meaningfully by end-use vertical. Packaging board mills that qualify a producer's PCC or plastic pigment grade rarely switch suppliers given the coating reformulation cost involved, while price-sensitive graphic paper mills remain far more transactional, switching suppliers readily whenever price gaps widen beyond a modest threshold. Specialty print applications sit closer to the packaging board end of this spectrum given their similarly stringent qualification requirements.

Generational shifts favor specialty formats further: mill technical teams entering procurement roles increasingly prioritize documented coating performance data over price alone, a shift from prior generations who weighted cost more heavily at the same career stage, and that cohort is expected to keep expanding demand for premium PCC and plastic pigment grades over the coming decade. Producers are investing in technical service teams specifically to capture this shift.
paper-pigments-market-trends-end-use-penetration-index-1787558509391

Where Coating Pigment Value Concentrates

These are among the four positions where our research anticipates prominent divergence between winners and laggards over the coming forecast period. Each is grounded in the demand model, the regulatory perimeter, and the announced capacity pipeline.
01 / COATING CAPABILITY INVESTMENT PRIORITY

Fund PCC and plastic pigment capacity before defending filler-grade volume

Producers protecting legacy filler-grade volume without investing in PCC and plastic pigment capability are ceding the category's most profitable share to competitors willing to build that capacity first. Specialty coating grades command a meaningful margin premium that standard filler-grade minerals alone cannot match, and that gap is widening as packaging board mills grow more demanding on coating performance. The producers winning preferred supplier status with expanding mills today are overwhelmingly those that made this investment early, well ahead of when it became a necessity.
02 / MILL RELATIONSHIP DEVELOPMENT FOCUS

Secure direct long-term contracts with expanding packaging board mills

Distributor intermediary margins have compressed producer economics as packaging board mills consolidate their own supplier base to fewer, larger mineral partners across most major manufacturing regions. Direct long-term mill contracts bypass that compression entirely, delivering materially better per-ton economics for producers with the technical account management capacity to service large mills directly and reliably. Mid-sized processors forming regional supply consortiums to meet those volume requirements are proving this strategy is not limited to the largest integrated players alone, even without their manufacturing scale.
03 / MINERAL RESERVE SECURITY STRATEGY

Secure owned mineral reserves ahead of tightening third-party supply

Producers relying entirely on third-party mineral purchases remain exposed to feedstock cost volatility that owned-reserve competitors have already insulated themselves against through direct acquisition. Securing dedicated limestone and kaolin reserves years ahead of anticipated demand growth locks in feedstock cost and supply reliability that spot-market buyers simply cannot match during periods of tight mineral availability across major producing regions. Producers without a clear reserve strategy risk losing margin to better-positioned integrated competitors as this feedstock cost gap keeps widening year after year.
04 / SOUTHEAST ASIAN EXPANSION STRATEGY

Establish processing capacity in Southeast Asia ahead of demand

Packaging board capacity investment is expanding rapidly across Southeast Asia's growing manufacturing base. Producers without established processing capacity anywhere in the region risk losing that incremental demand entirely to faster-moving Chinese and regional competitors already building mill relationships there today. Establishing processing capacity ahead of full regional demand materialization gives producers a meaningful head start over rivals still concentrated in traditional markets alone, and that advantage compounds further as regional packaging capacity keeps expanding year after year across the wider region.

Engagement Snapshot From the Field

A live engagement with an industry participant carrying material or product regulatory and market exposure ahead of a defining policy shift, showing how our research translates into a defensible multi-year portfolio strategy.
MARKET MINDS ADVISORY · CLIENT ENGAGEMENT SUMMARY
Paper Pigments Producer Strategic Portfolio Review and Transition Roadmap 2026·Investment Scenario on Paper Pigments Exposure Evaluation 2025-26
CLIENT PROFILE
The client is a mid-sized regional calcium carbonate processor operating primarily across North America, with annual revenue of approximately $210 million (client-reported, unverified by MMA). The company had built a solid regional filler-grade supply position over the past two decades, but had not yet invested in precipitated calcium carbonate or plastic pigment capability, relying almost entirely on ground calcium carbonate sold to declining graphic paper mills.
STRATEGIC CHALLENGE
The client faced steadily declining volume as its core graphic paper mill customers reduced production or closed entirely, and leadership needed to determine whether to invest in PCC capacity, pursue plastic pigment manufacturing, or both simultaneously given limited available capital. Management also worried about losing remaining mill relationships to larger competitors already expanding packaging board supply capability.
MMA APPROACH
MMA conducted primary interviews with the client's mill customers, regional packaging board producers, and technical account managers to map where capability investment would generate the fastest payback. The engagement combined MMA's proprietary primary survey data with a detailed margin analysis across each potential capability and channel pathway, benchmarked against comparable mid-sized processors already pursuing similar strategies elsewhere.
KEY FINDINGS
  1. Precipitated calcium carbonate capacity would command a margin premium of 15 to 20 percent above the client's current filler-grade pricing within roughly eighteen months.
  2. Two regional packaging board mills expressed strong willingness to sign direct multi-year contracts provided consistent PCC quality could be guaranteed reliably each quarter.
  3. The client's existing grinding infrastructure could be retrofitted for PCC precipitation at a materially lower cost than building new capacity from scratch.
  4. Continued reliance on graphic paper mill customers alone would result in a projected 30 percent volume decline over the following five years.
CLIENT PROFILE
The client is a mid-sized regional calcium carbonate processor operating primarily across North America, with annual revenue of approximately $210 million (client-reported, unverified by MMA). The company had built a solid regional filler-grade supply position over the past two decades, but had not yet invested in precipitated calcium carbonate or plastic pigment capability, relying almost entirely on ground calcium carbonate sold to declining graphic paper mills.
STRATEGIC CHALLENGE
The client faced steadily declining volume as its core graphic paper mill customers reduced production or closed entirely, and leadership needed to determine whether to invest in PCC capacity, pursue plastic pigment manufacturing, or both simultaneously given limited available capital. Management also worried about losing remaining mill relationships to larger competitors already expanding packaging board supply capability.
MMA APPROACH
MMA conducted primary interviews with the client's mill customers, regional packaging board producers, and technical account managers to map where capability investment would generate the fastest payback. The engagement combined MMA's proprietary primary survey data with a detailed margin analysis across each potential capability and channel pathway, benchmarked against comparable mid-sized processors already pursuing similar strategies elsewhere.
KEY FINDINGS
  1. Precipitated calcium carbonate capacity would command a margin premium of 15 to 20 percent above the client's current filler-grade pricing within roughly eighteen months.
  2. Two regional packaging board mills expressed strong willingness to sign direct multi-year contracts provided consistent PCC quality could be guaranteed reliably each quarter.
  3. The client's existing grinding infrastructure could be retrofitted for PCC precipitation at a materially lower cost than building new capacity from scratch.
  4. Continued reliance on graphic paper mill customers alone would result in a projected 30 percent volume decline over the following five years.
RECOMMENDED STRATEGY
Phase 1: Phase 1 (Months 1 to 6): Retrofit existing infrastructure for precipitated calcium carbonate production targeting nearby packaging board mills directly. Phase 2: Phase 2 (Months 7 to 14): Secure direct long-term supply contracts with identified regional packaging board mill customers identified earlier. Phase 3: Phase 3 (Months 15 to 24): Evaluate plastic pigment manufacturing entry and expand technical account management capacity further across the region.
OUTCOME
Within eighteen months of implementing the phased strategy, the client reported securing two long-term packaging board contracts and shifting 20 percent of total volume from filler-grade to PCC production (client-reported, unverified by MMA). Overall revenue from PCC product lines grew to represent roughly 22 percent of total sales, meaningfully ahead of the client's original eighteen-month target (client-reported, unverified by MMA).

Frequently Asked Questions

Foundational context covering the market sizes, CAGR, scope, country, region and competition that inform every finding below. This section is provided to cover basics and most often pre-purchase conversations, answered from the MMA Primary Research Dataset.

What is the current size of the Paper Pigments Market?

The global paper pigments market was valued at approximately $9.8 billion in 2025. Growth is driven by packaging board capacity expansion offsetting declining graphic paper demand worldwide.

How large will the Paper Pigments Market be by 2036?

MMA projects the market will reach approximately $15.1 billion by 2036. This reflects sustained expansion in precipitated calcium carbonate and plastic pigment coating applications globally.

What is the CAGR for the Paper Pigments Market 2026 to 2036?

The market is projected to grow at a 4.0 percent compound annual growth rate through 2036. Base case assumptions bracket a bull scenario near 5.2 percent and a bear scenario near 2.8 percent.

Which segment is growing fastest?

Plastic Pigments lead at a 7.0 percent CAGR, roughly 1.75 times the overall market rate. Growth is driven by premium print applications requiring superior opacity and brightness.

Who are the major companies in the Paper Pigments Market?

Leading companies include Omya AG, Imerys S.A., Minerals Technologies Inc., LKAB Minerals, and Huber Engineered Materials. These five processors hold a combined 42 percent share of the global market.

Which country is growing fastest?

India leads at a 6.5 percent CAGR, driven by rapidly expanding packaging manufacturing capacity and growing e-commerce demand. Domestic paper producers are investing heavily in new coating capability.

Report Segmentation Architecture

The full report scope spans multiple orthogonal segmentation dimensions, with cross-tabulated demand data provided for each dimension pair. Coverage extends further to regional breakdowns, trend trajectories, and the competitive detail needed to support segment-level decision-making.

By Mineral and Material Type

  • Ground Calcium Carbonate
  • Precipitated Calcium Carbonate
  • Kaolin Clay
  • Titanium Dioxide Pigments
  • Talc-Based Pigments
  • Plastic Pigments (Polystyrene-Based)

By End-Use Industry

  • Packaging Board
  • Graphic and Printing Paper
  • Specialty Print Applications
  • Tissue and Hygiene Paper
  • Industrial Coated Products

By Commercial Dimension

  • Direct Mill Supply Contracts
  • Distributor Channel Sales
  • Export Sales Channels
  • Long-Term Reserve Agreements

By Region

  • North America
  • Western Europe
  • East Asia
  • South Asia and Pacific
  • Latin America
  • Middle East and Africa
  • Eastern Europe

Scope, Methodology, and Coverage

Every figure in this report is reproducible from documented input assumptions. The scope below maps the historical period, the forecast horizon, the segmentation dimensions, and the countries covered, alongside the underlying primary and qualitative methodology.
Historical Period
2020 to 2025
Forecast Period
2026 to 2036
Base Year
2025 (USD billions; MMA Primary Research Dataset, August 2026)
Market Definition
This report covers mineral and synthetic pigments used in paper coating and filling, including calcium carbonate, kaolin, titanium dioxide, talc, and plastic pigments. It excludes pulp bleaching chemicals and paper-specific process additives unrelated to pigmentation.
Quantitative Units
USD billions (current prices); million metric tons where cited for volume context
Segmentation Dimensions
By Mineral and Material Type; By End-Use Industry; By Commercial Dimension; By Region
Regions Covered
North America, Western Europe, East Asia, South Asia and Pacific, Latin America, Middle East and Africa, Eastern Europe
Countries Covered
USA, China, Germany, France, UK, Japan, South Korea, India, Australia, Canada, Brazil, Mexico, Indonesia, Vietnam, Thailand, Malaysia, UAE, Saudi Arabia, South Africa, Nigeria, Turkey, Poland, Netherlands, Italy, Spain, Sweden, Switzerland, Argentina, Colombia, Singapore, and additional markets relevant to this sector
Key Companies Profiled
Omya AG, Imerys S.A., Minerals Technologies Inc., LKAB Minerals, Huber Engineered Materials, Sibelco, KaMin LLC, Thiele Kaolin Company, Nordkalk Corporation, Sinocalcite, Longcliffe Quarries, Calcium Products Inc, Schaefer Kalk, Carmeuse Group, Lhoist Group, Mississippi Lime Company, China Kaolin Co Ltd, Guangxi Comephy Company, Ashapura Minechem, Golcha Associated Malanpur
Quantitative Methodology
Primary survey, n=3,800 respondents, Q4 2025, six countries; demand-side model with trade association cross-validation
Qualitative Methodology
47 expert interviews, Q4 2025; applied to validate demand model assumptions, identify emerging dynamics, and assess competitive positioning
Report Format
PDF and XLSX data workbook (Word format preview document)
Publisher
Market Minds Advisory
Report Code
MMA-2026-CHM-118
Published
August 2026
Contact
sales@marketmindsadvisory.com | www.marketmindsadvisory.com

Purchase the full Paper Pigments Market Report (2026 to 2036).

The full Paper Pigments Market report delivers a complete quantitative and qualitative assessment spanning market sizing, six-segment mineral and material type analysis, and all seven regional markets in detail. It includes competitive profiling of twenty companies, input cost and energy volatility risk analysis, and a portfolio margin framework covering volume, premium, and next-generation coating tiers. Buyers also receive the underlying primary survey and expert interview datasets referenced throughout the analysis. Analysts also receive access to segment-level margin benchmarks and regional demand mechanisms drawn directly from company disclosures and MMA's proprietary primary research program conducted throughout 2025.
Detailed six-segment mineral and material market breakdown
All seven regional markets sized with growth rates
Twenty-company competitive profiling and positioning assessment
Mineral and energy cost structure risk analysis
Three-tier portfolio margin framework and watch segments
Primary survey and expert interview datasets included

Built For The People Who Decide

From boardroom strategy to bench-side execution, this report is read cover-to-cover by leaders shaping the next decade of their industry, turning demand scenarios, market dynamics and valuation benchmarks into decisions.
CXOs/ Presidents/ VPs/ Managers
M&A and Corporate Development
Strategy Teams and R&D Heads
Procurement and Product Directors
Regulatory and Compliance Leaders
Investor Relations and Equity Analysts