Market Minds Advisory
Paper Cushion Systems Market

Paper Cushion Systems Market: The Machine Is Free and That Is the Business

Suppliers place the converting machine at the packing station for nothing and earn only on paper consumed. That puts their capital inside a customer's warehouse, where a switch back to plastic strands it entirely.

Lead Analyst

Bilal Shaikh

Published

September 2026

Make Smarter Decisions with Customized Research Insights

Request a free sample report and evaluate market opportunities, growth trends, and competitive dynamics relevant to your business needs.

2025 MARKET VALUE$3.4BMarket Size 2025
2036 FORECAST VALUE$8.4BBase Case , 2026 to 2036
CAGR 2026 TO 20368.6 %Bull 9.8% / Bear 7.4%
INCREMENTAL OPPORTUNITY$4.7BNet 10- year value creation
EXPANSION MULTIPLE2.28x2036 value over 2026 base
Strategic Levers
M&A Pipeline
Regional Outlook
Country Rankings
Competitive Intelligence
Segmental Deep-dive
Call-Us : 91 93563 13602

Executive Snapshot and Market Trajectory

Nobody sells paper cushioning machines. They place them, free or close to it, at a customer's packing station and earn the return on kraft paper consumed afterward. That makes placements the only number that matters and paper the only revenue, which is a different business entirely.
Growth runs at 8.6% on plastic substitution in e-commerce fulfilment rather than on any performance advantage, since paper cushioning takes more truck space and more warehouse room than the film it replaces. Expandable honeycomb wrap grows fastest at 12.9%, exactly 1.50 times the market rate, because it replaced bubble film directly rather than competing with it. Paper bubble and embossed wrap follows at 10.4%, on much simpler machines.
Concentration reaches 62% across the top five measured on installed machine placements, which is high and reflects how much friction a machine creates once operators have learned it. North America holds the largest share on cushioning intensity per parcel rather than on parcel count, since an American parcel receives far more protective material than one anywhere else. Placement churn runs at roughly 11% annually against a nineteen month payback, and nobody publishes it.
Market Definition
This market covers paper-based protective cushioning and void fill systems, measured at supplier realised prices for both converting equipment and the kraft paper consumables it processes, spanning crumpled void fill, paper pad and mat cushioning, expandable honeycomb wrap, paper bubble and embossed wrap, corner and edge protectors, and die-cut paper insert systems. Plastic air pillow and bubble film systems, expanded foam, moulded pulp packaging, corrugated boxes, and base kraft papermaking all fall outside scope.
Base Year Value
$3.4B in 2025 (MMA Primary Research Dataset, August 2026)
Forecast Period
2026 to 2036, eleven discrete annual values
CAGR
8.6% base case. Bull 9.8%. Bear 7.4%.
Fastest Growth Segment
Expandable Honeycomb Wrap: 12.9% CAGR
Fastest Growth Country
China: 11.6% CAGR
Fastest Growth Region
South Asia and Pacific: 10.8% CAGR
Largest Region
North America: 32% of 2025 global value
Market Leaders
Ranpak, Storopack, Sealed Air, Pregis, Smurfit Westrock. Source: MMA Analysis based on company annual reports.
Primary Survey
n=3,800 procurement and R&D decision-makers, Q4 2025, six countries
Methodology
Demand-side build-up, cross-validated against public data, 47 expert interviews

Paper Cushion Systems Market Forecast Scenarios

paper-cushion-systems-market-size-forecast-scenario-1787299628243
The 2020 to 2025 period ran at 7.4% and two separate things happened inside it. Parcel volumes rose sharply through 2020 and 2021, pulling void fill demand of every kind upward. Then from 2022 the substitution story took over as brand plastic commitments and European packaging rules pushed fulfilment operations off film. Machine placements grew faster than paper volume in that second phase.
Three mechanisms carry the 8.6% base case. Plastic substitution in e-commerce fulfilment is the largest, driven by kerbside recyclability where paper enters an existing household stream and film does not. Retailer packaging mandates are the second, since a marketplace or retailer specifying paper-only inbound protection converts every supplier at once rather than one at a time. And expandable honeycomb wrap replacing bubble film is the third, a direct product-for-product substitution running at 12.9%.
The 9.8% bull case rests on Asian e-commerce raising cushioning intensity per parcel toward Western levels, since Chinese fulfilment currently uses a fraction of the protective material an American parcel receives. The 7.4% bear case is kraft paper price escalation making the switched-cost gap against film too visible, at which point fulfilment operations under margin pressure quietly switch back.

Where the Supplier's Capital Actually Sits

The commercial structure here is unusual enough to be worth stating plainly. A supplier builds a converting machine costing around 6,400 dollars, ships it to a customer's packing station, installs it, trains the operators, and charges nothing or nearly nothing for any of that. The return comes entirely from kraft paper consumed through the machine afterward, over a payback of roughly 19 months. Every placement is a capital decision dressed up as a sales call.
TOP FIVE CONCENTRATION62%Concentrated because machine placement creates real switching friction
PAPER SHARE OF COGS55%Kraft input dominates before conversion and freight are counted
MACHINE PLACEMENT COST6,400 dollarsSupplier capital sitting inside a customer packing station
PLACEMENT PAYBACK PERIOD19 monthsOn paper volume consumed at a typical packing station
VOLUME RATIO VERSUS FILM4.2 timesTruck space needed against equivalent plastic air pillow protection
ANNUAL PLACEMENT CHURN11%Of installed machines removed or idled across the base
That structure explains almost everything else about the market. Concentration is high at 62% because a machine sitting at a packing station is genuinely difficult to displace once operators have learned it and the layout has been built around it. Suppliers compete on placement count rather than equipment margin. Churn, running at 11% annually, decides who makes money, which is precisely why nobody publishes it.
The product itself carries a real disadvantage that the sustainability argument tends to bury. A truckload of kraft paper protects roughly a quarter of what the equivalent truckload of air pillow film protects, so freight and warehouse space both rise substantially. Buyers accept it because kerbside recyclability is worth more than the logistics penalty.
"Everybody in this category quotes placement growth and nobody quotes churn. Those two numbers together decide the business, and the second one is roughly eleven percent a year. A supplier growing placements at fifteen is running much harder than the headline suggests."
Director, Protective Packaging and Fulfilment Systems Practice · MMA Packaging a

Market Trends

Honeycomb Wrap Replaced Bubble Film Product For Product

Expandable honeycomb paper is die-cut so that pulling it open creates an interlocking cellular structure that wraps an item and holds its own shape without tape. That makes it a direct one-for-one replacement for bubble film at the packing station, which is why it grows at 12.9% against 8.6% for the market. Operators need almost no retraining, the dispenser occupies similar bench space, and the wrapped result looks deliberate rather than improvised. Most substitution stories require a compromise somewhere and this one largely does not, which explains the pace. Bubble film had no defence.
Market Impact: Fee differential reaches 2.7 times
Placement Growth Now Outpaces Paper Volume Growth

Suppliers have been installing machines ahead of consumption since 2022, which means the installed base is running at lower average paper throughput than it was five years ago. Some of that is deliberate: taking a placement early locks a packing station before a competitor reaches it. Some of it is churn hiding inside a growing gross number, since a placement removed and replaced counts twice in installation reporting and once in nothing else. Placement churn currently runs near 11% annually across the installed base. A supplier growing placements at fifteen percent is running much harder than that headline suggests.
Market Impact: Around 35% of placements from mandates

Market Opportunities and Growth Drivers

Kerbside Recyclability Beats Every Other Sustainability Argument

Paper cushioning goes into a household paper stream that already exists in essentially every developed municipality, while plastic film requires a store drop-off that most consumers never use. That distinction is what makes the substitution argument work commercially, because a brand can point to a disposal route the customer already follows rather than one they must be taught. European packaging rules increasingly attach fee differentials to exactly that difference. No performance claim in this category persuades anybody the way the recycling bin does. Every other argument in this category is secondary to that single practical fact.
Market Impact: Requires 4.2 times truck space

Retailer Mandates Convert Whole Supplier Bases At Once

When a major retailer or marketplace specifies paper-only protective material on inbound shipments, every supplier shipping into that network converts simultaneously rather than one account at a time. That produces placement demand in concentrated bursts that suppliers struggle to service, since each conversion needs a machine, an installation visit, and operator training within the mandate window. Roughly 35% of placement volume in the past three years traced to a mandate rather than to an independent decision. Suppliers with installation capacity win those windows and the rest arrive late. Installation capacity decides these windows entirely.
Market Impact: Churn runs 11% of placements

Market Restraints and Challenges

Paper Takes Four Times The Truck Space

A truckload of kraft paper protects roughly a quarter of what an equivalent truckload of air pillow film protects, because film ships flat and is inflated at the packing station while paper ships as paper. The root cause is that the cushioning volume is already present in the material rather than added later from air. Commercial impact falls on inbound freight and on warehouse space at the packing station, both of which a fulfilment operation feels immediately. Suppliers are mitigating with regional stocking, denser roll formats, and higher-yield paper grades.
Market Impact: Growing at 12.9% annually

Placement Churn Destroys The Economics Quietly

A machine costs the supplier around 6,400 dollars and pays back over roughly 19 months of paper consumption, so any placement removed inside that window loses money outright. Churn currently runs near 11% annually, and the root cause is usually that the packing station never reached the paper volume the placement assumed. Commercial impact is a capital base earning nothing while sitting in customer warehouses. Mitigation runs through better volume qualification before installation, minimum consumption terms, and machine recovery programmes that most suppliers execute poorly. Sales incentives paid on installations rather than paper volume generate the problem year after year.
Market Impact: Placement churn runs 11% annually
3 additional market trends, 4 additional growth drivers, and 2 additional restraints and challenges are covered in the full report. Contact sales@marketmindsadvisory.com to access the complete intelligence.

Segment CAGR and Growth Architecture

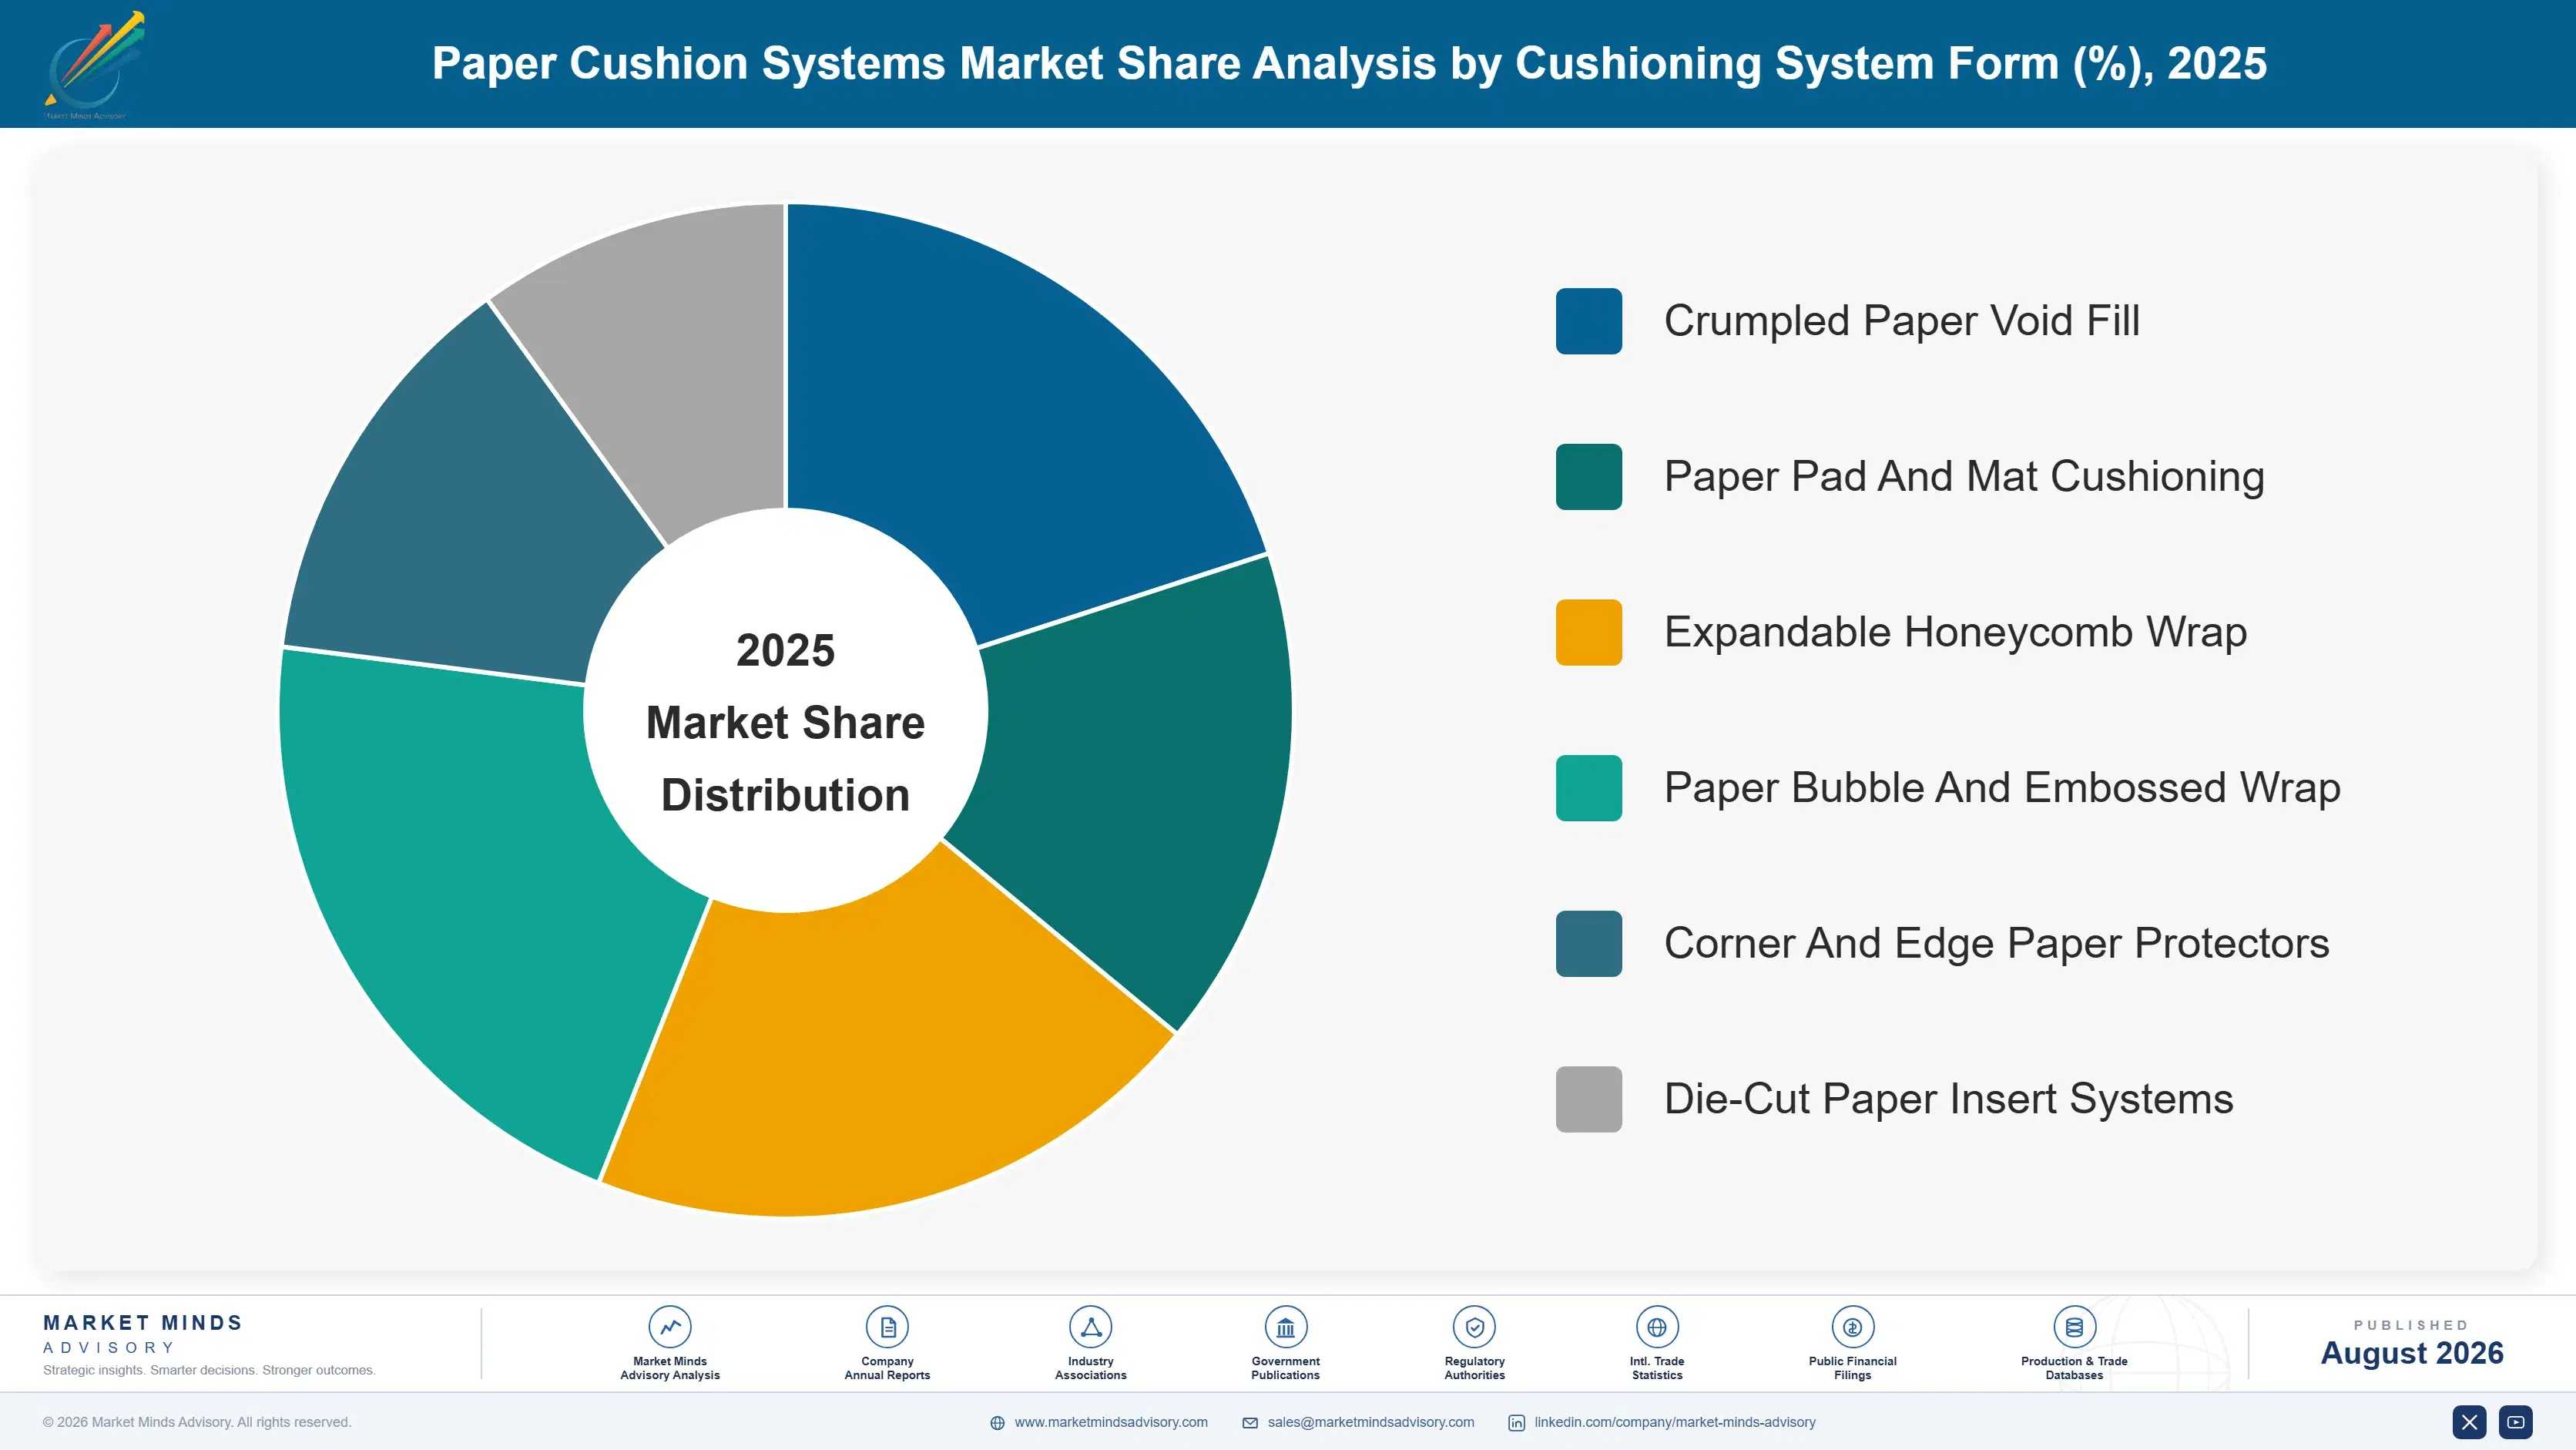
Segmentation follows the form the paper takes, because that form determines the converting machine required, the paper grade consumed, the bench space needed at a packing station, and the plastic product it directly displaces. End-use industry and parcel type both cut across every form rather than separating them, which makes either a weak primary dimension.
paper-cushion-systems-market-market-share-analysis-1787299628774

Expandable Honeycomb Wrap

The fastest form at 12.9%, exactly 1.50 times the market rate, and the one true product-for-product replacement in the category. Kraft paper die-cut with a slit pattern expands into an interlocking cellular sheet when pulled, wrapping an item and gripping itself without tape or any secondary fixing. It replaced bubble film directly at the packing station, needing similar bench space and almost no operator retraining, which is why adoption moved so quickly. The paper grade is heavier and the yield per kilogram lower than crumpled void fill, so the consumable revenue per placement runs considerably higher than the machine cost suggests. Placement quality rather than placement count is what this form fixes.
CAGR 12.9%

Paper Bubble And Embossed Wrap

Second fastest at 10.4%, and the answer for surface protection rather than impact absorption: an embossed or micro-creped kraft sheet that cushions lightly while preventing scuffing and abrasion in transit. Apparel, footwear, cosmetics, and printed goods have adopted it most, since those categories need surface protection more than they need drop performance. It runs on simpler and cheaper machines than honeycomb, which lowers the placement capital a supplier commits and shortens the payback correspondingly. The trade-off is that it genuinely does not protect against impact, so returns performance suffers when it is specified beyond what it can do. Specifying it beyond surface protection is the commonest mistake buyers in this category make.
CAGR 10.4%
Full segment breakdown across 6 segments available in the complete report.

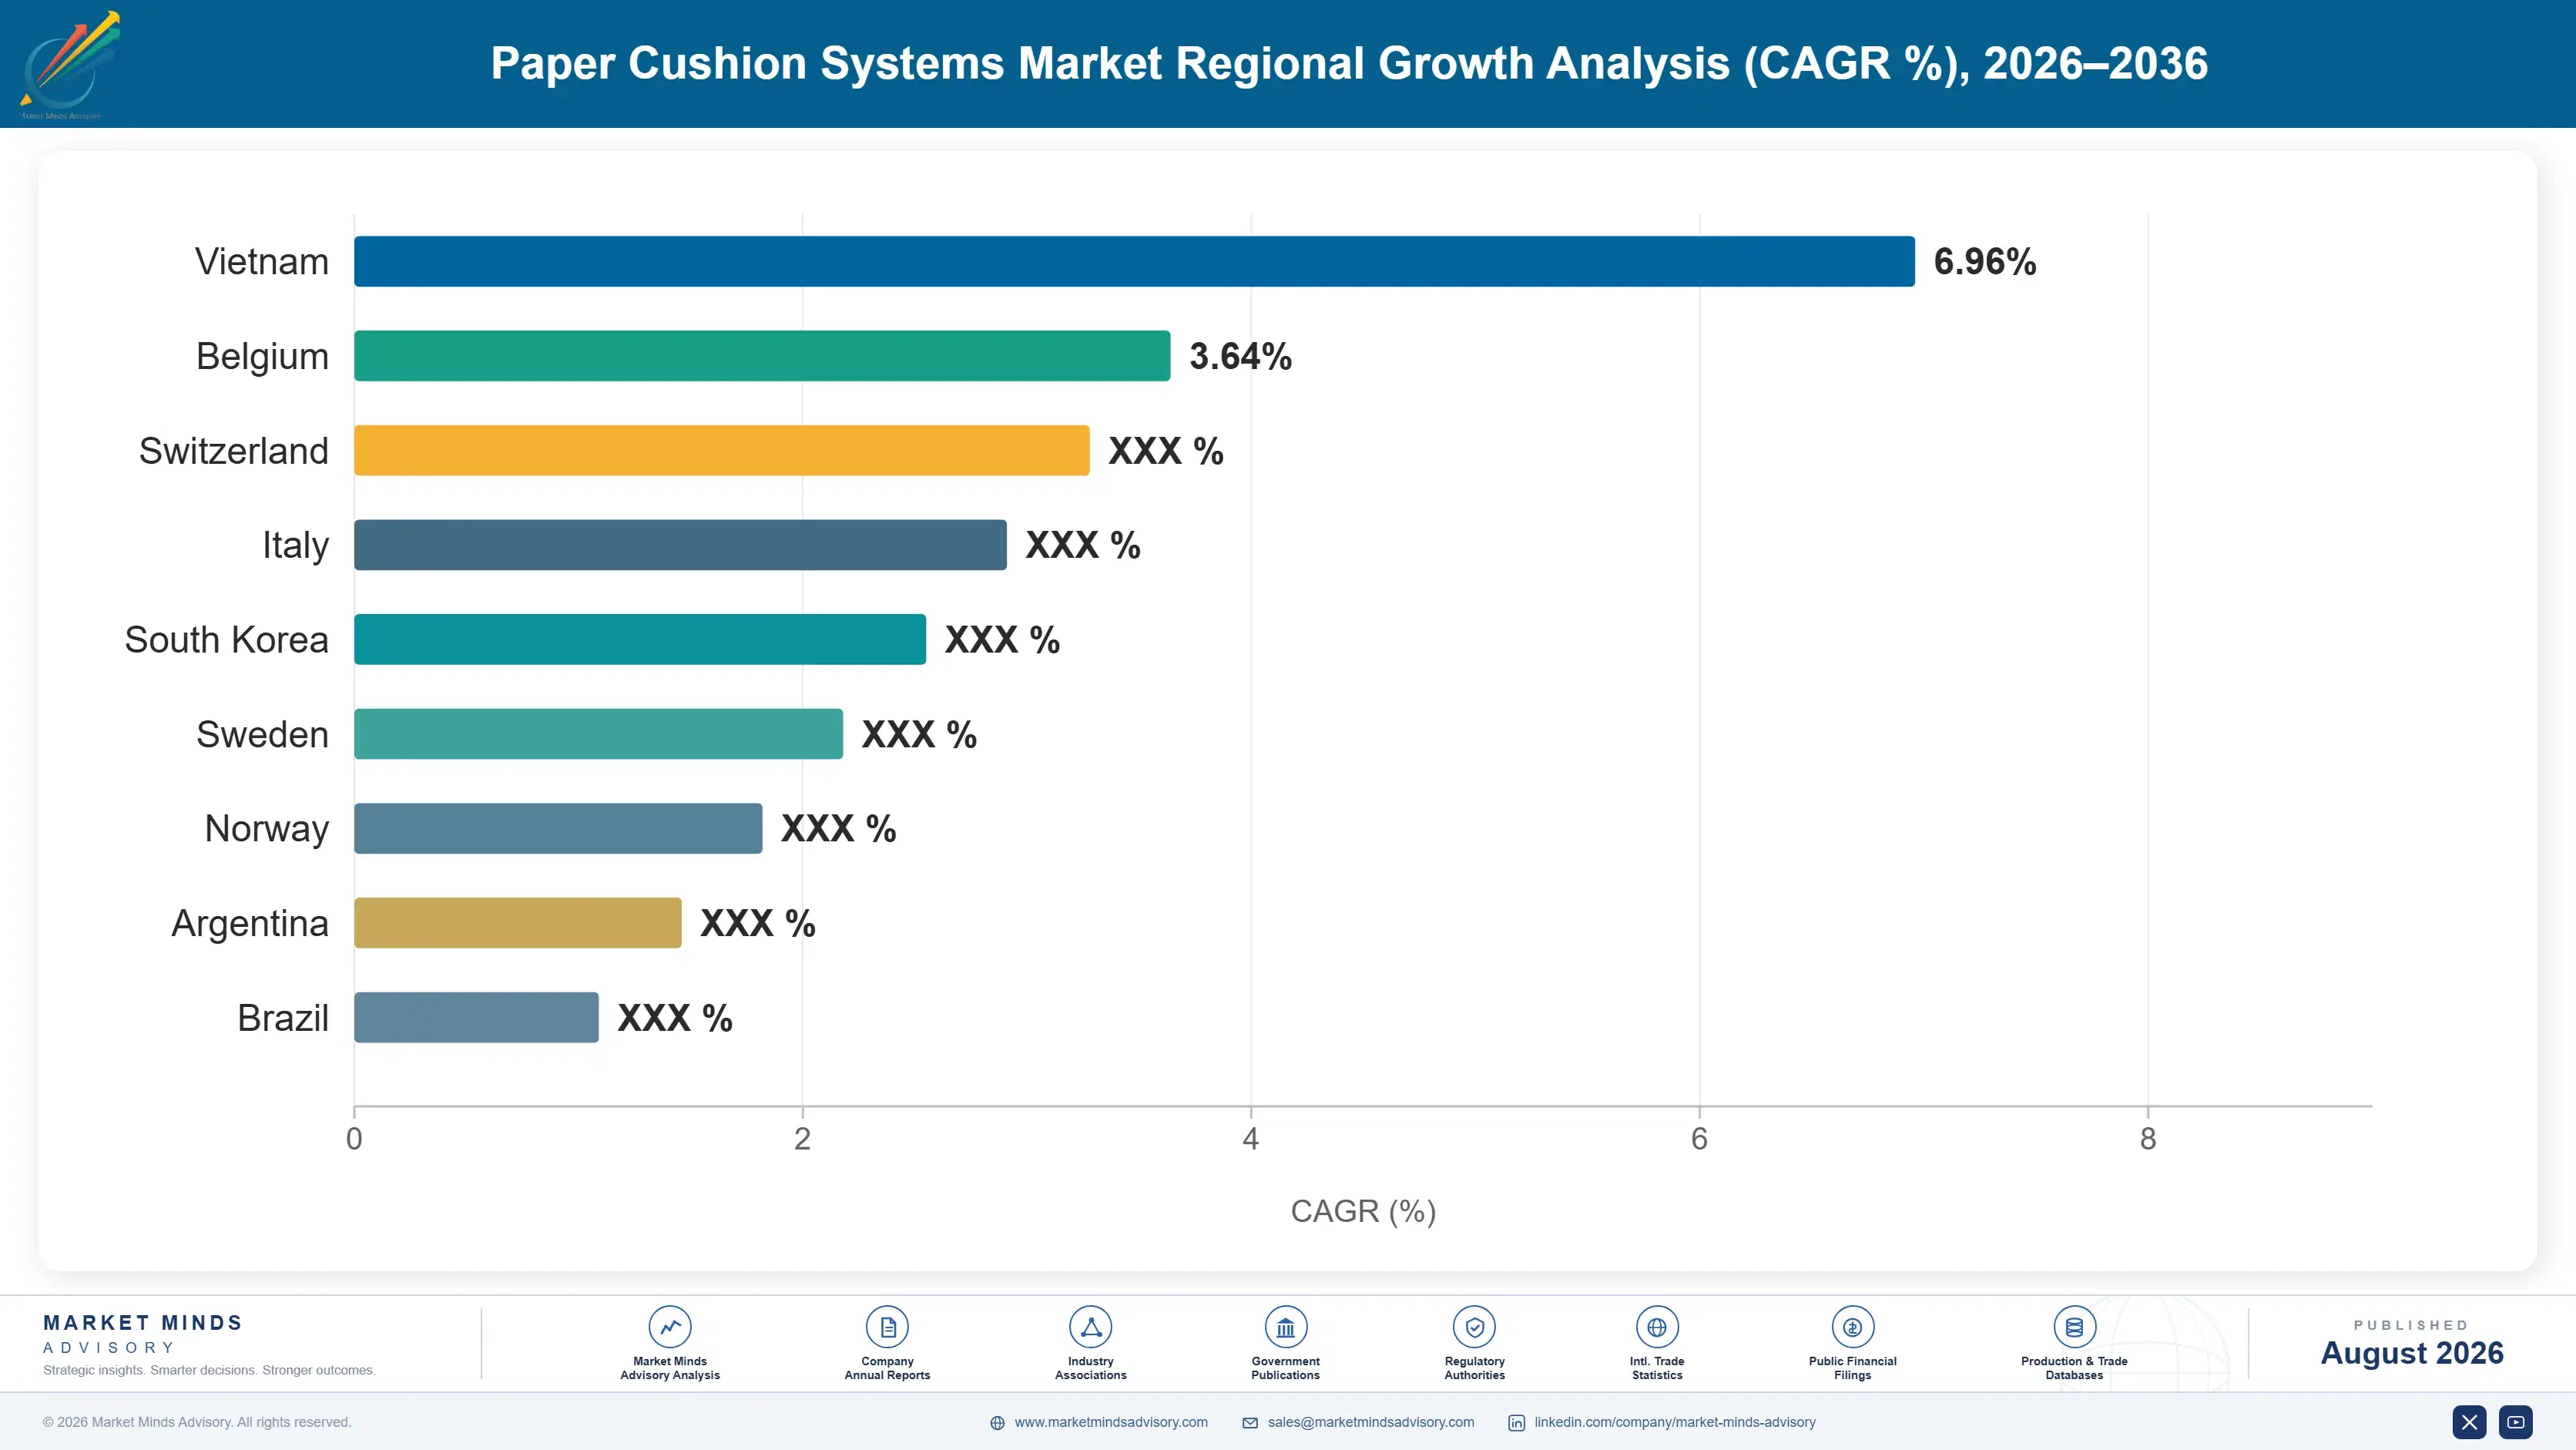
Regional Architecture and Country Demand Map

Demand follows cushioning intensity per parcel rather than parcel count, which is why the largest e-commerce market by volume is not remotely the largest market here. North America leads on how generously American fulfilment operations pack their parcels, and Western Europe follows on packaging regulation.

North America

Thirty-two percent, at the top of the framework band, and the reason is cushioning intensity rather than parcel count: an American e-commerce parcel receives substantially more protective material than a parcel anywhere else, and always has. The machine placement model originated here and the installed base is the deepest and oldest, which means more mature paper consumption per placement than any other region achieves. Retailer and marketplace packaging mandates have converted large supplier populations at once. Growth at 7.8% sits below the global rate purely because conversion is further advanced here than elsewhere, leaving less easy substitution left to capture from film. Mexican fulfilment is counted here and grows considerably faster than the regional figure.
Share: 32% | CAGR: 7.8% (2026 to 2036)

Western Europe

Twenty-seven percent, marginally above the framework band, and packaging regulation is the justification rather than fulfilment volume. German operations run the highest paper cushioning penetration anywhere, helped by a domestic recycling culture that predates the current rules by decades. Packaging waste fee differentials attach real money to the difference between a paper stream and a film one. Benelux and Nordic fulfilment follows closely at high penetration. Growth at 7.2% is the slowest of any region, which reflects how much of the available substitution has already happened rather than any weakness in the underlying demand. French, Italian, and Spanish operations sit well behind the northern European ones, which is where the remaining conversion opportunity here sits.
Share: 27% | CAGR: 7.2% (2026 to 2036)
Regional intelligence for 5 additional markets available in the complete report: East Asia, South Asia and Pacific, Latin America, Eastern Europe, Middle East and Africa. Contact sales@marketmindsadvisory.com.
paper-cushion-systems-market-country-cagr-analysis-1787299629299

Protecting Capital Sitting In Warehouses

Every placement is 6,400 dollars of supplier capital installed inside somebody else's building against a nineteen month payback, and roughly 11% of it walks back out again annually. Value comes from qualifying volume before installing, from writing minimum consumption terms, from recovering idle machines properly, and from selling honeycomb where the consumable revenue is highest.

Qualify Paper Volume Before Placing The Machine

A placement pays back over roughly 19 months at assumed paper consumption, and the most common cause of churn is that the packing station never came close to the volume the sales call assumed. Measuring actual parcel throughput and cushioning material use for two weeks before installing costs almost nothing and removes most of the bad placements. Suppliers doing this properly run churn near 6% against an industry level of 11%, which is worth roughly 340 dollars of preserved capital per placement made. Sales incentives paid on installations rather than on paper volume actively work against it.
Market Impact: Cuts placement churn from 11% to about 6%

Write Minimum Consumption Into Placement Agreements

Most placements are made on a handshake with no volume commitment whatsoever, which means the supplier carries all the risk on an asset in somebody else's warehouse. A minimum annual consumption clause, or a machine rental that falls away above a volume threshold, transfers that risk back without changing the customer's economics if they use the machine as intended. Customers resist the paperwork rather than the substance. Suppliers using consumption terms recover roughly 2,900 dollars per churned placement that would otherwise be a complete write-off. Very few suppliers have ever attempted the conversation.
Market Impact: Consumption terms recover about 2,900 dollars per churn

Run Machine Recovery As A Real Operation

When a placement goes idle, the machine usually sits in the customer's warehouse for months because nobody owns retrieving it and the freight cost looks larger than the residual value. It is not: a refurbished machine redeploys at roughly 40% of new cost and shortens the next payback correspondingly. Suppliers running structured recovery with quarterly idle-placement reporting redeploy most recovered units within two quarters. Those without it write off the asset and buy new, which is the single largest avoidable cost in this business model. Nobody owns the problem, which is why it persists.
Market Impact: Refurbished machines cost about 40% of new price

Weight Placements Toward Honeycomb Rather Than Void Fill

A crumpled void fill placement consumes light basis weight paper at high yield per kilogram, which produces the lowest consumable revenue per station in the range. Honeycomb wrap uses heavier grades at lower yield, so the same packing station generates roughly 2.4 times the annual paper revenue on a machine costing only modestly more. It also grows at 12.9% against 8.6% for the market. Suppliers optimising placement count rather than placement quality have filled their installed base with the least valuable stations available. Fixing the incentive fixes the mix within about two years.
Market Impact: Honeycomb yields about 2.4 times the paper revenue

Who Controls the Margin Pool

Concentration reaches 62% across the top five measured on installed machine placements, which is high for a packaging consumable and follows directly from the business model. A machine at a packing station that operators have learned, and that a bench has been built around, is genuinely hard to displace even when a competitor offers cheaper paper. The leader holds a clear placement gap over the nearest challenger, though the gap on paper volume consumed is narrower than the placement count impli
Competitive activity runs on three fronts. Installation capacity is the first, because retailer mandates create conversion bursts and whoever can install fastest takes the placements. Machine reliability at the packing station is the second, since a jam during a peak shift is remembered for years. Paper yield per kilogram is the third, and it is where genuine technical differentiation exists between suppliers who look otherwise identical.

Pressure comes from two directions. Corrugated producers entering with integrated paper supply have cost positions that pure protective packaging suppliers cannot match. And private label paper on placed machines is spreading, which attacks the consumable revenue the entire model depends upon.
paper-cushion-systems-market-company-positioning-matrix-1787299629819

Competitive Moat and Risk Dimensions

RANPAK

Moat: Largest installed placement base

The installed base is the business here, since every machine at a packing station is a paper annuity that a competitor has to physically displace rather than merely underprice. Holding the largest placement count across both major regions means the widest consumable revenue base and the best data on what actually drives consumption per station. Nobody replicates that quickly.
RANPAK

Risk: Pure exposure to paper consumables

Revenue depends entirely on kraft paper sold through placed machines, with no other product line to absorb a paper price movement or a churn cycle. Corrugated producers entering the category carry integrated paper supply and can price the consumable more aggressively. A model with one revenue stream is efficient until somebody attacks precisely that stream.
STOROPACK

Moat: Both paper and plastic systems

Supplying air pillow systems alongside paper cushioning means a customer converting from film to paper stays inside the same supplier rather than leaving for one. It also means the sales conversation can be honest about the freight and warehouse penalty paper carries, which builds more trust than a single-material pitch does. Conversions run on advice rather than advocacy.
STOROPACK

Risk: Mixed portfolio blunts positioning

A supplier selling both materials cannot credibly campaign against plastic film, which is the argument driving the entire category at present. Customers under sustainability pressure want a supplier whose position matches their own commitment. Breadth that protects revenue during a transition also removes the clearest reason for a converting customer to choose you over a specialist.

Players Tracked

Prominent Players

Ranpak
Storopack
Sealed Air
Pregis
Smurfit Westrock

Other Key Players

Intertape Polymer Group
Mondi
DS Smith
Sonoco
Packsize
Veritiv
Bunzl
Antalis
Rajapack
Macfarlane Group
Cascades
Nefab
Signode
Tri-Wall
Klabin

Recent Developments

MARCH 2025

Protective packaging supplier launches higher-yield honeycomb paper grade

A protective packaging supplier introduced a honeycomb wrap grade delivering more expanded coverage per kilogram of kraft paper, aimed at reducing the freight and warehouse penalty that paper cushioning carries against film. The launch was a product introduction rather than any joint venture, licensing arrangement, or mill acquisition.
Signal: Yield per kilogram is where genuine technical difference exists between suppliers who otherwise look identical to a buyer
JUNE 2025

Marketplace operator mandates paper-only protective material on inbound

An online marketplace specified paper-based protective material on all inbound supplier shipments within a defined compliance window, converting a very large supplier population simultaneously. The requirement was a published packaging policy change rather than any supply agreement, equity arrangement, or partnership with a protective packaging supplier.
Signal: Mandates create conversion bursts that reward installation capacity far more than they ever reward price competitiveness
SEPTEMBER 2025

Corrugated producer enters paper cushioning with integrated supply

An integrated corrugated packaging producer launched a paper cushioning systems range supplied from its own kraft paper mills, entering a category previously served mainly by specialist protective packaging suppliers. The move was an organic product line launch rather than any acquisition of an existing cushioning systems business.
Signal: Integrated paper supply attacks the consumable margin that the entire machine placement model quietly depends upon

Kraft Paper Is The Whole Cost

Kraft paper dominates at roughly 55% of cost of goods, sourced from integrated mills in Scandinavia, North America, and increasingly from Chinese and Brazilian producers as recycled content grades improve. Converting and die-cutting add about 13%, machine depreciation across the placed base carries roughly 16% and outbound freight takes the remaining 16%, unusually high because paper cushioning occupies so much truck space per unit of protection.
European containerboard and kraft paper pricing through 2022 was the event that mattered, since energy costs raised mill production costs sharply and pulp availability tightened at the same time. IEA reporting on European industrial energy prices documented the underlying movement in detail. Cushioning suppliers on annual paper contracts absorbed the increase for two to three quarters before recovering it, and several reported margin compression across the placed base.

The competitive disadvantage mechanism runs through paper integration rather than through purchasing skill. A corrugated producer entering this category buys kraft from its own mills at production cost, while a specialist protective packaging supplier buys at market. On a product where paper is 55% of cost of goods and the machine is given away, that difference is decisive. Geography matters far less than mill ownership does.
paper-cushion-systems-market-cost-volatility-analysis-1787299630015

Contract kraft paper on multi-year volume rather than annually

Annual contracts reprice the dominant input every twelve months and expose the entire placed base to a single negotiation outcome each and every year. Multi-year agreements with agreed escalation formulas smooth that out considerably and secure allocation when grades tighten. Mills prefer them too, since volume running through a placed base is genuinely predictable.

Raise expanded coverage per kilogram across every system form

Every percentage point of additional coverage per kilogram of kraft cuts the dominant cost line and the freight line at the same time, because both scale with paper weight rather than with protection delivered. Grade development, slit pattern optimisation, and basis weight reduction all contribute here. This lever improves cost, freight, and the sustainability argument together.

Stock paper regionally to cut the freight penalty

Outbound freight runs about 16% of cost because paper cushioning occupies roughly 4.2 times the truck space of equivalent film protection. Regional stocking points shorten the delivery leg substantially and improve service on the peak weeks when fulfilment operations run hardest. The working capital cost of holding regional stock is considerably smaller than the freight saved across a full year.

Portfolio Architecture for Margin Defence

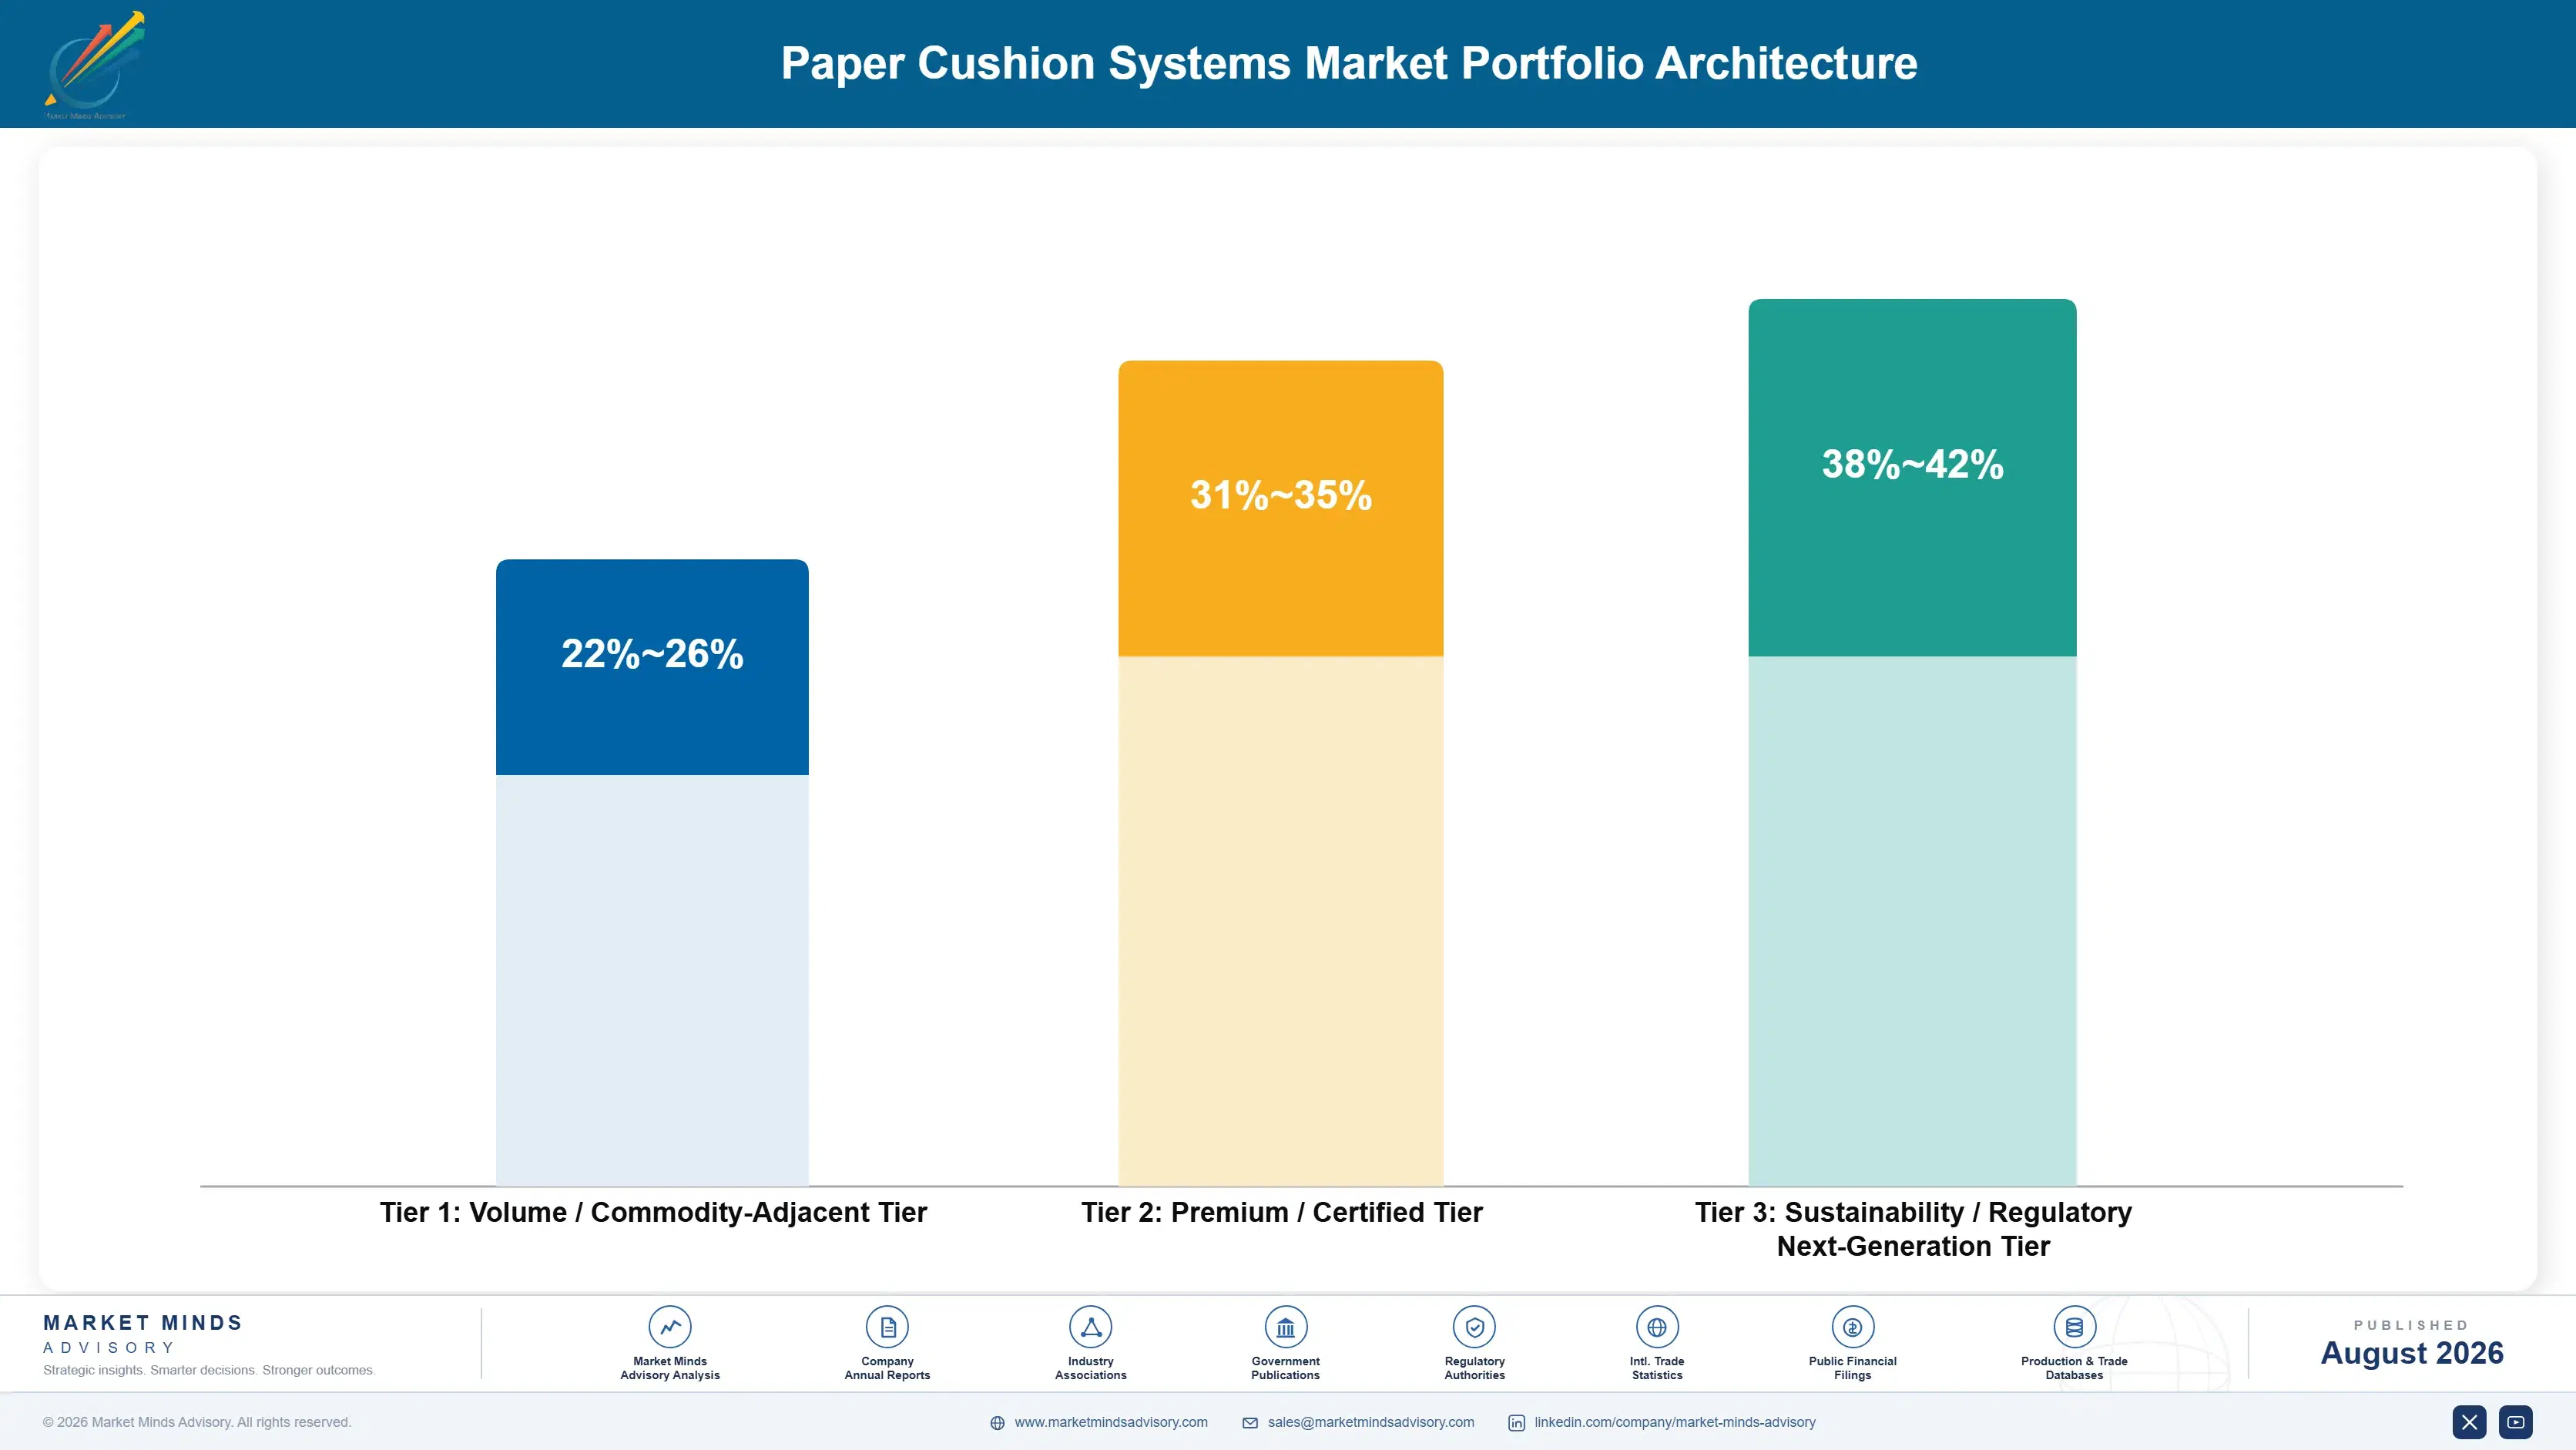
Three tiers describe this business and the spread is set by consumable revenue per placement rather than by machine complexity. Crumpled void fill sits at the bottom: light basis weight paper at high yield, meaning the lowest paper revenue per station in the range. Honeycomb and paper bubble wrap sit higher on heavier grades and lower yield. Engineered die-cut inserts and custom protective systems occupy a third tier on design content.
The tension is that void fill placements build the installed base. They are quick to install, easy for operators, and they get a supplier into a packing station where honeycomb and wrap can follow later. Suppliers who declined void fill work on margin grounds found they had no presence at the stations where the higher-value forms were later specified, and displacing an incumbent machine is far harder than adding a second one.

High-value pools concentrate where protection failure is expensive. Electronics, glassware, cosmetics, and high-value apparel all justify engineered systems on returns cost rather than on material price, and those customers rarely re-tender on paper price alone. Those customers rarely re-tender on paper price alone.

Volume / Commodity-Adjacent Tier

Crumpled paper void fill on light basis weight grades at high yield per kilogram. Lowest consumable revenue per placement in the range and the most exposed to paper price, but the form that gets a supplier into a packing station where higher-value systems can follow.
Gross Margin: 22-26%

Premium / Certified Tier

Expandable honeycomb wrap and paper bubble systems on heavier grades at lower yield, generating substantially more consumable revenue from the same packing station. Margin reflects paper grade value and the operator familiarity that makes displacement genuinely difficult for a competitor.
Gross Margin: 31-35%

Sustainability / Regulatory / Next-Generation Tier

Engineered die-cut inserts and custom protective systems designed against a specific product and drop profile. Best margin because the design content is bespoke, the qualification is tested against returns data, and price competition on paper alone becomes largely irrelevant.
Gross Margin: 38-42%
paper-cushion-systems-market-portfolio-architecture-1787299630514

High-value Sub-segments and Strategic Watch-out

Expandable Honeycomb Wrap

Fastest growth at 12.9%, exactly 1.50 times the market rate, and the one genuine product-for-product replacement for bubble film. Heavier grades at lower yield mean roughly 2.4 times the consumable revenue per placement, on a machine costing only modestly more to place. Adoption needed almost no retraining anywhere.
Gross Margin: 31-35%

Engineered Die-Cut Protective Systems

Best margin in the portfolio, sold against returns cost rather than material price, which removes paper price from the conversation almost entirely. Electronics, glassware, and cosmetics justify it on damage data. Design content makes these placements the stickiest anywhere in the range. Nobody re-tenders these on paper price.
Gross Margin: 38-42%

Crumpled Paper Void Fill

The volume core at the thinnest margin and the lowest consumable revenue per station, fully exposed to kraft paper movement. It nonetheless wins the packing station in the first place, and displacing an incumbent machine later is considerably harder than adding a second one. Margin here will keep compressing steadily.
Gross Margin: 22-26%

Low-Throughput Placements

The strategic watch-out, since a machine at a station consuming below assumed volume never reaches payback and eventually becomes part of the 11% annual churn. Sales incentives paid on installation count rather than paper volume generate these placements year after year. The fix is an incentive change.
Gross Margin: 22-26%

How Paper Revenue Recurs

Revenue here recurs through consumption at a machine rather than through any repurchase decision, which is why the model works at all. Once a placement is installed and operators have learned it, kraft paper flows through it every shift without anybody reconsidering the choice, and the reorder happens automatically against a standing arrangement. That gives the supplier an annuity for as long as the station keeps packing, which on a stable fulfilment operation runs many years without interruptio
Depth varies sharply by operation type. Dedicated fulfilment centres running one packing layout are the deepest, since the machine becomes part of the bench and nobody redesigns a working station. Third-party logistics operations stick least, because their own customers change and the packing specification changes with them. Retail store back-of-house placements sit in between. Contract packers behave unpredictably, converting whenever a client mandate arrives and reverting when that client leaves.

Buyer profiles have moved from operations toward sustainability. Packing supervisors once chose the material on handling grounds; sustainability functions now specify it centrally and the packing station receives the decision, which changes who the supplier has to persuade entirely.
paper-cushion-systems-market-end-use-penetration-index-1787299631009

What We Would Tell a Board

These are among the four positions where our research anticipates prominent divergence between winners and laggards over the coming forecast period. Each is grounded in the demand model, the regulatory perimeter, and the announced capacity pipeline.
01 / PLACEMENT QUALIFICATION DISCIPLINE

Measure the station before installing anything in it

A placement is 6,400 dollars of capital against a nineteen month payback, and the commonest cause of churn is a packing station that never reached the paper volume the sales call assumed it would. Two weeks of measuring actual parcel throughput before installing costs almost nothing and removes most of the bad placements a sales force would otherwise make. Suppliers doing this run churn near 6% against an industry level of 11%, which is roughly 340 dollars of preserved capital on every placement made.
02 / CONSUMPTION TERMS ENFORCEMENT

Handshake placements put all the risk on you

Most machines are placed with no volume commitment at all, which leaves the supplier carrying every risk on an asset installed inside somebody else's warehouse building. A minimum annual consumption clause, or a rental that falls away above a threshold, transfers that risk back without changing the economics for any customer using the machine as intended. Suppliers with consumption terms recover roughly 2,900 dollars per churned placement that would otherwise be written off completely, and customers resist the paperwork rather than the substance of the arrangement itself.
03 / IDLE ASSET RECOVERY

Machines sitting idle are capital earning precisely nothing

When a placement goes quiet the machine usually stays in the customer's warehouse for months, because nobody owns retrieving it and the freight looks larger than the residual value appears to be. It is not, since a refurbished unit redeploys at roughly 40% of new cost and shortens the next payback accordingly. Structured recovery with quarterly idle-placement reporting redeploys most retrieved machines within two quarters, and the absence of any such process is comfortably the largest avoidable cost in this entire business model.
04 / PLACEMENT MIX QUALITY

Placement count is the wrong number to optimise

A crumpled void fill station consumes light paper at high yield and generates the lowest consumable revenue anywhere in the range, while a honeycomb station on heavier grades produces roughly 2.4 times as much from a machine costing only modestly more to place. Honeycomb also grows at 12.9% against 8.6% for the market overall. Suppliers paying sales incentives on installation count rather than paper volume have systematically filled their installed base with the least valuable stations available anywhere in the market.

Engagement Snapshot From the Field

A live engagement with an industry participant carrying material or product regulatory and market exposure ahead of a defining policy shift, showing how our research translates into a defensible multi-year portfolio strategy.
MARKET MINDS ADVISORY · CLIENT ENGAGEMENT SUMMARY
Paper Cushion Systems Producer Strategic Portfolio Review and Transition Roadmap 2026·Investment Scenario on Paper Cushion Systems Exposure Evaluation 2025-26
CLIENT PROFILE
A protective packaging supplier with approximately 210 million dollars in annual revenue (client-reported, unverified by MMA), operating a placed machine base of roughly eleven thousand units across North America and Western Europe. The business sold kraft paper consumables through those placements, paid sales commission on installations rather than on paper volume, and held no formal process for retrieving idle machines.
STRATEGIC CHALLENGE
Placement count had grown 14% annually for three years while paper revenue grew only 6%, and gross margin had fallen in each of those years. Management proposed accelerating installations further to close the revenue gap. The board wanted an independent read on whether more placements would help before approving additional capital for machine building.
MMA APPROACH
We reconstructed paper consumption per placement by cohort, vintage, and system form across the whole installed base. Idle and low-throughput placements were identified from consumption records rather than from account status. Churn was measured against machine capital and payback rather than against account count, and sales incentive structures were reviewed against the placements they had actually generated.
KEY FINDINGS
  1. Roughly 11% of the installed base consumed below a quarter of assumed volume, and most of those placements had been installed within the previous two years by the same commission structure.
  2. Crumpled void fill accounted for 71% of placements but only 44% of paper revenue, because sales incentives rewarded installation count and void fill was the fastest form to install.
  3. An estimated 1,300 machines sat idle at customer sites with no retrieval process, representing capital of roughly eight million dollars earning nothing at all.
  4. Placements qualified with pre-installation throughput measurement, a practice used by one regional team only, showed churn near 6% against 11% across the rest of the base.
CLIENT PROFILE
A protective packaging supplier with approximately 210 million dollars in annual revenue (client-reported, unverified by MMA), operating a placed machine base of roughly eleven thousand units across North America and Western Europe. The business sold kraft paper consumables through those placements, paid sales commission on installations rather than on paper volume, and held no formal process for retrieving idle machines.
STRATEGIC CHALLENGE
Placement count had grown 14% annually for three years while paper revenue grew only 6%, and gross margin had fallen in each of those years. Management proposed accelerating installations further to close the revenue gap. The board wanted an independent read on whether more placements would help before approving additional capital for machine building.
MMA APPROACH
We reconstructed paper consumption per placement by cohort, vintage, and system form across the whole installed base. Idle and low-throughput placements were identified from consumption records rather than from account status. Churn was measured against machine capital and payback rather than against account count, and sales incentive structures were reviewed against the placements they had actually generated.
KEY FINDINGS
  1. Roughly 11% of the installed base consumed below a quarter of assumed volume, and most of those placements had been installed within the previous two years by the same commission structure.
  2. Crumpled void fill accounted for 71% of placements but only 44% of paper revenue, because sales incentives rewarded installation count and void fill was the fastest form to install.
  3. An estimated 1,300 machines sat idle at customer sites with no retrieval process, representing capital of roughly eight million dollars earning nothing at all.
  4. Placements qualified with pre-installation throughput measurement, a practice used by one regional team only, showed churn near 6% against 11% across the rest of the base.
RECOMMENDED STRATEGY
Phase 1: Phase 1 (months one to six): change sales incentives from installation count to paper volume consumed, and mandate pre-installation throughput measurement everywhere. Phase 2: Phase 2 (months six to eighteen): retrieve and refurbish idle machines under a structured programme with quarterly utilisation reporting to management. Phase 3: Phase 3 (months eighteen to thirty-six): weight new placements toward honeycomb and wrap forms rather than crumpled void fill. Void fill still wins the station first.
OUTCOME
The capital increase was not approved. Placement growth slowed deliberately to 8% while paper revenue growth rose above 11%, roughly nine hundred idle machines were retrieved and redeployed within four quarters, and gross margin recovered by more than two points (client-reported, unverified by MMA). Churn fell below eight percent.

Frequently Asked Questions

Foundational context covering the market sizes, CAGR, scope, country, region and competition that inform every finding below. This section is provided to cover basics and most often pre-purchase conversations, answered from the MMA Primary Research Dataset.

What is the current size of the Paper Cushion Systems Market?

The market is valued at USD 3.4 billion in 2025, rising to USD 3.69 billion in 2026. Scope covers both converting machines and the kraft paper consumables processed through them.

How large will the Paper Cushion Systems Market be by 2036?

MMA forecasts USD 8.42 billion by 2036, an increase of USD 4.73 billion over the 2026 base. That represents an expansion multiple of 2.28 times across the forecast period.

What is the CAGR for the Paper Cushion Systems Market 2026 to 2036?

The base case CAGR is 8.6%, with a bull case of 9.8% and a bear case of 7.4%. The historical rate from 2020 to 2025 was 7.4%, so growth is accelerating steadily.

Which segment is growing fastest?

Expandable honeycomb wrap at 12.9%, exactly 1.50 times the market rate. It replaced bubble film directly at the packing station, needing similar bench space and almost no operator retraining.

Who are the major companies in the Paper Cushion Systems Market?

Ranpak, Storopack, Sealed Air, Pregis, and Smurfit Westrock lead on installed machine placements. The top five hold 62%, which is high and follows directly from the placement model.

Which country is growing fastest?

China at 11.6%, as domestic e-commerce premiumises and cushioning intensity per parcel rises from a very low base. Chinese fulfilment still uses a fraction of the material an American parcel receives.

Report Segmentation Architecture

The full report scope spans multiple orthogonal segmentation dimensions, with cross-tabulated demand data provided for each dimension pair. Coverage extends further to regional breakdowns, trend trajectories, and the competitive detail needed to support segment-level decision-making.

By Cushioning System Form

  • Crumpled Paper Void Fill
  • Paper Pad And Mat Cushioning
  • Expandable Honeycomb Wrap
  • Paper Bubble And Embossed Wrap
  • Corner And Edge Paper Protectors
  • Die-Cut Paper Insert Systems

By End-Use Industry

  • E-Commerce Retail Fulfilment
  • Electronics And Appliances
  • Automotive And Industrial Parts
  • Cosmetics, Apparel And Footwear
  • Healthcare And Laboratory Supplies

By Customer Type

  • Dedicated Retailer Fulfilment Centres
  • Third-Party Logistics Operations
  • Contract Packers And Co-Manufacturers
  • Industrial Manufacturers Shipping Direct
  • Packaging Distributors And Resellers

By Region

  • North America
  • Western Europe
  • East Asia
  • South Asia and Pacific
  • Latin America
  • Eastern Europe
  • Middle East and Africa

Scope, Methodology, and Coverage

Every figure in this report is reproducible from documented input assumptions. The scope below maps the historical period, the forecast horizon, the segmentation dimensions, and the countries covered, alongside the underlying primary and qualitative methodology.
Historical Period
2020 to 2025
Forecast Period
2026 to 2036
Base Year
2025 (USD billions; MMA Primary Research Dataset, August 2026)
Market Definition
This market comprises paper-based protective cushioning and void fill systems, measured at supplier realised prices across both the converting equipment placed at packing stations and the kraft paper consumables processed through it. System coverage spans crumpled paper void fill, paper pad and mat cushioning, expandable honeycomb wrap, paper bubble and embossed wrap, corner and edge protectors, and die-cut paper insert systems. Plastic air pillow and bubble film systems, expanded polystyrene and polyethylene foam, moulded pulp packaging, corrugated boxes and cartons, tapes and strapping, and upstream kraft papermaking fall outside scope.
Quantitative Units
USD billions (current prices); installed machine placements; tonnes of kraft paper consumed; consumable revenue per placement
Segmentation Dimensions
By Cushioning System Form; By End-Use Industry; By Customer Type; By Region
Regions Covered
North America, Western Europe, East Asia, South Asia and Pacific, Latin America, Eastern Europe, Middle East and Africa
Countries Covered
USA, Canada, Mexico, Germany, France, UK, Netherlands, Belgium, Spain, Italy, Sweden, Denmark, Poland, Czechia, Romania, Turkey, China, Japan, South Korea, India, Australia, Singapore, Malaysia, Thailand, Brazil, Chile, Colombia, Saudi Arabia, UAE, South Africa, and additional markets relevant to this sector
Key Companies Profiled
Ranpak, Storopack, Sealed Air, Pregis, Smurfit Westrock, Intertape Polymer Group, Mondi, DS Smith, Sonoco, Packsize, Veritiv, Bunzl, Antalis, Rajapack, Macfarlane Group, Cascades, Nefab, Signode, Tri-Wall, Klabin
Quantitative Methodology
Primary survey, n=3,800 respondents, Q4 2025, six countries; demand-side model with trade association cross-validation
Qualitative Methodology
47 expert interviews, Q4 2025; applied to validate demand model assumptions, identify emerging dynamics, and assess competitive positioning
Report Format
PDF and XLSX data workbook (Word format preview document)
Publisher
Market Minds Advisory
Report Code
MMA-2026-PAC-399
Published
August 2026
Contact
sales@marketmindsadvisory.com | www.marketmindsadvisory.com

Purchase the full Paper Cushion Systems Market Report (2026 to 2036).

The full report sizes paper cushion systems across six system forms, five end-use industries, five customer types, and seven regions, with country detail for the thirty largest fulfilment markets. Machine placement economics are modelled by system form, covering placement capital, payback period, consumable revenue per station, and churn, since those four numbers rather than headline revenue decide who makes money here. Cushioning intensity per parcel is quantified by country, which explains why the largest e-commerce market by volume is not the largest market for cushioning. Competitive profiling covers twenty companies on installed placements. Kraft paper yield per kilogram is compared across commercial system forms.
Machine placement economics modelled by system form
Placement churn and payback quantified across installed bases
Cushioning intensity per parcel measured by country
Kraft paper yield per kilogram compared across systems
Freight and warehouse penalty assessed against plastic film
Retailer packaging mandates tracked by network and deadline

Built For The People Who Decide

From boardroom strategy to bench-side execution, this report is read cover-to-cover by leaders shaping the next decade of their industry, turning demand scenarios, market dynamics and valuation benchmarks into decisions.
CXOs/ Presidents/ VPs/ Managers
M&A and Corporate Development
Strategy Teams and R&D Heads
Procurement and Product Directors
Regulatory and Compliance Leaders
Investor Relations and Equity Analysts