Market Minds Advisory
Pallet Pooling Market

Pallet Pooling Market: Renting Wood Is The Easy Part, Getting It Back Is The Business

A commercial reading of pooled transport assets, where the rental invoice is trivially simple and the entire economics rest on how many pallets come back, how fast, and in what condition.

Lead Analyst

David Horsley

Published

September 2026

Make Smarter Decisions with Customized Research Insights

Request a free sample report and evaluate market opportunities, growth trends, and competitive dynamics relevant to your business needs.

2025 MARKET VALUE$9.8BMarket Size 2025
2036 FORECAST VALUE$18.0BBase Case , 2026 to 2036
CAGR 2026 TO 20365.7 %Bull 6.9% / Bear 4.5%
INCREMENTAL OPPORTUNITY$7.6BNet 10- year value creation
EXPANSION MULTIPLE1.74x2036 value over 2026 base
Strategic Levers
M&A Pipeline
Regional Outlook
Country Rankings
Competitive Intelligence
Segmental Deep-dive
Call-Us : 91 93563 13602

Executive Snapshot and Market Trajectory

Nobody in this business is really selling a pallet. They are selling the promise that a wooden platform released into somebody else's supply chain will come back, on time, repairable, and countable. Everything commercial follows from asset recovery. Everything else in this business follows from that.
The market stands at USD 9.8 billion in 2025 and reaches USD 17.98 billion by 2036 at a 5.7% CAGR. Reusable plastic container pooling grows fastest at 9.8%, about 1.72 times the overall rate, as fresh produce and automotive parts move toward closed-loop crates. North America holds 30% of value on retail consolidation and long-established pool density, while India posts the quickest national growth at 12.6%.
Concentration is severe, with the top five holding roughly 61% of pooling revenue because density is the whole moat and nobody builds it quickly. Two forces pull against each other. Retailers and manufacturers keep pushing standardisation and asset visibility onto pool operators, while pallet loss, timber cost, and repair inflation press on the same operators from the other side. Density decides who can absorb it. Rental rate is not really the variable that matters.
Market Definition
The pallet pooling market covers the rental, issue, recovery, inspection, repair, and reissue of standardised returnable transport assets under a pooled ownership model, spanning wooden block and stringer pallet pooling, plastic pallet pooling, reusable plastic container pooling, intermediate bulk container pooling, and display and half-pallet pooling. One-way and whitewood pallet sales, pallet manufacture sold outright, timber and pallet component supply, warehouse racking and handling equipment, freight and haulage services, and returnable packaging owned outright by a single shipper are excluded.
Base Year Value
$9.8B in 2025 (MMA Primary Research Dataset, August 2026)
Forecast Period
2026 to 2036, eleven discrete annual values
CAGR
5.7% base case. Bull 6.9%. Bear 4.5%.
Fastest Growth Segment
Reusable Plastic Container Pooling: 9.8% CAGR
Fastest Growth Country
India: 12.6% CAGR
Fastest Growth Region
South Asia and Pacific: 7.9% CAGR
Largest Region
North America: 30% of 2025 global value
Market Leaders
Brambles, Faber Halbertsma Group, PALLET-Pool, LPR La Palette Rouge, IFCO Systems. Source: MMA Analysis based on company annual reports.
Primary Survey
n=3,800 procurement and R&D decision-makers, Q4 2025, six countries
Methodology
Demand-side build-up, cross-validated against public data, 47 expert interviews

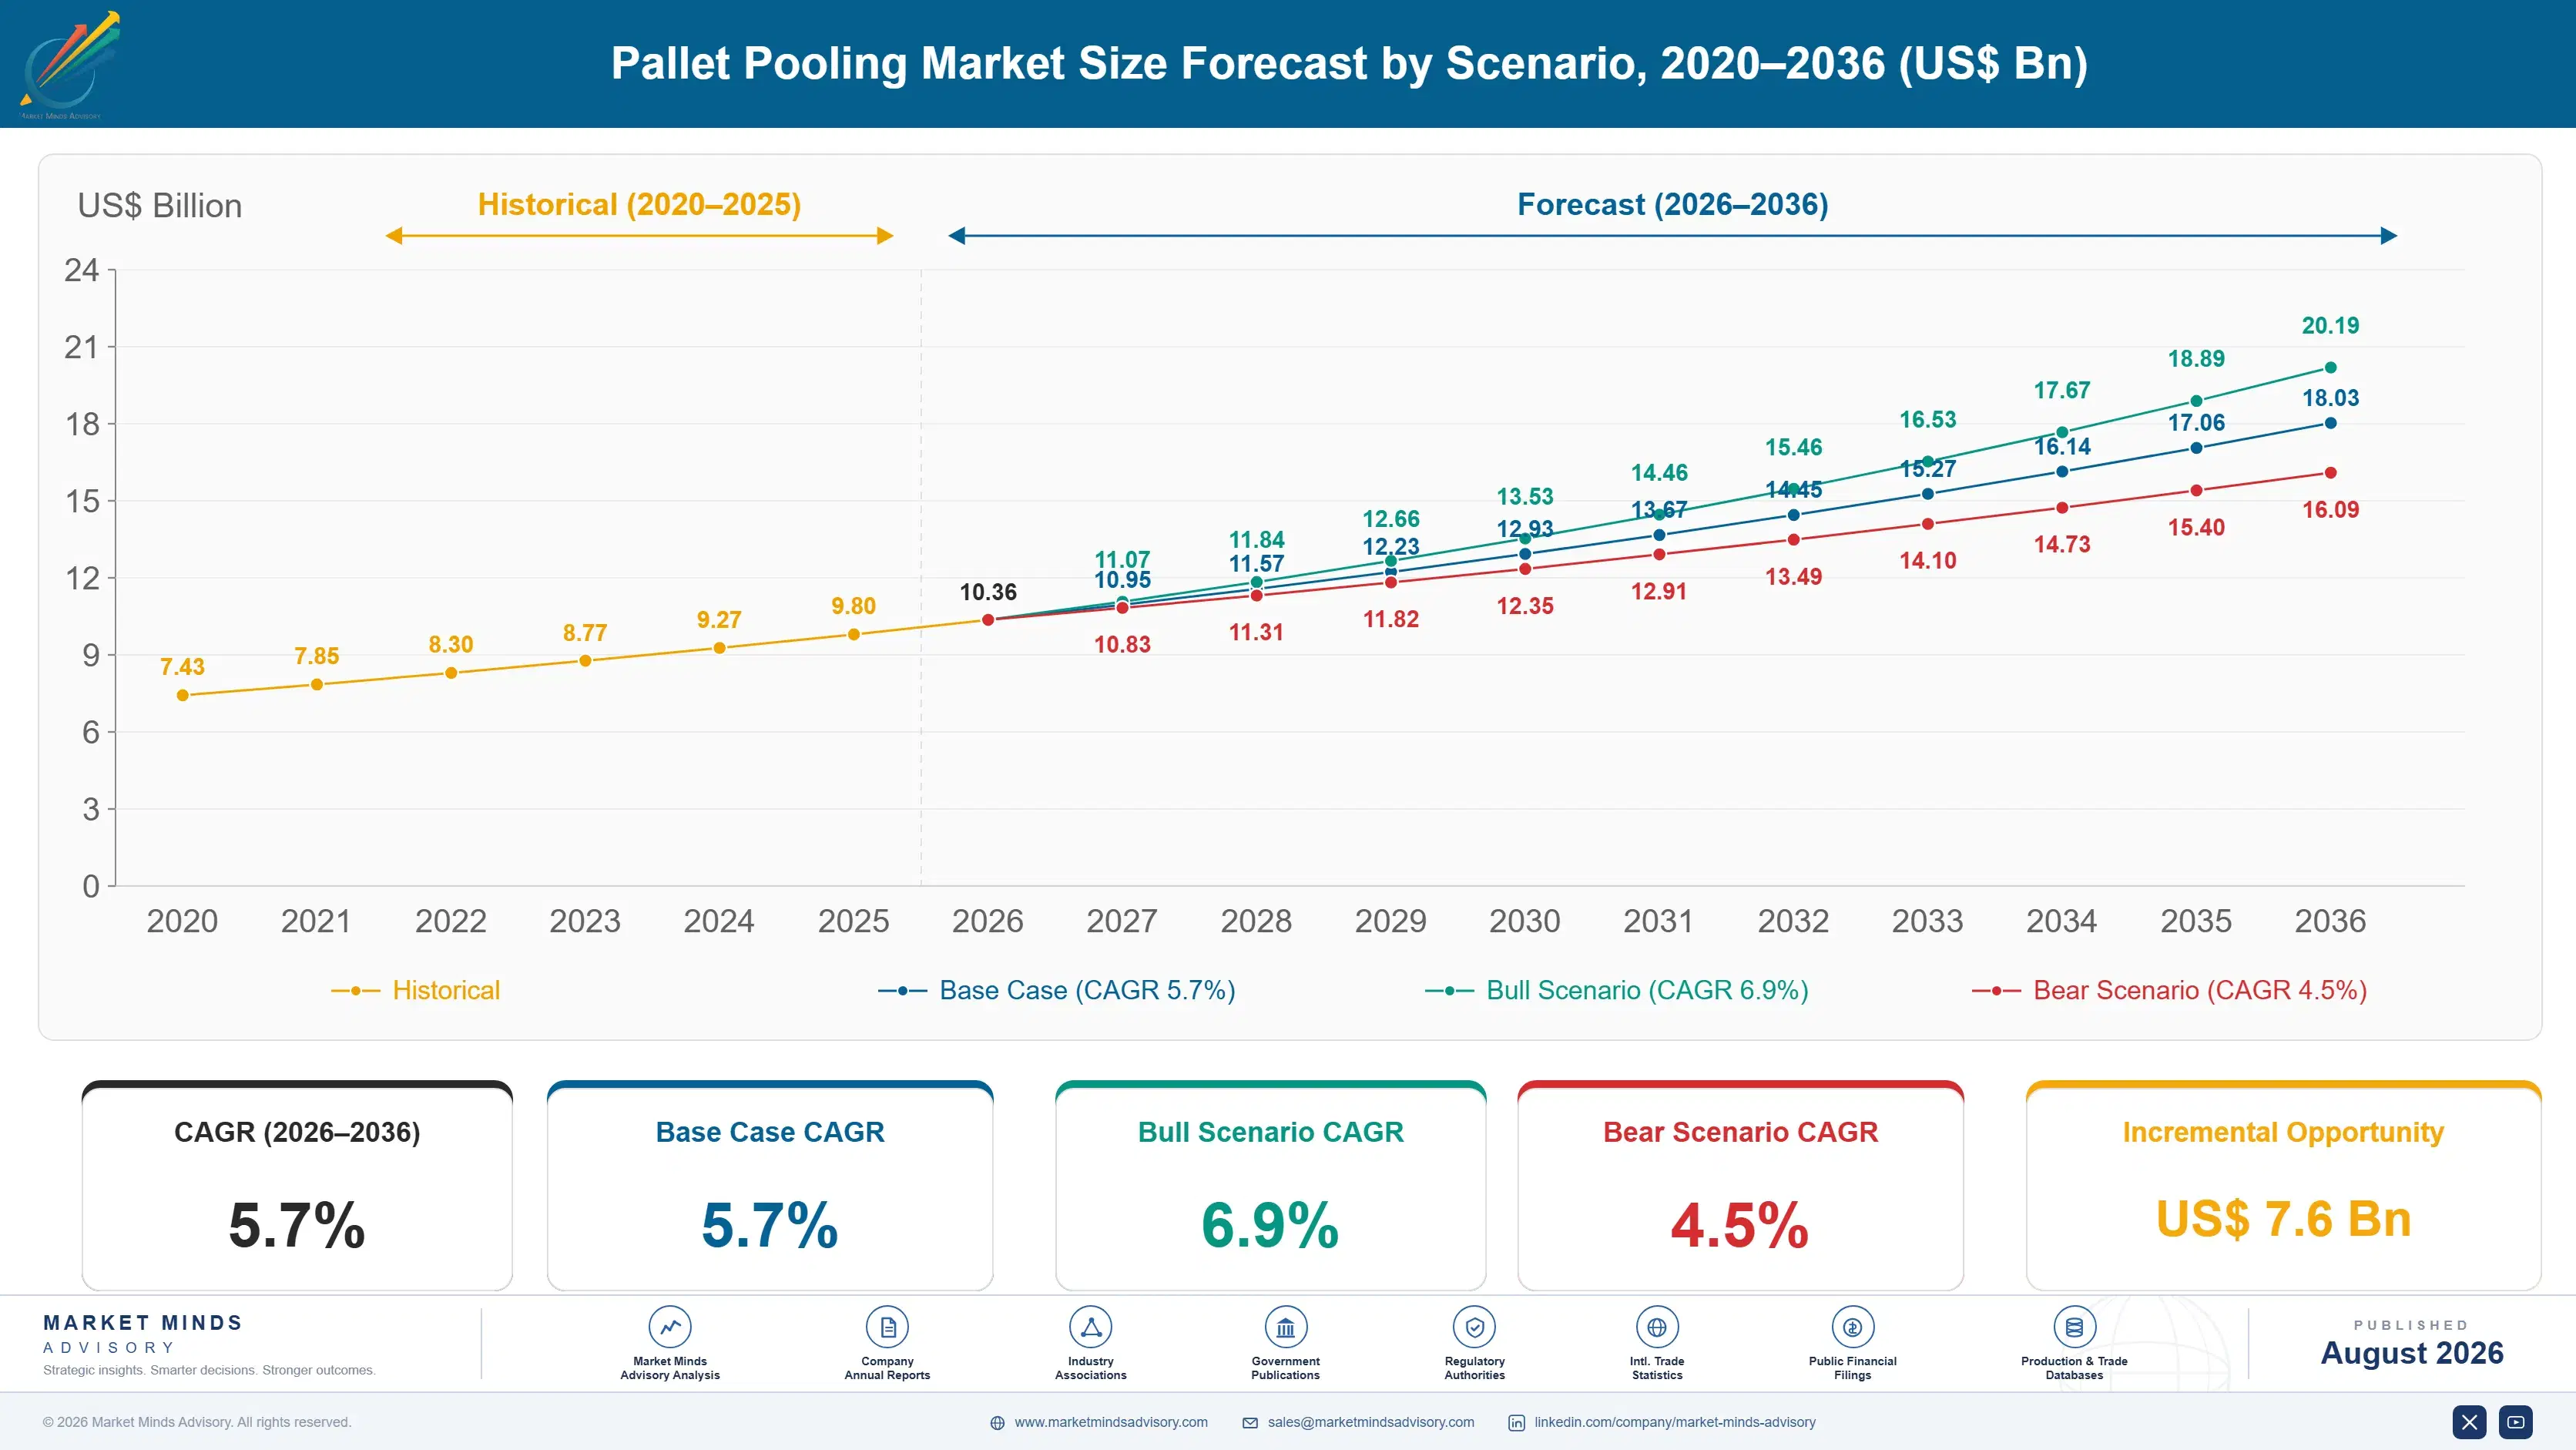
Pallet Pooling Market Forecast Scenarios

pallet-pooling-market-size-forecast-scenario-1787332068862
Growth from 2020 to 2025 compounded near 4.6%, and asset losses rather than demand shaped the period. Pandemic buying held pallets in retail back rooms and consumer homes for months, pool operators lost visibility on very large numbers of units, and replacement timber cost rose sharply at the same moment. Surcharge disputes with customers ran for years afterwards. Volume recovered well before asset productivity did.
Three mechanisms carry the base case to 5.7%. First, retail supply chain standardisation, which keeps converting whitewood flows into pooled equipment because retailers refuse mixed asset quality at the dock. Second, reusable crate adoption in fresh produce and automotive, where closed loops and washing services replace corrugated entirely. Third, asset tracking, which converts recovery from an estimate into a measurable number and finally allows pooling to be priced on real utilisation.
The bull case at 6.9% assumes tracking rolls out broadly enough to cut loss rates materially and crate adoption keeps taking corrugated volume. The bear case at 4.5% assumes timber and repair inflation outpace what customers accept in rental increases, retailers keep resisting surcharges for unreturned assets, and whitewood pallet supply stays cheap enough that price-sensitive shippers exit pooling altogether in weaker economies.

Density Is The Moat, Recovery Is The Product

Demand rests on three foundations. Retail standardisation provides the volume, since receiving docks reject mixed pallet quality and pooled equipment is the practical answer. Asset density provides the economics, because a pool with more collection points in a given geography recovers faster and repositions cheaper than a thinner one. And recovery discipline provides the margin, since every unreturned unit is a write-off nobody budgeted for.
MARKET CONCENTRATIONCR5: 61%Consolidated because pool density cannot be built quickly
ANNUAL ASSET LOSS RATE3% to 8%Pooled units not recovered within a normal cycle
PALLET TRIP CYCLE45 to 90 daysTime a unit takes to return for inspection and reissue
REPAIR SHARE OF COSTAbout 24%Inspection and repair against total pool operating cost
ASSET SERVICE LIFE7 to 12 yearsWorking life of a pooled wooden pallet before retirement
TRACKED ASSET SHAREAbout 18%Pooled units currently carrying a digital identifier of any kind
Commercially the striking feature is how little of the story sits in the rental rate. Trip cycles run 45 to 90 days and loss rates 3% to 8% annually, so a small change in either moves earnings far more than a rental increase does. Repair and inspection alone is roughly 24% of operating cost. Operators talking to customers about price rather than return behaviour are negotiating the wrong variable.
The next decade turns on visibility and crates. Only about 18% of pooled assets carry a digital identifier, which means most loss is still inferred rather than located, and tracking changes both the recovery and surcharge conversations. Reusable plastic containers at 9.8% growth meanwhile take volume from corrugated in fresh produce and automotive, bringing washing and hygiene obligations that wooden pooling never carried.
"Pooling companies describe themselves as sustainability businesses now, and the arithmetic genuinely supports it. But the number that actually decides whether a pool earns anything is how many pallets are sitting behind a supermarket in a county nobody has visited for six weeks."
Director, Returnable Transport Assets and Supply Chain Packaging Practice · MMA

Market Trends

Digital Tracking Turns Asset Loss Into Located Loss

Only about 18% of pooled assets carry a digital identifier today, which means most loss is still inferred from issue and collection counts rather than located on a map. Low-cost tags and gateway readers at distribution centres are changing that, and the commercial consequence reaches well beyond recovery rates. An operator that can show a customer exactly where 4,000 unreturned pallets are sitting has an entirely different surcharge conversation, and a very different case for rental increases. Retrofitting an existing pool of many millions of units is the practical obstacle.
Market Impact: Automation cuts tolerance to 5 mill
Reusable Crates Displace Corrugated In Fresh Produce

Reusable plastic container pooling grows at 9.8% against a market at 5.7%, driven by grocery retailers converting fresh produce, bakery, and meat flows out of one-way corrugated and into washable crates on closed loops. The economics work where volume is high, the loop is short, and a washing facility sits within reasonable distance. Hygiene obligations arrive with the format, since a crate that has held raw protein must be documented as cleaned before reuse. That washing infrastructure is a barrier competitors underestimate and a cost customers rarely see. Wooden pool operators largely lack that capability.
Market Impact: Top five hold 61% of revenue

Market Opportunities and Growth Drivers

Retail Docks Reject Mixed Pallet Quality Outright

Large grocery and general merchandise retailers refuse inconsistent pallet quality at goods-in, because a broken stringer stops an automated conveyor and a warped deck jams a shuttle rack. Pooled equipment inspected and repaired to one standard is the practical answer, which is why retailer specification rather than shipper preference has driven most conversion out of whitewood. Automation makes this stricter every year, since tolerance on a manual forklift dock is far wider than on an automated storage system. Shippers supplying those retailers have no realistic alternative. Whitewood simply cannot meet the consistency requirement.
Market Impact: Loss runs 3% to 8% yearly

Pool Density Compounds Into A Genuine Cost Advantage

An operator with more issue and collection points in a given geography recovers assets faster, repositions empties over shorter distances, and fills return legs that a thinner competitor runs empty. Trip cycles of 45 to 90 days and repositioning cost both improve with density, and neither can be bought quickly because density is built customer by customer over years. That is why the top five hold roughly 61% of revenue in a business with no technology barrier at all. New entrants face the economics in reverse. Density is bought or built, never quoted.
Market Impact: Repair is 24% of operating cost

Market Restraints and Challenges

Unreturned Assets Are A Capital Loss Nobody Budgets

Between 3% and 8% of pooled units fail to return within a normal cycle each year, and every one is a capital write-off against a pool the operator financed. The root cause is that the asset leaves the operator's control the moment it is issued, and the party holding it has almost no incentive to arrange collection. Commercially this is the single largest variable in pool earnings. Operators mitigate through digital tracking, surcharge and compensation clauses written into customer terms, third-party recovery networks, and audits at the receiving locations where units accumulate.
Market Impact: Only 18% of assets carry tags

Timber And Repair Inflation Outpace Rental Increases

Hardwood and softwood pallet lumber pricing moves on construction demand and sawmill capacity that pooling operators do not influence, while repair labour has inflated across every developed market. The root cause is a rental contract repricing annually against input costs that move monthly. Commercially this compresses margin whenever timber rises, and customers resist surcharges more firmly than they resist rate increases. Operators mitigate through timber forward purchasing, in-house repair network scale, design changes that cut repair frequency, and indexation clauses where customers will accept them. Customers concede rate rises before they concede surcharges.
Market Impact: Crate pooling grows at 9.8%
4 additional market trends, 3 additional growth drivers, and 2 additional restraints and challenges are covered in the full report. Contact sales@marketmindsadvisory.com to access the complete intelligence.

Segment CAGR and Growth Architecture

Segmentation follows pooled asset type, a single classification describing the returnable unit being rented and recovered. Each type carries its own material cost, repair regime, hygiene requirement, and loop geometry, so commercial economics track the asset rather than the goods carried on it. End-use industry and contracting model appear separately within the framework as their own distinct dimensions.
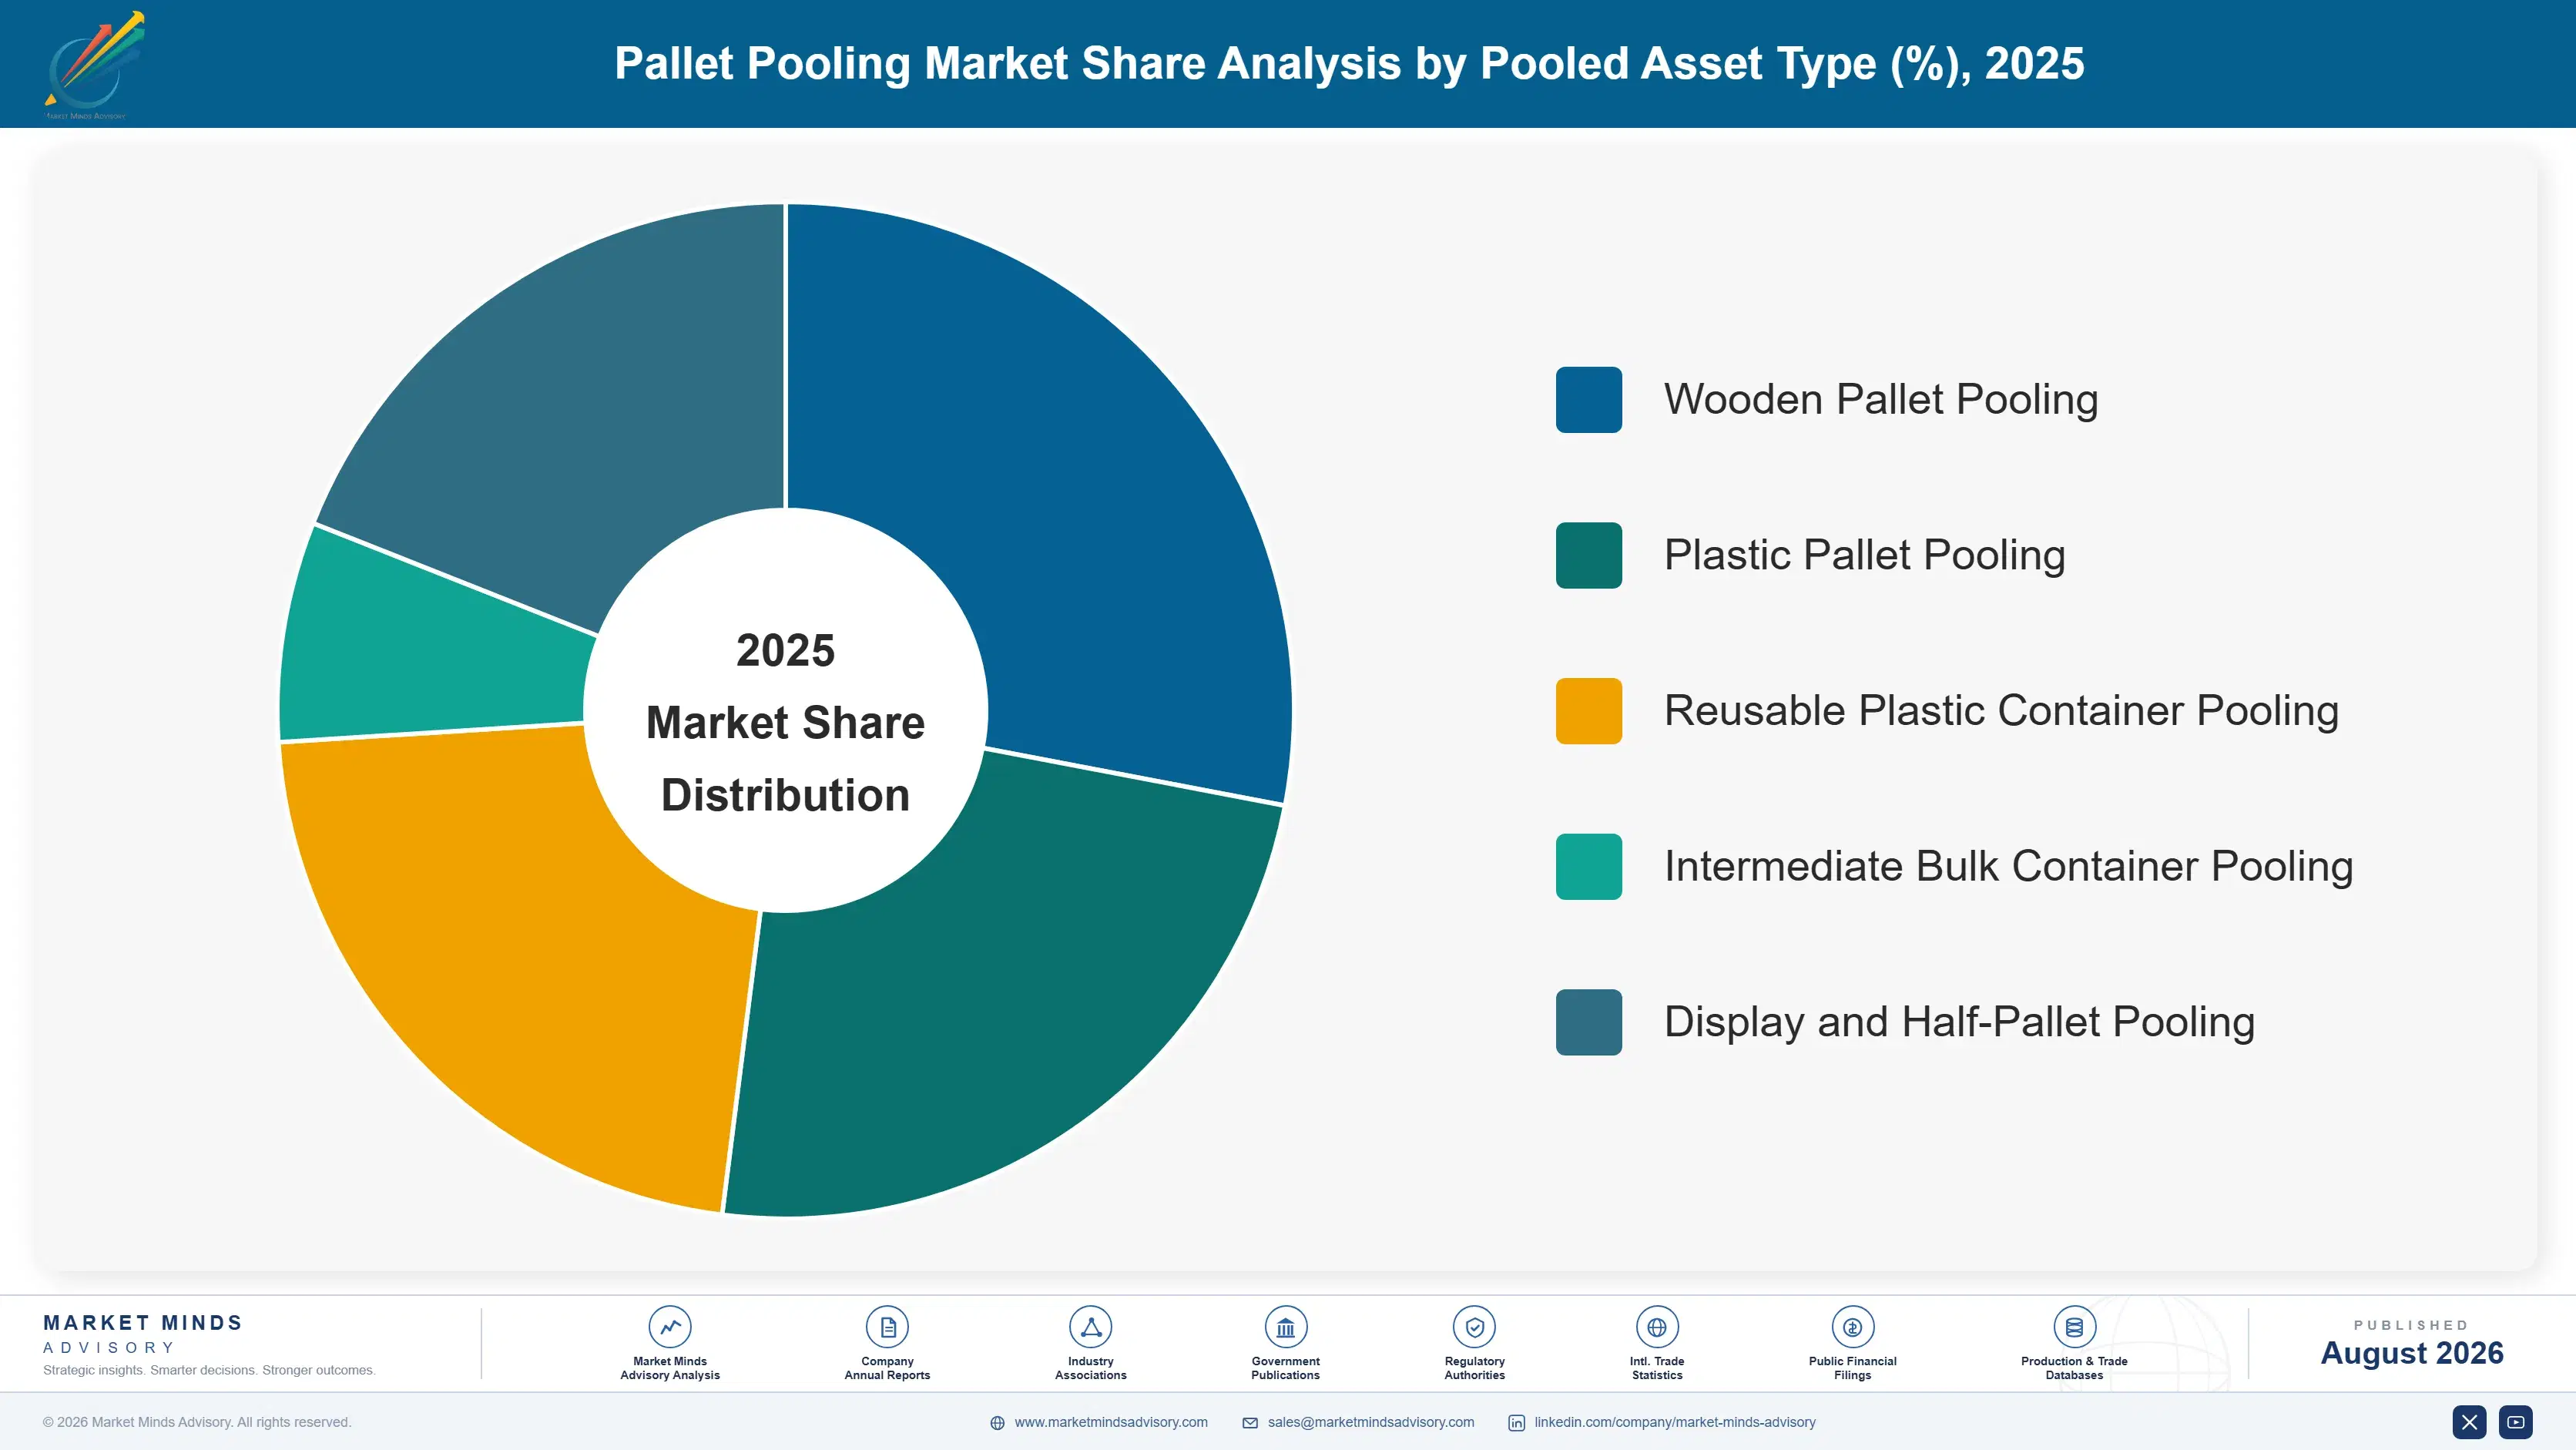
pallet-pooling-market-market-share-analysis-1787332069390

Reusable Plastic Container Pooling

Reusable plastic container pooling grows fastest at 9.8%, about 1.72 times the overall 5.7% rate, and corrugated displacement rather than pallet conversion drives it. Grocery retailers moving fresh produce, bakery, and meat into washable crates on short closed loops eliminate one-way packaging entirely, which is a cleaner sustainability argument than any pallet claim. The economics require high volume, a short loop, and a washing facility within reasonable distance. Hygiene documentation arrives with the format, since a crate that carried raw protein must be recorded as cleaned before reuse. That washing infrastructure is the real barrier and competitors consistently underestimate what it costs. Retailer food safety records absorb the documentation entirely.
CAGR 9.8%

Plastic Pallet Pooling

Plastic pallet pooling grows at 7.4%, the second-fastest asset type, and hygiene-sensitive and automated environments explain most of it. A moulded plastic pallet does not splinter, absorb moisture, or harbour pest risk, which matters in pharmaceutical, dairy, and export flows where phytosanitary treatment of wood adds cost and delay. Dimensional consistency also suits automated storage systems better than a repaired wooden deck. The unit cost is several times a wooden equivalent, so the economics depend entirely on recovery, and a lost plastic pallet hurts far more than a lost wooden one. Pools therefore concentrate in tightly controlled closed loops. Open loops running plastic assets rarely survive the loss arithmetic at all.
CAGR 7.4%
Full segment breakdown across 5 segments available in the complete report.

Regional Architecture and Country Demand Map

Retail concentration and pool density together set this distribution rather than economic size. North America and Western Europe lead because retail consolidation built dense pools decades ago, while South Asia and Pacific grows quickest as organised retail reaches the scale pooling requires. Recovery infrastructure decides where pooling works.

North America

North America holds 30% of value, and retail concentration rather than freight volume explains why pooling penetrated so deeply here. A handful of grocery and general merchandise chains standardised receiving requirements decades ago, which converted whitewood flows to pooled equipment across most consumer goods supply chains. Pool density is consequently the highest anywhere, and repositioning economics reflect it. Asset loss through retail back rooms and secondary handlers remains the persistent operating problem, and surcharge disputes with large customers recur. Growth of 5.1% reflects a mature base where conversion is largely complete and volume tracks consumer goods shipments. Crate adoption is the live expansion. Conversion out of whitewood is essentially finished here.
Share: 30% | CAGR: 5.1% (2026 to 2036)

Western Europe

Standardisation went furthest here and earliest. Western Europe holds 26% of value, with the Euro pallet establishing a common footprint that pooling operators, exchange systems, and open pools have all built around, which is why several distinct pooling models coexist rather than one dominating. Retailer specification is strict and automation penetration in distribution centres is high. Timber cost and repair labour inflation have both pressed hard since 2022 and customers have resisted surcharges firmly. Growth of 4.2% is the slowest of the seven regions, reflecting flat consumer goods volumes and a conversion story that finished years ago. Several distinct pooling and exchange models compete here rather than one dominant operator.
Share: 26% | CAGR: 4.2% (2026 to 2036)
Regional intelligence for 5 additional markets available in the complete report: East Asia, South Asia and Pacific, Latin America, Middle East and Africa, Eastern Europe. Contact sales@marketmindsadvisory.com.
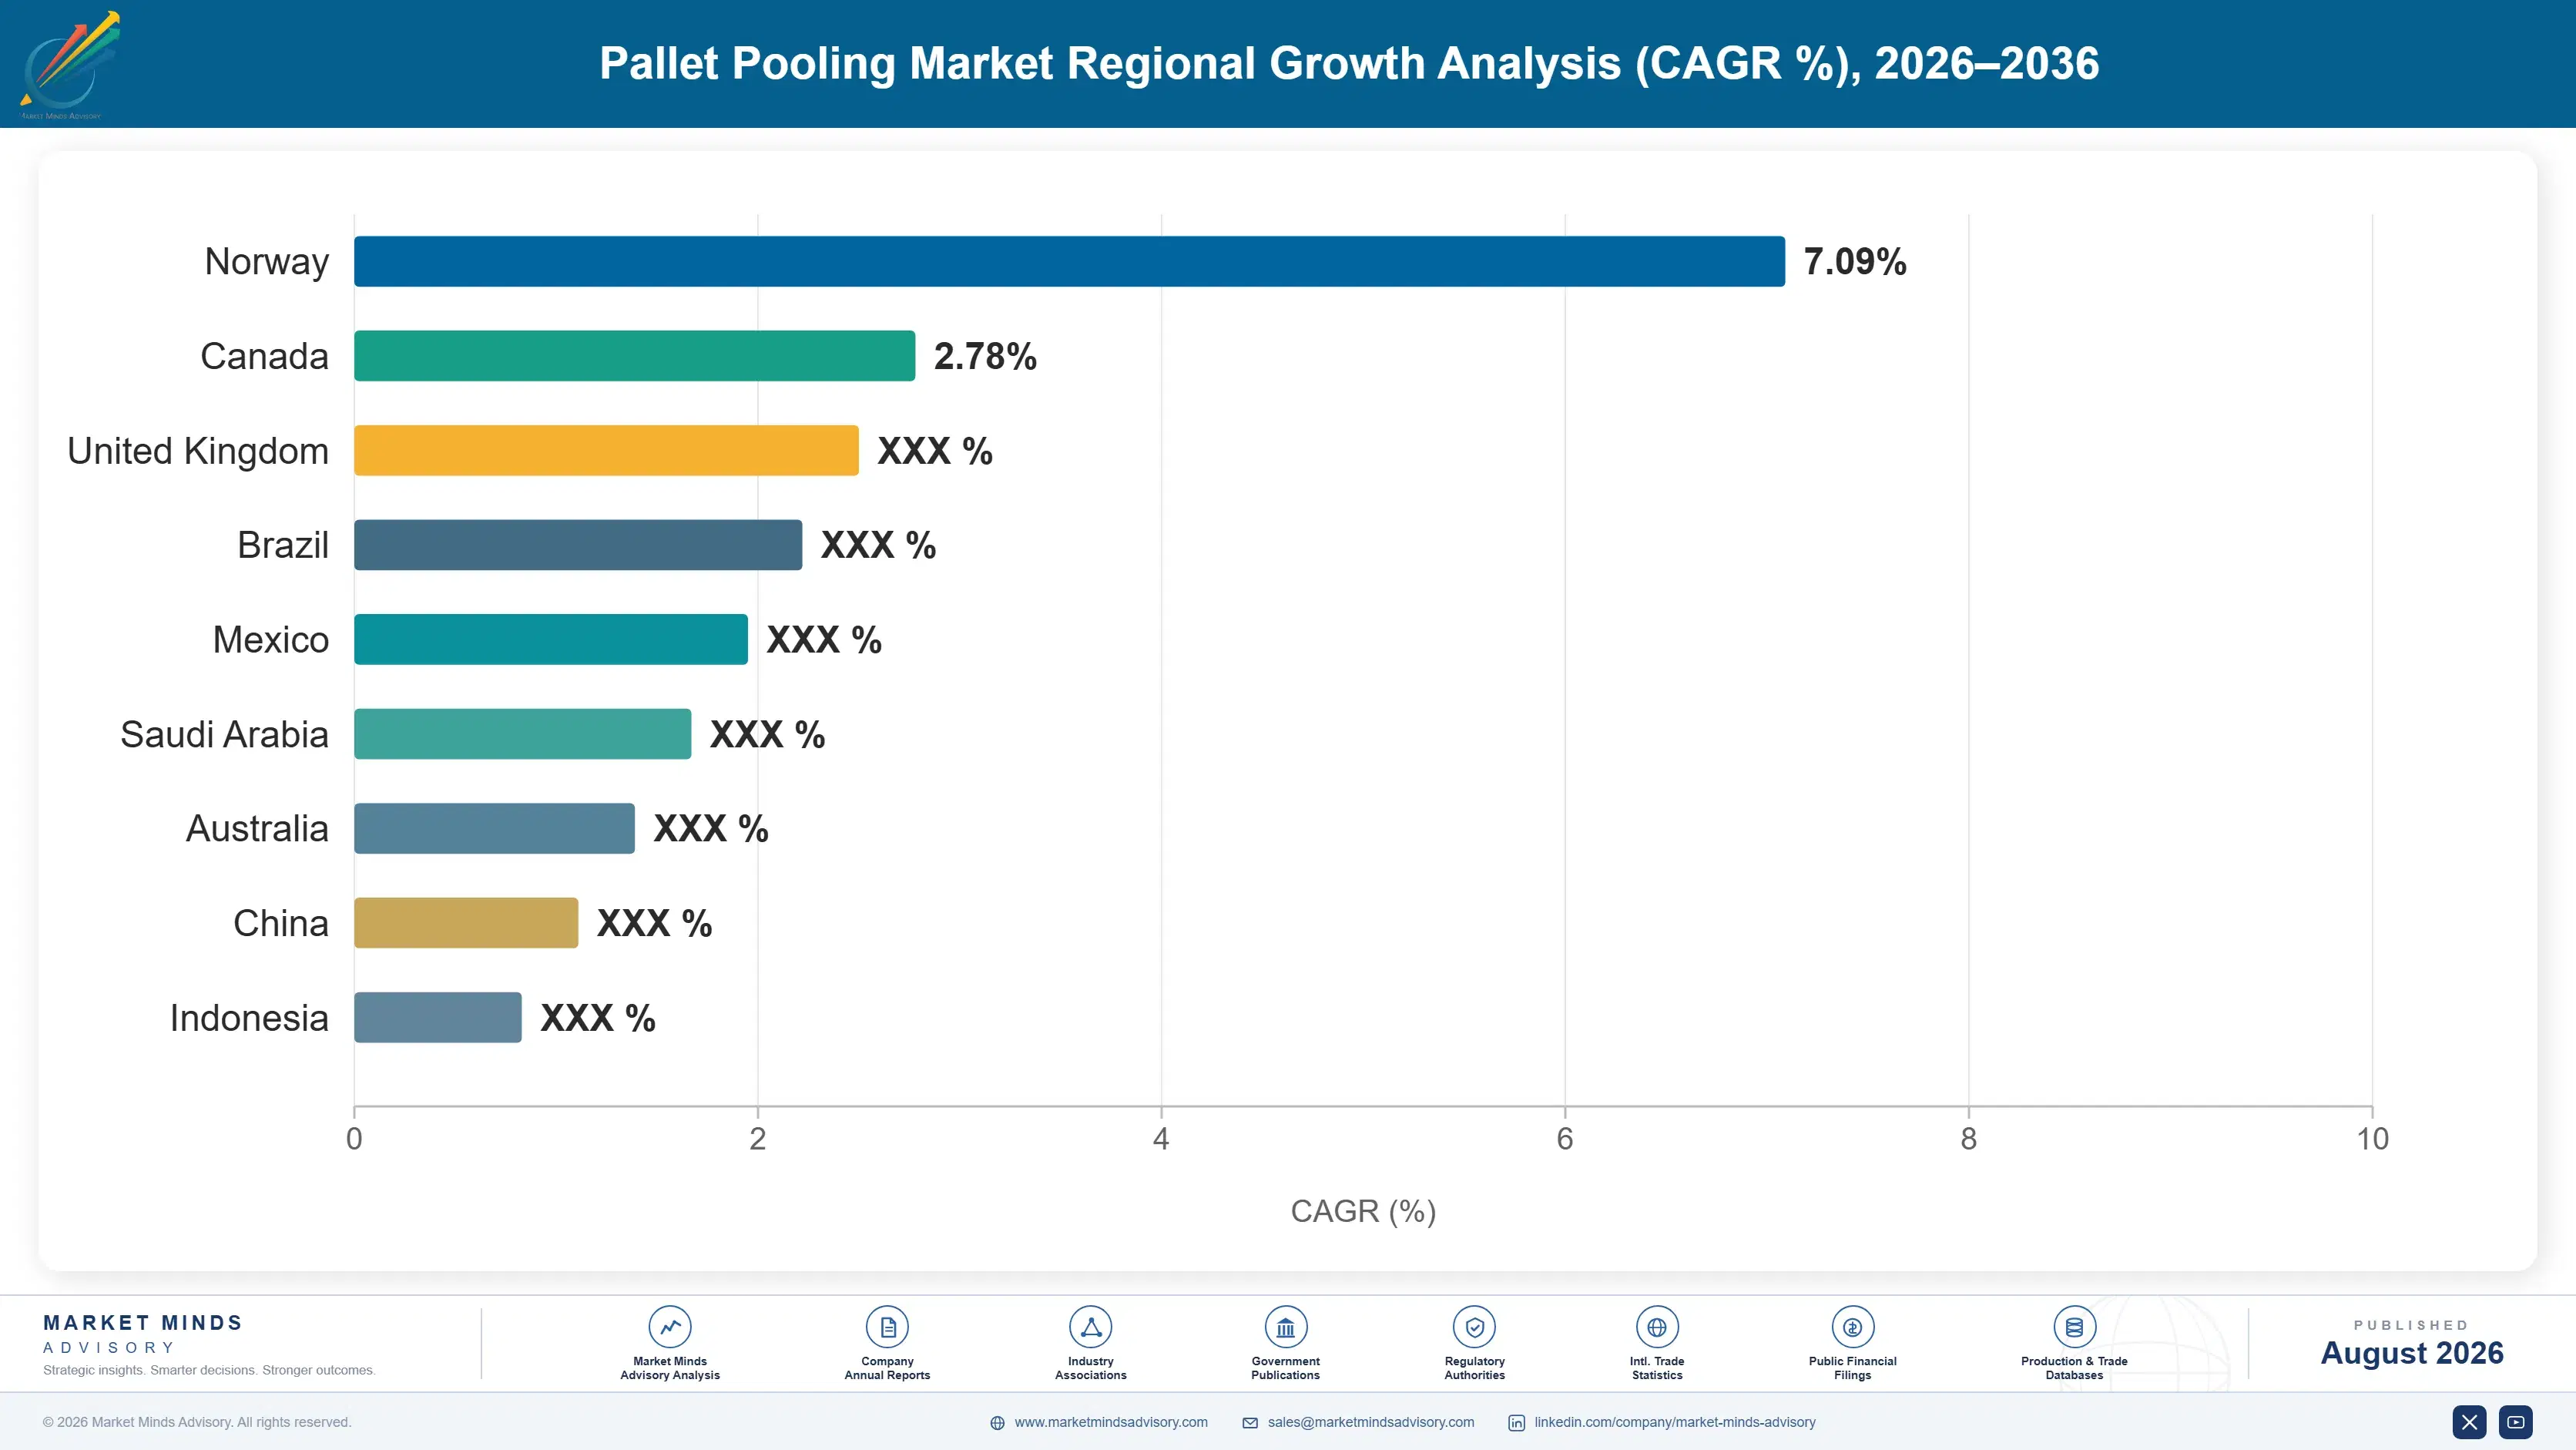
pallet-pooling-market-country-cagr-analysis-1787332069899

Where Pooling Operators Actually Earn Return

Rental rate is the variable customers argue about and the one that matters least. The four moves below reach the numbers that actually decide pool earnings: locating unreturned assets, building density before entering a geography, holding washing infrastructure for crates, and writing recovery obligations into the contract at award. None of them is a rate concession.

Locate Unreturned Assets Instead Of Estimating Them

Between 3% and 8% of pooled units disappear annually and only about 18% of assets carry any digital identifier, which means most operators are writing off capital they cannot even point at. Tagging changes both the recovery rate and the negotiation, because an operator showing a customer exactly where 4,000 of its pallets are sitting is having a different conversation from one presenting a reconciliation estimate. Retrofit across millions of units is genuinely expensive. The payback sits in avoided write-offs rather than in any rental increase. Recovery is the return, not the rate.
Market Impact: Tagging targets the 3% to 8% annual

Build Density Before Entering A New Geography

An operator with more issue and collection points recovers faster, repositions over shorter distances, and fills return legs a thinner competitor runs empty, which is why the top five hold roughly 61% of revenue in a business with no technology barrier. Entering a geography with a single anchor customer means running the economics in reverse for years. The alternative is acquiring density rather than building it, which is expensive but arrives immediately. Half-entering a market is the one option that never works. Thin pools lose assets faster than rental covers them.
Market Impact: Density gives the top five 61% of r

Own Washing Capacity Before Winning Crate Volume

Crate pooling grows at 9.8% and every crate that carried raw protein or unwashed produce must be documented as cleaned before reissue, which requires washing facilities inside economic distance of the loop. Operators winning the contract without the infrastructure end up trucking crates hundreds of kilometres to wash them, and the loop economics collapse. Building capacity ahead of contracted volume is capital at risk, which is precisely why competitors hesitate and why the position holds once established. Washing distance rather than crate volume is what actually decides whether the contract earns anything.
Market Impact: Crate pooling grows at 9.8% against

Write Recovery Obligations Into The Award Terms

The asset leaves the operator's control at issue and the party holding it has no incentive to arrange collection, so recovery has to be a contractual obligation rather than a hope. Compensation rates for unreturned units, audit rights at receiving locations, and defined collection windows are all far easier to agree at award than to introduce later against an incumbent relationship. Customers resist them and concede more readily where the operator can produce location data. The two levers work together. Loss of 3% to 8% annually is the exposure being managed.
Market Impact: Terms should cover the 3% to 8% los

Who Controls the Margin Pool

Concentration is severe: the top five hold roughly 61% of pooling revenue, because density compounds and cannot be assembled quickly in a business with no technology barrier. The gap between leaders and challengers is collection point coverage and repair network scale rather than asset quality, which is comparable. All participants here are assessed on one basis, revenue from pooled returnable transport asset rental and associated services, excluding outright pallet sales, timber supply, and fre
Competition runs along four lines. First, pool density in a given geography, since it sets recovery speed and repositioning cost together. Second, repair and inspection network scale, which is roughly a quarter of operating cost. Third, washing infrastructure for crate pooling, without which those loops do not work. Fourth, asset visibility, because located loss is recoverable loss and estimated loss is not.

Pressure is building from two directions. Whitewood and one-way pallet supply stays cheap enough to pull price-sensitive shippers out of pooling whenever economies weaken. Meanwhile crate pooling requires washing capability that traditional wooden pool operators largely lack. Rankings should favour operators with genuine asset visibility and crate infrastructure over those defending wooden pool density on rental rate alone.
pallet-pooling-market-company-positioning-matrix-1787332070417

Competitive Moat and Risk Dimensions

BRAMBLES

Moat: Global density and collection coverage

Brambles operates the densest pooled asset networks in most markets it serves, and density decides recovery speed, repositioning distance, and return leg utilisation simultaneously. Its repair and inspection network scale spreads a cost that is roughly a quarter of pool operating expense. Multinational coverage also lets global consumer goods customers contract one standard across regions, which regional pools cannot offer.
BRAMBLES

Risk: Asset loss and surcharge resistance

Scale means the largest absolute exposure to unreturned assets, and pandemic-era losses demonstrated how quickly that becomes a capital problem rather than an operating one. Large retail customers resist compensation surcharges firmly and hold considerable negotiating power. Timber and repair inflation also reach a very large asset base faster than annual rental repricing recovers it.
IFCO SYSTEMS

Moat: Crate pooling and washing infrastructure

IFCO holds established reusable crate pooling positions in fresh produce with the washing infrastructure those loops require, which is the barrier competitors consistently underestimate. Growth in this asset type runs well ahead of wooden pallet pooling. Retailer relationships built on fresh supply chains give it access to the categories converting out of corrugated fastest.
IFCO SYSTEMS

Risk: Category concentration and capital intensity

Revenue concentrates in fresh food supply chains, which ties performance to grocery volumes and to a small number of very large retail customers. Washing capacity requires capital committed close to the loop before contracted volume justifies it. Crate unit cost also makes each unreturned asset considerably more painful than a wooden pallet equivalent.

Players Tracked

Prominent Players

Brambles
Faber Halbertsma Group
PALLET-Pool
LPR La Palette Rouge
IFCO Systems

Other Key Players

Euro Pool System
Schoeller Allibert
Tosca
PECO Pallet
48forty Solutions
Greystone Logistics
ORBIS Corporation
Cabka
Loscam
Pooling Partners
CHEP India
Rehrig Pacific
Craemer Group
Nefab
Contraload

Recent Developments

MARCH 2025

Pooling operators extend digital asset tracking across major pools

Several operators widened deployment of low-cost tags and distribution centre gateway readers across pooled pallet fleets, moving asset loss from an inferred reconciliation figure toward a located one. These were operational technology rollouts rather than transactions, and they change both recovery economics and the surcharge negotiation with large customers.
Signal: Located loss is recoverable and estimated
SEPTEMBER 2024

Grocery retailers convert further fresh categories to reusable crates

Additional grocery chains extended reusable crate programmes into bakery, meat, and prepared food categories previously handled in one-way corrugated, with washing and hygiene documentation supplied by the pooling operator. These were contract awards rather than acquisitions, and they require washing capacity within economic distance of each loop.
Signal: Winning crate volume without any washing c
MAY 2024

Timber and repair cost pressure prompts renewed rental repricing

Pooling operators sought rental increases across customer contracts as pallet lumber and repair labour costs continued rising faster than annual repricing had recovered. These were commercial negotiations rather than corporate events, and large retail customers pushed back on surcharges considerably harder than on base rate adjustments.
Signal: Customers concede base rate increases far

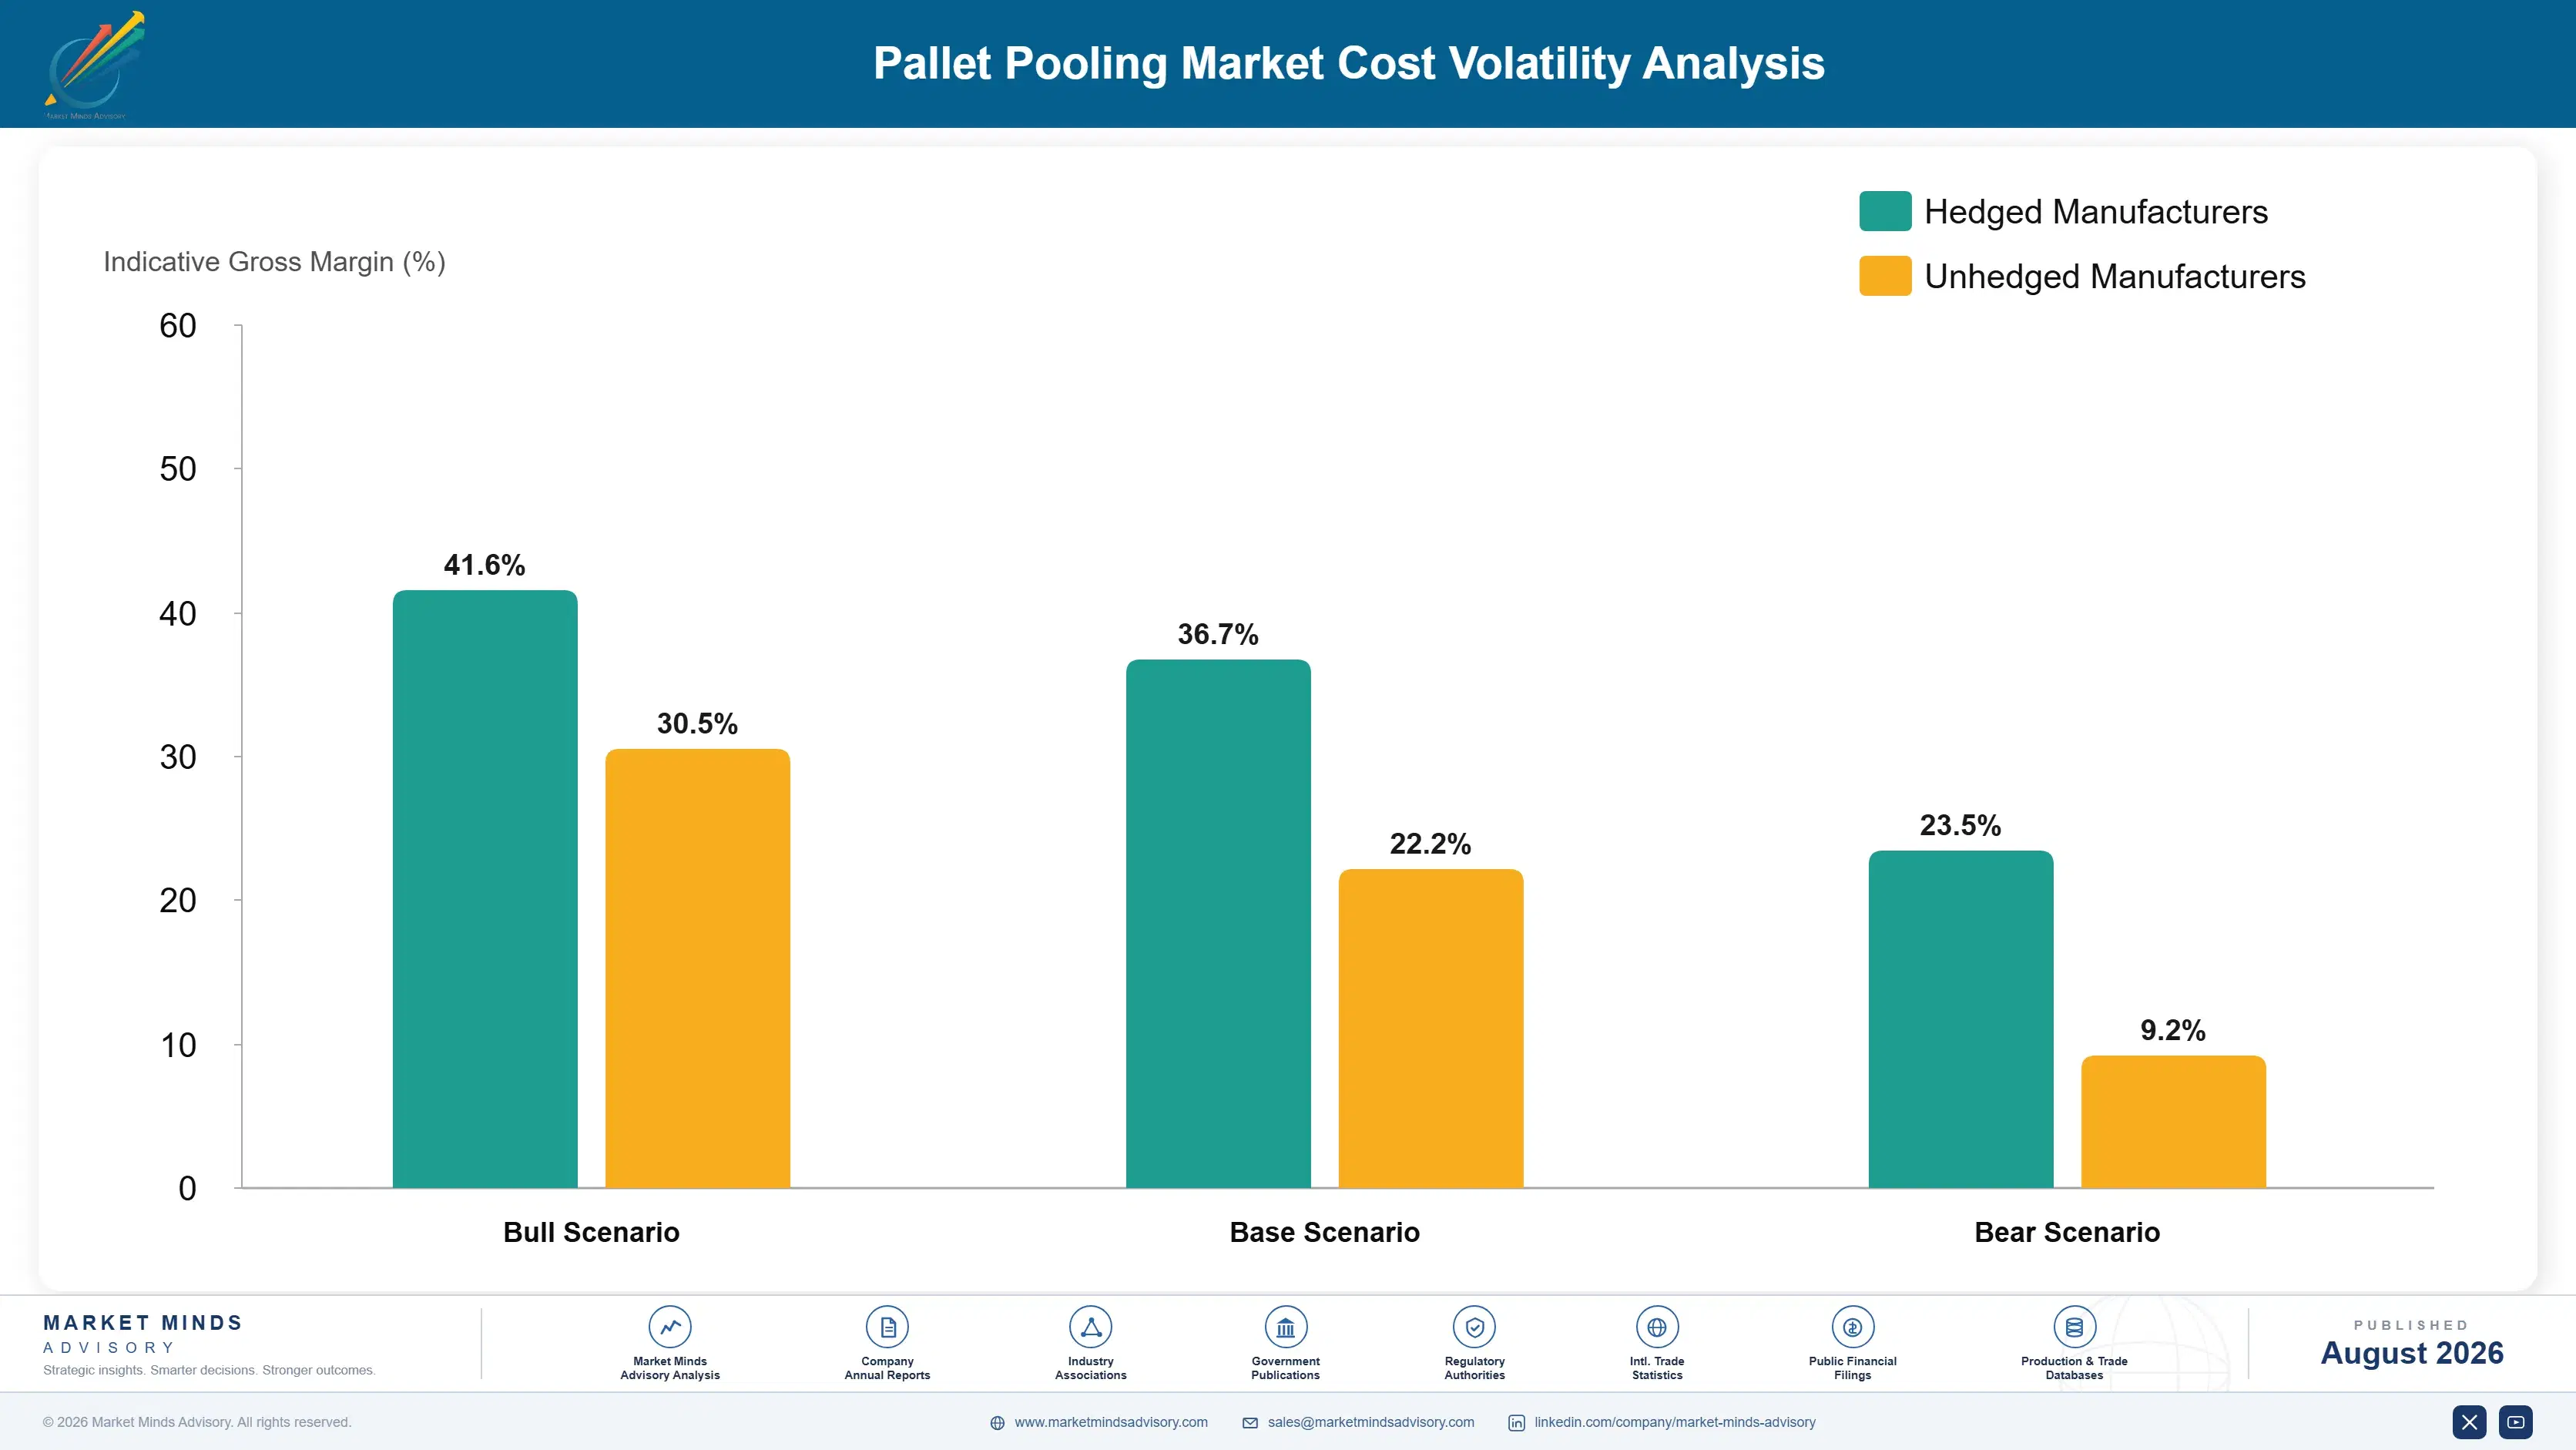
Pallet Lumber, Repair Labour, Transport, Resin

This is an asset business, so the cost sheet divides between building the pool and running it. Pallet lumber and timber components run 30% to 42% of asset replacement cost, purchased against construction demand no operator influences. Repair labour and materials are roughly 24% of operating cost, transport and repositioning 20% to 28%, and resin 40% to 55% of plastic asset replacement cost.
North American pallet lumber pricing rose steeply through 2021 and into 2022 as construction demand and sawmill constraints coincided, and pooling operators replacing pandemic-era asset losses were buying into exactly that peak. Brambles disclosed lumber and transport cost pressure across those reporting periods. Repair labour inflated alongside it across every developed market, and annual rental repricing recovered neither quickly, compressing pool margins for several years.

Exposure separates by density and integration, not by size. An operator with in-house repair and dense collection coverage absorbs a timber move inside utilisation gains, while one outsourcing repair and running long repositioning legs carries the full increase. Geography compounds it, since transport is a fifth of operating cost and a thin pool in a large country runs empty kilometres a dense one converts into revenue trips.
pallet-pooling-market-cost-volatility-analysis-1787332070611

Forward purchase pallet lumber across multiple mill regions

Timber is the largest element of asset replacement cost and moves on construction demand rather than anything pooling related. Forward purchasing across several mill regions costs working capital and occasionally loses money when prices fall. It also lets an operator rebuild pool capacity after a loss event without buying into whatever the spot market is doing that quarter.

Bring repair capacity in house at network scale

Inspection and repair is roughly a quarter of pool operating cost, and outsourced repair carries a margin layer plus transport to and from the repairer. Operating repair capacity inside the collection network removes both and improves throughput visibility. The fixed cost only justifies itself above a regional volume threshold, so this suits dense pools and penalises thin ones.

Design assets to cut repair frequency rather than unit cost

A pallet surviving more trips before repair is worth more than a cheaper one, because repair labour and the transport around it dominate lifetime cost. Block construction, reinforced leading edges, and better fasteners all raise unit cost while cutting repair events. Procurement instinct pushes the other way, which is the wrong number to optimise for a pooled asset.

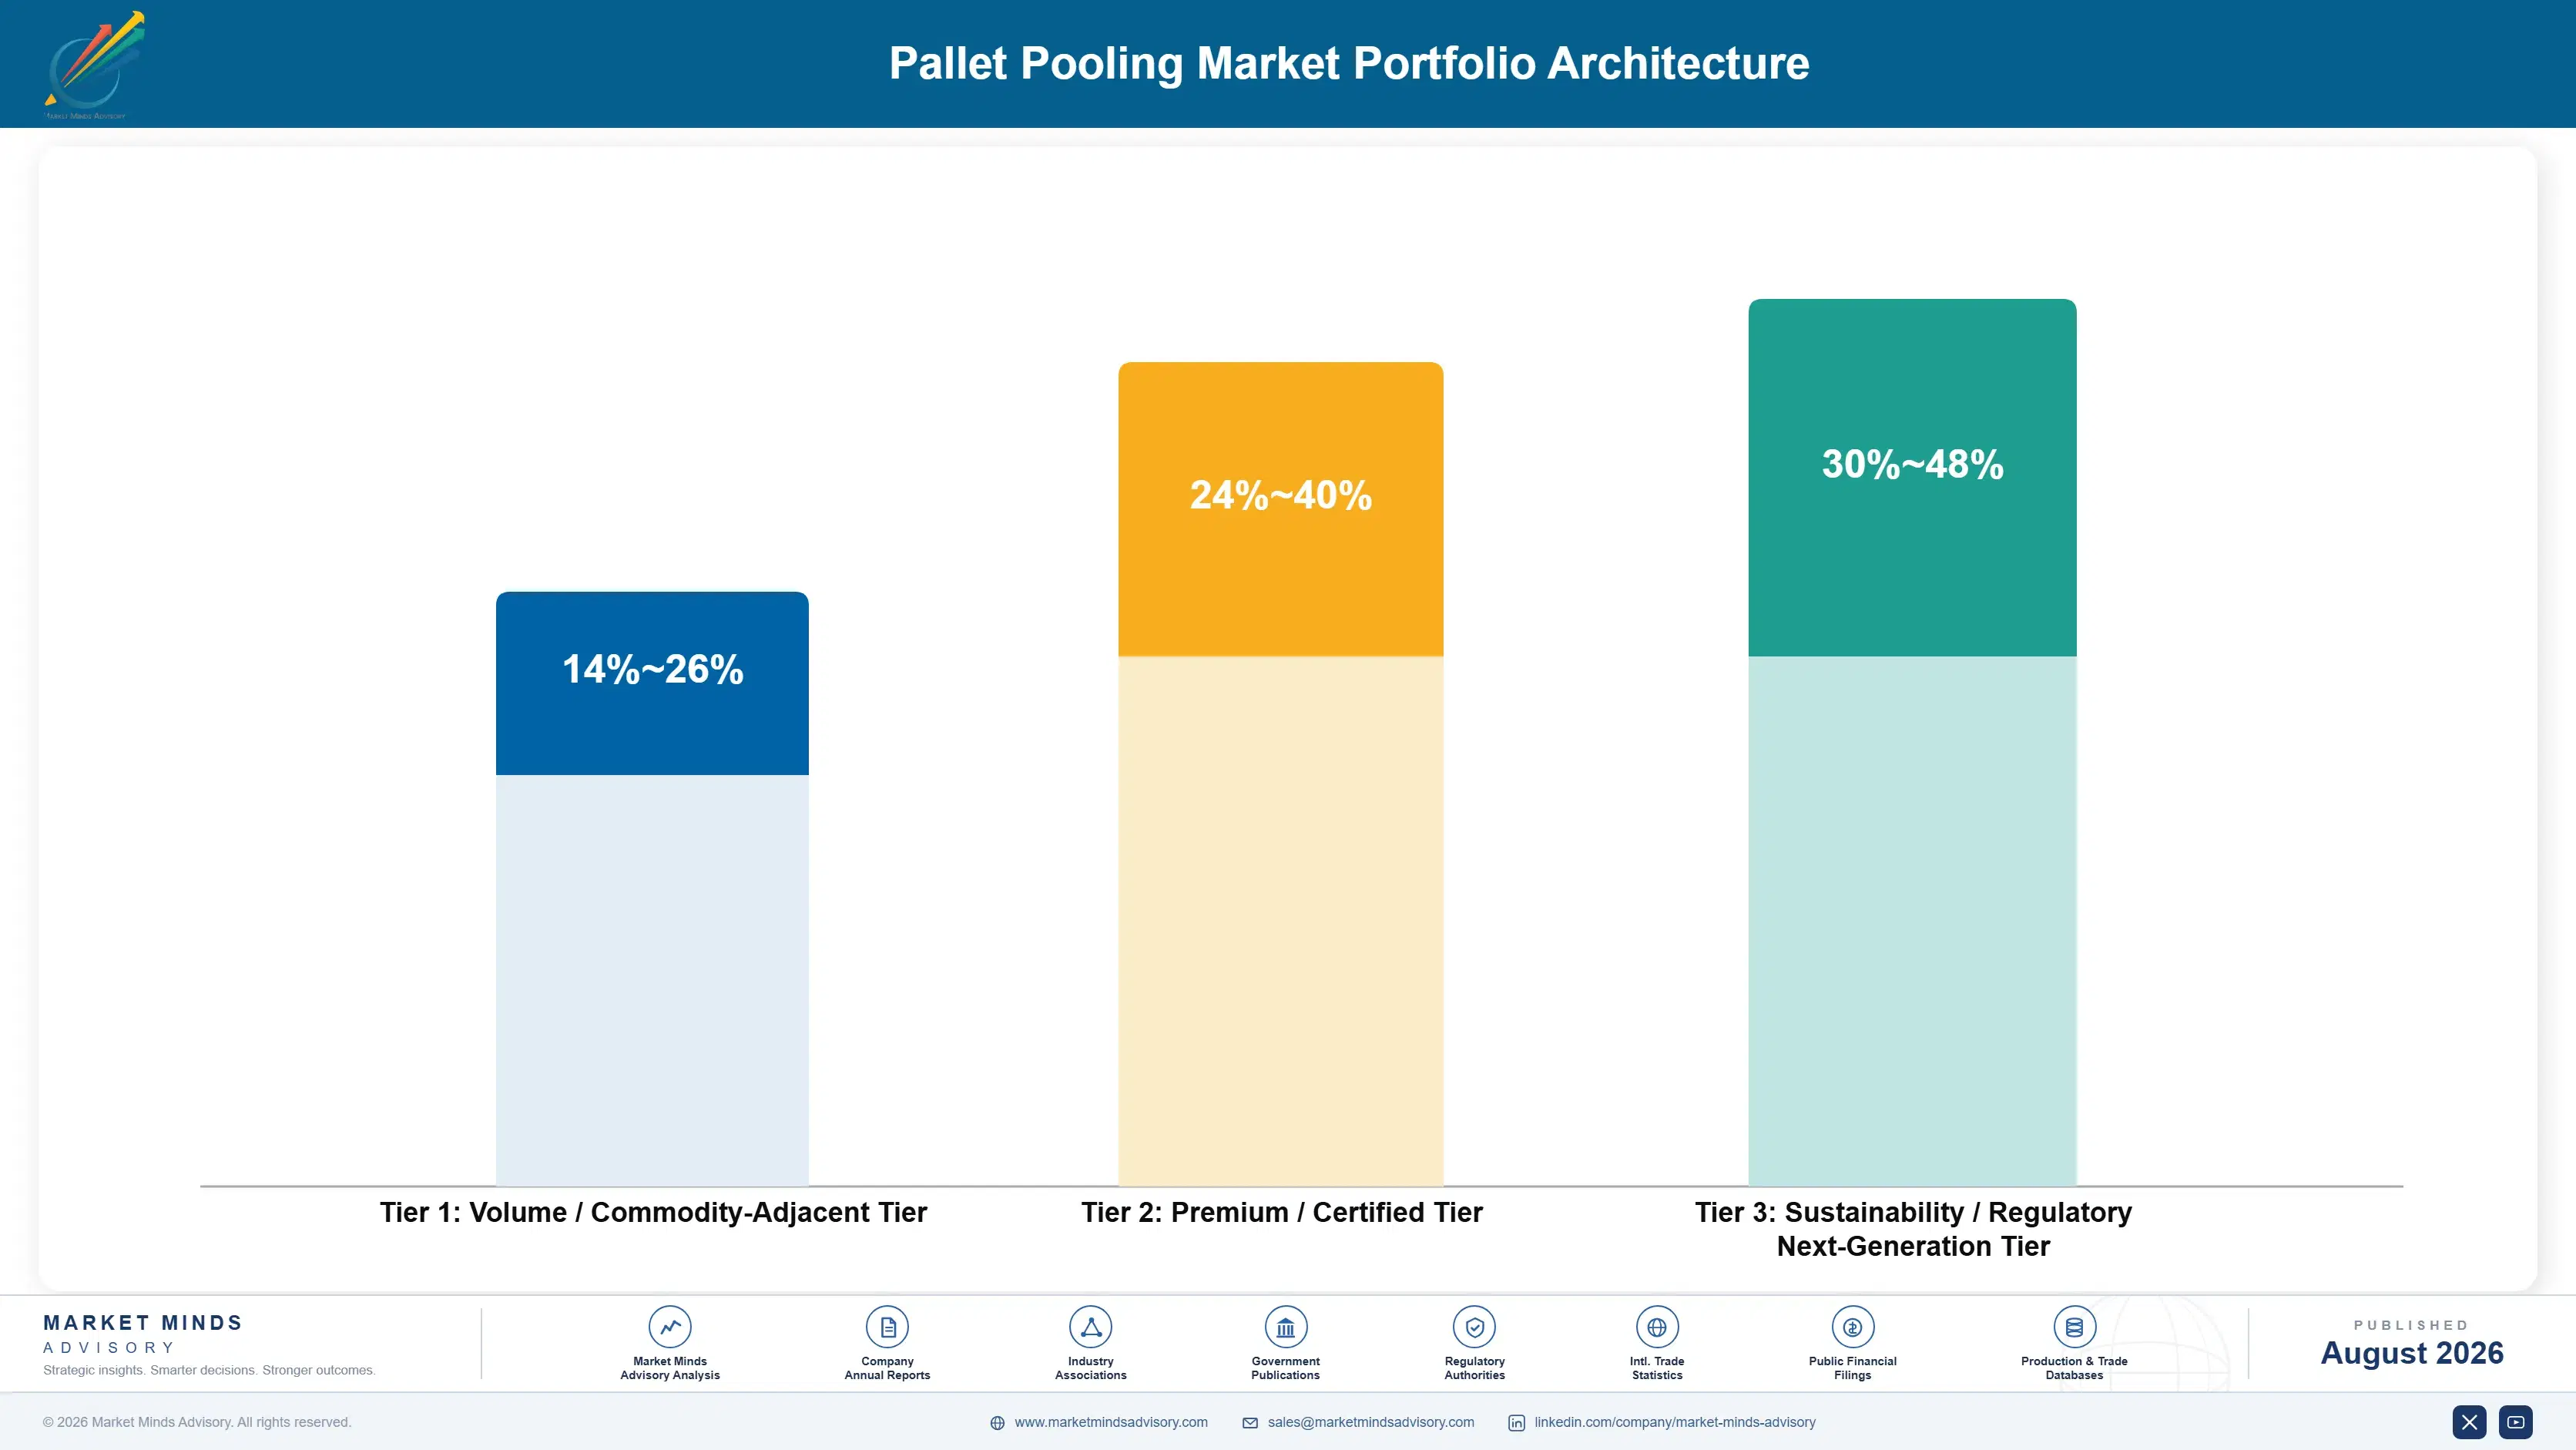
Portfolio Architecture for Margin Defence

The portfolio splits into three tiers with different economics. Standard wooden pallet pooling forms the volume tier, where the asset is undifferentiated and density plus rental rate decide everything. Plastic pallet and display pooling earn more because hygiene, automation tolerance, and dimensional consistency narrow the field. Crate pooling and tracked asset services price against washing infrastructure and visibility rather than against a competing rental quotation.
The tension runs between wooden volume that builds density and specialty assets that earn the return. Standard wooden pooling generates the collection coverage, repair network utilisation, and retail relationships through which everything else sells. Yet it competes against whitewood supply and exchange systems on rate alone. Operators handling this well accept thin wooden margin for the density it creates while directing capital toward washing capacity and tracking.

High-value pools concentrate where infrastructure or visibility limits competition: crate pooling with washing capacity inside the loop, plastic pallet pools in hygiene-controlled closed circuits, tracked assets where loss can be located and charged, and display pooling tied to retail promotional calendars. All four escape the rental rate comparison. Standard wooden pooling sits at the other end, where whitewood sets the ceiling on what anybody can charge.

Volume / Commodity-Adjacent Tier

Standard wooden block and stringer pallet pooling competing against whitewood supply and exchange systems on rate. The range is wide because pool density and in-house repair capacity separate operators enormously at identical rental rates.
Gross Margin: 14-26%

Premium / Certified Tier

Plastic pallet pooling, display and half-pallet programmes, and intermediate bulk container pools carrying hygiene or automation requirements. The range is wide because recovery discipline varies sharply and a lost plastic asset costs several times a wooden one.
Gross Margin: 24-40%

Sustainability / Regulatory / Next-Generation Tier

Reusable crate pooling with washing services, tracked asset programmes, and recycled-content plastic pools. The range is wide because washing capacity proximity decides loop economics while tracking still carries unrecovered retrofit cost.
Gross Margin: 30-48%
pallet-pooling-market-portfolio-architecture-1787332071106

High-value Sub-segments and Strategic Watch-out

Reusable Plastic Container Pooling

High value and high growth at 9.8%, the fastest asset type, on grocery conversion out of one-way corrugated in fresh produce, bakery, and meat. Washing capacity inside economic distance of the loop is the real barrier, and hygiene documentation arrives with the format. Volume conversion is only starting.
Gross Margin: 30-48%

Plastic Pallet Pooling

High value with strong growth at 7.4%, driven by hygiene-sensitive and automated environments where wood carries pest treatment cost and dimensional variability. Unit cost is several times a wooden equivalent, so recovery discipline decides whether the economics work at all. Closed loops are effectively mandatory for these assets.
Gross Margin: 24-40%

Wooden Pallet Pooling

The volume core by a wide margin, growing at 4.8% with consumer goods shipments and squeezed between whitewood pricing and timber inflation. It generates the density and collection coverage everything else depends on, but the rental rate ceiling is set externally. Density built here funds everything else.
Gross Margin: 14-26%

Intermediate Bulk Container Pooling

The strategic watch-out, growing at 6.4% on chemical and food liquid flows where cleaning certification and traceability both matter. Reconditioning requirements are demanding and a contaminated container is a liability rather than simply a lost asset. Reconditioning capacity rather than demand is the practical limit on growth.
Gross Margin: 22-38%

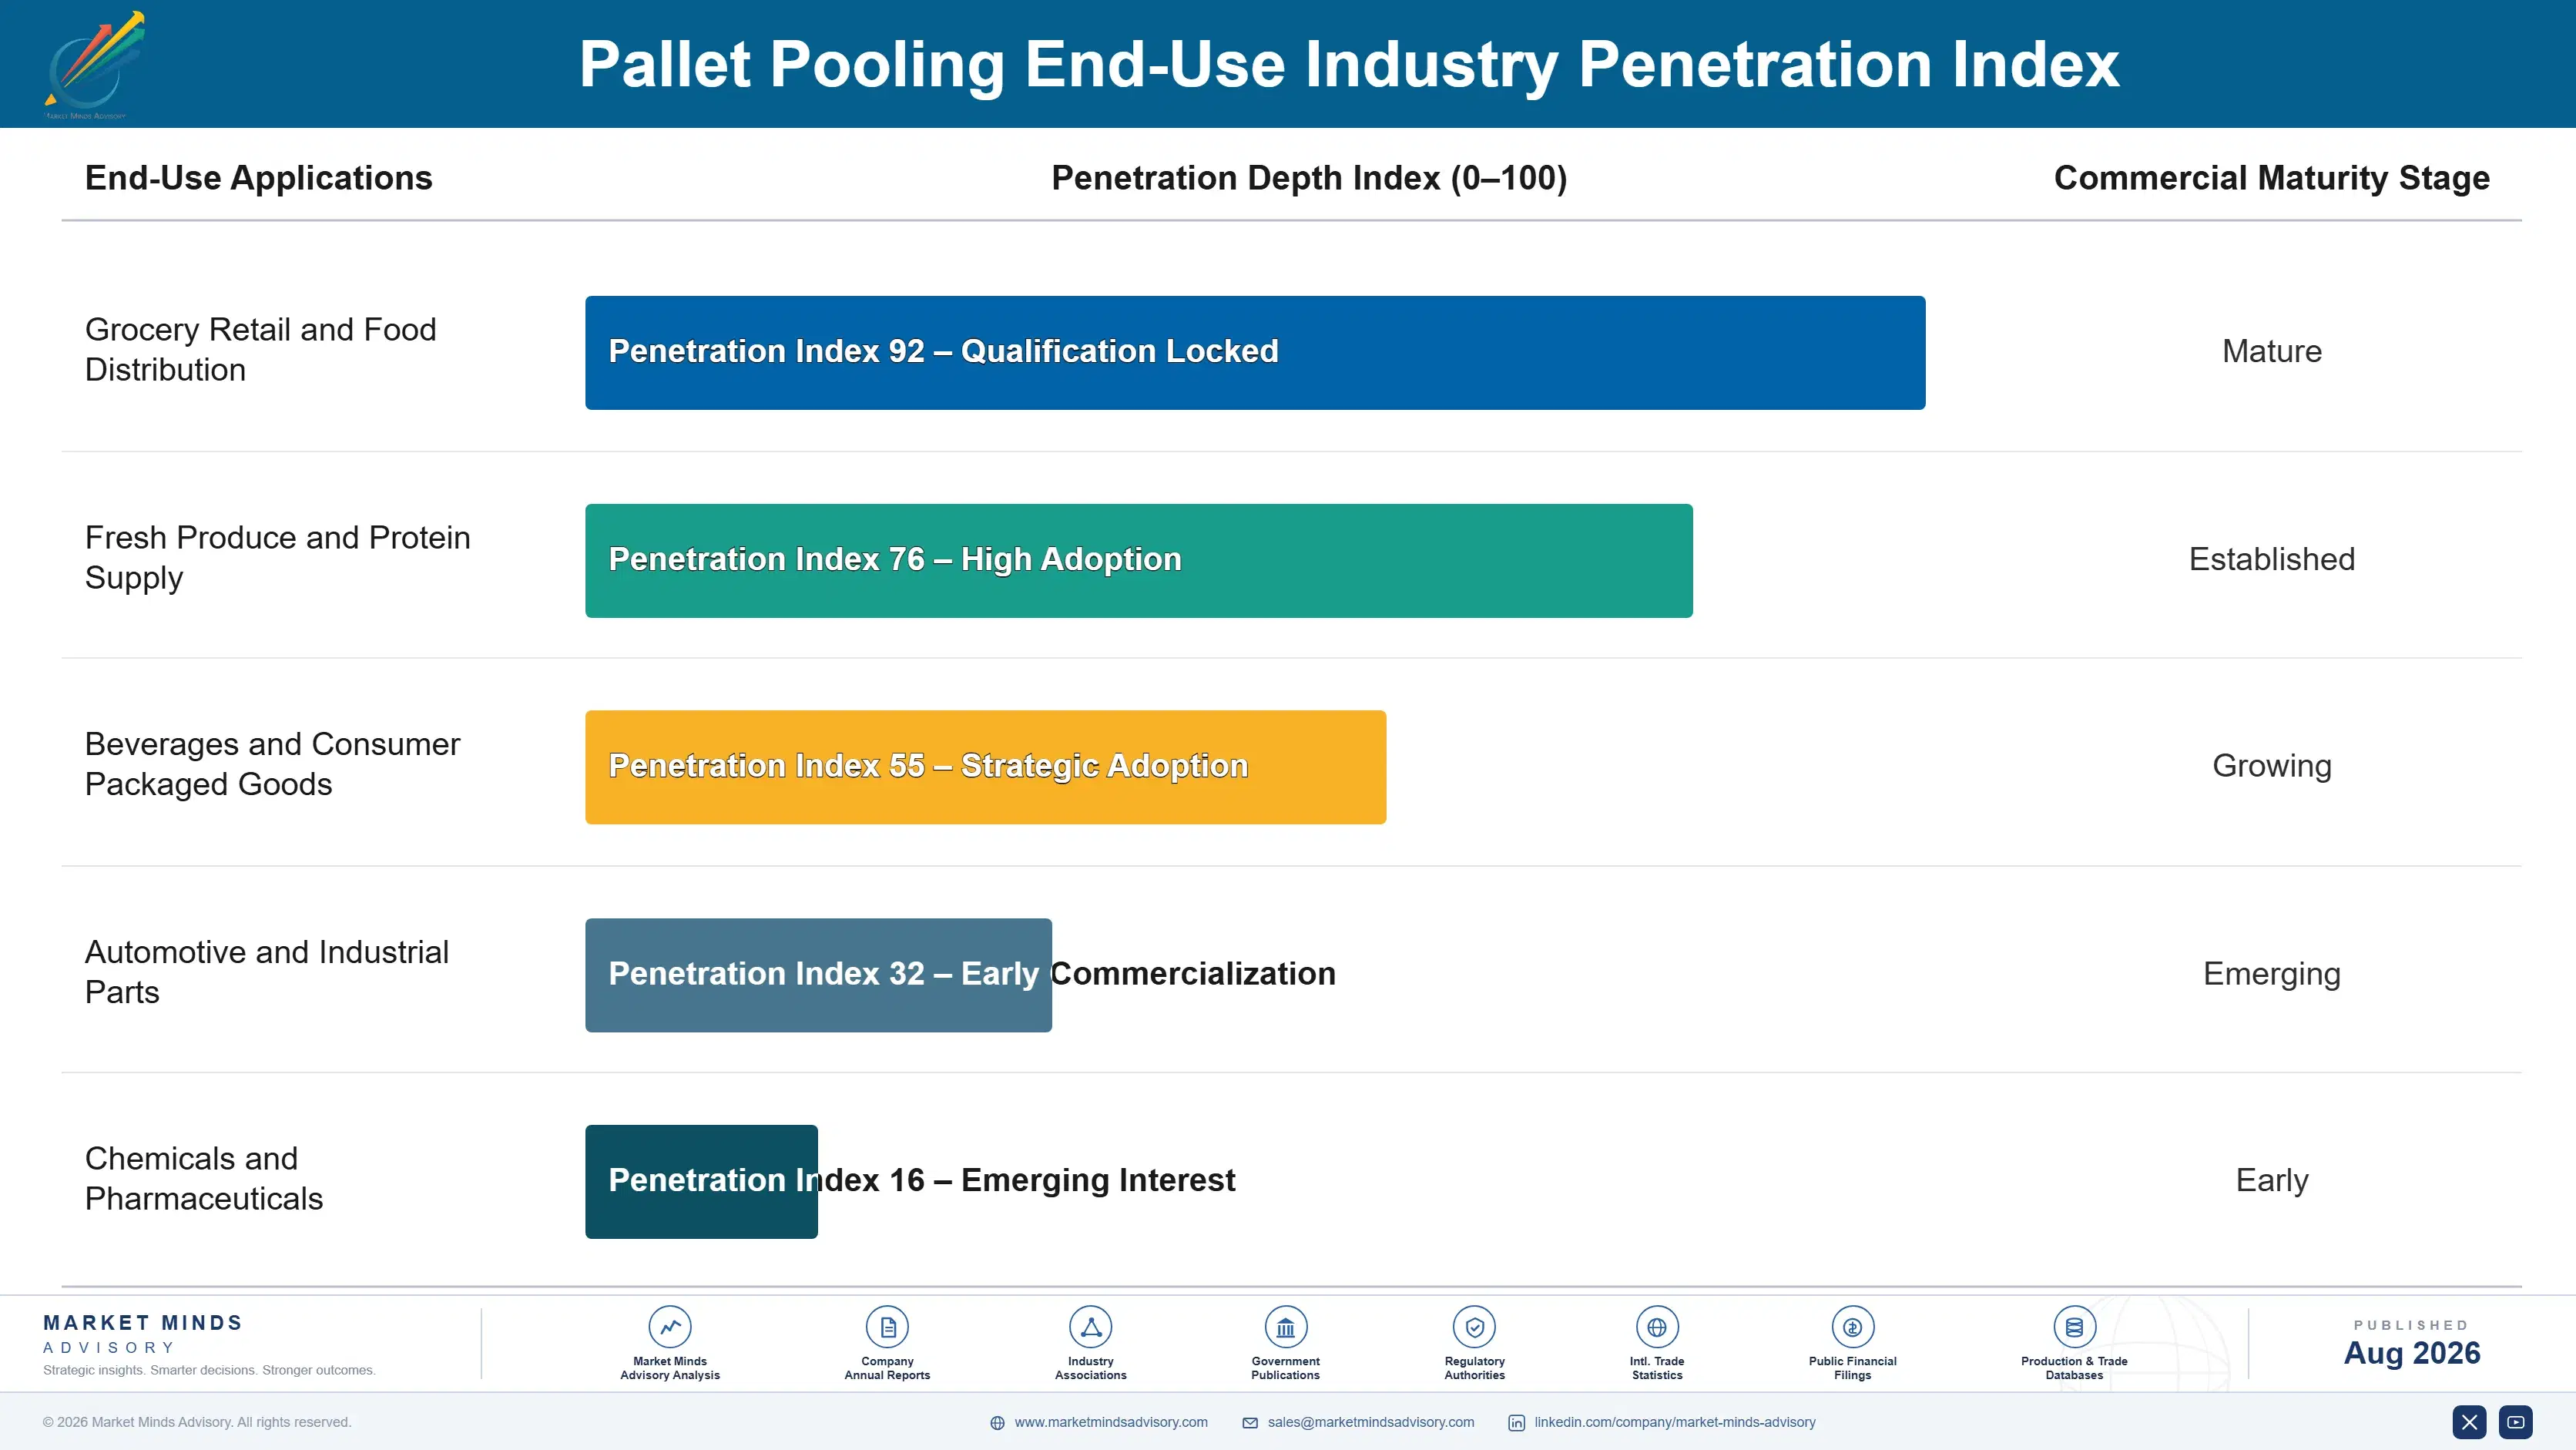
How Pooling Contracts Actually Hold

Demand commits at contract award and repeats as issue volume for the relationship's life. A shipper on a pooling contract has built the asset into its loading patterns, its receiving customers expect it, and its systems reference it. Switching means renegotiating with those receiving customers too, which is why these relationships persist. The genuine competitive moments are contract renewal, a retailer changing specification, and any category converting to crates.
Stickiness varies by loop control and receiving customer power. Crate programmes stick hardest, since the washing service and hygiene documentation are embedded in the retailer's own food safety records. Plastic pallet pools in closed circuits stick nearly as firmly through hygiene qualification. Wooden pooling sticks least, because whitewood and exchange systems offer a real alternative whenever rental rates rise faster than a shipper accepts.

Buyer profiles have shifted from logistics managers comparing rental rates toward supply chain directors, sustainability functions, and finance teams weighing total handling and loss cost. Sustainability reporting has made reuse claims a board matter rather than an operational one. That change rewards operators bringing loss data, emissions figures, and recovery performance alongside a rate, and penalises those still selling price per trip to a transport office.
pallet-pooling-market-end-use-penetration-index-1787332071592

Our Call On Pallet Pooling

These are among the four positions where our research anticipates prominent divergence between winners and laggards over the coming forecast period. Each is grounded in the demand model, the regulatory perimeter, and the announced capacity pipeline.
01 / ASSET VISIBILITY INVESTMENT

Estimated loss is written off, located loss is recovered

Between 3% and 8% of pooled units disappear each year and only about 18% of assets carry any digital identifier, which means most operators write off capital they cannot even point to on a map. An operator showing a customer precisely where 4,000 of its pallets are sitting is having a completely different conversation from one presenting a reconciliation estimate nobody trusts. Retrofit across millions of units is expensive, and the payback sits in avoided write-offs rather than in any rental increase.
02 / DENSITY BEFORE ENTRY

Half-entering a geography never works in pooling

An operator with more collection points recovers faster, repositions over shorter distances, and fills return legs a thinner competitor runs empty, which is why the top five hold roughly 61% of revenue in a business with no technology barrier at all. Entering a market on one anchor customer means running those economics in reverse for years while the incumbent enjoys them. Acquiring density is expensive but immediate, and it is usually the cheaper of the only two genuinely viable options available.
03 / WASHING CAPACITY FIRST

Crate contracts without washing nearby destroy margin

Crate pooling grows at 9.8% against a market at 5.7%, and every crate that carried raw protein or unwashed produce must be documented as cleaned before it can be reissued to anybody at all. Operators winning that volume without washing capacity inside economic distance end up trucking crates hundreds of kilometres and the loop economics collapse entirely. Building ahead of contracted volume puts capital at risk, which is exactly why competitors hesitate and why the position defends itself for years afterwards.
04 / RECOVERY TERMS AT AWARD

Write collection obligations in before you need them

The asset leaves the operator's control at the moment of issue and whoever holds it has no commercial incentive to arrange collection, so recovery must be a written obligation rather than an expectation. Compensation rates, audit rights at receiving locations, and defined collection windows are all far easier to agree at award than to introduce later against an established relationship. Customers resist these terms and concede more readily where the operator can produce actual location data instead of a reconciliation estimate.

Engagement Snapshot From the Field

A live engagement with an industry participant carrying material or product regulatory and market exposure ahead of a defining policy shift, showing how our research translates into a defensible multi-year portfolio strategy.
MARKET MINDS ADVISORY · CLIENT ENGAGEMENT SUMMARY
Pallet Pooling Producer Strategic Portfolio Review and Transition Roadmap 2026·Investment Scenario on Pallet Pooling Exposure Evaluation 2025-26
CLIENT PROFILE
A consumer goods manufacturer shipping across eleven European markets engaged MMA after pooling costs rose faster than volume for three consecutive years. The client reported annual pooling spend of about USD 24 million, unreconciled asset balances at 38 of its receiving customers, and surcharge claims from two operators it had no data to dispute (client-reported, unverified by MMA).
STRATEGIC CHALLENGE
Disputing the surcharges required asset location data the client did not hold and its operators would not share in usable form. Switching operators meant renegotiating receiving arrangements with retailers who specified the incumbent equipment. The board needed to know whether the cost increases reflected genuine loss caused by its own operations or simply weak reconciliation, before renewing two large contracts.
MMA APPROACH
MMA reconstructed asset flow by receiving location from despatch and collection records rather than accepting operator reconciliation totals, which nobody had attempted. We identified where balances accumulated and whether the client or the receiver controlled that behaviour. We then compared pooling cost against whitewood and exchange alternatives per lane, since a single portfolio-wide answer was clearly wrong for eleven quite different markets.
KEY FINDINGS
  1. Roughly 71% of unreconciled balances sat at nine receiving locations, all of them secondary distributors without collection agreements in place (client-reported, unverified by MMA).
  2. Two operators were charging surcharges on losses occurring after the asset had been signed over to a retailer, which the contract terms did not actually support on review.
  3. Pooling remained clearly cheaper than whitewood on eight of eleven markets, but exchange systems were competitive on the three shortest domestic lanes the client operated.
  4. Crate conversion on chilled lines was viable at two of five sites, limited entirely by washing facility distance rather than by any volume or retailer objection.
CLIENT PROFILE
A consumer goods manufacturer shipping across eleven European markets engaged MMA after pooling costs rose faster than volume for three consecutive years. The client reported annual pooling spend of about USD 24 million, unreconciled asset balances at 38 of its receiving customers, and surcharge claims from two operators it had no data to dispute (client-reported, unverified by MMA).
STRATEGIC CHALLENGE
Disputing the surcharges required asset location data the client did not hold and its operators would not share in usable form. Switching operators meant renegotiating receiving arrangements with retailers who specified the incumbent equipment. The board needed to know whether the cost increases reflected genuine loss caused by its own operations or simply weak reconciliation, before renewing two large contracts.
MMA APPROACH
MMA reconstructed asset flow by receiving location from despatch and collection records rather than accepting operator reconciliation totals, which nobody had attempted. We identified where balances accumulated and whether the client or the receiver controlled that behaviour. We then compared pooling cost against whitewood and exchange alternatives per lane, since a single portfolio-wide answer was clearly wrong for eleven quite different markets.
KEY FINDINGS
  1. Roughly 71% of unreconciled balances sat at nine receiving locations, all of them secondary distributors without collection agreements in place (client-reported, unverified by MMA).
  2. Two operators were charging surcharges on losses occurring after the asset had been signed over to a retailer, which the contract terms did not actually support on review.
  3. Pooling remained clearly cheaper than whitewood on eight of eleven markets, but exchange systems were competitive on the three shortest domestic lanes the client operated.
  4. Crate conversion on chilled lines was viable at two of five sites, limited entirely by washing facility distance rather than by any volume or retailer objection.
RECOMMENDED STRATEGY
Phase 1: Phase 1 (0 to 6 months): Put collection agreements in place at the nine secondary distributors holding most of the unreconciled balance. Phase 2: Phase 2 (6 to 16 months): Renegotiate surcharge terms to attach only where the client controls the asset, using the reconstructed flow data as evidence. Phase 3: Phase 3 (16 to 28 months): Move the three shortest domestic lanes to exchange systems and convert chilled lines at the two viable sites.
OUTCOME
The client cut pooling cost by roughly 16% within two years, mostly by closing the nine distributor balances rather than by renegotiating rates. Surcharge claims were withdrawn on both contracts once flow data established where losses occurred, and the two crate conversions removed corrugated spend that had never appeared in the pooling comparison (client-reported, unverified by MMA).

Frequently Asked Questions

Foundational context covering the market sizes, CAGR, scope, country, region and competition that inform every finding below. This section is provided to cover basics and most often pre-purchase conversations, answered from the MMA Primary Research Dataset.

What is the current size of the Pallet Pooling Market?

The global pallet pooling market is valued at USD 9.8 billion in 2025, covering wooden and plastic pallet pooling, reusable crates, bulk containers, and display pallets. Outright pallet sales and freight services are excluded.

How large will the Pallet Pooling Market be by 2036?

The market is forecast to reach USD 17.98 billion by 2036 in the base case, about 1.74 times the 2026 level. That represents incremental value of roughly USD 7.62 billion across the decade.

What is the CAGR for the Pallet Pooling Market 2026 to 2036?

The market grows at a 5.7% CAGR in the base case, with bull and bear scenarios at 6.9% and 4.5%. The spread turns mainly on asset loss rates and crate conversion from corrugated.

Which segment is growing fastest?

Reusable plastic container pooling grows fastest at 9.8%, about 1.72 times the overall rate, as grocery retailers convert fresh categories out of corrugated. Plastic pallet pooling follows at 7.4%.

Who are the major companies in the Pallet Pooling Market?

Leading operators include Brambles, Faber Halbertsma Group, PALLET-Pool, LPR La Palette Rouge, and IFCO Systems. Concentration is severe, with the top five holding roughly 61% of pooling revenue.

Which country is growing fastest?

India grows fastest at a 12.6% CAGR, as organised grocery and quick commerce reach the density pooling requires. China and Indonesia follow on retail modernisation.

Report Segmentation Architecture

The full report scope spans multiple orthogonal segmentation dimensions, with cross-tabulated demand data provided for each dimension pair. Coverage extends further to regional breakdowns, trend trajectories, and the competitive detail needed to support segment-level decision-making.

By Pooled Asset Type

  • Wooden Pallet Pooling
  • Plastic Pallet Pooling
  • Reusable Plastic Container Pooling
  • Intermediate Bulk Container Pooling
  • Display and Half-Pallet Pooling

By End-Use Industry

  • Grocery Retail and Food Distribution
  • Fresh Produce and Protein Supply
  • Beverages and Consumer Packaged Goods
  • Automotive and Industrial Parts
  • Chemicals and Pharmaceuticals

By Contracting Model

  • Direct Contract To Shipper
  • Retailer Mandated Programme
  • Third-Party Logistics Provider Agreement
  • Open Pool and Exchange Participation

By Region

  • North America
  • Western Europe
  • East Asia
  • South Asia and Pacific
  • Latin America
  • Middle East and Africa
  • Eastern Europe

Scope, Methodology, and Coverage

Every figure in this report is reproducible from documented input assumptions. The scope below maps the historical period, the forecast horizon, the segmentation dimensions, and the countries covered, alongside the underlying primary and qualitative methodology.
Historical Period
2020 to 2025
Forecast Period
2026 to 2036
Base Year
2025 (USD billions; MMA Primary Research Dataset, August 2026)
Market Definition
The pallet pooling market comprises the rental, issue, recovery, inspection, repair, and reissue of standardised returnable transport assets under a pooled ownership model, valued at operator rental and service revenue billed to shippers, retailers, and logistics providers. It spans wooden block and stringer pallet pooling, plastic pallet pooling, reusable plastic container pooling including associated washing services, intermediate bulk container pooling with reconditioning, and display and half-pallet pooling, together with the asset tracking and reconciliation services supplied with them. Outright sales of new or used pallets, whitewood and one-way pallet supply, pallet manufacture and timber component supply, warehouse racking, forklifts and materials handling equipment, freight, haulage and warehousing services, corrugated and one-way transport packaging, and returnable assets owned outright by a single shipper without pooled ownership are excluded.
Quantitative Units
USD billions (current prices); pooled asset issues in millions of trips and installed pool size in millions of units
Segmentation Dimensions
By Pooled Asset Type; By End-Use Industry; By Contracting Model; By Region
Regions Covered
North America, Western Europe, East Asia, South Asia and Pacific, Latin America, Middle East and Africa, Eastern Europe
Countries Covered
USA, Canada, Mexico, UK, Germany, France, Netherlands, Belgium, Spain, Italy, Sweden, Poland, Czech Republic, Hungary, Romania, Japan, China, South Korea, Australia, New Zealand, India, Indonesia, Vietnam, Thailand, Brazil, Argentina, Chile, UAE, Saudi Arabia, South Africa, and additional markets relevant to this sector
Key Companies Profiled
Brambles, Faber Halbertsma Group, PALLET-Pool, LPR La Palette Rouge, IFCO Systems, Euro Pool System, Schoeller Allibert, Tosca, PECO Pallet, 48forty Solutions, Greystone Logistics, ORBIS Corporation, Cabka, Loscam, Pooling Partners, CHEP India, Rehrig Pacific, Craemer Group, Nefab, Contraload
Quantitative Methodology
Primary survey, n=3,800 respondents, Q4 2025, six countries; demand-side model with trade association cross-validation
Qualitative Methodology
47 expert interviews, Q4 2025; applied to validate demand model assumptions, identify emerging dynamics, and assess competitive positioning
Report Format
PDF and XLSX data workbook (Word format preview document)
Publisher
Market Minds Advisory
Report Code
MMA-2026-PAC-309
Published
August 2026
Contact
sales@marketmindsadvisory.com | www.marketmindsadvisory.com

Purchase the full Pallet Pooling Market Report (2026 to 2036).

The full MMA Pallet Pooling report sizes the market across five pooled asset types, five end-use industries, four contracting models, and seven regions through 2036. It profiles 20 operators on a consistent basis of pooled asset rental and service revenue, scoring each on pool density, repair network scale, washing infrastructure, and asset visibility. Scenario models quantify how loss rates, timber and repair inflation, and crate conversion from corrugated move both volume and achievable margin by asset type. The report also includes pool density mapping by geography, asset loss rate benchmarking across operators and end-use settings, trip cycle and repositioning cost analysis, and pooling economics compared against whitewood and exchange alternatives.
Five-asset and four-model market sizing to 2036
Twenty-operator benchmark on pooled asset rental and service revenue
Pool density mapping by geography and collection point coverage
Asset loss rate benchmarking across operators and end-use settings
Trip cycle and repositioning cost analysis by pool density
Pooling economics compared against whitewood and exchange alternatives

Built For The People Who Decide

From boardroom strategy to bench-side execution, this report is read cover-to-cover by leaders shaping the next decade of their industry, turning demand scenarios, market dynamics and valuation benchmarks into decisions.
CXOs/ Presidents/ VPs/ Managers
M&A and Corporate Development
Strategy Teams and R&D Heads
Procurement and Product Directors
Regulatory and Compliance Leaders
Investor Relations and Equity Analysts