

Market Minds Advisory
Pallet Jacks Market

Pallet Jacks Market: Lithium Conversion, Warehouse Labour Scarcity and the Cheapest Truck in the Building

The least sophisticated machine in any warehouse moves more pallets than everything else combined, and lithium batteries have quietly turned a manual tool into equipment that competes for the same labour justification as a forklift.

Lead Analyst

Bilal Shaikh

Published

September 2026

Make Smarter Decisions with Customized Research Insights

Request a free sample report and evaluate market opportunities, growth trends, and competitive dynamics relevant to your business needs.

2025 MARKET VALUE$5.9BMarket Size 2025
2036 FORECAST VALUE$11.7BBase Case , 2026 to 2036
CAGR 2026 TO 20366.4 %Bull 7.6% / Bear 5.2%
INCREMENTAL OPPORTUNITY$5.4BNet 10- year value creation
EXPANSION MULTIPLE1.86x2036 value over 2026 base
Strategic Levers
M&A Pipeline
Regional Outlook
Country Rankings
Competitive Intelligence
Segmental Deep-dive
Call-Us : 91 93563 13602

Executive Snapshot and Market Trajectory

A hand pallet truck costs a few hundred dollars and moves more pallets over a year than the forklift parked beside it. Nobody in procurement thinks about that, which is exactly why the category has been quietly transformed without much attention being paid. It is the warehouse's last unmanaged asset.
Lithium-ion powered pallet trucks compound at 9.6%, exactly 1.50 times the market, because opportunity charging removes the battery room, the swap procedure and the spare pack that lead-acid always required. East Asia holds 31% of demand, above the standard band, on warehouse construction and manufacturing logistics volume no other region matches. Warehouse construction there outpaces every other region. Manufacturing logistics adds substantially to that.
Five suppliers hold 46%. Distribution rather than engineering decides most of it: a hand truck is bought from whoever can deliver tomorrow, while powered units are sold by dealers who service them. Warehouse labour scarcity is what pulls buyers from the first category into the second. Roughly 73% of powered sales flow through those dealers, and that coverage takes years to build anywhere new. Labour scarcity is what pulls buyers between the two.
Market Definition
The market covers pedestrian-operated pallet handling trucks, spanning manual hand pallet trucks, electric powered pallet trucks, lithium-ion powered trucks, rider and stand-on pallet trucks, weighing and specialty pallet jacks, and semi-automated pallet movers. Counterbalance and reach forklifts, order pickers, stackers lifting above pedestrian working height, and fully autonomous mobile robots are excluded.
Base Year Value
$5.9B in 2025 (MMA Primary Research Dataset, August 2026)
Forecast Period
2026 to 2036, eleven discrete annual values
CAGR
6.4% base case. Bull 7.6%. Bear 5.2%.
Fastest Growth Segment
Lithium-Ion Powered Pallet Trucks: 9.6% CAGR
Fastest Growth Country
India: 10.2% CAGR
Fastest Growth Region
South Asia and Pacific: 8.6% CAGR
Largest Region
East Asia: 31% of 2025 global value
Market Leaders
Toyota Industries, KION Group, Jungheinrich, Crown Equipment, Hyster-Yale. Source: MMA Analysis based on company annual reports.
Primary Survey
n=3,800 procurement and R&D decision-makers, Q4 2025, six countries
Methodology
Demand-side build-up, cross-validated against public data, 47 expert interviews

Pallet Jacks Market Forecast Scenarios

pallet-jacks-market-size-forecast-scenario-1787308626696
Growth ran at an implied 5.2% across 2020 to 2025 and the drivers changed halfway through. Warehouse construction and electronic commerce fulfilment drove volume sharply through 2020 and 2021, then equipment lead times stretched as component shortages bit, and from 2023 lithium conversion rather than unit growth carried most of the value increase. Value moved while unit growth flattened.
The base case at 6.4% rests on three mechanisms. Warehouse labour scarcity keeps pushing operations from manual trucks toward powered units, since a powered truck moves substantially more pallets per operator hour. Lithium conversion continues displacing lead-acid on charging convenience rather than on battery cost. And semi-automated pallet movers are opening where full automation cannot be justified. All three point operations rather than procurement at the decision. None of the three depends on new warehouse construction.
The bull case at 7.6% assumes warehouse wage inflation persists, since every increase strengthens the labour productivity case for powered equipment against manual handling. The bear case at 5.2% follows from warehouse construction slowing across developed markets after several years of overbuilding, which would reduce new equipment demand while leaving the replacement cycle intact. The replacement cycle continues regardless.

The Machine Nobody Notices Doing Most of the Work

Walk through any distribution centre and count what is actually moving. The forklifts get the attention and the capital approvals, and the hand pallet trucks do far more of the pallet movements, on almost no budget and with no maintenance record anybody keeps. That invisibility is precisely why the category has changed so much with so little notice from the people signing for it.
TOP FIVE CONCENTRATION46%Combined share held by the five largest global manufacturers
MANUAL FLEET SHARE61% of unitsProportion of installed trucks still operated entirely by hand
POWERED PRODUCTIVITY GAIN2.7 timesPallets moved per operator hour against manual truck handling
LITHIUM CHARGING DOWNTIME94% reductionTime removed from battery swapping and dedicated charging routines
AVERAGE SERVICE LIFE8 yearsWorking life of a powered truck in single shift operation
DEALER CHANNEL SHARE73% of poweredPowered truck sales flowing through dealer networks rather than direct
Labour is what changed. A powered pallet truck moves roughly 2.7 times the pallets per operator hour that a manual truck manages, and in a market where warehouse staff are difficult to recruit and expensive to retain, that ratio converts directly into a justification nobody previously bothered to make. Manual trucks still represent 61% of the installed fleet, which is the size of the conversion still available.
Lithium finished the argument. Lead-acid required a charging room, a swap procedure and a spare pack per truck on multi-shift operations, and opportunity charging during breaks removes all three. Downtime associated with charging falls by around 94%. The battery costs more and the total operating economics are better, which is an unusual combination in industrial equipment.
"Every operations director I meet can name their forklift fleet size to the unit. Almost none can tell me how many pallet trucks they own, and those trucks are doing most of the actual work. It is the last genuinely unmanaged asset class in the warehouse."
Director, Material Handling and Warehouse Equipment Practice · MMA Material Hand

Market Trends

Lithium Opportunity Charging Removes the Battery Room Entirely

Lead-acid powered trucks required a dedicated charging area, a formal swap procedure and frequently a spare battery per truck on multi-shift operations, all of which consumed floor space and operator time. Lithium packs accept opportunity charging during breaks and shift changes without damage, removing around 94% of charging-related downtime along with the room itself. The pack costs considerably more and the operating economics still favour it, which is why the segment compounds at 9.6% against a market at 6.4%. Warranty terms on the pack now differentiate suppliers. Floor space returns with it.
Market Impact: Semi-automated units at 8% of power
Warehouse Labour Scarcity Converts Manual Fleets to Powered

Warehouse recruitment has become genuinely difficult across developed markets and wage inflation has run well above general levels for several years. A powered pallet truck moves roughly 2.7 times the pallets per operator hour a manual truck achieves, which turns a modest capital item into a labour productivity decision. Manual trucks remain 61% of the installed fleet, so the available conversion is large. Operations rather than procurement now initiate most of these purchases, and they evaluate hours saved rather than equipment price. Hours saved beats equipment price. Recruitment difficulty made the case.
Market Impact: Fulfilment at 29% of powered demand

Market Opportunities and Growth Drivers

Semi-Automation Fills the Gap Full Robotics Cannot Justify

Autonomous mobile robots suit repetitive long-haul movements in high-throughput facilities and cannot be justified in operations with variable routes, mixed pallet types or seasonal volume swings. Semi-automated pallet movers, which follow an operator, run a taught route or handle a single repetitive leg while a person does the rest, address exactly that middle ground. They cost a fraction of full automation and require no facility modification, which is why they have found adoption in operations that had rejected robotics outright. Payback rejection is the qualifying signal. No facility modification is needed.
Market Impact: Manual holding 61% of fleet

Electronic Commerce Fulfilment Multiplies Pallet Movements

A pallet arriving at a fulfilment centre is broken down, moved between induction, storage, picking and packing zones, and consolidated again for outbound. That generates several times the pallet movements per unit of throughput that a traditional bulk distribution model produced. Fulfilment centres also run longer operating hours, which raises equipment utilisation and shortens replacement cycles. Roughly 29% of powered truck demand now comes from fulfilment and parcel operations that barely existed as a customer segment fifteen years ago. Longer operating hours raise utilisation and shorten replacement cycles, which compounds the demand effect further.
Market Impact: Price gaps reaching 55% on manual

Market Restraints and Challenges

Manual Trucks Are Cheap Enough to Buy Without Thinking

A hand pallet truck costs a few hundred dollars and requires no charging, no training certification and no maintenance schedule anybody enforces. The root cause is that the purchase falls below every approval threshold in most organisations, so it happens without evaluation. Powered alternatives cost twenty times more and need a justification nobody is asked to write. Suppliers mitigate by selling to operations on hours saved rather than to procurement on price, and by offering rental structures that move the cost off capital entirely. Nobody is asked to evaluate it.
Market Impact: Charging downtime cut 94%

Low-Cost Manufacturers Compete Aggressively on Hand Trucks

Manual pallet trucks are mechanically simple, unpatented and manufactured at scale across Asia at costs established brands cannot approach. The root cause is that the product has been fully commoditised for decades and there is no meaningful performance differentiation a buyer can perceive. Branded manufacturers mitigate by treating hand trucks as channel presence rather than profit, and by concentrating commercial effort on powered units where service network, parts availability and dealer support genuinely differentiate. Service network and parts availability are the only genuine differentiators left. Hand trucks become channel presence rather than profit.
Market Impact: Powered trucks moving 2.7 times mor
3 additional market trends, 4 additional growth drivers, and 2 additional restraints and challenges are covered in the full report. Contact sales@marketmindsadvisory.com to access the complete intelligence.

Segment CAGR and Growth Architecture

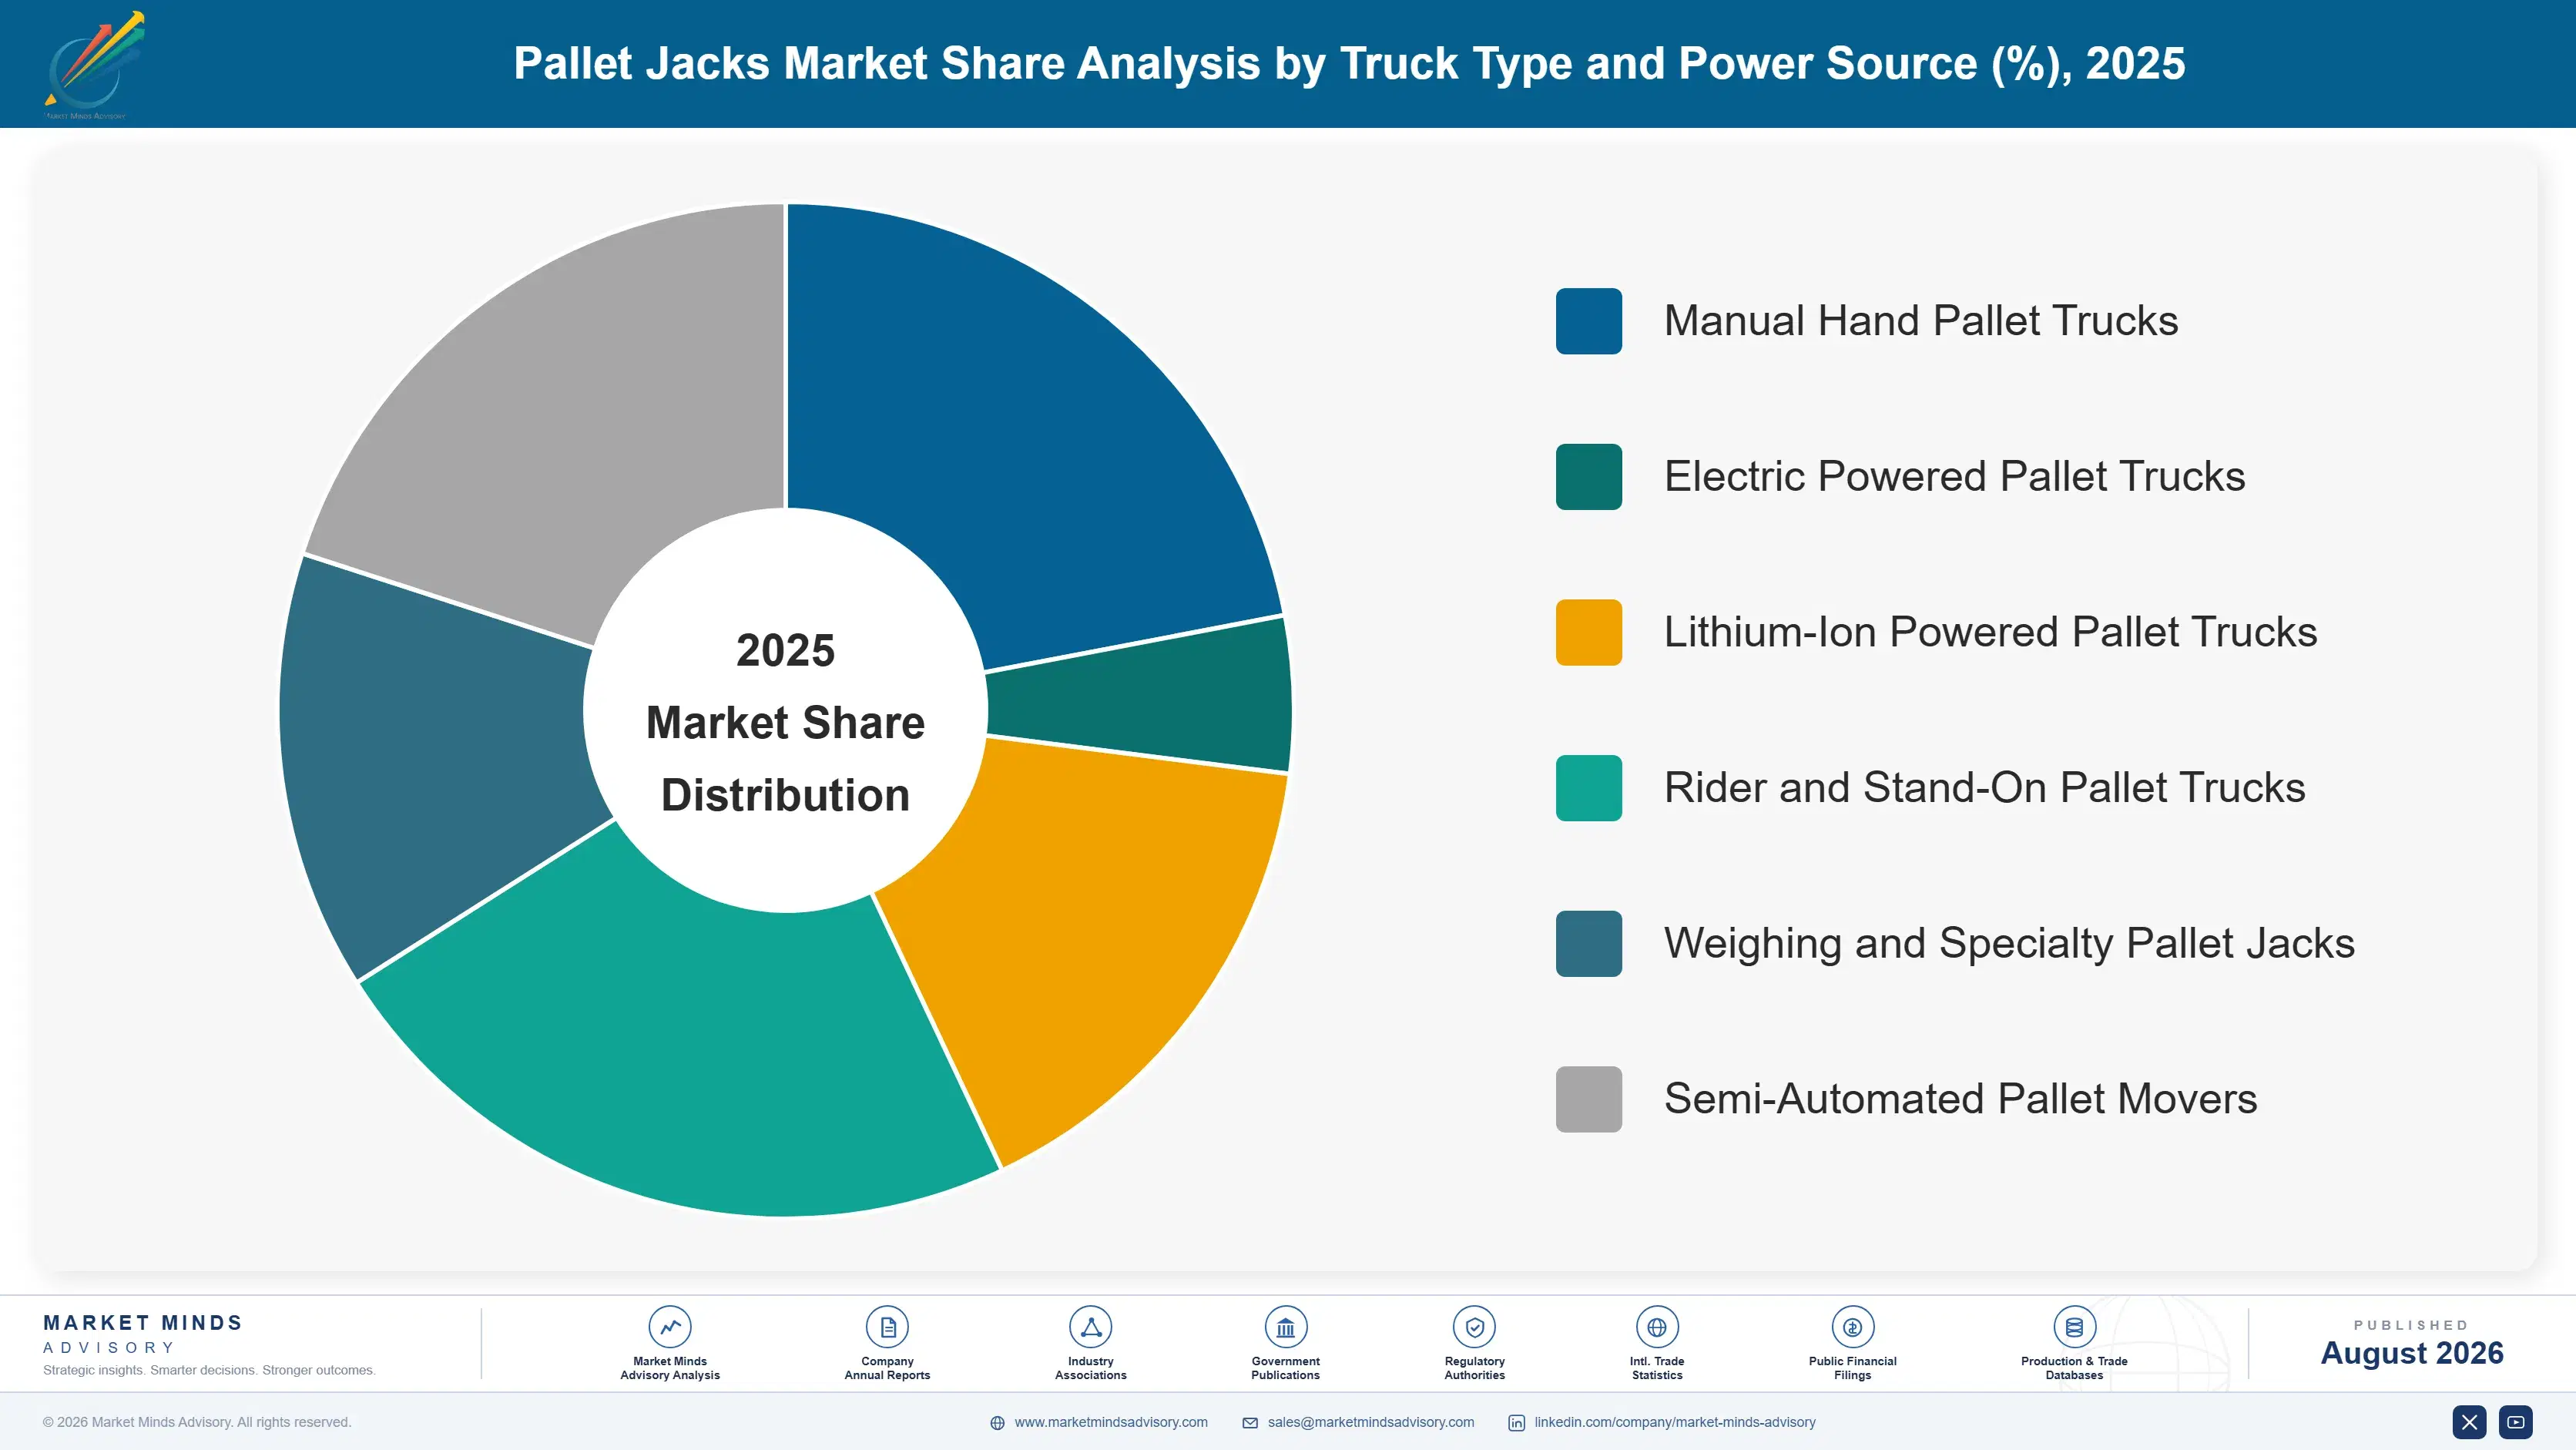
Segmentation follows truck type and power source, because each carries a different purchase threshold, a different buyer and a different service requirement. A hand truck bought on a purchase card and a lithium powered truck specified through a dealer belong to the same product family and to entirely separate commercial processes. Purchase threshold decides which conversation happens at all.
pallet-jacks-market-market-share-analysis-1787308627224

Lithium-Ion Powered Pallet Trucks

Lithium trucks compound at 9.6%, exactly 1.50 times the market rate, on charging convenience rather than on any handling capability the truck itself gained. Lead-acid demanded a charging room, a documented swap procedure and often a spare pack per truck on multi-shift work, consuming floor space, operator time and supervision. Lithium accepts opportunity charging during breaks without damage, removing roughly 94% of charging-related downtime and the infrastructure with it. The pack costs materially more and total operating economics still favour it. Battery supply, thermal management and charger compatibility are where the engineering actually sits, and warranty terms on the pack have become a genuine point of competitive difference between manufacturers.
CAGR 9.6%

Semi-Automated Pallet Movers

Semi-automated movers grow at 8.2% by occupying ground full robotics cannot economically reach. Autonomous mobile robots need repetitive long-haul routes and high throughput to justify their cost and their facility integration. Many operations have variable routing, mixed pallet types and seasonal swings that defeat that model entirely. A truck that follows an operator down a pick face, runs a taught route between two fixed points, or handles one repetitive leg while a person does everything else, addresses that middle ground at a fraction of the cost and with no facility modification required. Adoption has come largely from operations that had already evaluated full automation and rejected it on payback grounds. Payback rather than capability was the obstacle.
CAGR 8.2%
Full segment breakdown across 6 segments available in the complete report.

Regional Architecture and Country Demand Map

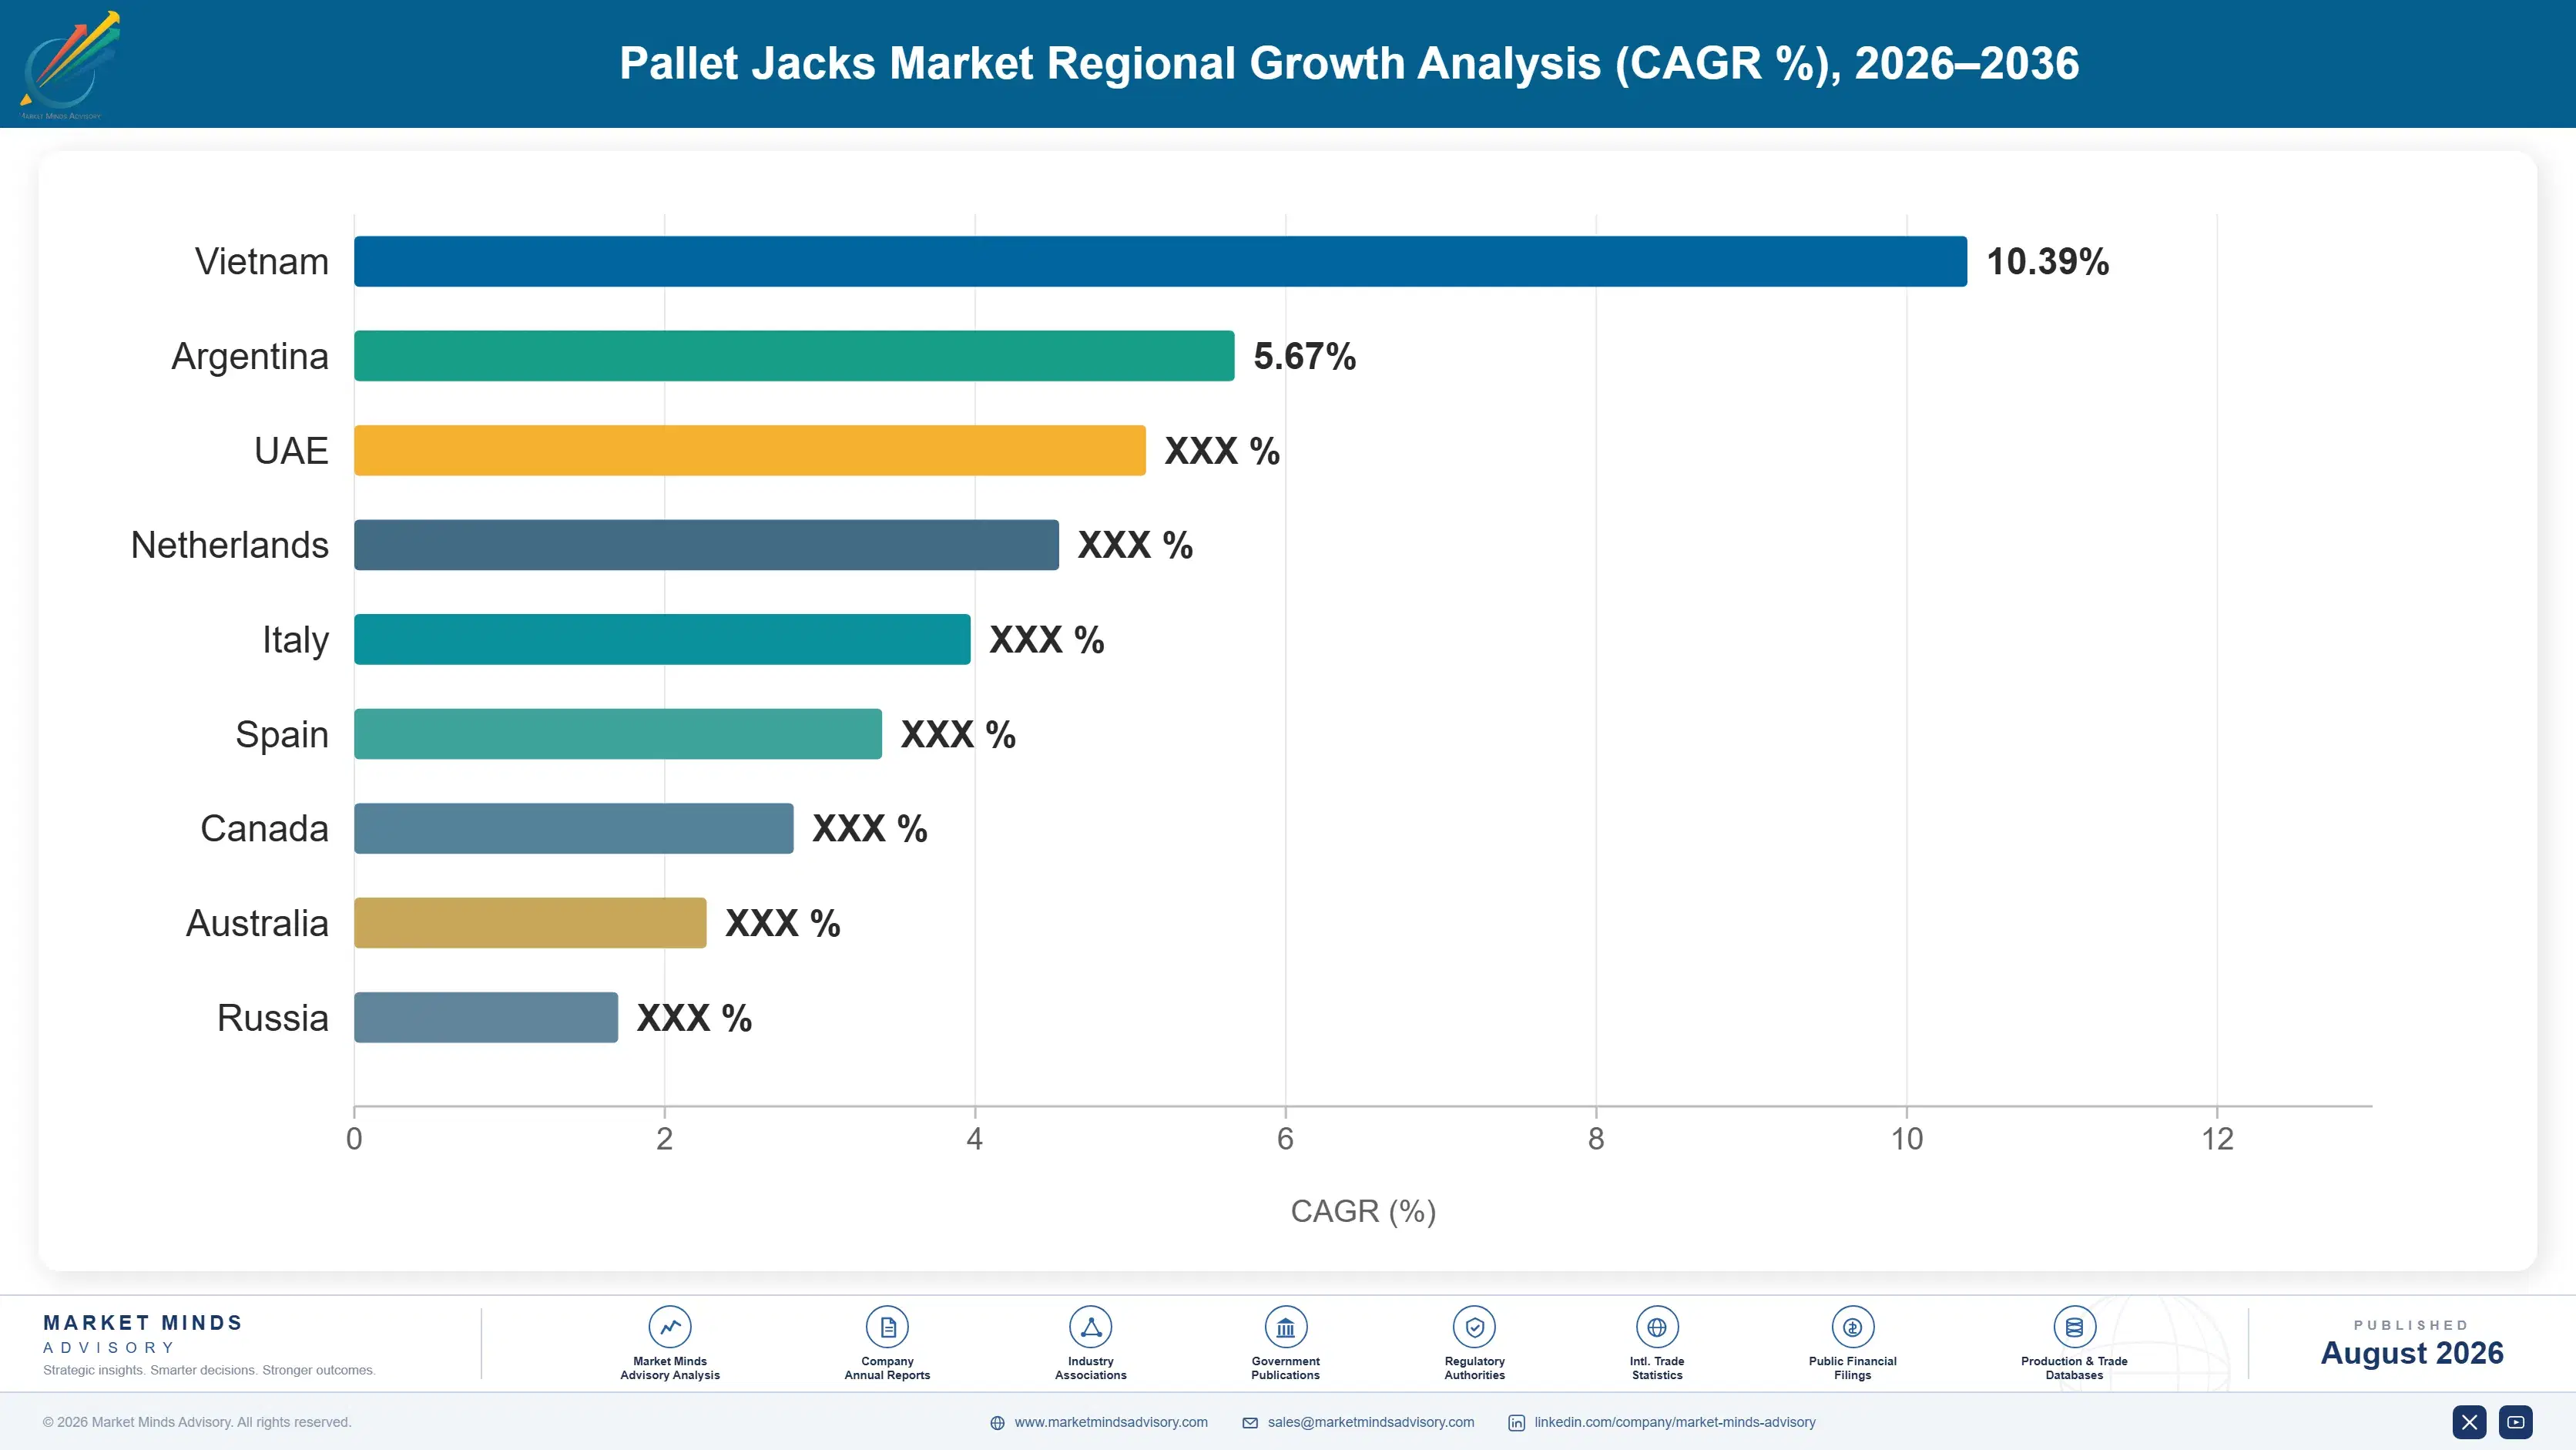
Demand follows warehouse and manufacturing floor area rather than economic output, since trucks are bought where pallets move. Labour cost determines how much of each region's fleet has converted from manual to powered, and that varies enormously. Labour cost rather than warehouse count is the map worth reading.

East Asia

East Asia holds 31% of global demand. Note: this exceeds the standard band because Chinese warehouse construction and manufacturing logistics floor area together exceed any other region several times over, and trucks are bought where pallets move rather than where goods are consumed. Chinese manufacturers including Hangcha, EP Equipment and Noblelift supply enormous manual and powered volumes domestically and export heavily, and their lithium powered truck offerings have been price-competitive earlier than Western equivalents. Japanese demand is smaller and weighted toward powered and semi-automated units given acute labour scarcity. Korean warehouse investment adds steady volume. Regional growth of 7.4% reflects both floor area addition and accelerating powered conversion. Lithium pricing arrived earlier there.
Share: 31% | CAGR: 7.4% (2026 to 2036)

South Asia and Pacific

The fastest growing region at 8.6%, with India compounding at 10.2%, South Asia and Pacific accounts for 12% of demand. Indian warehousing has been transformed by goods and services tax reform, which consolidated fragmented state-level storage into larger regional distribution centres, and organised retail and electronic commerce have driven purpose-built warehouse construction at pace. Manual trucks still dominate the installed fleet by a wide margin given labour cost, so the powered conversion opportunity is larger here than anywhere. Australian demand resembles Western Europe with high powered penetration. Southeast Asian manufacturing logistics has grown with production relocation across Vietnam, Thailand and Indonesia. The powered conversion opportunity is larger here than anywhere else in the world.
Share: 12% | CAGR: 8.6% (2026 to 2036)
Regional intelligence for 5 additional markets available in the complete report: North America, Western Europe, Latin America, Middle East and Africa, Eastern Europe. Contact sales@marketmindsadvisory.com.
pallet-jacks-market-country-cagr-analysis-1787308627747

Selling Hours Rather Than Trucks

A hand pallet truck is bought below every approval threshold and a powered one needs a justification nobody is asked to write. Every commercially useful position here involves moving the purchase away from equipment price and toward something operations already measures. Four qualify. Equipment price reaches the wrong function entirely, and it always has.

Sell Operator Hours to Operations Not Price to Procurement

A powered truck moves roughly 2.7 times the pallets per operator hour a manual truck achieves, which in a market with warehouse wage inflation is a labour decision rather than an equipment one. Procurement compares a few hundred dollars against several thousand and declines. Operations compares hours against headcount they cannot recruit and approves. Suppliers that quantify the productivity gain on the customer's own pallet movement data reach the second conversation, and manual trucks remain 61% of the installed fleet available to convert. Movement data does the selling. Two functions, two answers.
Market Impact: Powered trucks moving 2.7 times mor

Price Lithium Against Infrastructure Not Battery Cost

A lithium pack costs materially more than lead-acid and the comparison is routinely made on that basis alone, which loses the sale. What lithium actually removes is the charging room, the swap procedure, the spare pack per truck and roughly 94% of charging-related downtime. Presented as floor space recovered and operator hours returned, the arithmetic reverses completely. Lithium trucks compound at 9.6% and carry gross margins roughly 8 to 14 points above lead-acid equivalents, and warranty terms on the pack differentiate suppliers meaningfully. Floor space is the hidden term. Pack price loses the sale.
Market Impact: Lithium carrying 8 to 14 gross marg

Target Operations That Already Rejected Full Automation

Autonomous mobile robots need repetitive long-haul routes and high throughput, and operations with variable routing, mixed pallet types or seasonal swings evaluate them and decline. Those operations are pre-qualified prospects for semi-automated movers, which cost a fraction as much and require no facility modification whatsoever. Semi-automated units already represent 8% of powered demand and grow at 8.2%. Reaching them requires knowing which operations ran an automation study and rejected it, which is commercial intelligence rather than any product capability. Very few manufacturers gather that intelligence at all. Rejection is the qualifying event.
Market Impact: Semi-automated at 8% of every power

Build Dealer Service Density Before Placing Powered Fleets

Roughly 73% of powered truck sales flow through dealers rather than direct, because a truck that stops needs parts and an engineer rather than a replacement order. Service density decides which manufacturer a warehouse will consider, and it takes years to establish in a new territory. Manufacturers entering a geography with equipment but no dealer coverage lose fleet placements they were technically well positioned to win. The hand truck business, unprofitable in itself, is frequently what keeps a dealer's counter traffic and parts relationship alive. Counter traffic sustains the relationship.
Market Impact: Dealers now carrying 73% of all pow

Who Controls the Margin Pool

Five manufacturers hold 46% of the market measured on truck revenue, the basis applied consistently through this section. Concentration is moderate, and it sits almost entirely in powered equipment, since manual trucks are commoditised and supplied by hundreds of producers. Toyota Industries and KION Group lead, both through dealer networks rather than direct sales. Manual trucks are supplied by hundreds of producers.
Competition operates on three dimensions. Dealer service density decides which manufacturer a warehouse will place a powered fleet with, since a stopped truck needs an engineer rather than a delivery. Lithium pack and charger engineering decides who competes credibly in the fastest-growing segment. And semi-automation capability decides participation in operations that have already rejected full robotics. All three take years to establish in a new territory.

Two pressures are reshaping position. Chinese manufacturers including EP Equipment and Hangcha compete aggressively on lithium powered trucks and reached price parity earlier than Western brands expected. Against that, dealer service networks remain difficult to replicate and are what a large operator actually buys. Rankings will move toward whoever pairs competitive lithium engineering with genuine service coverage. Very few hold both today.
pallet-jacks-market-company-positioning-matrix-1787308628269

Competitive Moat and Risk Dimensions

TOYOTA INDUSTRIES

Moat: Dealer network and reliability record

Toyota operates one of the densest material handling dealer networks anywhere, and warehouse operators buy service response rather than machines, because a stopped truck idles an operator immediately. Reliability record carries unusual weight in a category where maintenance discipline is generally poor, and equipment that tolerates neglect earns repeat fleet placements that specification comparisons never would.
TOYOTA INDUSTRIES

Risk: Lithium price competition

Chinese manufacturers reached competitive lithium powered truck pricing earlier than established brands anticipated, and the technology gap that once justified a premium has narrowed considerably. Where an operator buys on delivered price for a single-shift application with light service requirements, dealer density adds little the customer will pay for and the comparison becomes uncomfortable.
KION GROUP

Moat: Warehouse systems integration breadth

KION combines truck manufacture with warehouse automation and software through its wider business, which places it in conversations about facility design rather than equipment replacement. That position matters for semi-automated movers specifically, since those sell into operations weighing partial automation and benefit from being presented alongside the alternatives rather than against them.
KION GROUP

Risk: Manual truck channel presence

Hand pallet trucks are unprofitable and are also what sustains dealer counter traffic and parts relationships with smaller operators. Conceding that volume to low-cost manufacturers weakens the channel through which powered equipment eventually sells, and rebuilding a lapsed dealer relationship with a mid-sized warehouse is considerably harder than maintaining it.

Players Tracked

Prominent Players

Toyota Industries
KION Group
Jungheinrich
Crown Equipment
Hyster-Yale

Other Key Players

Mitsubishi Logisnext
Hangcha Group
EP Equipment
Noblelift Intelligent Equipment
Anhui Heli
Clark Material Handling
Combilift
Godrej and Boyce
Presto Lifts
Bishamon Industries
Lift-Rite
Pramac
Logitrans
Ameise
Big Joe Forklifts

Recent Developments

MARCH 2025

Lithium powered truck pricing reaches parity with lead-acid equivalents

Lithium pack costs continued falling toward levels where powered truck pricing approaches lead-acid equivalents on comparable specifications, removing the capital premium that had slowed conversion. This reflects battery supply chain economics rather than any commercial development between truck manufacturers. The last objection to conversion is disappearing.
Signal: The remaining objection to lithium was alw
JULY 2025

Warehouse wage inflation strengthens powered conversion arguments

Warehouse and logistics wage growth continued above general inflation across developed markets, improving the payback on powered equipment against manual handling. This reflects labour market conditions rather than corporate transactions, and it moves purchase initiation from procurement toward operations functions. Purchase initiation moves with it.
Signal: Rising labour cost converts a capital comp
NOVEMBER 2025

Semi-automated movers adopted where full robotics was rejected

Warehouse operators that had previously evaluated and declined autonomous mobile robots adopted semi-automated pallet movers for specific repetitive legs, citing lower cost and no facility modification requirement. This reflects operational decisions rather than any acquisition or partnership between suppliers. Variable routing and seasonal swings defeat the robotics model entirely.
Signal: A rejected automation study identifies pre

Steel, Batteries and Dealer Support

Steel accounts for roughly 29% of cost of goods on manual trucks and considerably less on powered units, purchased regionally with limited manufacturer influence over pricing. Lithium cells and battery management electronics run around 31% of a lithium powered truck, which is the single largest line in that product. Hydraulics, castors, motors and controls make up most of the remainder, with dealer support funded outside cost of goods.
Lithium cell pricing has fallen substantially since 2023 as battery manufacturing capacity expanded well ahead of demand, which is unusual and has directly enabled the price parity now emerging against lead-acid. Steel costs rose through the European energy disruption that International Energy Agency reporting documents across 2022 and 2023. Company annual reports covering material handling segments disclose both movements and their differing effects by product mix.

Exposure divides by product mix rather than by scale. Manufacturers weighted toward manual trucks carry high steel content into a commoditised price environment where increases cannot be passed through at all. Those weighted toward lithium powered units carry battery cost that has been falling rather than rising, and they sell into a channel where service and availability rather than delivered price decide most fleet awards.
pallet-jacks-market-cost-volatility-analysis-1787308628464

Contract lithium cell supply while capacity exceeds demand

Cell pricing has fallen because manufacturing capacity expanded ahead of demand, and that condition will not persist indefinitely as electric vehicle and storage demand catches up. Contracting multi-year supply while the buyer holds the advantage secures both price and availability, and pack availability rather than truck assembly is what constrains delivery when cells tighten.

Treat manual truck volume as channel cost not product margin

Hand trucks are commoditised and unprofitable against low-cost manufacturers, and they also sustain dealer counter traffic and parts relationships with the mid-sized operators who eventually buy powered fleets. Accounting for that volume as channel investment rather than judging it on product margin produces better decisions about how much of it to defend. Defending it becomes a deliberate choice.

Standardise battery and charger platforms across truck ranges

Common pack and charger architecture across a truck range reduces component variety, simplifies dealer parts inventory and lets an operator move batteries between machines, which customers value directly. It also concentrates purchasing volume on fewer cell specifications, improving both pricing and supply security as cell markets tighten again. Supply security improves alongside pricing. Interchangeability matters to customers.

Portfolio Architecture for Margin Defence

The portfolio separates on who signs for the purchase. Manual trucks fall below every approval threshold and are bought without evaluation, which makes them commoditised regardless of build quality. Powered trucks need a justification and reach operations. Lithium trucks compete on infrastructure removed rather than on the machine. Semi-automated movers sell against an automation study the customer already ran and rejected. Who signs draws the whole ladder here.
The tension is that manual trucks are unprofitable and simultaneously sustain the dealer relationships through which powered equipment eventually sells. Conceding them to low-cost manufacturers looks financially sensible and quietly removes the counter traffic and parts business that keeps a dealer engaged with mid-sized operators. Most established manufacturers run them deliberately at minimal margin for exactly that reason. Channel and margin are separate objectives. Most established manufacturers accept that trade knowingly.

High-value pools concentrate where labour productivity or floor space carries the argument. Lithium powered trucks, semi-automated movers and weighing or specialty units all qualify, and none of them is decided by comparing purchase price against a hand truck. Hand truck price comparison reaches none of them.

Volume / Commodity-Adjacent Tier

Manual hand pallet trucks sold below approval thresholds through distribution and dealer counters. Fully commoditised with no perceptible performance differentiation, and low-cost Asian manufacturers compete at price gaps established brands cannot approach.
Gross Margin: 13-20%

Premium / Certified Tier

Electric powered pallet trucks, rider and stand-on models sold through dealer networks on productivity and service response. Dealer density and parts availability rather than machine specification decide most fleet placements in this tier.
Gross Margin: 24-34%

Sustainability / Regulatory / Next-Generation Tier

Lithium-ion powered trucks and semi-automated pallet movers. The wide margin range reflects the gap between lithium units approaching price parity with lead-acid and semi-automation still priced against the full robotics alternative it displaces.
Gross Margin: 28-46%
pallet-jacks-market-portfolio-architecture-1787308628955

High-value Sub-segments and Strategic Watch-out

Lithium-Ion Powered Trucks

Compounding at 9.6% on charging convenience rather than handling capability, removing roughly 94% of charging downtime along with the battery room itself. Pack warranty terms have become a genuine point of difference between manufacturers competing for multi-shift fleet placements. Infrastructure removal is the argument. Multi-shift fleets convert first.
Gross Margin: 30-40%

Semi-Automated Pallet Movers

Growing at 8.2% by occupying ground full robotics cannot economically reach, in operations with variable routing and seasonal swings. Adoption comes largely from operators who already evaluated autonomous robots and declined them on payback grounds. No facility modification is required at all. Payback decided the rejection.
Gross Margin: 34-46%

Manual Hand Pallet Trucks

The volume core at 3.6%, commoditised and contested by low-cost manufacturers at price gaps reaching 55%. Run deliberately as channel investment sustaining dealer counter traffic and parts relationships, rather than judged on the product margin it returns. The dealer relationship depends on it. Counter traffic follows it.
Gross Margin: 13-20%

Weighing and Specialty Trucks

The watch-out and the opportunity together. Integrated weighing removes a separate scale operation and a second handling step, but calibration and certification requirements add a service obligation many dealers are not equipped to support properly. Certification obligations follow the equipment. Few dealers support calibration properly.
Gross Margin: 26-42%

Fleets Placed Through Dealers

Recurring revenue here sits with dealers rather than manufacturers directly. Roughly 73% of powered truck sales flow through dealer networks, and once a warehouse has standardised on a platform the parts, service and replacement business follows for the equipment's eight year working life. Operators rarely mix manufacturers across a fleet, because parts inventory, technician familiarity and battery interchangeability all argue against it. Fleet standardisation is close to permanent. Mixing manuf
Depth varies by operation type. Large fulfilment and third-party logistics operators buy deepest, running fleet management contracts covering supply, service and replacement together. Manufacturing logistics buys on specification and dealer proximity. Retail distribution buys on delivered cost through tenders. Small and mid-sized operations buy hand trucks from whoever answers the phone and are effectively unmanaged as customers. Operation size predicts depth almost exactly.

The deciding population has moved from procurement toward operations. A hand truck falls below approval thresholds and nobody evaluates it. A powered fleet is justified on operator hours and floor space, which are numbers operations owns, and that participant weighs service response far above equipment price. Service response outweighs price entirely.
pallet-jacks-market-end-use-penetration-index-1787308629442

Where Truck Makers Should Compete

These are among the four positions where our research anticipates prominent divergence between winners and laggards over the coming forecast period. Each is grounded in the demand model, the regulatory perimeter, and the announced capacity pipeline.
01 / LABOUR ARGUMENT OWNERSHIP

The purchase only makes sense to whoever counts operator hours

A powered pallet truck moves roughly 2.7 times the pallets per operator hour that a manual truck achieves, which makes it a labour decision rather than an equipment one. Procurement compares a few hundred dollars against several thousand and declines the upgrade every single time, while operations compares hours against headcount it genuinely cannot recruit and approves it. Manual trucks remain 61% of the installed fleet, so the conversion still available across the installed base is genuinely very large indeed.
02 / INFRASTRUCTURE COST FRAMING

Lithium sells on the room it removes, not the pack it contains

A lithium pack costs materially more than lead-acid does, and comparing the two on that basis alone loses the sale before any other argument gets made. What lithium actually eliminates is the charging room itself, the swap procedure, the spare pack per truck and roughly 94% of all charging-related downtime. Presented instead as floor space recovered and operator hours returned, the arithmetic reverses completely, and the segment compounds at 9.6% on precisely that reframing rather than on any technical merit.
03 / REJECTED AUTOMATION TARGETING

An abandoned robotics study is the best prospect list available

Autonomous mobile robots require repetitive long-haul routes and high throughput, so operations with variable routing, mixed pallet types or seasonal volume swings evaluate them carefully and then decline. Those operators are effectively pre-qualified prospects for semi-automated movers, which cost a fraction as much to install and need no facility modification whatsoever. Knowing which operations ran an automation study and then rejected it is commercial intelligence rather than any product capability, and remarkably few manufacturers anywhere bother to gather it systematically.
04 / CHANNEL INVESTMENT DISCIPLINE

The unprofitable hand truck keeps the dealer relationship alive

Manual trucks are fully commoditised, face price gaps reaching 55% against low-cost manufacturers and return almost no margin at all to anybody. They also sustain the dealer counter traffic and parts relationships through which powered fleets are eventually placed, and roughly 73% of all powered truck sales flow through those same dealers. Conceding hand truck volume looks financially sensible on its own terms and it quietly removes the channel presence through which mid-sized operators come to buy powered equipment later on.

Engagement Snapshot From the Field

A live engagement with an industry participant carrying material or product regulatory and market exposure ahead of a defining policy shift, showing how our research translates into a defensible multi-year portfolio strategy.
MARKET MINDS ADVISORY · CLIENT ENGAGEMENT SUMMARY
Pallet Jacks Producer Strategic Portfolio Review and Transition Roadmap 2026·Investment Scenario on Pallet Jacks Exposure Evaluation 2025-26
CLIENT PROFILE
A third-party logistics provider operating 41 distribution facilities across seven European countries with roughly EUR 1.9 billion in revenue (client-reported, unverified by MMA). The pallet truck fleet numbered close to 3,100 units (client-reported, unverified by MMA), of which around two thirds were manual, purchased site by site with no group specification and no central record of what was actually owned.
STRATEGIC CHALLENGE
Warehouse labour costs had risen sharply and several sites reported difficulty meeting throughput commitments during peak periods. Operations had requested additional headcount that recruitment could not deliver. Procurement had separately tendered pallet trucks on unit price and consolidated onto a low-cost manual supplier, reporting a saving. Operations was never consulted on the tender.
MMA APPROACH
MMA measured pallet movements per operator hour across a sample of sites using manual and powered trucks on comparable tasks, then modelled conversion economics against actual local labour cost by country. Charging infrastructure floor space and battery handling time were quantified separately at the sites already running powered equipment. Fleet records were reconstructed site by site.
KEY FINDINGS
  1. Powered trucks moved close to three times the pallets per operator hour that manual trucks achieved on identical tasks, and the gap was widest at the sites reporting peak throughput shortfalls.
  2. The manual truck consolidation saving was smaller than the labour cost of a single additional shift worker at any of the seven countries in the study, and the fleet decision had never reached operations.
  3. Charging rooms at the four lead-acid sites occupied floor space the operator was separately renting additional external storage to compensate for, and nobody had connected the two costs.
  4. No group record existed of fleet size, age or type, so replacement was reactive and the organisation could not answer basic questions about what it owned or how old it was.
CLIENT PROFILE
A third-party logistics provider operating 41 distribution facilities across seven European countries with roughly EUR 1.9 billion in revenue (client-reported, unverified by MMA). The pallet truck fleet numbered close to 3,100 units (client-reported, unverified by MMA), of which around two thirds were manual, purchased site by site with no group specification and no central record of what was actually owned.
STRATEGIC CHALLENGE
Warehouse labour costs had risen sharply and several sites reported difficulty meeting throughput commitments during peak periods. Operations had requested additional headcount that recruitment could not deliver. Procurement had separately tendered pallet trucks on unit price and consolidated onto a low-cost manual supplier, reporting a saving. Operations was never consulted on the tender.
MMA APPROACH
MMA measured pallet movements per operator hour across a sample of sites using manual and powered trucks on comparable tasks, then modelled conversion economics against actual local labour cost by country. Charging infrastructure floor space and battery handling time were quantified separately at the sites already running powered equipment. Fleet records were reconstructed site by site.
KEY FINDINGS
  1. Powered trucks moved close to three times the pallets per operator hour that manual trucks achieved on identical tasks, and the gap was widest at the sites reporting peak throughput shortfalls.
  2. The manual truck consolidation saving was smaller than the labour cost of a single additional shift worker at any of the seven countries in the study, and the fleet decision had never reached operations.
  3. Charging rooms at the four lead-acid sites occupied floor space the operator was separately renting additional external storage to compensate for, and nobody had connected the two costs.
  4. No group record existed of fleet size, age or type, so replacement was reactive and the organisation could not answer basic questions about what it owned or how old it was.
RECOMMENDED STRATEGY
Phase 1: Phase 1 (months 1 to 6): Build a group fleet register and convert the four sites with peak throughput shortfalls to powered trucks funded from labour cost. Phase 2: Phase 2 (months 6 to 18): Replace lead-acid with lithium at the four affected sites and reclaim the charging room floor space for storage. Phase 3: Phase 3 (months 18 to 30): Move truck purchasing to a group specification decided jointly by operations and procurement rather than by site.
OUTCOME
Peak throughput shortfalls were eliminated at the four converted sites without additional headcount (client-reported, unverified by MMA). Equipment spend rose by roughly EUR 2.7 million against labour and external storage savings near EUR 6.9 million annually. The group fleet register identified around 240 trucks nobody had recorded (client-reported, unverified by MMA).

Frequently Asked Questions

Foundational context covering the market sizes, CAGR, scope, country, region and competition that inform every finding below. This section is provided to cover basics and most often pre-purchase conversations, answered from the MMA Primary Research Dataset.

What is the current size of the Pallet Jacks Market?

The global market was worth USD 5.9 billion in 2025, reaching USD 6.28 billion in 2026. East Asia holds the largest regional share at 31% of demand.

How large will the Pallet Jacks Market be by 2036?

MMA forecasts USD 11.68 billion by 2036, an expansion multiple of 1.86 times the 2026 base. That represents roughly USD 5.4 billion of incremental value.

What is the CAGR for the Pallet Jacks Market 2026 to 2036?

The base case compounds at 6.4% annually, with a bull case of 7.6% and a bear case of 5.2%. Historical growth from 2020 to 2025 ran at 5.2%.

Which segment is growing fastest?

Lithium-ion powered pallet trucks compound at 9.6%, exactly 1.50 times the market rate. Opportunity charging removes roughly 94% of charging downtime along with the battery room itself.

Who are the major companies in the Pallet Jacks Market?

Toyota Industries, KION Group, Jungheinrich, Crown Equipment and Hyster-Yale hold a combined 46% of the market. Concentration sits almost entirely in powered equipment rather than manual trucks.

Which country is growing fastest?

India compounds at 10.2%, ahead of every other national market. Tax reform consolidated fragmented state storage into larger regional distribution centres requiring purpose-built warehouse equipment.

Report Segmentation Architecture

The full report scope spans multiple orthogonal segmentation dimensions, with cross-tabulated demand data provided for each dimension pair. Coverage extends further to regional breakdowns, trend trajectories, and the competitive detail needed to support segment-level decision-making.

By Truck Type and Power Source

  • Manual Hand Pallet Trucks
  • Electric Powered Pallet Trucks
  • Lithium-Ion Powered Pallet Trucks
  • Rider and Stand-On Pallet Trucks
  • Weighing and Specialty Pallet Jacks
  • Semi-Automated Pallet Movers

By End-Use Industry

  • Third-Party Logistics and Distribution
  • Retail and Grocery Warehousing
  • Manufacturing and Industrial Plants
  • Electronic Commerce Fulfilment
  • Cold Chain and Food Distribution

By Commercial Dimension

  • Dealer Network Sales
  • Direct Fleet Supply Agreements
  • Rental and Fleet Management Contracts
  • Distributor and Catalogue Channel

By Region

  • North America
  • Western Europe
  • East Asia
  • South Asia and Pacific
  • Latin America
  • Middle East and Africa
  • Eastern Europe

Scope, Methodology, and Coverage

Every figure in this report is reproducible from documented input assumptions. The scope below maps the historical period, the forecast horizon, the segmentation dimensions, and the countries covered, alongside the underlying primary and qualitative methodology.
Historical Period
2020 to 2025
Forecast Period
2026 to 2036
Base Year
2025 (USD billions; MMA Primary Research Dataset, August 2026)
Market Definition
The market covers pedestrian-operated pallet handling trucks, spanning manual hand pallet trucks, electric powered pallet trucks, lithium-ion powered trucks, rider and stand-on pallet trucks, weighing and specialty pallet jacks, and semi-automated pallet movers operating under operator supervision. Counterbalance and reach forklifts, order pickers, stackers lifting above pedestrian working height, tow tractors and fully autonomous mobile robots are excluded, as are batteries and chargers sold separately from trucks. Sizing is measured at manufacturer revenue in current prices.
Quantitative Units
USD billions (current prices); truck units and pallets moved per operator hour where applicable
Segmentation Dimensions
By Truck Type and Power Source; By End-Use Industry; By Commercial Dimension; By Region
Regions Covered
North America, Western Europe, East Asia, South Asia and Pacific, Latin America, Middle East and Africa, Eastern Europe
Countries Covered
USA, China, Germany, France, UK, Japan, South Korea, India, Australia, Canada, Brazil, Mexico, Indonesia, Vietnam, Thailand, Malaysia, UAE, Saudi Arabia, South Africa, Nigeria, Turkey, Poland, Netherlands, Italy, Spain, Sweden, Switzerland, Argentina, Colombia, Singapore, and additional markets relevant to this sector
Key Companies Profiled
Toyota Industries, KION Group, Jungheinrich, Crown Equipment, Hyster-Yale, Mitsubishi Logisnext, Hangcha Group, EP Equipment, Noblelift Intelligent Equipment, Anhui Heli, Clark Material Handling, Combilift, Godrej and Boyce, Presto Lifts, Bishamon Industries, Lift-Rite, Pramac, Logitrans, Ameise, Big Joe Forklifts
Quantitative Methodology
Primary survey, n=3,800 respondents, Q4 2025, six countries; demand-side model with trade association cross-validation
Qualitative Methodology
47 expert interviews, Q4 2025; applied to validate demand model assumptions, identify emerging dynamics, and assess competitive positioning
Report Format
PDF and XLSX data workbook (Word format preview document)
Publisher
Market Minds Advisory
Report Code
MMA-2026-CON-766
Published
August 2026
Contact
sales@marketmindsadvisory.com | www.marketmindsadvisory.com

Purchase the full Pallet Jacks Market Report (2026 to 2036).

The full report sizes pallet jacks across six truck types, three commercial dimensions and seven regions, with annual forecasts to 2036 under base, bull and bear scenarios. Powered conversion economics are modelled against local warehouse labour cost by country, which is what actually decides whether a manual fleet converts. Lithium adoption is tracked against charging infrastructure cost and floor space recovery rather than pack pricing alone. Dealer service network density is mapped by manufacturer and territory. Twenty manufacturers are profiled on a consistent truck revenue basis.
Powered conversion economics modelled against local labour cost
Lithium adoption tracked against infrastructure and floor space recovery
Dealer service network density mapped by manufacturer and territory
Manual fleet population estimated by region and industry
Semi-automation adoption assessed against rejected robotics evaluations
Replacement cycle timing modelled by operation type and utilisation

Built For The People Who Decide

From boardroom strategy to bench-side execution, this report is read cover-to-cover by leaders shaping the next decade of their industry, turning demand scenarios, market dynamics and valuation benchmarks into decisions.
CXOs/ Presidents/ VPs/ Managers
M&A and Corporate Development
Strategy Teams and R&D Heads
Procurement and Product Directors
Regulatory and Compliance Leaders
Investor Relations and Equity Analysts