Market Minds Advisory
Pallet Displays Market

Pallet Displays Market: Floor Space Economics, Retailer Compliance and the Cost of a Display Nobody Sets Up

A pallet display earns its place by the square metre of retail floor it occupies, and the brands paying for that space rarely learn how many of their displays a store actually put out.

Lead Analyst

Bilal Shaikh

Published

September 2026

Make Smarter Decisions with Customized Research Insights

Request a free sample report and evaluate market opportunities, growth trends, and competitive dynamics relevant to your business needs.

2025 MARKET VALUE$4.6BMarket Size 2025
2036 FORECAST VALUE$8.6BBase Case , 2026 to 2036
CAGR 2026 TO 20365.9 %Bull 7.1% / Bear 4.7%
INCREMENTAL OPPORTUNITY$3.8BNet 10- year value creation
EXPANSION MULTIPLE1.77x2036 value over 2026 base
Strategic Levers
M&A Pipeline
Regional Outlook
Country Rankings
Competitive Intelligence
Segmental Deep-dive
Call-Us : 91 93563 13602

Executive Snapshot and Market Trajectory

A pallet display is bought by a brand and set up by a store employee who was not consulted. That gap explains most of what happens in this market, and it explains why the display arriving fully assembled keeps taking share from the one that arrives flat.
Fully assembled pre-packed displays compound at 8.85%, exactly 1.50 times the market, because they remove the store labour that decides whether a display appears at all. East Asia holds 29% of demand on modern retail expansion and on the converting capacity that supplies it. Retail floor space economics rather than packaging cost governs what a brand will pay. Freight then caps how far any converter can serve, since a built display ships mostly air.
Five converters hold 46%, which is low, because display work is regional: a display ships as air once assembled, so freight distance caps how far a supplier can serve. Retailer specification compliance and structural design capability separate the serious suppliers from the printers. Board runs near 44% of converting cost, but input exposure is not what decides who keeps a programme. Erected display counts do.
Market Definition
The market covers retail-ready display units shipped on or as a pallet, spanning full pallet displays, half and quarter pallet displays, fully assembled pre-packed displays, flat-shipped knock-down displays, modular and reusable display systems, and hybrid pallet and shipper units. Shelf-ready secondary packaging without a pallet base, permanent metal or acrylic fixtures, and the products merchandised within the display are excluded.
Base Year Value
$4.6B in 2025 (MMA Primary Research Dataset, August 2026)
Forecast Period
2026 to 2036, eleven discrete annual values
CAGR
5.9% base case. Bull 7.1%. Bear 4.7%.
Fastest Growth Segment
Fully Assembled Pre-Packed Displays: 8.8% CAGR
Fastest Growth Country
India: 8.6% CAGR
Fastest Growth Region
South Asia and Pacific: 8.1% CAGR
Largest Region
East Asia: 29% of 2025 global value
Market Leaders
Smurfit Westrock, International Paper, DS Smith, Mondi, Menasha Packaging. Source: MMA Analysis based on company annual reports.
Primary Survey
n=3,800 procurement and R&D decision-makers, Q4 2025, six countries
Methodology
Demand-side build-up, cross-validated against public data, 47 expert interviews

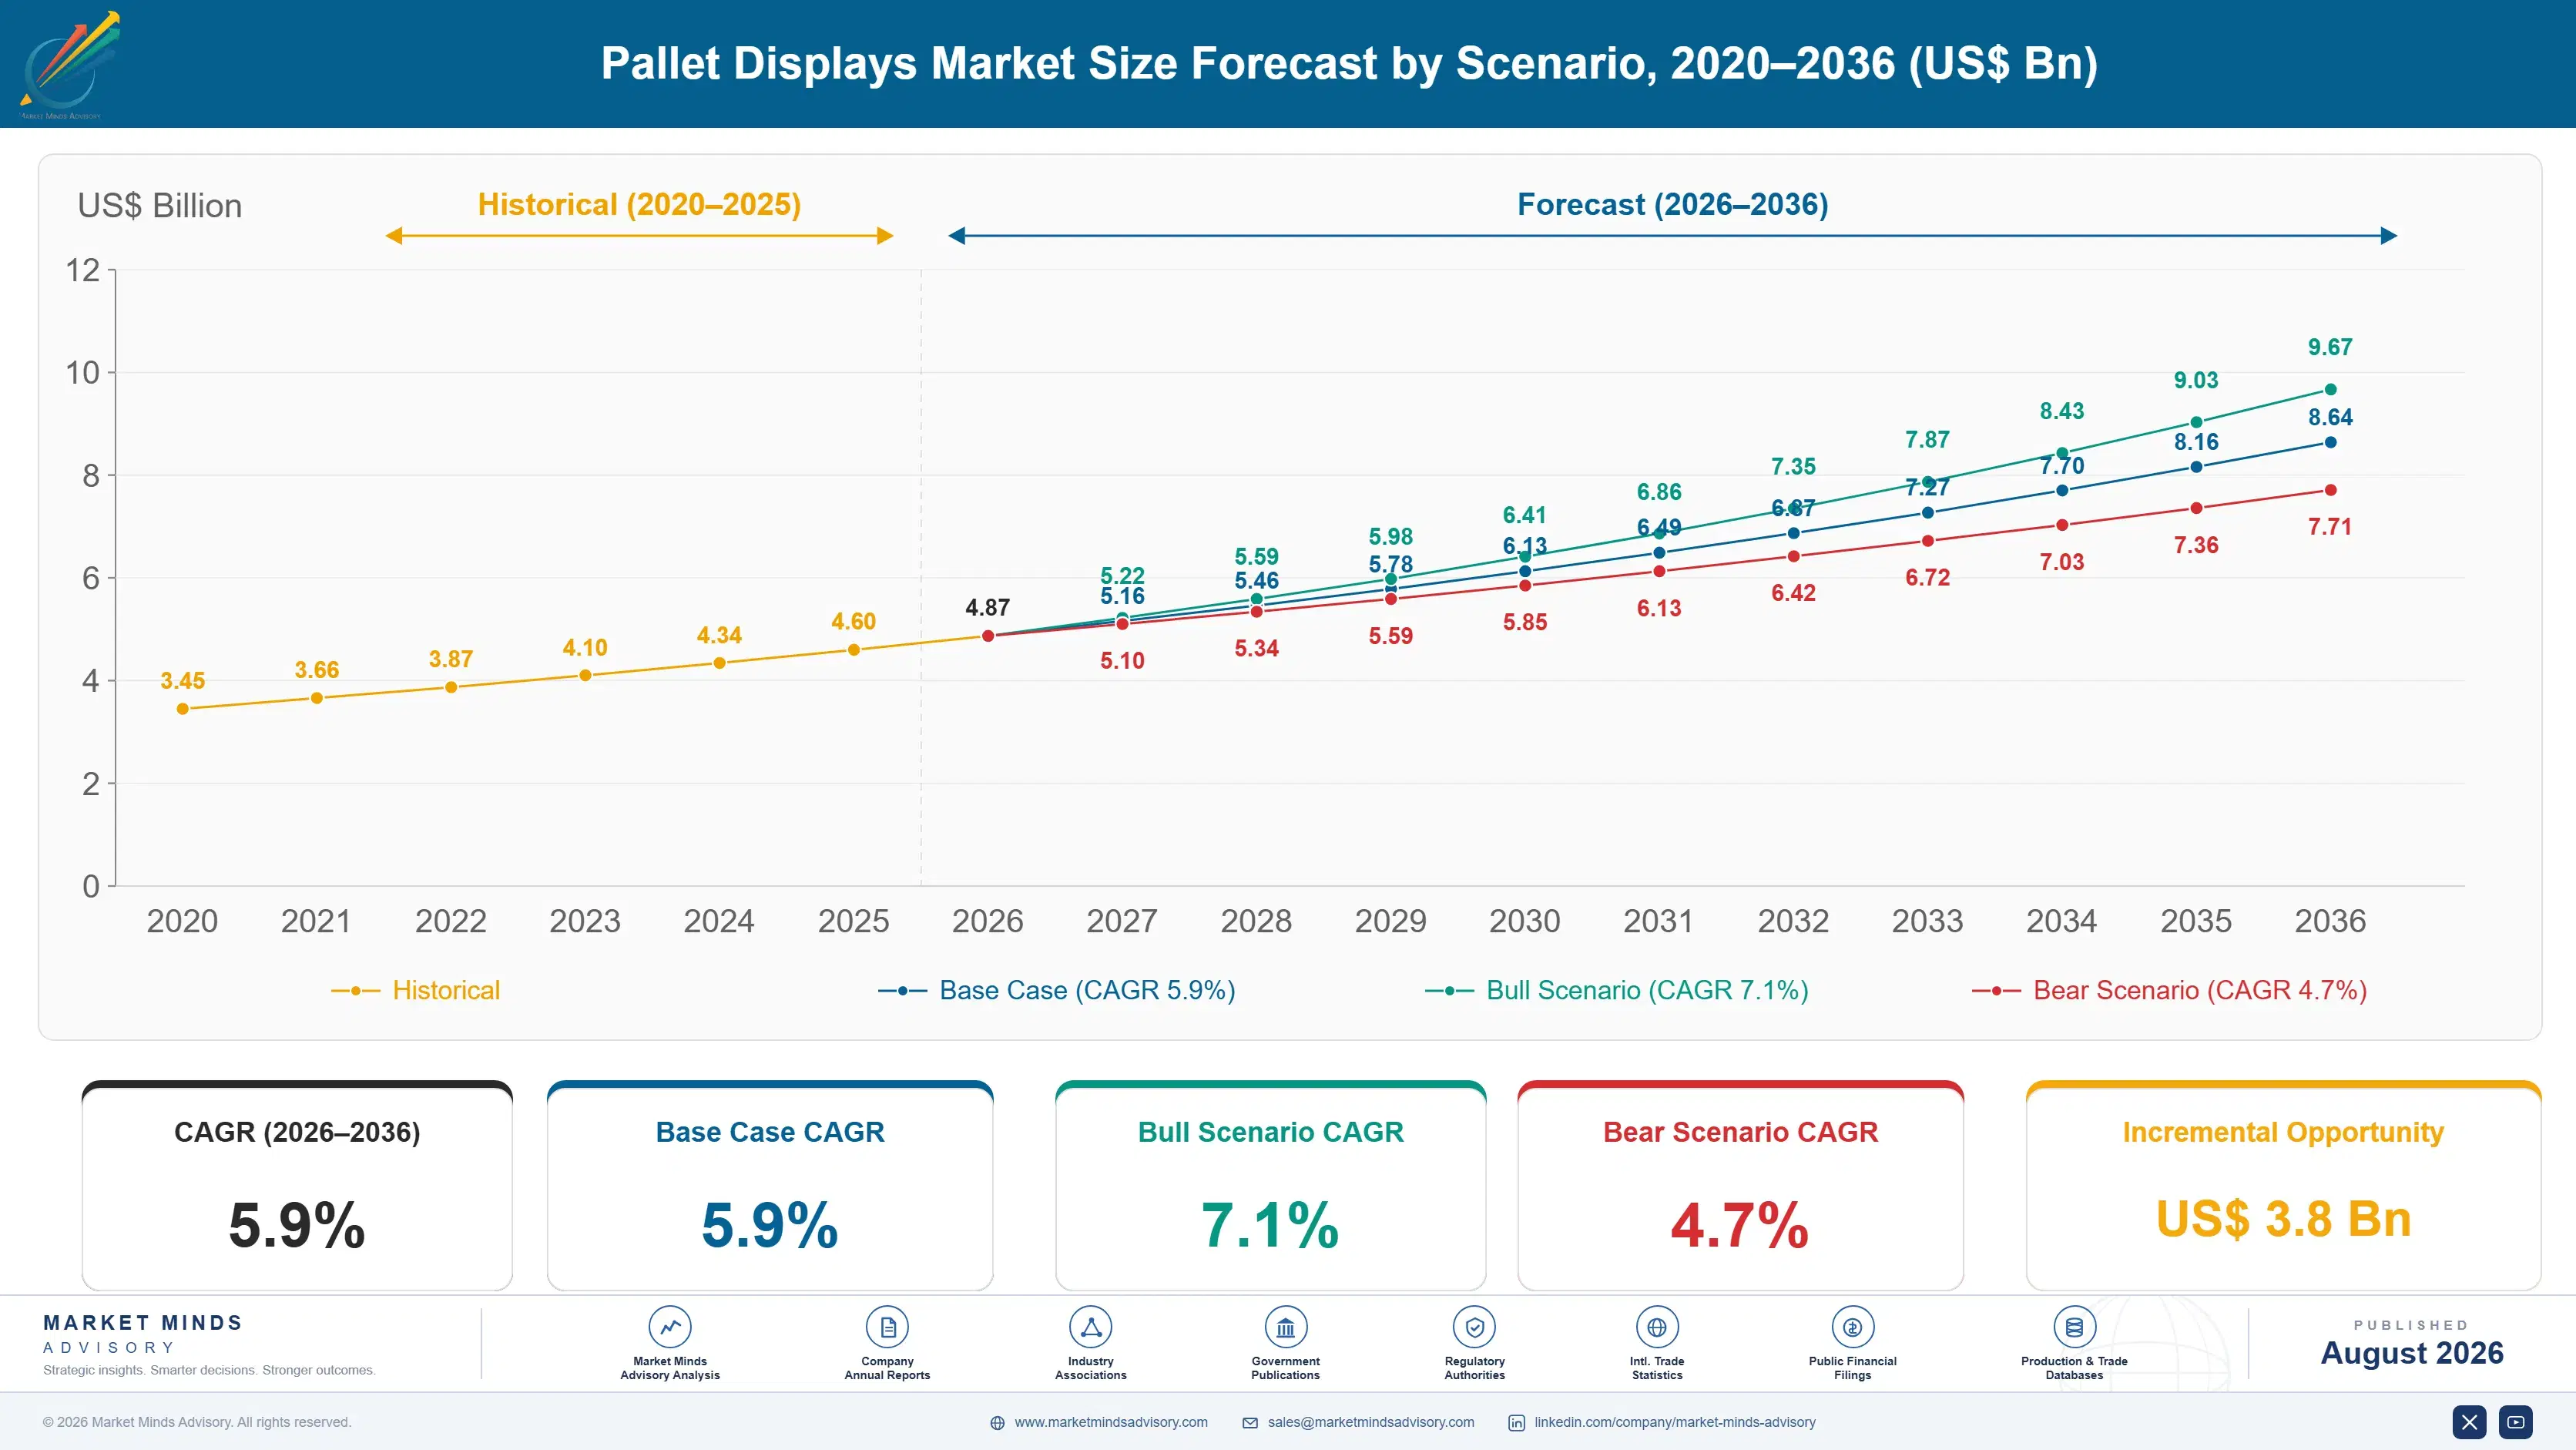
Pallet Displays Market Forecast Scenarios

pallet-displays-market-size-forecast-scenario-1787308620122
Growth ran at an implied 4.8% across 2020 to 2025. The period was distorted twice: pandemic store operations suspended promotional display programmes almost completely through 2020 and much of 2021, then the recovery ran hot as brands competed for floor space that had been unavailable. Underlying demand was steadier than the reported swings suggested. Pre-packed formats gained share throughout on store labour rather than price.
The base case at 5.9% rests on three mechanisms. Retail floor space is finite and brands keep bidding for it with displays rather than with shelf listings alone. Store labour scarcity keeps pushing work back onto the display supplier through pre-packing. And modern retail expansion in Asia and Latin America is adding display-capable store formats where none existed. Pre-packed compounds at 8.85% against a market at 5.9%, and reduced-footprint formats take further share as retail layout policy tightens.
The bull case at 7.1% assumes retailers formalise paid display space programmes further, converting an informal negotiation into a rate card that brands then budget against. The bear case at 4.7% follows from retailers restricting floor displays on shopper flow and safety grounds, which several grocery formats have trialled, alongside promotional spend shifting toward retail media networks.

Paying for Floor Space by the Square Metre

The economics here are not packaging economics. A brand buying a pallet display is buying retail floor space, and the display is what makes that space usable. The board, print and assembly cost sit well below what the space itself is worth, which is why brands accept prices that would be indefensible for a shipping case carrying the same product.
TOP FIVE CONCENTRATION46%Combined share of the five largest display converters globally
STORE SETUP COMPLIANCE63%Share of shipped displays actually erected by store staff
PRE-PACKED SETUP TIME4 minutesStore labour needed against a knock-down unit requiring far more
FREIGHT COST SHARE19% of deliveredTransport as a proportion of assembled display delivered cost
BOARD COST SHARE44% of COGSCorrugated board as a proportion of converter cost base
PROMOTION CYCLE LENGTH3 weeksTypical in-store duration governing display durability and print requirements
The problem is that the brand's spend depends on somebody else's labour. A display shipped flat has to be assembled by a store employee who has other work, and industry setup compliance runs around 63%. Better than a third of displays paid for never reach a shop floor in the form intended. Fully assembled pre-packed units address that directly, which is why they compound at 8.85%.
Against that, an assembled display ships air. Freight runs about 19% of delivered cost for pre-packed units against a fraction of that for flat, and the distance a converter can economically serve collapses accordingly. That is why concentration sits at only 46% in a category otherwise dominated by the same corrugated groups that consolidated everything else. Regional plant siting therefore beats scale here.
"Brands audit print quality on displays they will never see erected. The single most useful thing most of them could do is send somebody into 40 stores during week one of a promotion and count how many are actually out."
Principal, Retail Display and Point-of-Purchase Packaging Practice · MMA Retail

Market Trends

Pre-Packed Displays Remove the Store Labour Dependency

A display shipped flat depends on a store employee finding time to build it, and setup compliance across the industry runs near 63%. A fully assembled pre-packed unit needs roughly four minutes to position and open, which changes the compliance arithmetic completely. Brands that have measured the gap move quickly once they see it, because the display they paid for and the display the shopper sees turn out to be different populations. Pre-packed compounds at 8.85% against a market at 5.9%, and freight cost is the only thing slowing it.
Market Impact: Occupying 1 square metre each
Retailers Formalise Floor Space Into Rate Cards

Display placement was historically negotiated between a brand account manager and a category buyer, informally and inconsistently. Larger grocery and mass retailers have moved toward published rate cards for floor positions, with defined dimensions, durations and compliance commitments attached. That converts display spend from a promotional variable into a budgeted line, and it makes retailer dimensional specifications binding rather than advisory. Suppliers that cannot hold specification tolerance lose the position, and roughly 3 week promotional cycles set the durability requirement precisely. A display outside tolerance loses the position whatever the brand paid for it.
Market Impact: India compounding at 8.6% annually

Market Opportunities and Growth Drivers

Finite Retail Floor Space Sustains Brand Willingness to Pay

Store floor area does not grow while the number of brands wanting a secondary position does, and that scarcity holds display pricing well above what board and print would justify. A pallet display occupies roughly one square metre of the highest-traffic space in a store, and brands price their bid against incremental sales from that position rather than against packaging cost. This is why display converters earn margins that shipping case work never delivers, and why the category resists commoditisation. Board and print together account for around 61% of converter cost, well below what the placement itself commands.
Market Impact: Freight at 19% of cost

Modern Retail Formats Expand Across Asia and Latin America

Pallet displays require a store format with aisle width, floor loading and a receiving process that can handle a pallet at all, which traditional trade outlets do not have. Hypermarket, supermarket and cash-and-carry expansion across India, Southeast Asia, Mexico and Brazil is adding those formats steadily, and each new store becomes addressable display space that did not previously exist. India compounds at 8.6%, the fastest national market, from a base small enough that store additions dominate the growth arithmetic entirely. Local converting capacity is building alongside, since freight rules out imported assembled units.
Market Impact: Half pallets cutting footprint 50%

Market Restraints and Challenges

Assembled Displays Ship Air and Cap Supplier Reach

A fully assembled pre-packed display is mostly empty volume in a trailer, and freight runs around 19% of delivered cost against a small fraction of that for flat-shipped units. The root cause is geometric rather than commercial: a built display cannot be compressed. Commercially it caps the radius a converter can serve profitably and holds concentration at 46% in a category otherwise consolidated. Suppliers mitigate with regional plant networks and with hybrid designs that ship semi-assembled and complete in three folds. Pre-packed work therefore stays close to where it is assembled.
Market Impact: Compliance rising from 63% baseline

Retailers Restrict Floor Displays on Flow and Safety

Several grocery formats have trialled reduced floor display programmes, citing shopper flow, accessibility compliance and trip hazards in aisles. The root cause is that display density grew faster than store layout planning did, and the result in some stores is genuinely obstructive. Suppliers mitigate with half and quarter pallet formats occupying less footprint, with lower profile designs preserving sightlines, and by supporting retailer-defined placement zones rather than treating any open floor as available. Half pallet formats cut occupied floor area by 50% and grow at 7.4%, ahead of the market, largely on placements that would otherwise be refused outright.
Market Impact: Cycles fixed at 3 week durations
4 additional market trends, 3 additional growth drivers, and 2 additional restraints and challenges are covered in the full report. Contact sales@marketmindsadvisory.com to access the complete intelligence.

Segment CAGR and Growth Architecture

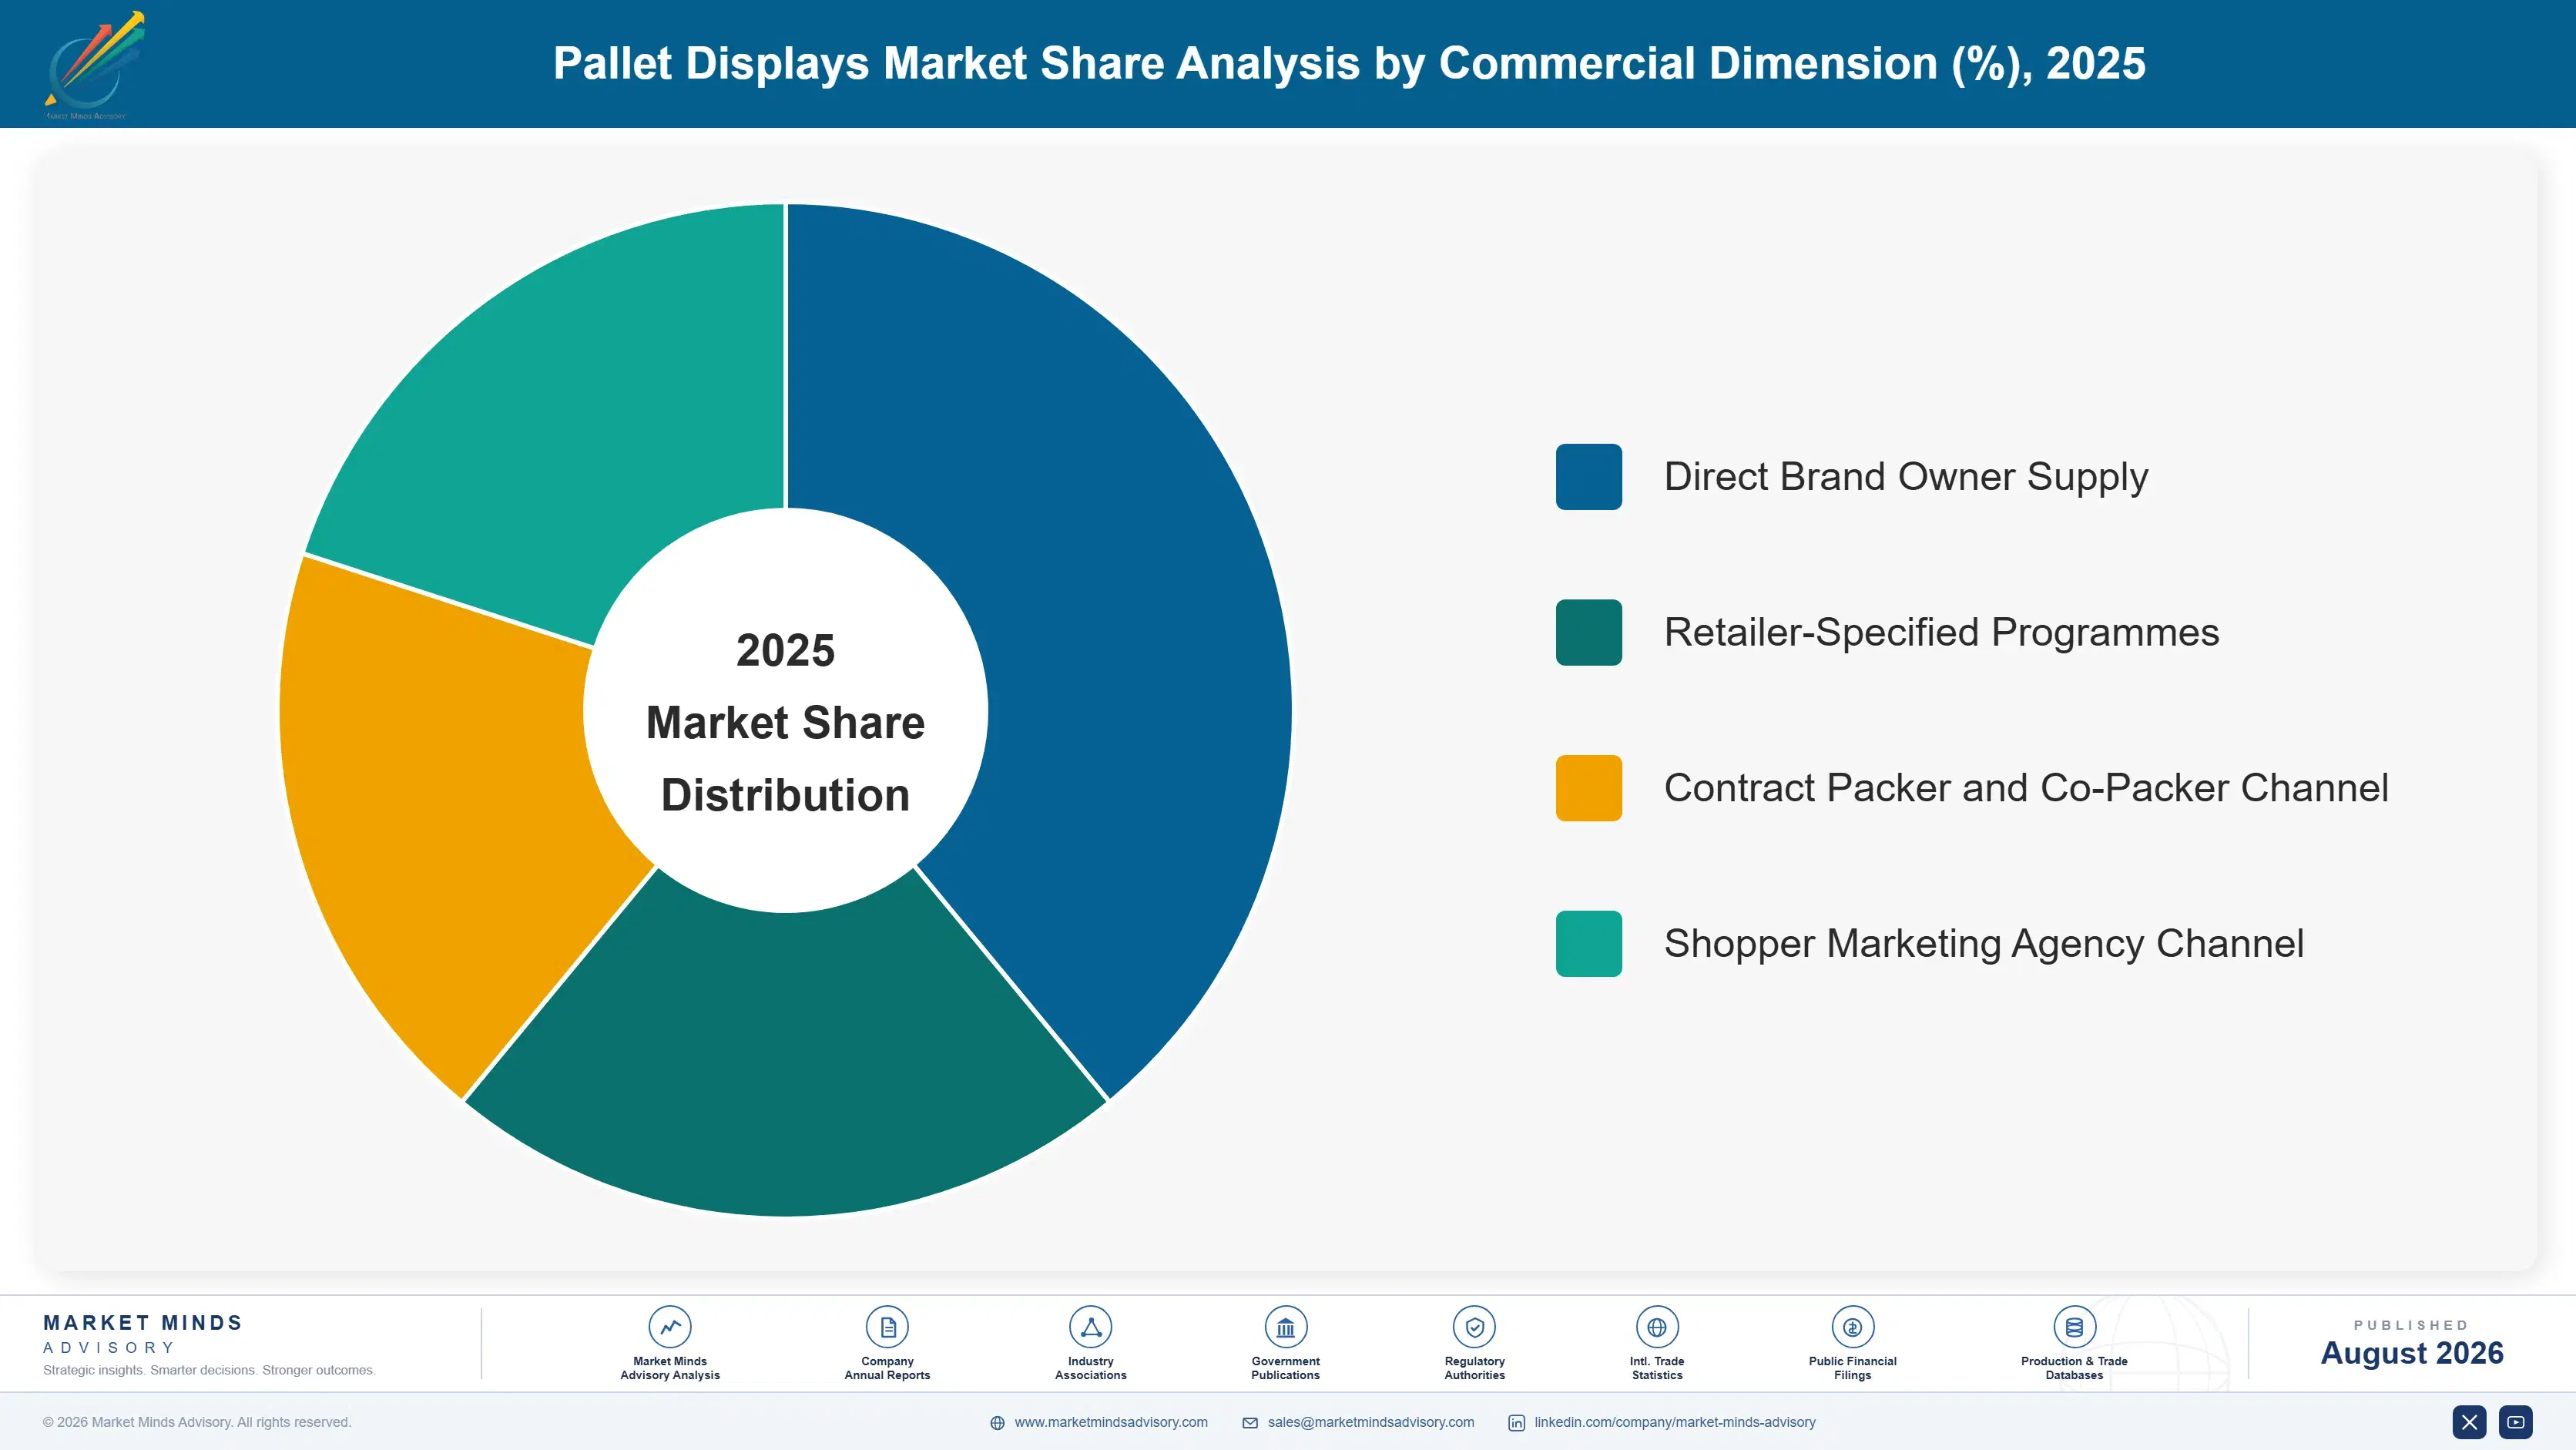
Segmentation follows display construction and delivery format, because that single dimension determines freight cost, store labour requirement and setup compliance together. A brand choosing between a knock-down unit and a pre-packed one is trading freight against the probability that the display appears on a shop floor at all. Six formats sit in the hierarchy, separated by how the unit arrives.
pallet-displays-market-market-share-analysis-1787308620655

Fully Assembled Pre-Packed Displays

Pre-packed displays compound at 8.85%, exactly 1.50 times the market, on store labour rather than on anything to do with packaging. The unit arrives built and filled, needs roughly four minutes to position and open, and therefore actually appears on the shop floor where a knock-down unit frequently does not. With industry setup compliance near 63%, the gap between displays paid for and displays merchandised is the largest recoverable loss in most brands' promotional spend. The constraint is freight: an assembled unit ships air, transport runs near 19% of delivered cost, and the economically servable radius from a converting plant shrinks accordingly. That constraint is why regional plant networks matter more here than scale does.
CAGR 8.8%

Half and Quarter Pallet Displays

Half and quarter pallet formats grow at 7.4% because they fit where a full pallet no longer can. Retailers restricting floor displays on shopper flow and accessibility grounds will usually still accept a reduced footprint in a defined placement zone, which keeps the brand present rather than removed. The smaller unit also suits products where a full pallet quantity would not sell through inside a three week promotional cycle, which covers most premium and low-velocity lines. Handling is easier for store staff and the unit can sit in aisle positions a full pallet would obstruct. Cost per unit of product merchandised is higher, and brands accept that in exchange for placement they would otherwise lose.
CAGR 7.4%
Full segment breakdown across 6 segments available in the complete report.

Regional Architecture and Country Demand Map

Demand tracks modern retail floor area rather than population or consumption, since a pallet display needs a store format that can receive and site one. Freight economics then keep supply regional, so converting capacity follows the same map closely. East Asia leads on modern retail floor area.

East Asia

East Asia takes 29% of global demand, the largest regional share, and grows at 6.9%. Chinese hypermarket and supermarket floor area is the single largest addressable base anywhere, and domestic corrugated converting capacity sits close enough to it that the freight constraint on assembled displays barely binds. Japanese retail is the most demanding on dimensional specification and presentation quality, with narrow aisles making half and quarter pallet formats disproportionately important. Korean mass retail runs intensive promotional calendars with short cycles. Regional growth reflects both new store formats and rising display density inside existing ones, which is a different mechanism from the mature markets. Domestic converters hold most of the volume across all three major national markets.
Share: 29% | CAGR: 6.9% (2026 to 2036)

North America

Twenty-six percent of demand sits in North America, growing at 5.6%. Club store and mass merchant formats built their merchandising around pallet quantities long before other regions did, and the installed practice runs deep enough that display programmes are planned at the annual calendar level rather than promotion by promotion. Retailer rate cards for floor positions are more formalised here than anywhere else, which makes dimensional compliance binding and rewards converters who hold tolerance. Pre-packed adoption is furthest advanced, driven by store labour scarcity that has persisted well beyond the pandemic period rather than easing as expected. Club store pallet quantities remain the deepest single application anywhere, and the formats built around them have changed little in two decades.
Share: 26% | CAGR: 5.6% (2026 to 2036)
Regional intelligence for 5 additional markets available in the complete report: Western Europe, South Asia and Pacific, Latin America, Middle East and Africa, Eastern Europe. Contact sales@marketmindsadvisory.com.
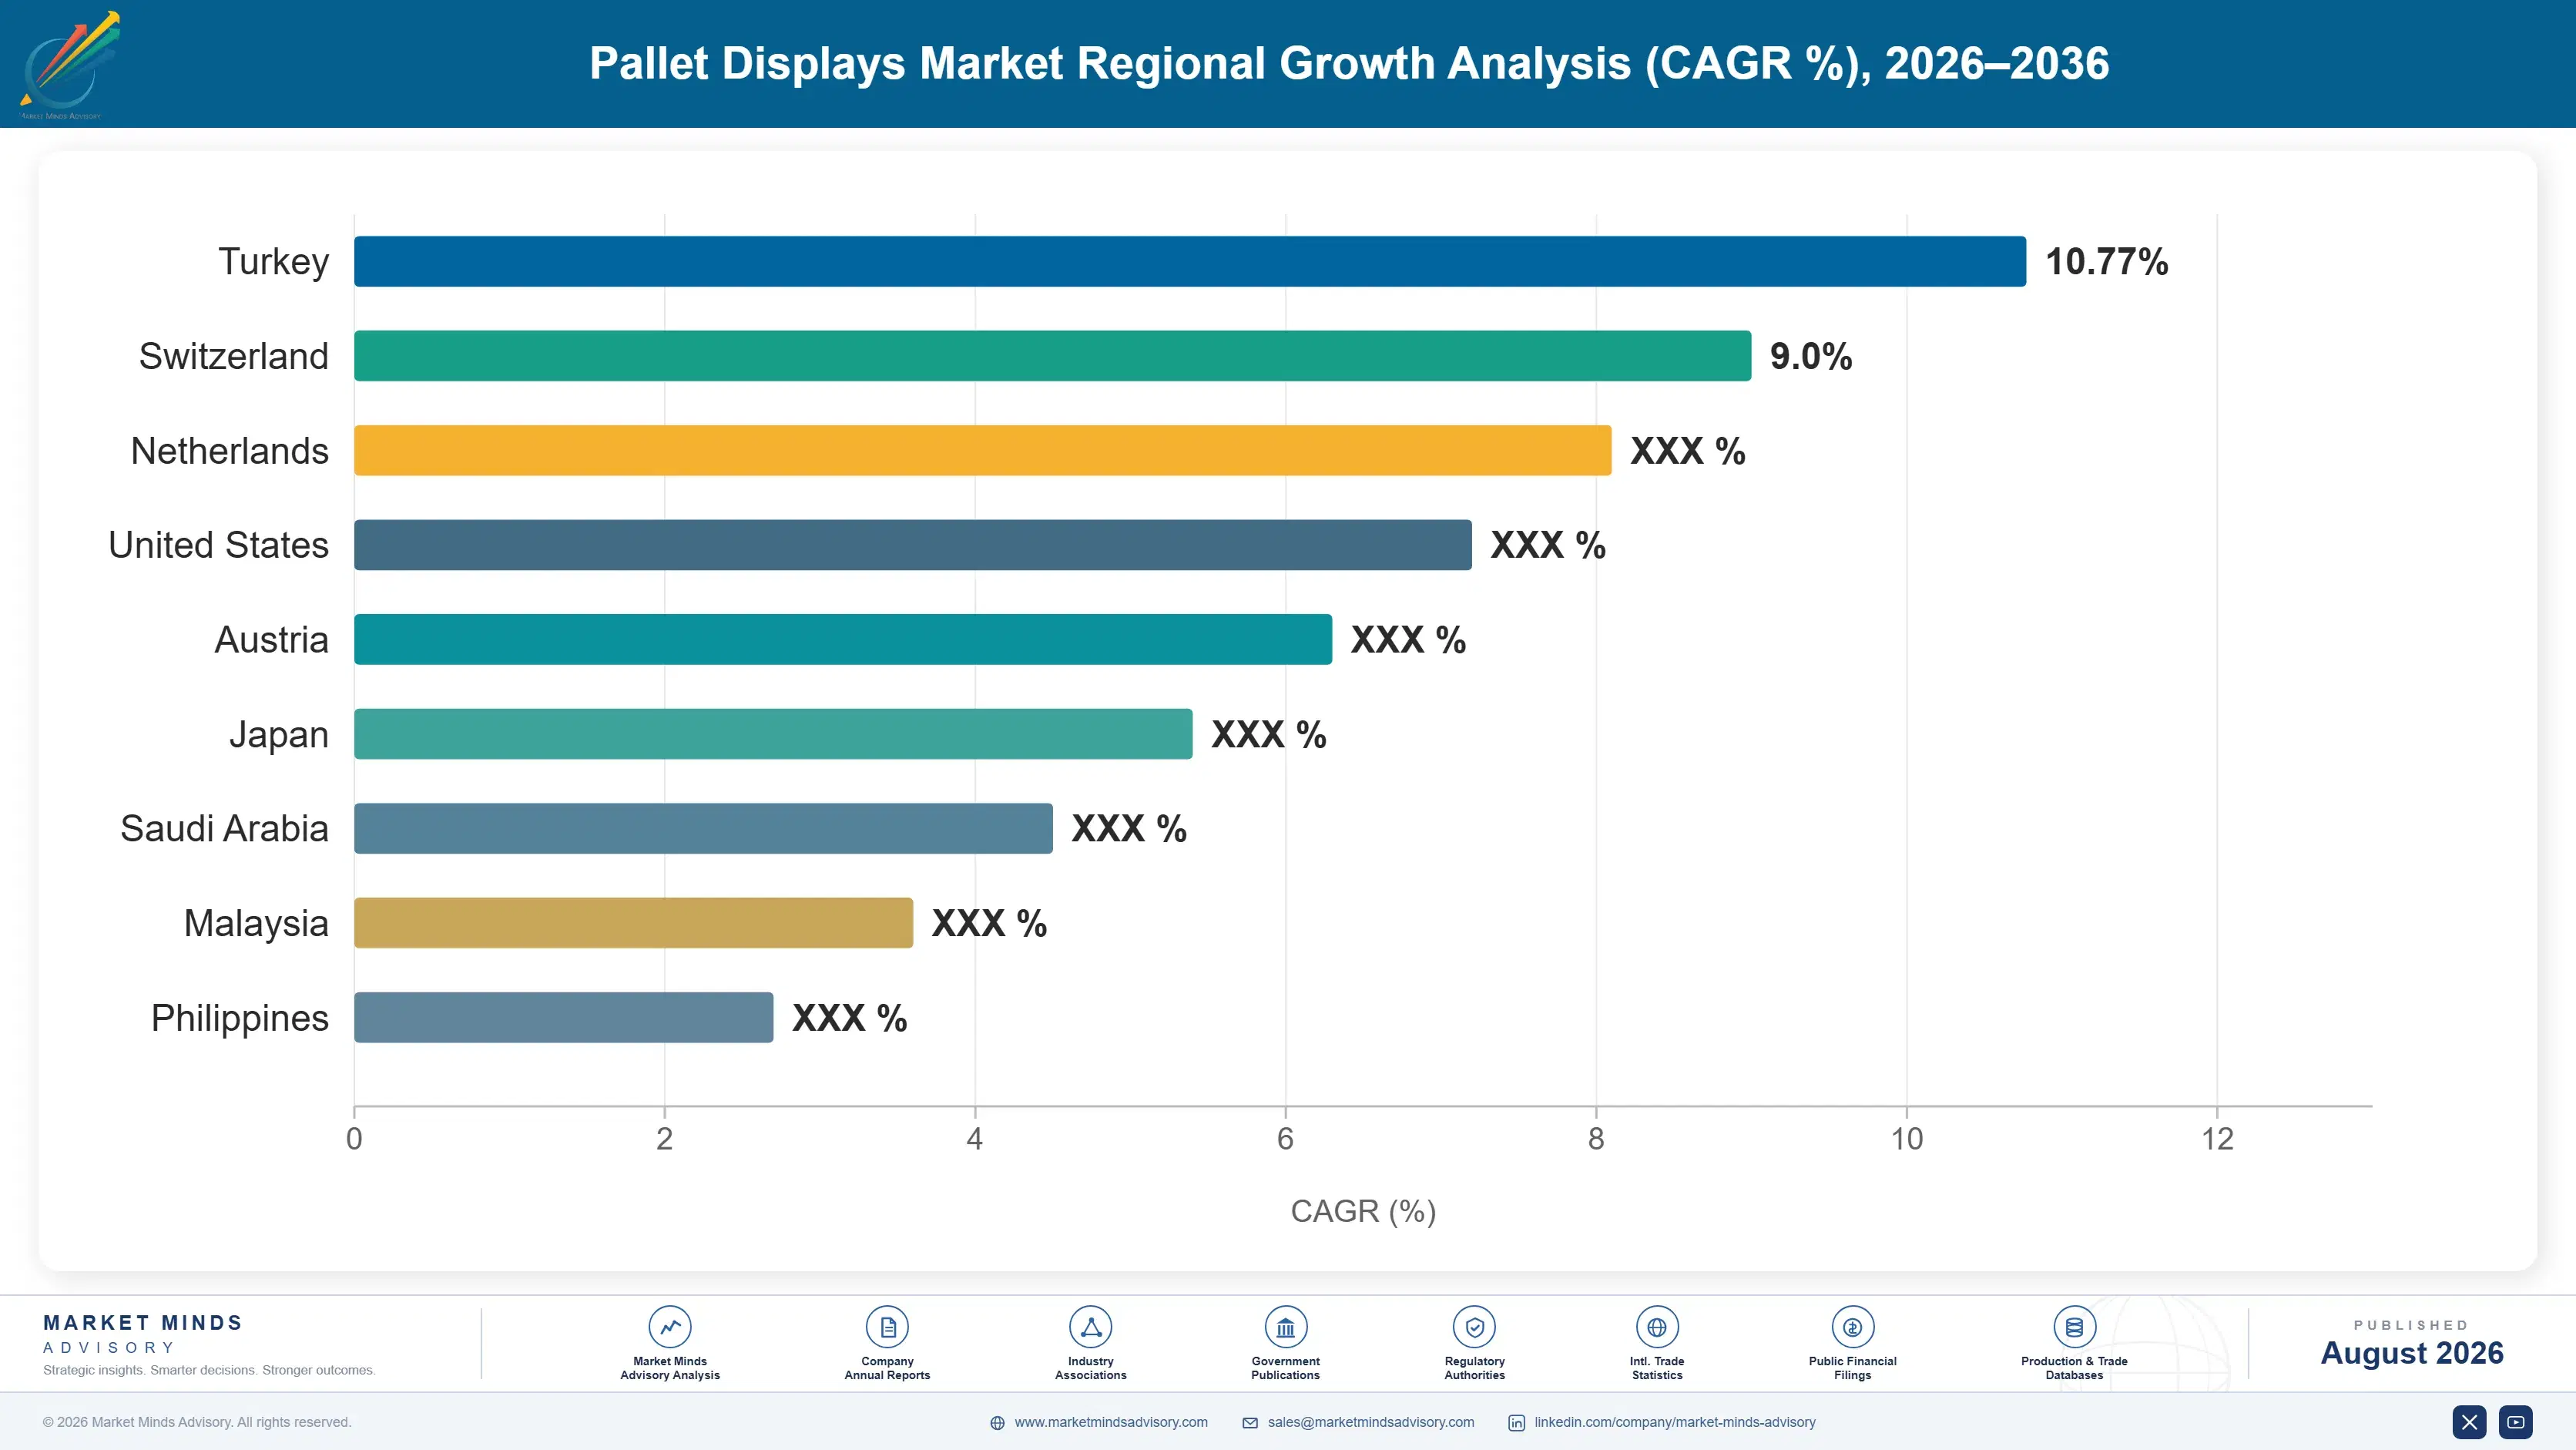
pallet-displays-market-country-cagr-analysis-1787308621164

Selling Compliance Rather Than Corrugated Board

Display converters compete on price per unit against brands who do not know how many of their displays were ever erected. Every position worth holding here starts from that measurement gap. Four positions qualify here, three of them commercial rather than manufacturing, and none turns on the price per unit that most brands still compare.

Audit Store Setup Compliance and Price Against It

Industry setup compliance runs near 63%, and most brands have never measured their own. A converter that sends auditors into stores during promotion week one and reports actual erected counts changes the conversation from unit price to delivered placements. Pre-packed units at roughly four minutes of store labour then justify their premium arithmetically rather than rhetorically. The audit itself costs little against a display programme and it is the single most effective way to move a brand off lowest-price knock-down purchasing. Erection rates above 90% are achievable on converted programmes.
Market Impact: Compliance measured against the 63%

Build Regional Assembly Capacity Near Retail Clusters

Freight runs near 19% of delivered cost on assembled displays because a built unit ships air, and that caps the radius a plant can serve. Converters placing assembly and filling capability close to retail distribution clusters capture pre-packed work that distant competitors cannot quote at all. This is the reason concentration sits at only 46% in a category the same corrugated groups otherwise consolidated, and it is a durable position because the constraint is geometric rather than something scale can overcome. Pre-packed work compounds at 8.85% and cannot be served remotely.
Market Impact: Freight held near 19% of total deli

Design Half and Quarter Formats for Restricted Stores

Retailers restricting floor displays on shopper flow and accessibility grounds will usually accept a reduced footprint in a defined placement zone. Half pallet formats cut occupied floor area by 50% and keep the brand present where a full pallet is refused outright. Converters holding design capability for those constraints keep programmes that competitors lose entirely when a retailer changes policy. Half and quarter formats grow at 7.4%, ahead of the market, and Western European retail already runs them at the highest share anywhere. Retail layout policy changes remove full pallet suppliers without notice.
Market Impact: Occupied footprint reduced 50% agai

Hold Retailer Dimensional Specification as a Qualification

Retailer rate cards define floor position dimensions, durations and compliance requirements precisely, and a display outside tolerance loses the position regardless of what the brand paid. Converters tracking specification changes across major retail accounts become the safe choice for brands who cannot risk a refused placement. Three week promotional cycles leave no time to remake a rejected display. This qualifies a supplier before any price discussion begins. Three week cycles leave no window to remake a rejected unit, and half of major grocery rate cards now specify tolerance to within 20 millimetres.
Market Impact: Cycles allowing only 3 weeks for an

Who Controls the Margin Pool

Five converters hold 46% measured on display converting revenue, the basis applied throughout this section. That is low for a corrugated category, and freight explains it: an assembled display ships air, so the servable radius from a plant is short and regional suppliers hold positions that scale cannot dislodge. Smurfit Westrock and International Paper lead on network breadth rather than on any product advantage.
Competition runs on three dimensions. Assembly and filling capacity near retail clusters decides who can quote pre-packed work at all. Structural design capability decides who can hold retailer dimensional tolerance and who loses positions to a refused placement. And speed of turnaround decides participation in short-cycle promotional work where three weeks is the whole window. The gap between leaders and the challenger group is narrow on print and wide on filling capability.

Two pressures are moving position. Pre-packed growth at 8.85% rewards converters with filling capability and penalises those set up only to print and die-cut. Meanwhile retailer floor restrictions favour suppliers with design depth in reduced-footprint formats. Rankings will shift toward whoever pairs regional assembly capacity with genuine structural design rather than print capability alone. Board integration protects margin but does not win the work.
pallet-displays-market-company-positioning-matrix-1787308621709

Competitive Moat and Risk Dimensions

SMURFIT WESTROCK

Moat: Regional plant network density

Assembled displays cannot travel far economically, and Smurfit Westrock operates converting and assembly capacity close enough to most major retail clusters across North America and Europe that it can quote pre-packed work distant competitors cannot price at all. That network is expensive to replicate and it directly addresses the constraint holding this category regional.
SMURFIT WESTROCK

Risk: Design depth against specialists

Structural design for retailer dimensional tolerance and for reduced-footprint formats is a specialist discipline, and independent display houses frequently hold deeper capability than a large integrated group whose design resource is spread across every corrugated application. When a retailer changes floor specification, design responsiveness decides who keeps the programme.
INTERNATIONAL PAPER

Moat: Integrated board supply position

Board runs near 44% of display converting cost, and International Paper's containerboard position gives it supply security and cost visibility through cycles where independent converters are exposed to open-market pricing. In a category where promotional programmes are committed months ahead at fixed prices, that input stability protects margin others must hedge or absorb.
INTERNATIONAL PAPER

Risk: Assembly and filling capability

Pre-packed displays compound at 8.85% and require filling capability alongside converting, which is contract packing rather than board conversion. Groups built around containerboard integration have to add an operating discipline they do not naturally hold, and specialist display and contract packing houses already run it as their core business.

Players Tracked

Prominent Players

Smurfit Westrock
International Paper
DS Smith
Mondi
Menasha Packaging

Other Key Players

Georgia-Pacific
Packaging Corporation of America
Green Bay Packaging
Pratt Industries
Cascades
Rengo
Oji Holdings
Nine Dragons Paper
Klingele Paper and Packaging
Hinojosa Packaging Group
Saica Group
VPK Group
Great Little Box Company
Marketing Alliance Group
Chesapeake Merchandising

Recent Developments

MARCH 2025

Grocery retailers publish floor position rate cards with compliance terms

Large grocery and mass retailers extended published rate cards to secondary floor positions, defining dimensions, durations and placement zones. These were retailer commercial policy decisions rather than supplier transactions, and they make dimensional compliance a qualification requirement. Brands now budget display spend against a published rate rather than negotiating it.
Signal: Published dimensions turn structural desig
JULY 2025

Store labour scarcity accelerates pre-packed display adoption

Persistent retail staffing shortages across North American and European grocery pushed brands toward fully assembled pre-packed displays, since knock-down units increasingly went unbuilt. This reflects retail labour conditions rather than any corporate development among converters. Knock-down units sat unbuilt in stockrooms through the promotional window.
Signal: Store labour scarcity converts a packaging
NOVEMBER 2025

Accessibility rules restrict full pallet placement in aisle positions

Accessibility and shopper flow requirements in several Western European grocery formats restricted full pallet displays from aisle positions, pushing programmes toward half and quarter footprints. These were regulatory and retailer layout responses rather than commercial developments in the supply base. Brands moved programmes rather than lose the placements.
Signal: A footprint restriction removes suppliers

Board, Print and Trailer Space

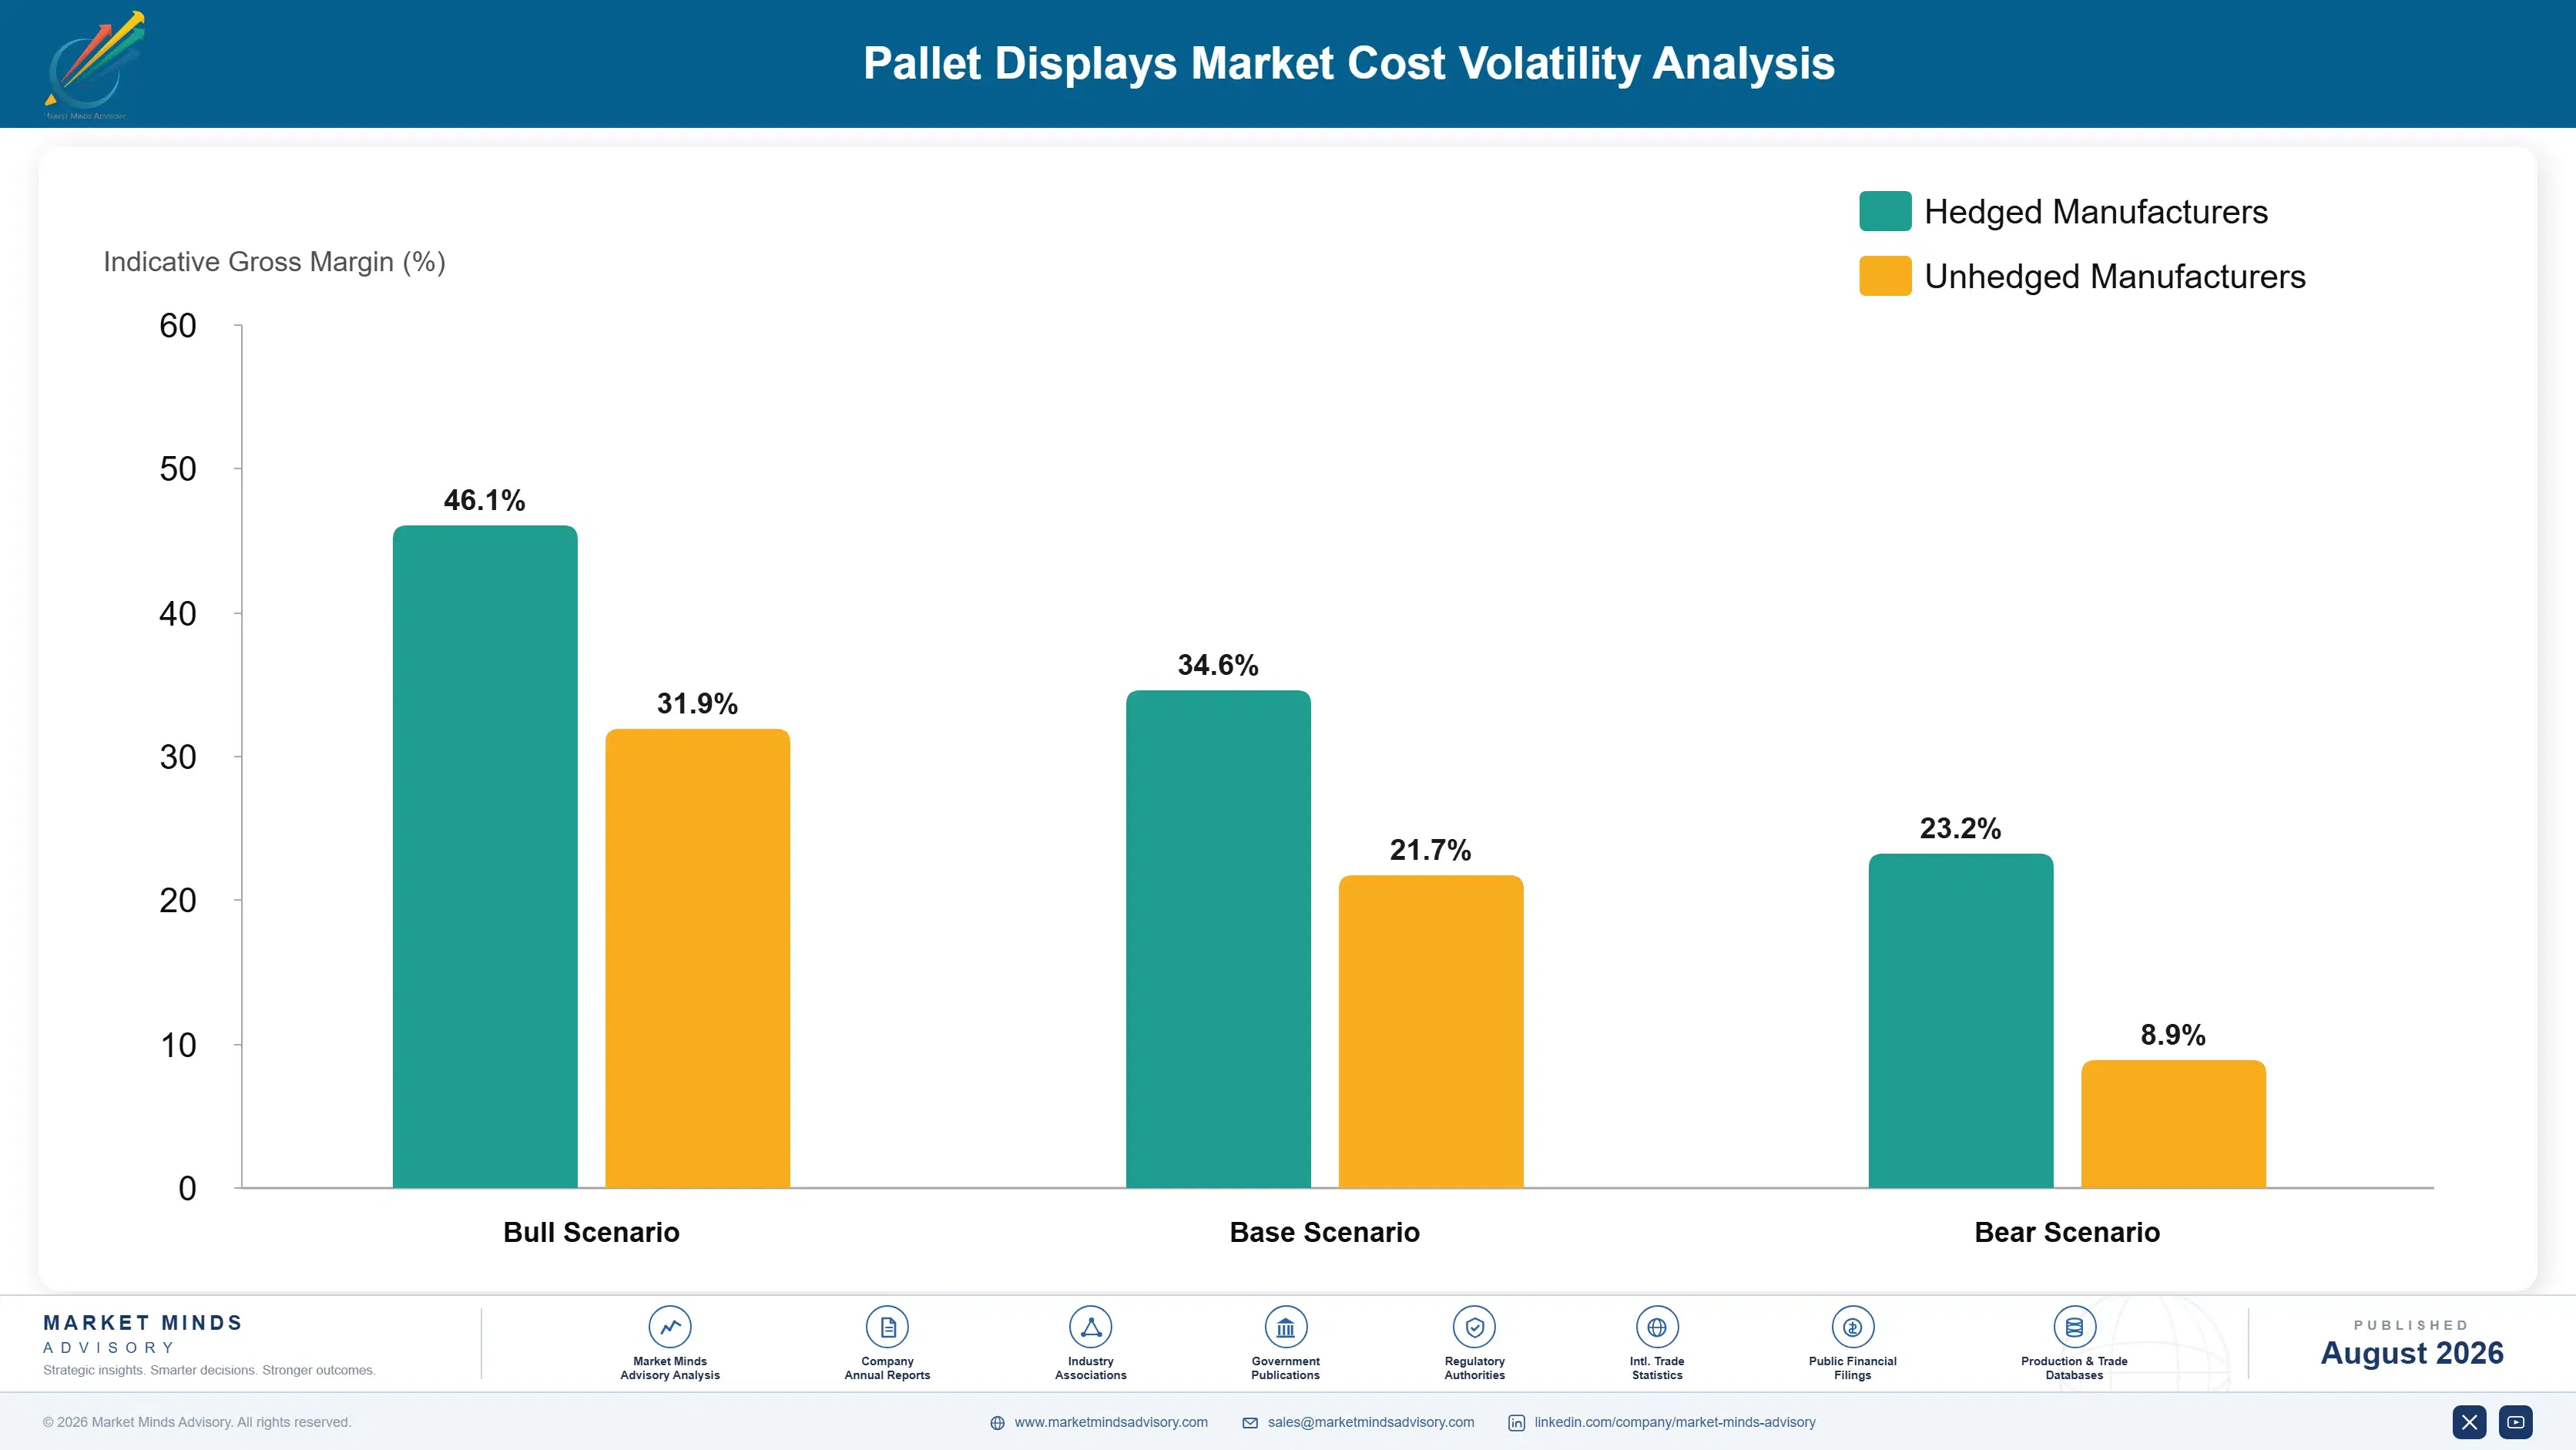
Corrugated board runs about 44% of converting cost of goods, sourced from regional containerboard mills and exposed directly to recovered fibre pricing. Print, inks and finishing add a further 17%, with litho-laminated graphics carrying substantially more than flexo direct print. Assembly labour and filling operations for pre-packed units account for most of the remainder, and freight sits outside cost of goods at roughly 19% of delivered value.
Recovered fibre and containerboard prices moved sharply through 2021 and 2022, and display converters carried the exposure badly because promotional programmes are committed months ahead at fixed prices. Company annual reports across the corrugated packaging groups disclose the resulting margin compression in converting segments. Energy costs documented in International Energy Agency reporting compounded the effect for European converters running corrugators and litho presses. Independent converters carried the worst of it.

Exposure divides by integration and by format mix. Integrated groups holding containerboard supply see input cost early and can price accordingly. Independent converters buy on open market and absorb the lag against committed programme pricing. Pre-packed specialists carry less board exposure proportionally but more labour and freight, which moves with wage rates and diesel rather than with fibre.
pallet-displays-market-cost-volatility-analysis-1787308621921

Index programme pricing to published containerboard movement

Promotional display programmes committed months ahead at fixed prices are where board volatility does its damage. Indexing quoted prices to a published containerboard reference, with a defined lag and cap, moves the exposure to the party that can actually hedge it. Brands resist the mechanism initially and accept it once a volatile cycle has cost them supplier failures.

Match print method to promotional cycle length honestly

Litho-laminated graphics cost considerably more than flexo direct print and look better on a display nobody photographs. For a three week promotional cycle in a grocery aisle, high-graphics finishing frequently exceeds what the placement justifies. Specifying print method against cycle length and position value, rather than defaulting to litho, recovers margin without any visible loss.

Site assembly capacity against retail distribution clusters

Freight at 19% of delivered cost on assembled displays is the largest controllable line outside board itself, and it is decided entirely by plant location rather than by negotiation. Placing assembly and filling capability inside the servable radius of major retail distribution centres converts a cost disadvantage into a competitive position that distant converters cannot quote against.

Portfolio Architecture for Margin Defence

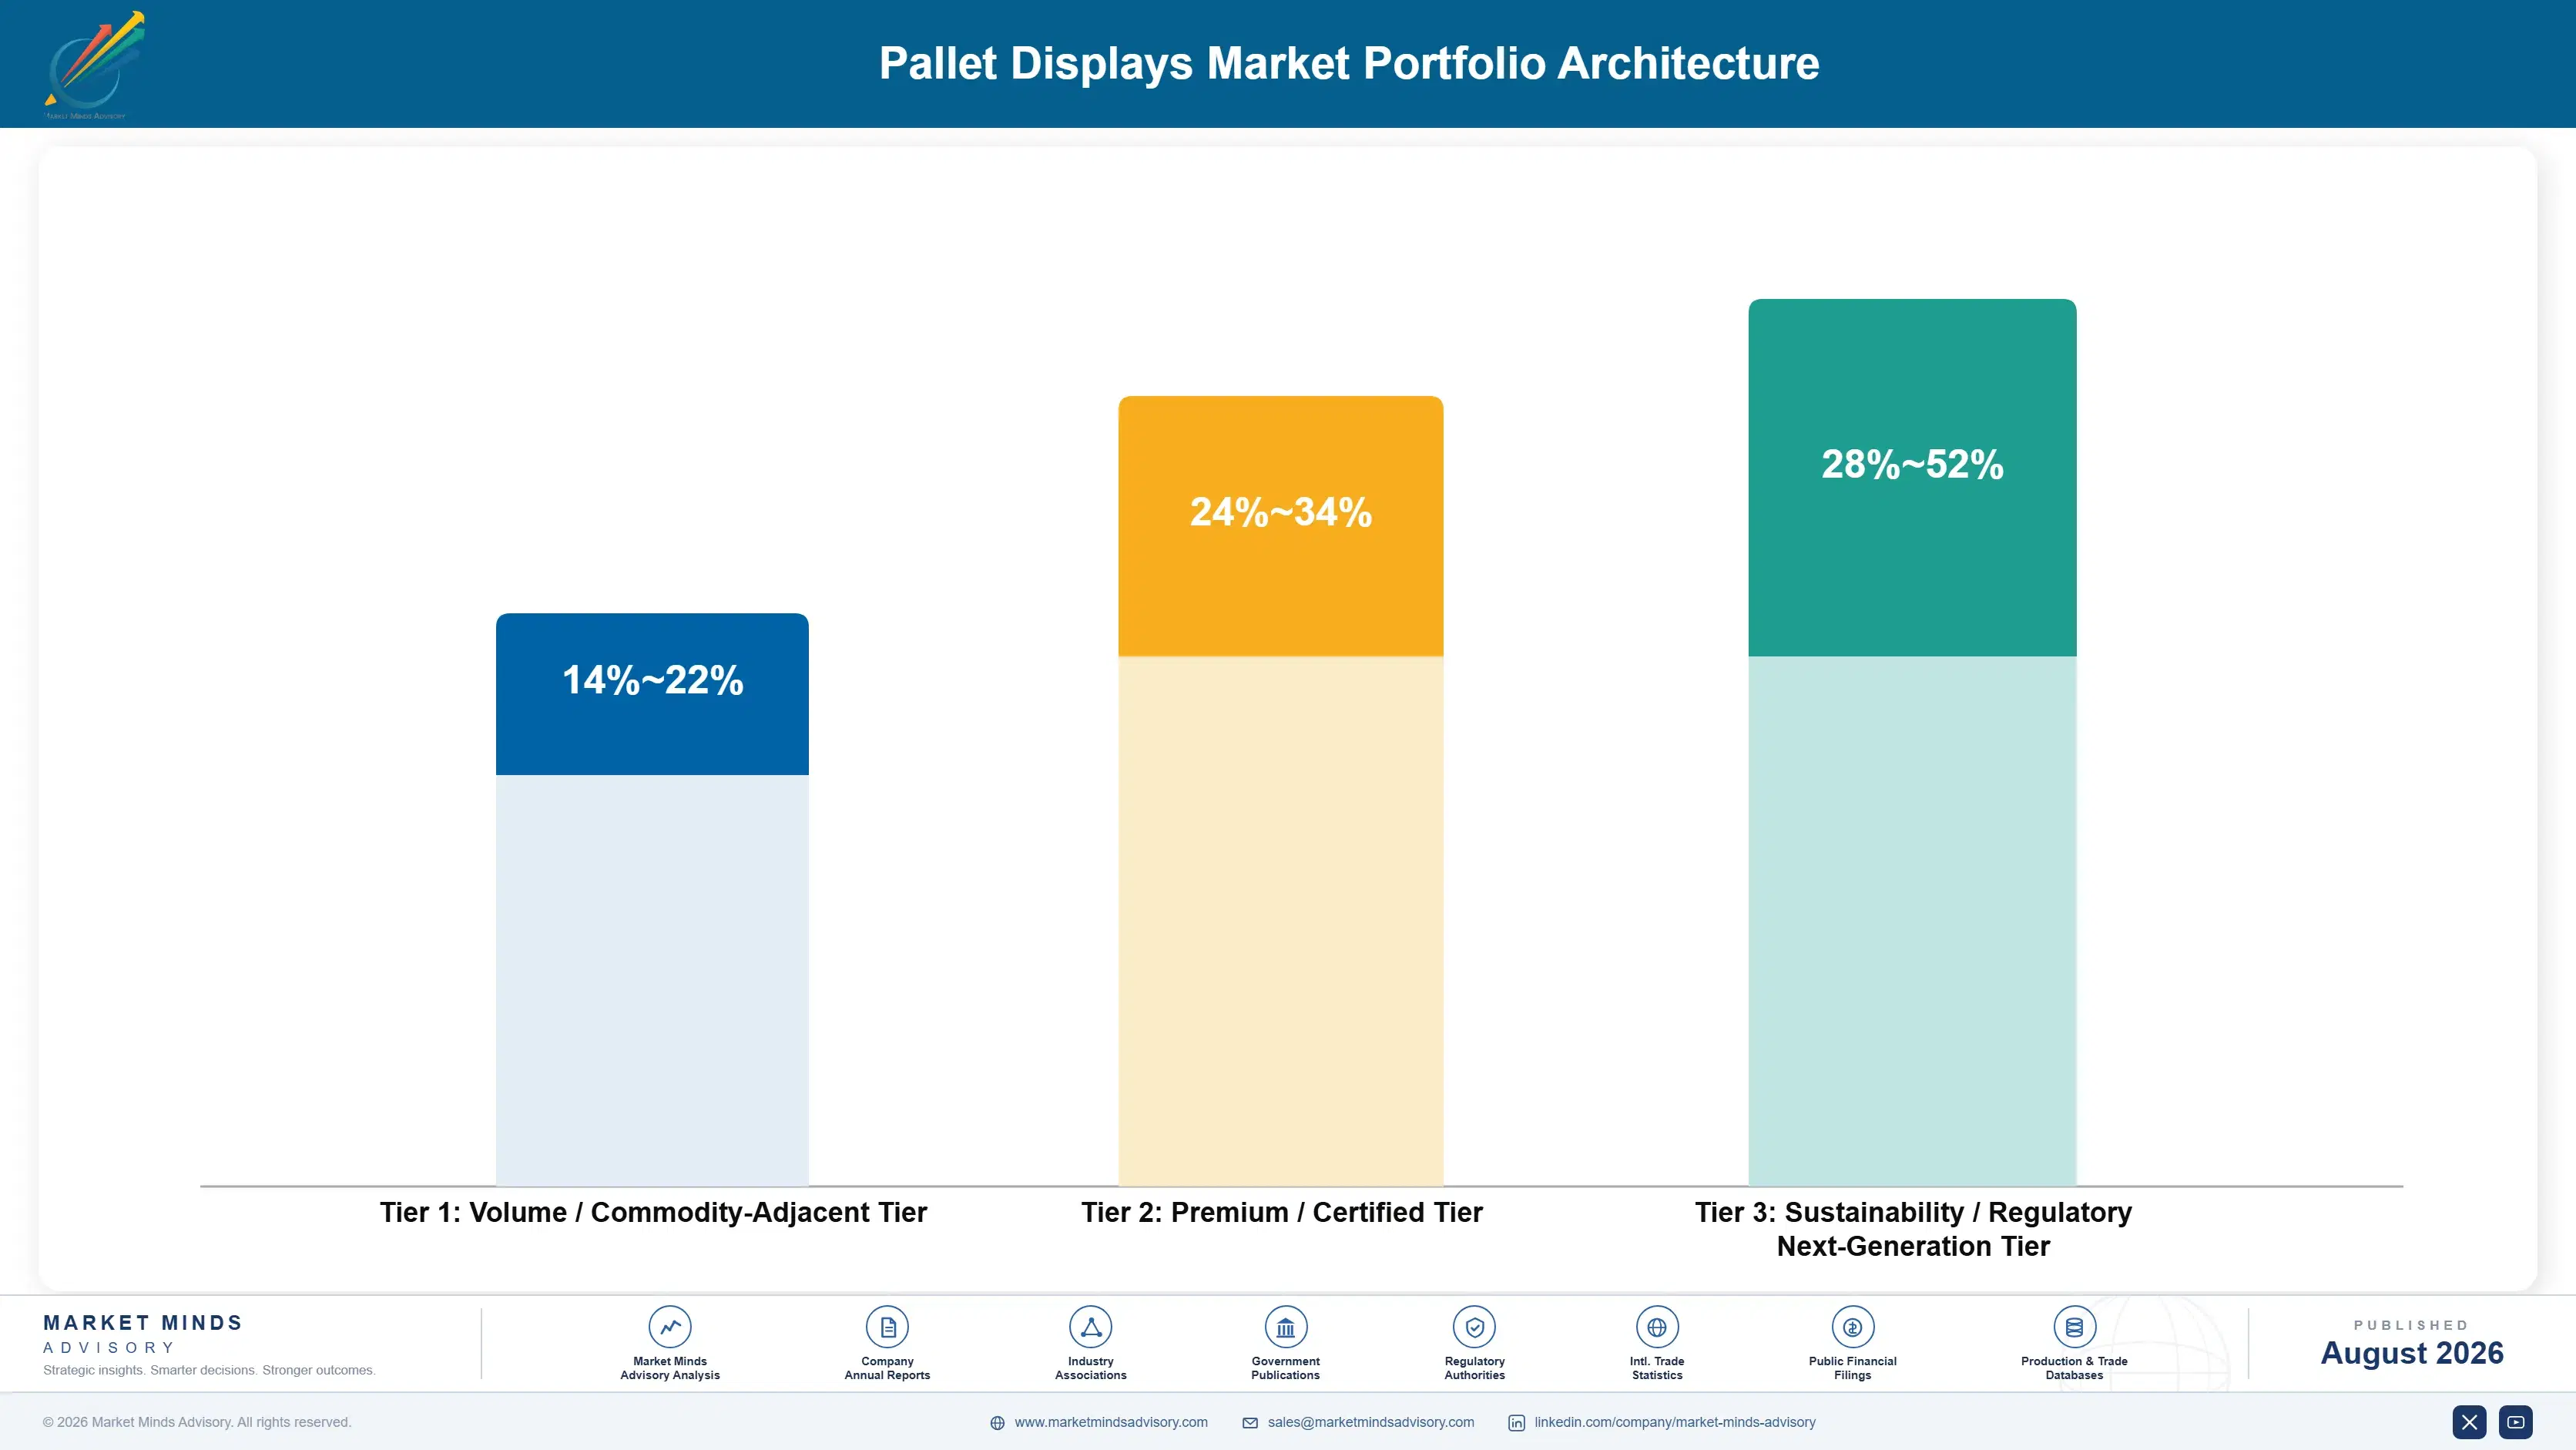
The portfolio separates on how much of the retailer's and the brand's problem the converter absorbs. Flat-shipped knock-down displays are printed corrugated sold on price per unit, and any competent converter supplies them. Half and quarter formats add design work against retailer restrictions. Pre-packed units add assembly, filling and the compliance argument. Modular reusable systems add engineering and a longer commercial relationship.
The tension is between volume and freight. Knock-down work moves in high volume at thin margin and travels anywhere. Pre-packed work carries far better margin and cannot travel, which caps how much of it any single plant can serve. Converters chasing pre-packed growth must build regional capacity rather than scaling a central operation, and that is a slower and more capital-hungry path than the growth rate suggests.

High-value pools concentrate where execution risk is highest. Pre-packed displays, reduced-footprint designs for restricted stores, and specification-critical work for retailers running published rate cards all qualify, and none is decided on price per unit. What they share is that a display refused, unbuilt or outside tolerance costs the brand a whole promotional window rather than one delivery.

Volume / Commodity-Adjacent Tier

Flat-shipped knock-down full pallet displays sold on price per unit with flexo direct print. High volume, long servable radius, and store assembly left entirely to retail labour that frequently does not perform it.
Gross Margin: 14-22%

Premium / Certified Tier

Half and quarter pallet formats and specification-critical work designed to published retailer rate card dimensions. Structural design capability and tolerance discipline qualify the supplier before price is discussed at all.
Gross Margin: 24-34%

Sustainability / Regulatory / Next-Generation Tier

Fully assembled pre-packed displays and modular reusable systems. The wide margin range reflects the gap between converters with established filling operations and those pricing assembly work they are still learning to run.
Gross Margin: 28-52%
pallet-displays-market-portfolio-architecture-1787308622470

High-value Sub-segments and Strategic Watch-out

Fully Assembled Pre-Packed Displays

Compounding at 8.85% on setup compliance rather than packaging performance, since roughly four minutes of store labour replaces an assembly job frequently never done. Freight at 19% of delivered cost is the only thing limiting how fast it spreads. Regional assembly capacity is the binding constraint on supply.
Gross Margin: 30-52%

Half and Quarter Pallet Formats

Growing at 7.4% as retailers restrict full pallet placement on shopper flow and accessibility grounds. Cutting occupied floor area by half keeps a brand present where the full format is refused, and Western Europe already runs the highest share. Design capability rather than converting capacity decides participation.
Gross Margin: 24-34%

Flat-Shipped Knock-Down Displays

The volume core at 3.9%, sold on price per unit and travelling anywhere freight can reach. Setup compliance near 63% is its permanent weakness, and it holds position mainly where display quantities are large and budgets tight. Any competent corrugated converter can supply it, which keeps margins thin.
Gross Margin: 14-22%

Modular Reusable Display Systems

The strategic watch-out. Reusable frames with replaceable graphics cut material use substantially but require retailer cooperation on retrieval that few grocery formats will commit to, which has stalled the concept repeatedly across two decades. Retrieval logistics rather than material performance keeps defeating the concept in practice.
Gross Margin: 26-46%

Promotional Calendars Buy Every Year

Recurring revenue comes from the promotional calendar rather than from any contract. A brand running twelve display programmes a year buys twelve times, and the converter holding last year's programme starts each new brief with the artwork, structural files and retailer specifications already in hand. That accumulated file position is worth more than any pricing advantage, because a three week cycle leaves no room to onboard a supplier who has to start from a blank sheet.
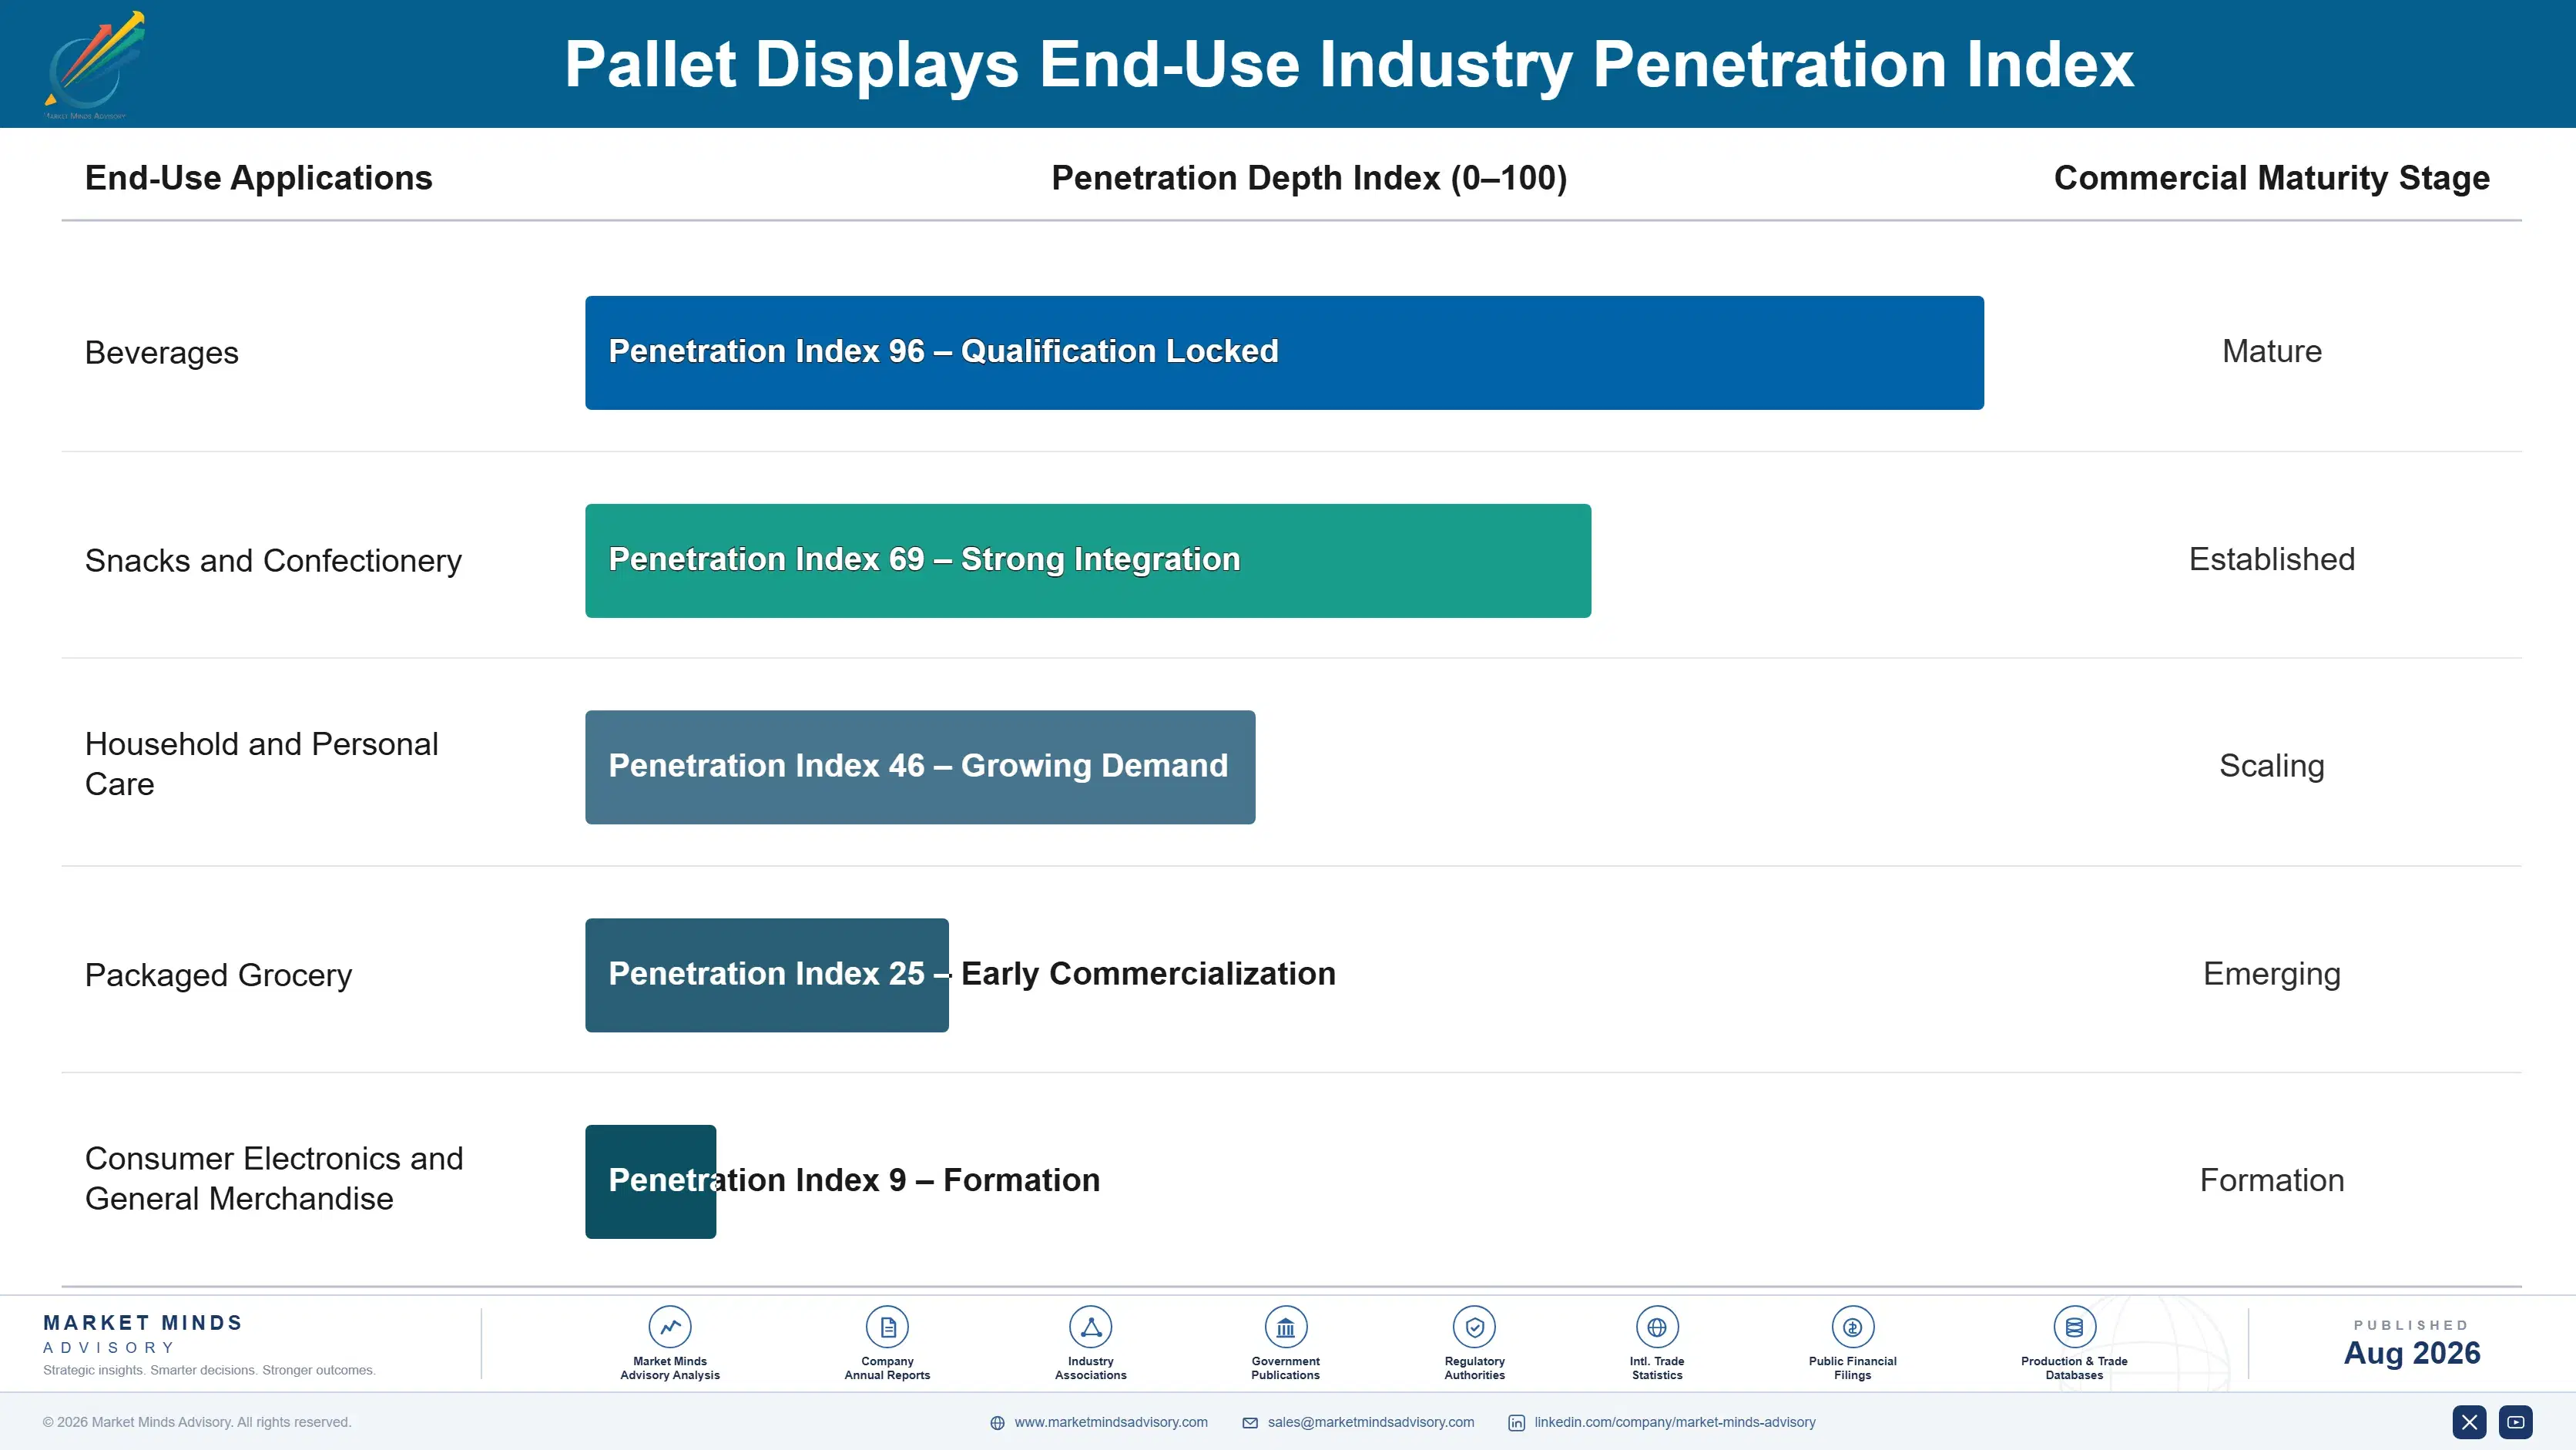
Depth varies sharply by category. Beverages, snacks and confectionery buy deepest, running near-continuous display programmes with high volumes and short cycles. Household and personal care buy steadily around seasonal peaks. Packaged grocery buys episodically against promotions. Premium and low-velocity categories buy half and quarter formats infrequently, since a full pallet quantity would not clear inside the cycle.

The buyer has changed. Display was specified by a brand's packaging function against cost, and it is increasingly specified by shopper marketing against retail placement value and compliance. That group cares about erected counts rather than unit price, which is a considerably better conversation for a converter who can measure them. Shopper marketing budgets are also larger.
pallet-displays-market-end-use-penetration-index-1787308622987

Where Display Converters Win

These are among the four positions where our research anticipates prominent divergence between winners and laggards over the coming forecast period. Each is grounded in the demand model, the regulatory perimeter, and the announced capacity pipeline.
01 / SETUP COMPLIANCE MEASUREMENT

The display paid for and the display erected are different populations

Industry setup compliance runs near 63%, and most brands have never audited their own programmes to find out. A converter that counts erected displays in stores during promotion week one moves the discussion from unit price to delivered placements, where pre-packed units justify their premium arithmetically. The audit costs little against programme spend, and it is the most reliable route out of lowest-price knock-down purchasing available to any supplier here, and it costs a fraction of what a single wasted promotional cycle does.
02 / REGIONAL ASSEMBLY SITING

Assembled displays ship air, so plant location decides the quote

Freight runs near 19% of delivered cost on pre-packed units because a built display cannot be compressed for transport. That geometric fact caps the servable radius from any plant and explains why concentration sits at only 46% in a category the corrugated groups otherwise consolidated. Converters siting assembly and filling capacity near retail distribution clusters win work that distant competitors cannot price at all, whatever their scale, because the constraint is geometric rather than something a larger balance sheet can overcome.
03 / FOOTPRINT DESIGN RANGE

A refused placement loses the whole programme, not one order

Retailers restricting floor displays on shopper flow and accessibility grounds will still accept reduced footprints in defined placement zones. Half pallet formats cut occupied area by 50% and keep a brand present where the full unit is refused outright, and those formats grow at 7.4% against a market at 5.9%. Converters designing only full pallets lose entire programmes when a retail account changes layout policy, with no route back inside the cycle, which makes design range a defensive asset rather than a design department indulgence.
04 / SPECIFICATION TOLERANCE DISCIPLINE

Rate card dimensions are a gate that price cannot pass

Published retailer rate cards define floor position dimensions, durations and placement zones precisely, and a display outside tolerance loses the position whatever the brand paid for it. Three week promotional cycles leave no time to remake a rejected unit, so brands select suppliers they trust to comply rather than suppliers who quote lowest. Tracking specification changes across major retail accounts qualifies a converter into programmes before any price discussion begins at all, and it is considerably cheaper to maintain than any manufacturing advantage.

Engagement Snapshot From the Field

A live engagement with an industry participant carrying material or product regulatory and market exposure ahead of a defining policy shift, showing how our research translates into a defensible multi-year portfolio strategy.
MARKET MINDS ADVISORY · CLIENT ENGAGEMENT SUMMARY
Pallet Displays Producer Strategic Portfolio Review and Transition Roadmap 2026·Investment Scenario on Pallet Displays Exposure Evaluation 2025-26
CLIENT PROFILE
A carbonated soft drink and energy drink producer running roughly 340 million dollars of annual trade promotional spend across grocery, mass and convenience channels (client-reported, unverified by MMA). Display programmes accounted for a substantial part of that, purchased as flat-shipped knock-down units on lowest delivered price across three converters with no execution measurement anywhere in the process.
STRATEGIC CHALLENGE
Promotional lift on display-supported weeks was consistently below the modelled forecast, and the shortfall was attributed variously to competitor activity, pricing and weather. Nobody had checked whether the displays were actually on shop floors. Procurement continued driving unit cost down each year, which quietly worsened the underlying problem. Each annual cost reduction removed assembly-friendly design features nobody was measuring.
MMA APPROACH
MMA audited 220 stores across four retail accounts during week one of three separate promotional cycles, recording whether the shipped display was erected, positioned as specified and correctly filled. Results were matched against shipment records and against actual scan sales for the same store weeks. Structural assembly step counts were compared across the three incumbent converters.
KEY FINDINGS
  1. Fifty-eight percent of shipped knock-down displays were erected during week one, and a further 11% appeared only in week two, by which point a third of the promotional window had already elapsed.
  2. Stores that erected the display in week one delivered promotional lift within 6% of the modelled forecast, which effectively eliminated competitor activity and pricing as explanations for the shortfall.
  3. Displays that were erected but positioned outside the specified zone performed close to shelf baseline, meaning correct placement mattered nearly as much as erection did.
  4. The lowest-cost converter of the three had the poorest erection rate, because its structural design required more assembly steps than the specification implied.
CLIENT PROFILE
A carbonated soft drink and energy drink producer running roughly 340 million dollars of annual trade promotional spend across grocery, mass and convenience channels (client-reported, unverified by MMA). Display programmes accounted for a substantial part of that, purchased as flat-shipped knock-down units on lowest delivered price across three converters with no execution measurement anywhere in the process.
STRATEGIC CHALLENGE
Promotional lift on display-supported weeks was consistently below the modelled forecast, and the shortfall was attributed variously to competitor activity, pricing and weather. Nobody had checked whether the displays were actually on shop floors. Procurement continued driving unit cost down each year, which quietly worsened the underlying problem. Each annual cost reduction removed assembly-friendly design features nobody was measuring.
MMA APPROACH
MMA audited 220 stores across four retail accounts during week one of three separate promotional cycles, recording whether the shipped display was erected, positioned as specified and correctly filled. Results were matched against shipment records and against actual scan sales for the same store weeks. Structural assembly step counts were compared across the three incumbent converters.
KEY FINDINGS
  1. Fifty-eight percent of shipped knock-down displays were erected during week one, and a further 11% appeared only in week two, by which point a third of the promotional window had already elapsed.
  2. Stores that erected the display in week one delivered promotional lift within 6% of the modelled forecast, which effectively eliminated competitor activity and pricing as explanations for the shortfall.
  3. Displays that were erected but positioned outside the specified zone performed close to shelf baseline, meaning correct placement mattered nearly as much as erection did.
  4. The lowest-cost converter of the three had the poorest erection rate, because its structural design required more assembly steps than the specification implied.
RECOMMENDED STRATEGY
Phase 1: Phase 1 (months 1 to 4): Convert the four highest-volume promotional cycles to fully assembled pre-packed displays and audit the erection rate again. Phase 2: Phase 2 (months 4 to 12): Rebuild converter selection criteria around measured erection performance rather than delivered unit price alone. Phase 3: Phase 3 (months 12 to 20): Extend audit coverage to all major accounts and negotiate placement zone compliance into retailer terms.
OUTCOME
Erection rates on converted cycles reached 91% in week one, and promotional lift on those cycles came within 4% of forecast (client-reported, unverified by MMA). Display unit cost rose by approximately 34%, and incremental promotional revenue exceeded that increase by a wide margin on every audited cycle (client-reported, unverified by MMA). Converter selection now weights measured execution ahead of price.

Frequently Asked Questions

Foundational context covering the market sizes, CAGR, scope, country, region and competition that inform every finding below. This section is provided to cover basics and most often pre-purchase conversations, answered from the MMA Primary Research Dataset.

What is the current size of the Pallet Displays Market?

The global market was worth USD 4.6 billion in 2025, reaching USD 4.87 billion in 2026. East Asia holds the largest regional share at 29% of demand.

How large will the Pallet Displays Market be by 2036?

MMA forecasts USD 8.24 billion by 2036, an expansion multiple of 1.69 times the 2026 base. That represents roughly USD 3.37 billion of incremental value.

What is the CAGR for the Pallet Displays Market 2026 to 2036?

The base case compounds at 5.9% annually, with a bull case of 7.1% and a bear case of 4.7%. Historical growth from 2020 to 2025 ran at 4.8%.

Which segment is growing fastest?

Fully assembled pre-packed displays compound at 8.85%, exactly 1.50 times the market rate. They remove the store assembly labour that decides whether a display appears at all.

Who are the major companies in the Pallet Displays Market?

Smurfit Westrock, International Paper, DS Smith, Mondi and Menasha Packaging hold a combined 46%. Freight economics keep that concentration low relative to other corrugated categories.

Which country is growing fastest?

India compounds at 8.6%, ahead of every other national market. Modern retail store additions convert traditional trade into addressable display space that did not previously exist.

Report Segmentation Architecture

The full report scope spans multiple orthogonal segmentation dimensions, with cross-tabulated demand data provided for each dimension pair. Coverage extends further to regional breakdowns, trend trajectories, and the competitive detail needed to support segment-level decision-making.

By Display Construction Format

  • Fully Assembled Pre-Packed Displays
  • Flat-Shipped Knock-Down Displays
  • Half and Quarter Pallet Displays
  • Full Pallet Displays
  • Modular and Reusable Display Systems
  • Hybrid Pallet and Shipper Units

By End-Use Industry

  • Beverages
  • Snacks and Confectionery
  • Household and Personal Care
  • Packaged Grocery
  • Consumer Electronics and General Merchandise

By Commercial Dimension

  • Direct Brand Owner Supply
  • Retailer-Specified Programmes
  • Contract Packer and Co-Packer Channel
  • Shopper Marketing Agency Channel

By Region

  • North America
  • Western Europe
  • East Asia
  • South Asia and Pacific
  • Latin America
  • Middle East and Africa
  • Eastern Europe

Scope, Methodology, and Coverage

Every figure in this report is reproducible from documented input assumptions. The scope below maps the historical period, the forecast horizon, the segmentation dimensions, and the countries covered, alongside the underlying primary and qualitative methodology.
Historical Period
2020 to 2025
Forecast Period
2026 to 2036
Base Year
2025 (USD billions; MMA Primary Research Dataset, August 2026)
Market Definition
The market covers retail-ready display units shipped on or as a pallet base, spanning full pallet displays, half and quarter pallet displays, fully assembled pre-packed displays, flat-shipped knock-down displays, modular and reusable display systems, and hybrid pallet and shipper units, together with the assembly and filling services supplied with pre-packed formats. Shelf-ready secondary packaging without a pallet base, permanent metal, wood or acrylic fixtures, pallets sold as transport equipment, and the merchandised products themselves are excluded. Sizing is measured at converter revenue in current prices.
Quantitative Units
USD billions (current prices); display units and occupied floor area in square metres where applicable
Segmentation Dimensions
By Display Construction Format; By End-Use Industry; By Commercial Dimension; By Region
Regions Covered
North America, Western Europe, East Asia, South Asia and Pacific, Latin America, Middle East and Africa, Eastern Europe
Countries Covered
USA, China, Germany, France, UK, Japan, South Korea, India, Australia, Canada, Brazil, Mexico, Indonesia, Vietnam, Thailand, Malaysia, UAE, Saudi Arabia, South Africa, Nigeria, Turkey, Poland, Netherlands, Italy, Spain, Sweden, Belgium, Argentina, Colombia, Philippines, and additional markets relevant to this sector
Key Companies Profiled
Smurfit Westrock, International Paper, DS Smith, Mondi, Menasha Packaging, Georgia-Pacific, Packaging Corporation of America, Green Bay Packaging, Pratt Industries, Cascades, Rengo, Oji Holdings, Nine Dragons Paper, Klingele Paper and Packaging, Hinojosa Packaging Group, Saica Group, VPK Group, Great Little Box Company, Marketing Alliance Group, Chesapeake Merchandising
Quantitative Methodology
Primary survey, n=3,800 respondents, Q4 2025, six countries; demand-side model with trade association cross-validation
Qualitative Methodology
47 expert interviews, Q4 2025; applied to validate demand model assumptions, identify emerging dynamics, and assess competitive positioning
Report Format
PDF and XLSX data workbook (Word format preview document)
Publisher
Market Minds Advisory
Report Code
MMA-2026-PAC-822
Published
August 2026
Contact
sales@marketmindsadvisory.com | www.marketmindsadvisory.com

Purchase the full Pallet Displays Market Report (2026 to 2036).

The full report sizes pallet displays across six construction formats, three commercial dimensions and seven regions, with annual forecasts to 2036 under base, bull and bear scenarios. Store setup compliance is measured by format and channel, which is the number that decides whether display spend delivers anything and which most brands have never audited. Retailer floor position rate cards and placement restrictions are tracked across major grocery and mass accounts. Freight economics are modelled by assembly format to establish servable radius from converting plants. Twenty converters are profiled on a consistent display converting revenue basis.
Store setup compliance measured by display format and channel
Retailer rate cards and placement restrictions tracked by account
Freight economics modelled by assembly format and radius
Promotional cycle length mapped against display durability requirements
Half and quarter format adoption assessed by retail restriction
Board and print cost structures compared across converter types

Built For The People Who Decide

From boardroom strategy to bench-side execution, this report is read cover-to-cover by leaders shaping the next decade of their industry, turning demand scenarios, market dynamics and valuation benchmarks into decisions.
CXOs/ Presidents/ VPs/ Managers
M&A and Corporate Development
Strategy Teams and R&D Heads
Procurement and Product Directors
Regulatory and Compliance Leaders
Investor Relations and Equity Analysts