Market Minds Advisory
Paint Cans Market

Paint Cans Market: Paint Cans Market: corrosion against recyclability, lining economics and the trade channel to 2036

Two technical facts are pulling this market's material choice in opposite directions at once, and the price comparison that everybody expects to decide it barely enters the argument at all.

Lead Analyst

Bilal Shaikh

Published

September 2026

Make Smarter Decisions with Customized Research Insights

Request a free sample report and evaluate market opportunities, growth trends, and competitive dynamics relevant to your business needs.

2025 MARKET VALUE$5.8BMarket Size 2025
2036 FORECAST VALUE$11.7BBase Case , 2026 to 2036
CAGR 2026 TO 20366.6 %Bull 7.8% / Bear 5.4%
INCREMENTAL OPPORTUNITY$5.5BNet 10- year value creation
EXPANSION MULTIPLE1.89x2036 value over 2026 base
Strategic Levers
M&A Pipeline
Regional Outlook
Country Rankings
Competitive Intelligence
Segmental Deep-dive
Call-Us : 91 93563 13602

Executive Snapshot and Market Trajectory.

Architectural paint moved to water-based formulation, now roughly 78% of the market, and water corrodes steel. That pushed volume toward plastic pails which do not rust, and the substitution had nothing to do with container cost at all. Engineering rather than economics drove that entire substitution.
The counter-argument arrived from the waste stream rather than from the factory. Steel is magnetically separable from mixed waste and around 92% of metal containers are recovered, against roughly 34% of plastic pails, which is now pulling material choice back the other way as packaging recovery obligations tighten across major markets. Recyclability is now doing to plastic what corrosion previously did to metal, and neither side controls the outcome.
Composite and hybrid containers grow at 9.9%, half again the market rate of 6.6%, attempting to hold steel's barrier and recovery advantages at lower weight. Interior lining represents about 21% of metal container cost and is what actually makes a paint can function at all. Lining reformulation away from bisphenol chemistry has been the significant technical event in metal packaging, driven by food cans and applied across everything. Price barely enters the argument at all.
Market Definition
This report covers rigid containers manufactured for architectural and industrial coatings, spanning tinplate round cans, plastic pails and buckets, aerosol cans for coatings, bulk and intermediate containers, composite and hybrid containers, and specialty and small format packs. Value is measured at manufacturer level on container revenue including closures supplied with them. Excluded are coatings themselves, flexible packaging and pouches, interior lining coatings sold as chemicals, secondary and transit packaging, and containers for non-coating chemical products.
Base Year Value
$5.8B in 2025 (MMA Primary Research Dataset, August 2026)
Forecast Period
2026 to 2036, eleven discrete annual values
CAGR
6.6% base case. Bull 7.8%. Bear 5.4%.
Fastest Growth Segment
Composite and Hybrid Containers: 9.9% CAGR
Fastest Growth Country
India: 9.8% CAGR
Fastest Growth Region
South Asia and Pacific: 8.6% CAGR
Largest Region
East Asia: 34% of 2025 global value
Market Leaders
Crown Holdings, Sonoco Products, Greif, Mauser Packaging Solutions and Massilly lead the market. Source: MMA Primary Research Dataset, July 2026.
Primary Survey
n=3,800 procurement and R&D decision-makers, Q4 2025, six countries
Methodology
Demand-side build-up, cross-validated against public data, 47 expert interviews

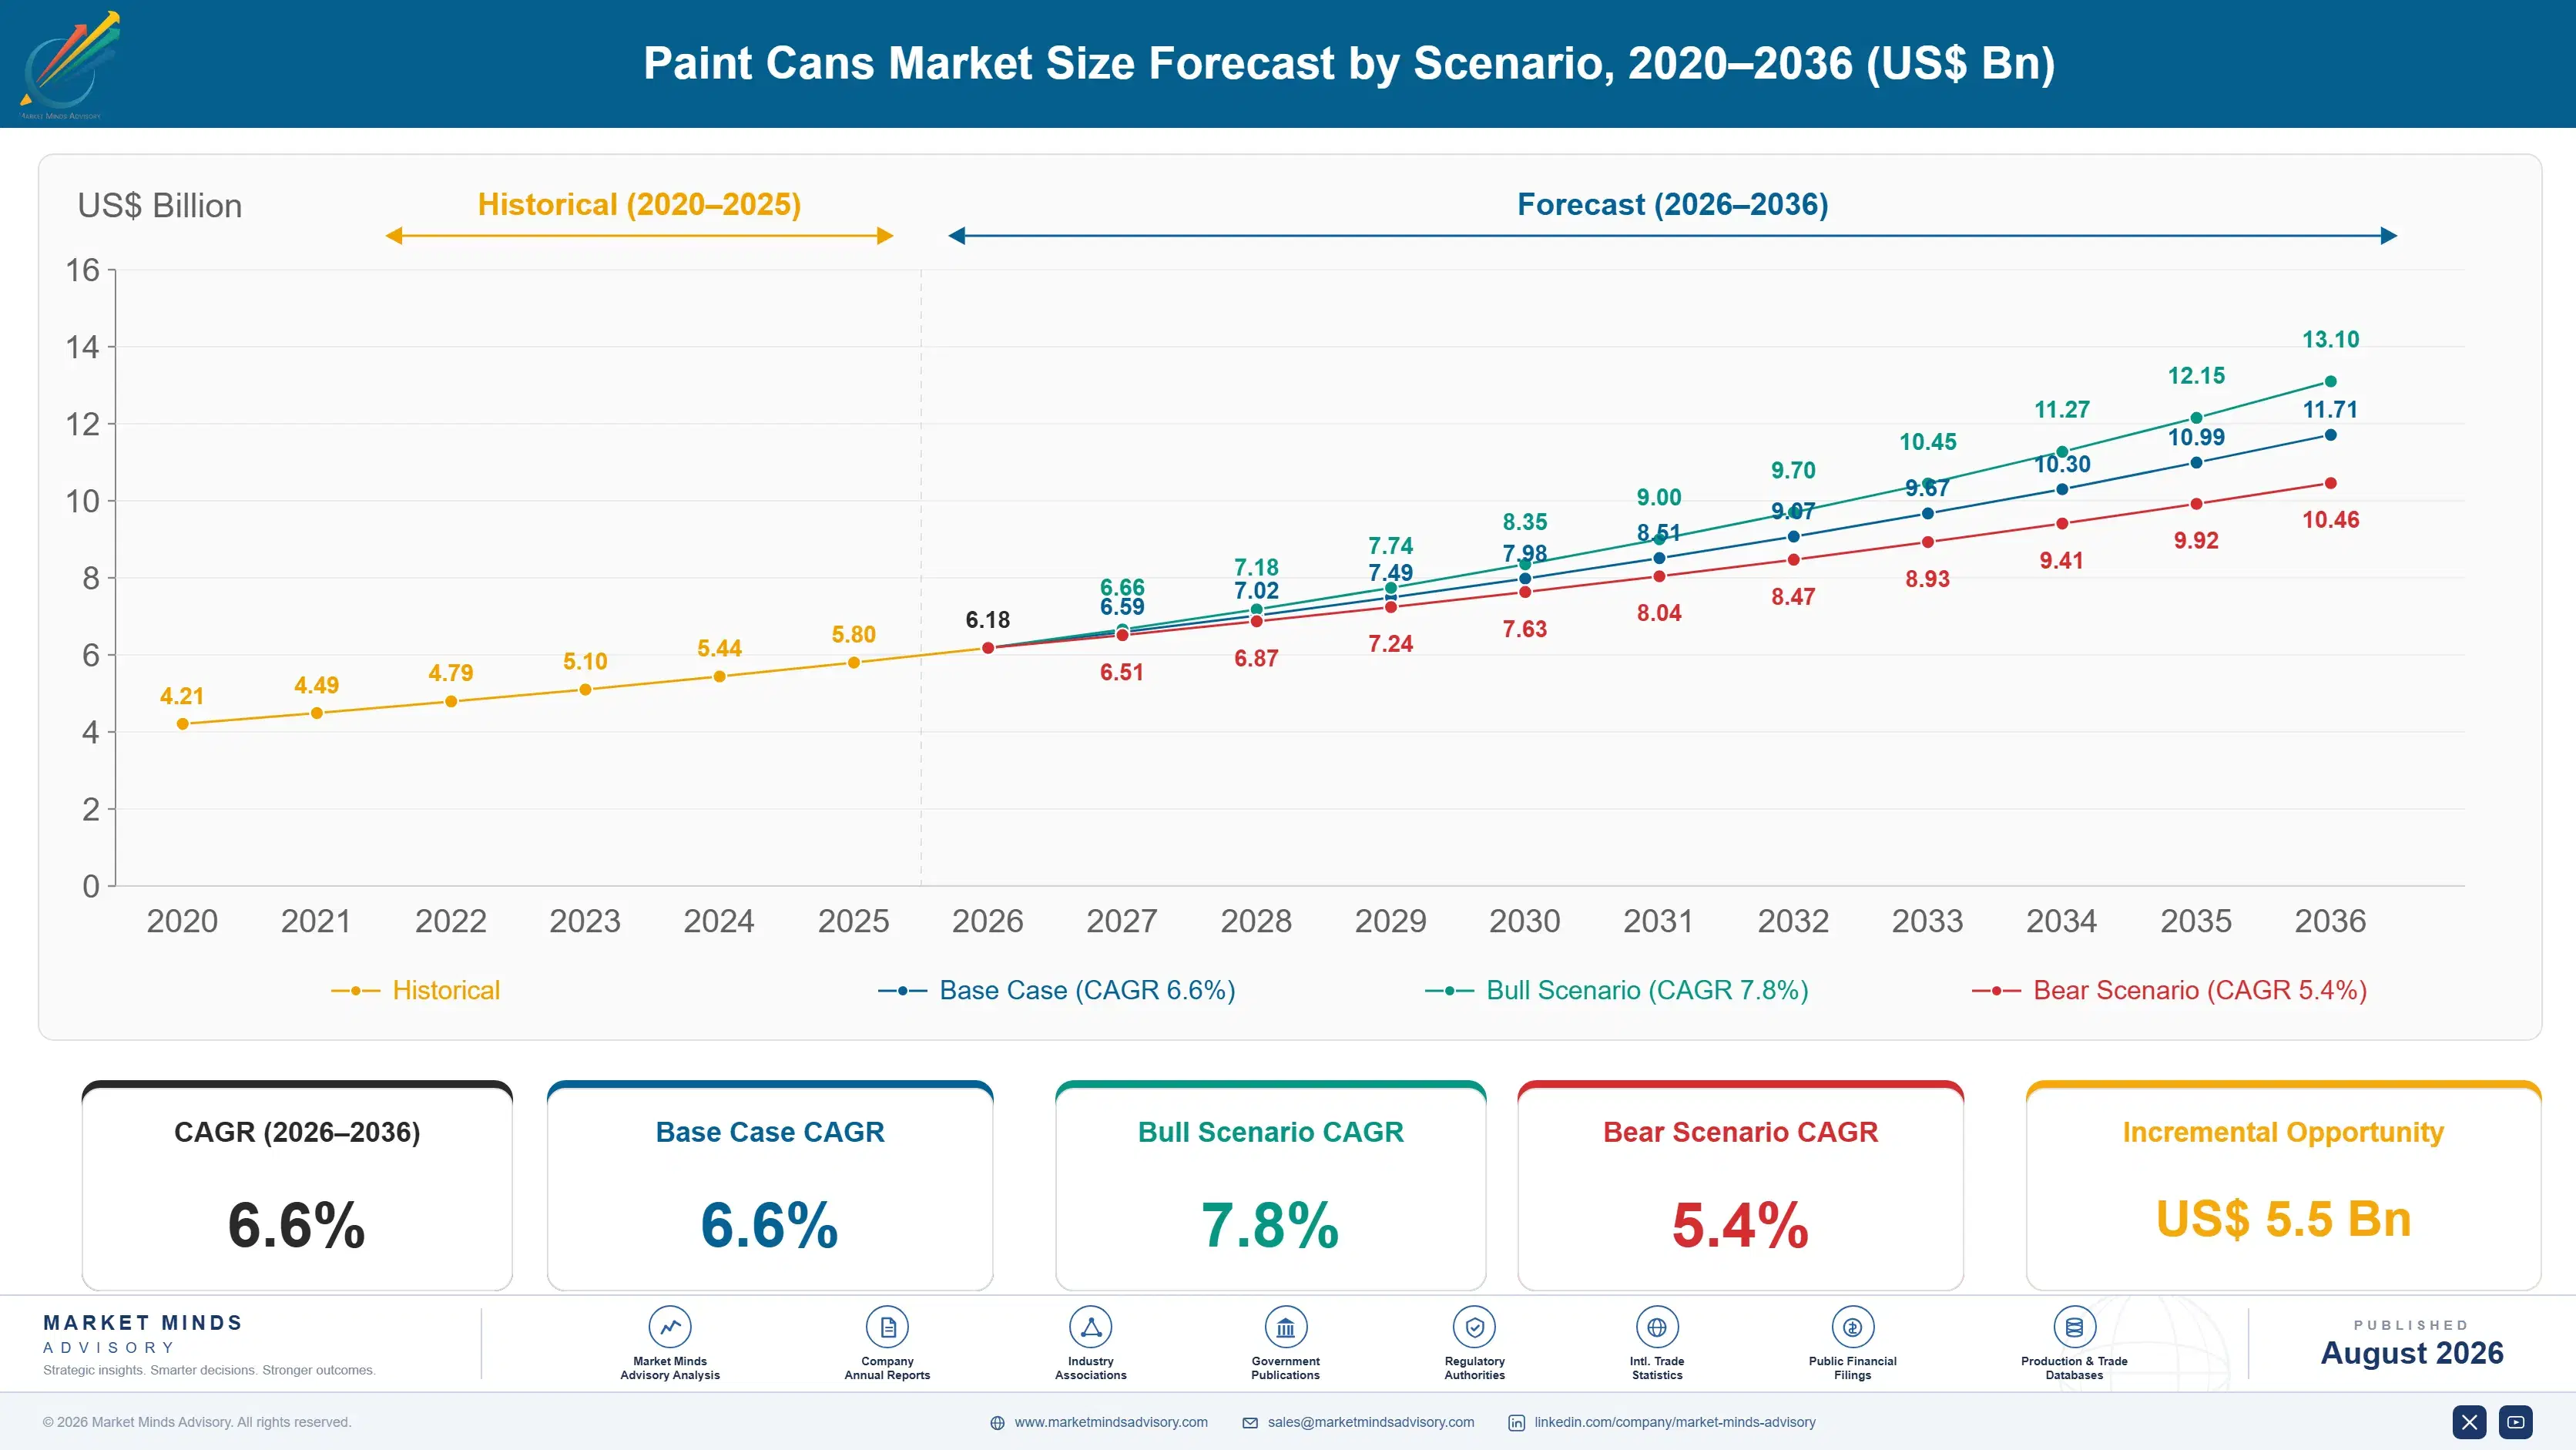
Paint Cans Market Forecast Scenarios

paint-cans-market-size-forecast-scenario-1787559671669
Growth ran at 4.8% between 2020 and 2025 as architectural paint volumes recovered after an unusual home improvement surge and then normalised. Waterborne conversion continued displacing solvent-based formulation under volatile organic compound rules, which steadily worsened the corrosion problem for metal containers and moved trade volume toward plastic across several markets. Recovery obligations tightened across major markets over the same period.
The 6.6% base case rests on three mechanisms. Composite and hybrid containers at 9.9% as manufacturers attempt to retain steel performance at lower weight. Specialty and small format packs at 8.2% on tester pots and consumer convenience formats. And Indian growth at 9.8%, the fastest of any country, on decorative paint consumption rising with housing completion and shortening repaint cycles together. None of the three depends on the material argument resolving either way.
The 7.8% bull case is packaging recovery obligations tightening enough that the 92% metal recovery rate becomes a purchasing criterion rather than a talking point. The 5.4% bear case is waterborne conversion continuing to favour plastic in trade formats faster than recyclability arguments can pull volume back toward metal containers. Trade formats are where that contest is being decided.

Corrosion Versus Recoverability

Material choice in paint containers is being decided by two technical facts that point in opposite directions, and the price comparison everybody expects to settle it barely features. Architectural coatings moved to water-based formulation under volatile organic compound rules and now stand at roughly 78% waterborne, and water corrodes steel in ways that solvent never did. That drove substitution toward plastic pails which simply do not rust, and it happened for engineering reasons rather than because plastic was cheaper.
TOP-FIVE CONCENTRATION32%Combined position across supply held by the leading container manufacturers
WATERBORNE COATING SHARE78%Portion of architectural paint now formulated in water
INTERIOR LINING COST SHARE21%Portion of metal container cost attributable to the internal coating
STEEL MAGNETIC RECOVERY RATE92%Share of metal containers recovered from mixed waste streams
PLASTIC CONTAINER RECOVERY RATE34%Portion of plastic pails recovered rather than sent for disposal
TRADE SEGMENT VOLUME SHARE46%Portion of container volume going to professional decorators
The counter-argument came from the end of the product's life rather than the beginning. Steel is ferromagnetic and separates itself from mixed waste at a materials recovery facility without anybody sorting it, which produces recovery rates around 92% against roughly 34% for plastic pails that must be identified, sorted and cleaned. As packaging recovery obligations tighten and brand owners face recycled content requirements, that difference is pulling material choice back toward metal in exactly the applications corrosion had pushed it away from.
Underneath both arguments sits the interior lining, which is what genuinely makes a metal paint can work at all and represents around 21% of its cost.
"People assume this is a cost fight between steel and plastic and it never was. Waterborne paint pushed volume to plastic because it rusts cans, and magnetic separation is pulling it back because recovery obligations have teeth now. Neither of those is a price argument and neither side controls the outcome."
Director, Rigid Packaging and Coatings Supply Practice · MMA Packaging and Converting Materials Practice · August 2026

Market Trends

Magnetic separability turns recovery into a purchasing criterion

Steel separates itself from mixed waste at a recovery facility without any sorting effort, producing recovery rates around 92% against roughly 34% for plastic pails that must be identified, sorted and cleaned before anything can be done with them. As packaging recovery obligations tighten and brand owners face recycled content requirements they must actually evidence, that gap is moving from a marketing claim into a specification input. Commercially it pulls material choice back toward metal in the same trade applications that waterborne corrosion had pushed toward plastic. Compliance data reaches buyers that messaging never will.
Market Impact: Trade takes 46% of volume
Composite formats attempt to hold both advantages at once

Hybrid containers combining metal barrier performance with lighter construction grow at 9.9%, faster than anything else here, because they attempt to retain steel's recovery and barrier properties while reducing weight and material cost. The engineering difficulty is that combining materials complicates the separation those recovery arguments depend on, which is a contradiction the format has to resolve rather than ignore. Commercially the growth is genuine and the volumes remain small, and whether it scales depends on recovery facilities handling the constructions consistently. Recovery facilities have to handle the constructions consistently for the argument to hold at all.
Market Impact: Indian demand compounds at 9.8%

Market Opportunities and Growth Drivers

Trade decorators buy differently from retail consumers entirely

Professional decorators account for roughly 46% of container volume and behave nothing like retail buyers, purchasing larger formats in quantity, generating empty containers in concentrated volumes and caring about handling, stacking and resealing rather than about shelf appearance. That concentration of empties is precisely what makes take-back and refill schemes practical for trade where they are hopeless for households. Commercially the trade channel is where format innovation and recovery schemes actually work, and manufacturers designing for retail shelves are addressing the smaller half of the market. Format innovation gets adopted here rather than at retail.
Market Impact: Waterborne reaches 78% of paint

Indian decorative paint consumption expands with housing completion

Indian growth at 9.8% leads every country in this market, driven by decorative paint consumption rising with housing completion, repaint cycles shortening as incomes increase and organised retail extending paint distribution into markets it never reached before. Container demand follows paint volume directly with very little lag. Domestic container manufacture is expanding to serve it, and both metal and plastic formats are growing rather than one displacing the other, since the market is adding volume faster than any substitution can redistribute it. Container demand follows paint volume with almost no lag.
Market Impact: Lining is 21% of can cost

Market Restraints and Challenges

Waterborne formulation corrodes steel in ways solvent never did

Architectural coatings now stand at roughly 78% waterborne under volatile organic compound rules, and water in contact with steel produces corrosion that solvent-based paint simply did not cause. The root cause is chemistry rather than any failing in container manufacture. Commercially this drove substitution toward plastic pails that do not rust, particularly in trade formats stored for extended periods before use. Manufacturers are responding with improved interior linings, which works and adds cost to a container already carrying around 21% of its value in coating. Trade formats stored for months are the worst case.
Market Impact: Metal recovers at 92% of volume

Tinplate supply narrows as steel mills exit the business

Tinplate production capacity has contracted as food can demand declined in several markets and steel producers withdrew from a specialised and low-volume product line. The root cause is that tinplate is a small niche within steelmaking and mills allocate capacity to larger opportunities. Commercially this reduces supply flexibility for metal container manufacturers and raises exposure to individual mill decisions. Manufacturers are qualifying multiple tinplate sources and examining lighter gauges, which conserves supply and complicates the container performance they are trying to preserve. Qualifying an alternative source takes testing that cannot be compressed once a closure has already been announced publicly.
Market Impact: Hybrid formats compound at 9.9%
4 additional market trends, 3 additional growth drivers, and 2 additional restraints and challenges are covered in the full report. Contact sales@marketmindsadvisory.com to access the complete intelligence.

Segment CAGR and Growth Architecture

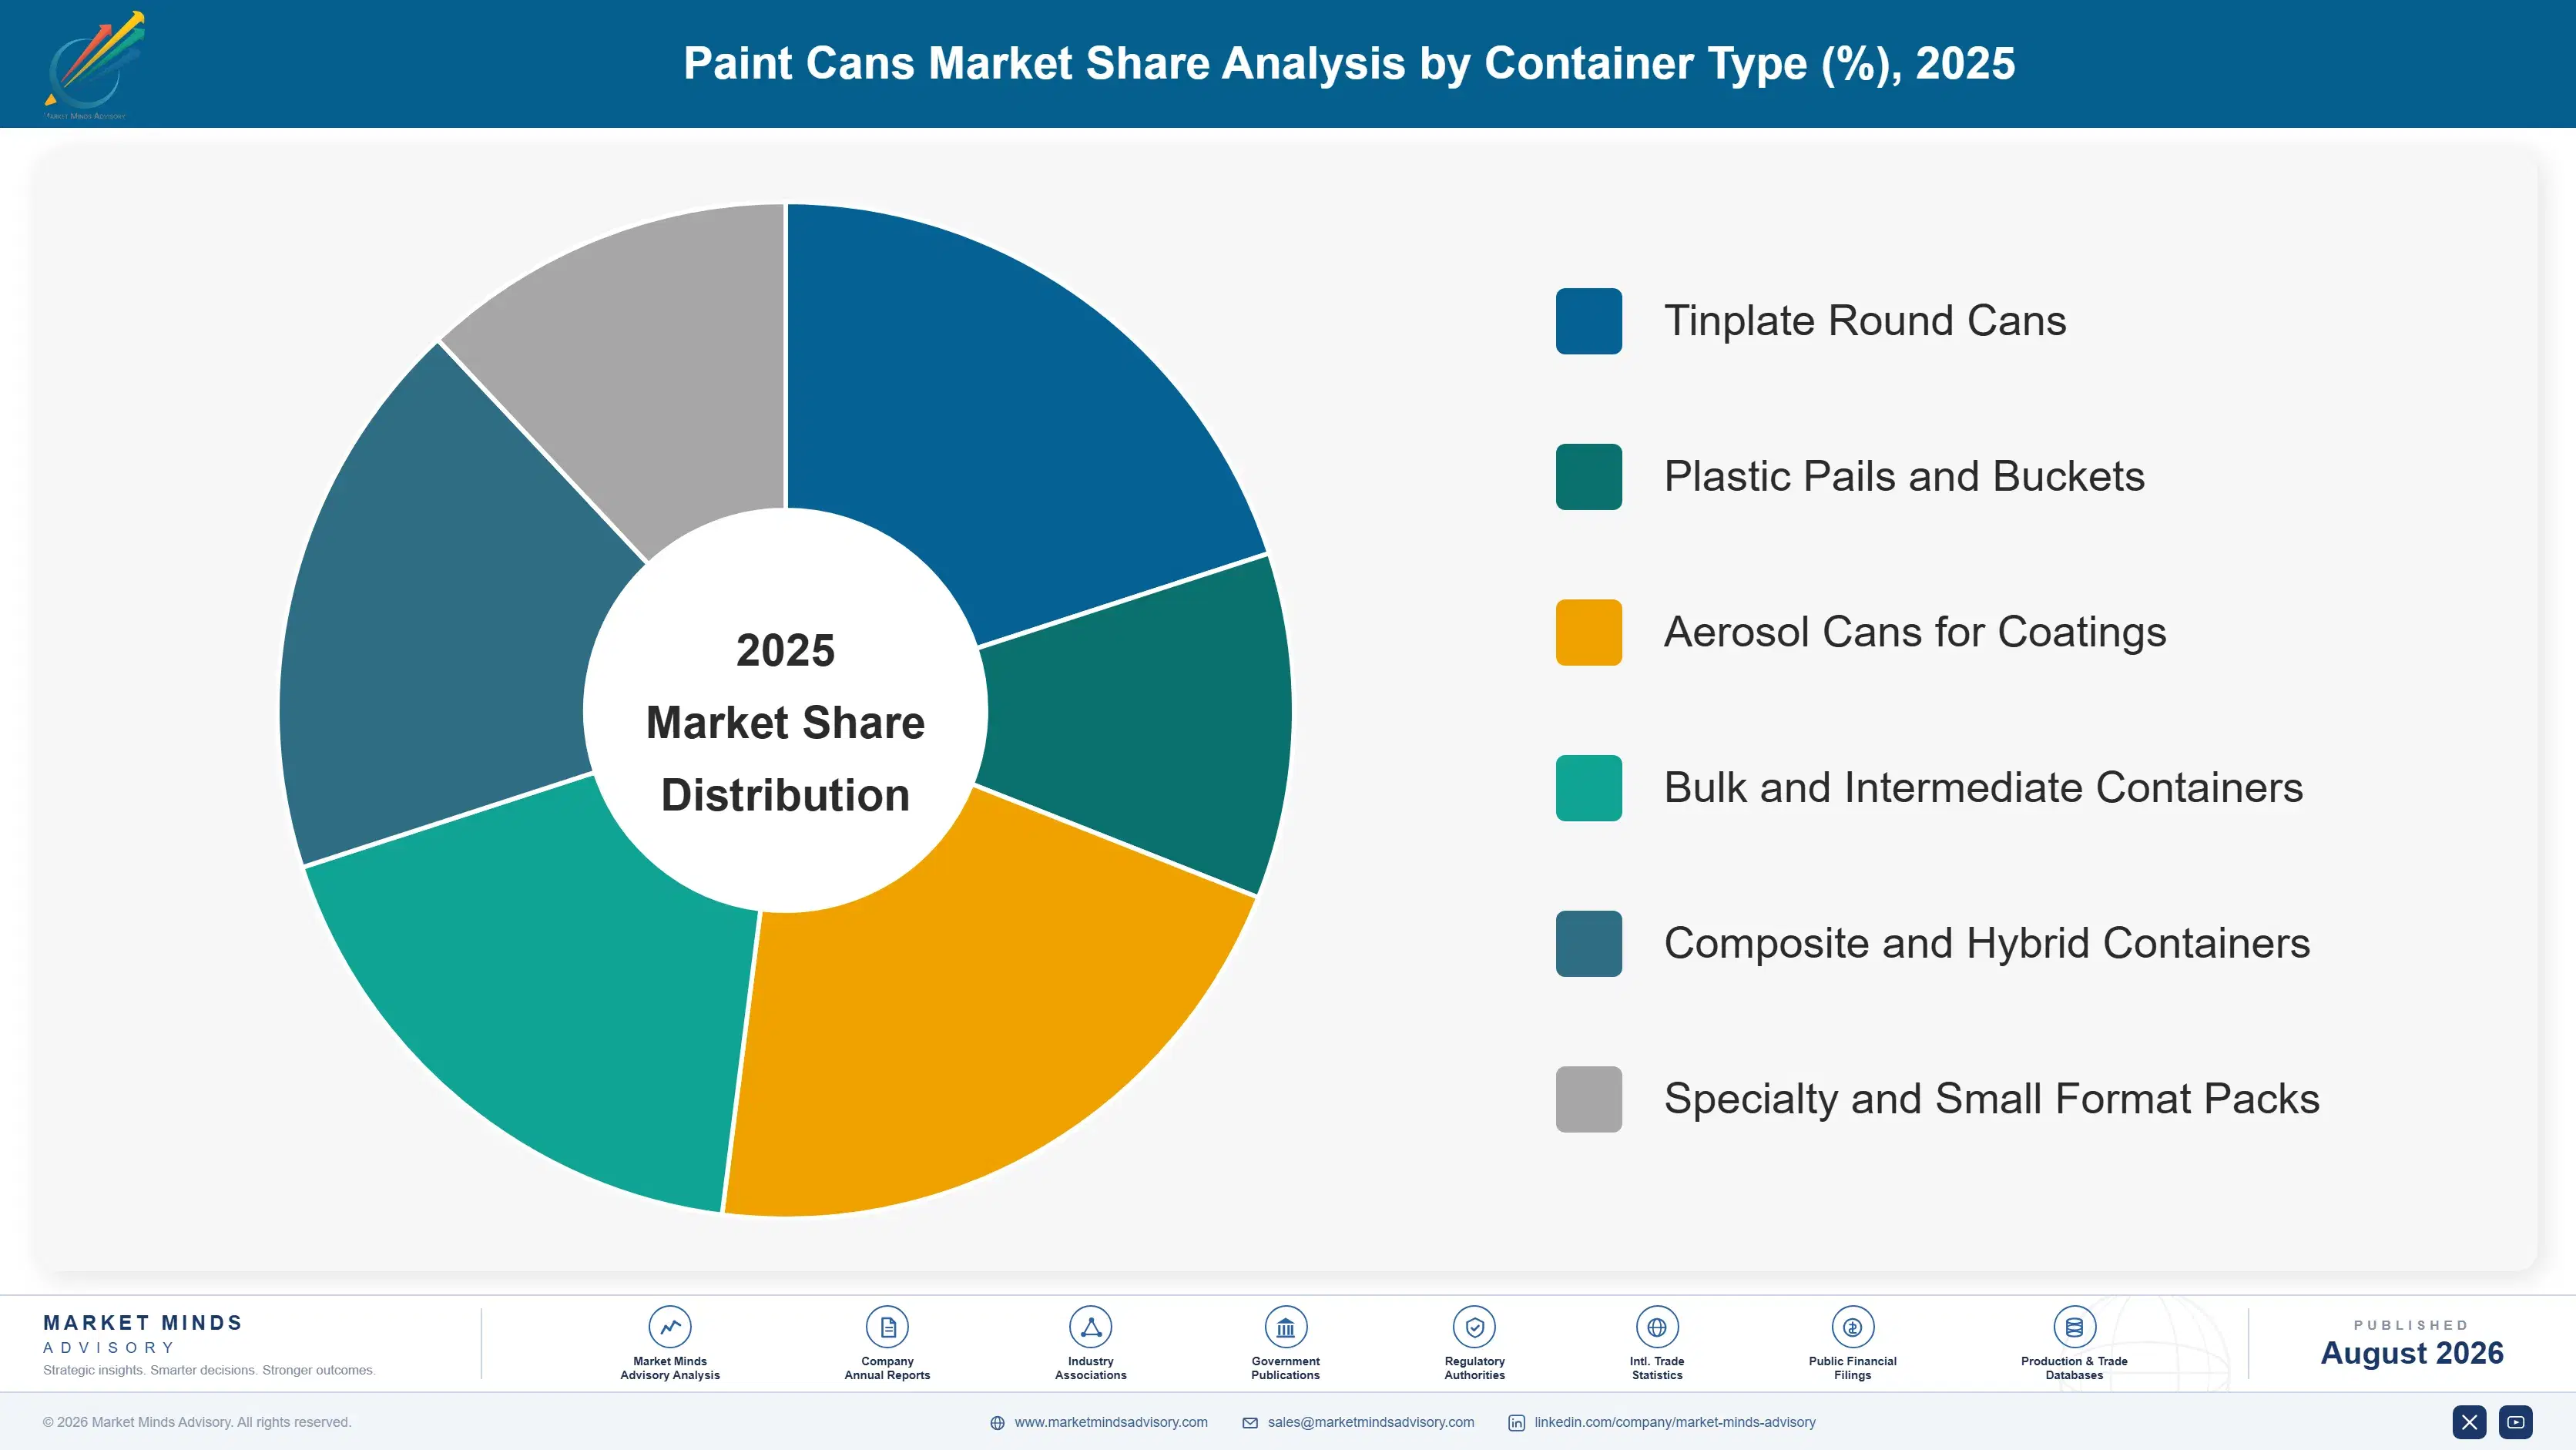
Value is classified here by container type and material, since corrosion exposure, recovery behaviour and manufacturing route all follow directly from what the container is made of. Coating application, distribution channel and closure type are handled separately in the framework below, because most container types serve several channels with adjusted specification rather than different construction.
paint-cans-market-market-share-analysis-1787559672237

Composite and Hybrid Containers

Growing at 9.9%, half again the market rate, hybrid containers attempt to combine metal barrier and recovery advantages with lighter construction and lower material cost, which addresses the corrosion and weight objections to steel without surrendering the magnetic separability that gives metal its recovery position. The engineering contradiction is real: combining materials complicates exactly the separation that recovery argument depends upon, and a container that recovery facilities cannot process cleanly loses the advantage it was designed around. Volumes remain small relative to the growth rate, and whether the format scales depends on how consistently recovery infrastructure handles the constructions in practice. Nobody has resolved that contradiction convincingly yet. Recovery facilities decide the outcome.
CAGR 9.9%

Specialty and Small Format Packs

Tester pots, sample sizes and consumer convenience formats grow at 8.2% as retailers extend colour sampling and as decorative paint purchasing becomes more experimental among consumers unwilling to commit to a full container. Unit volumes are high and value per unit is low, which makes manufacturing efficiency and filling line compatibility decisive rather than any material property. These formats also sit almost entirely in the retail channel rather than in trade, which makes them a different commercial business from the bulk formats professional decorators buy, with different customers, different specifications and quite different seasonality. Seasonality differs too, since sampling peaks ahead of decorating rather than alongside it, which complicates production planning for anybody serving both channels.
CAGR 8.2%
Full segment breakdown across 6 segments available in the complete report.

Regional Architecture and Country Demand Map

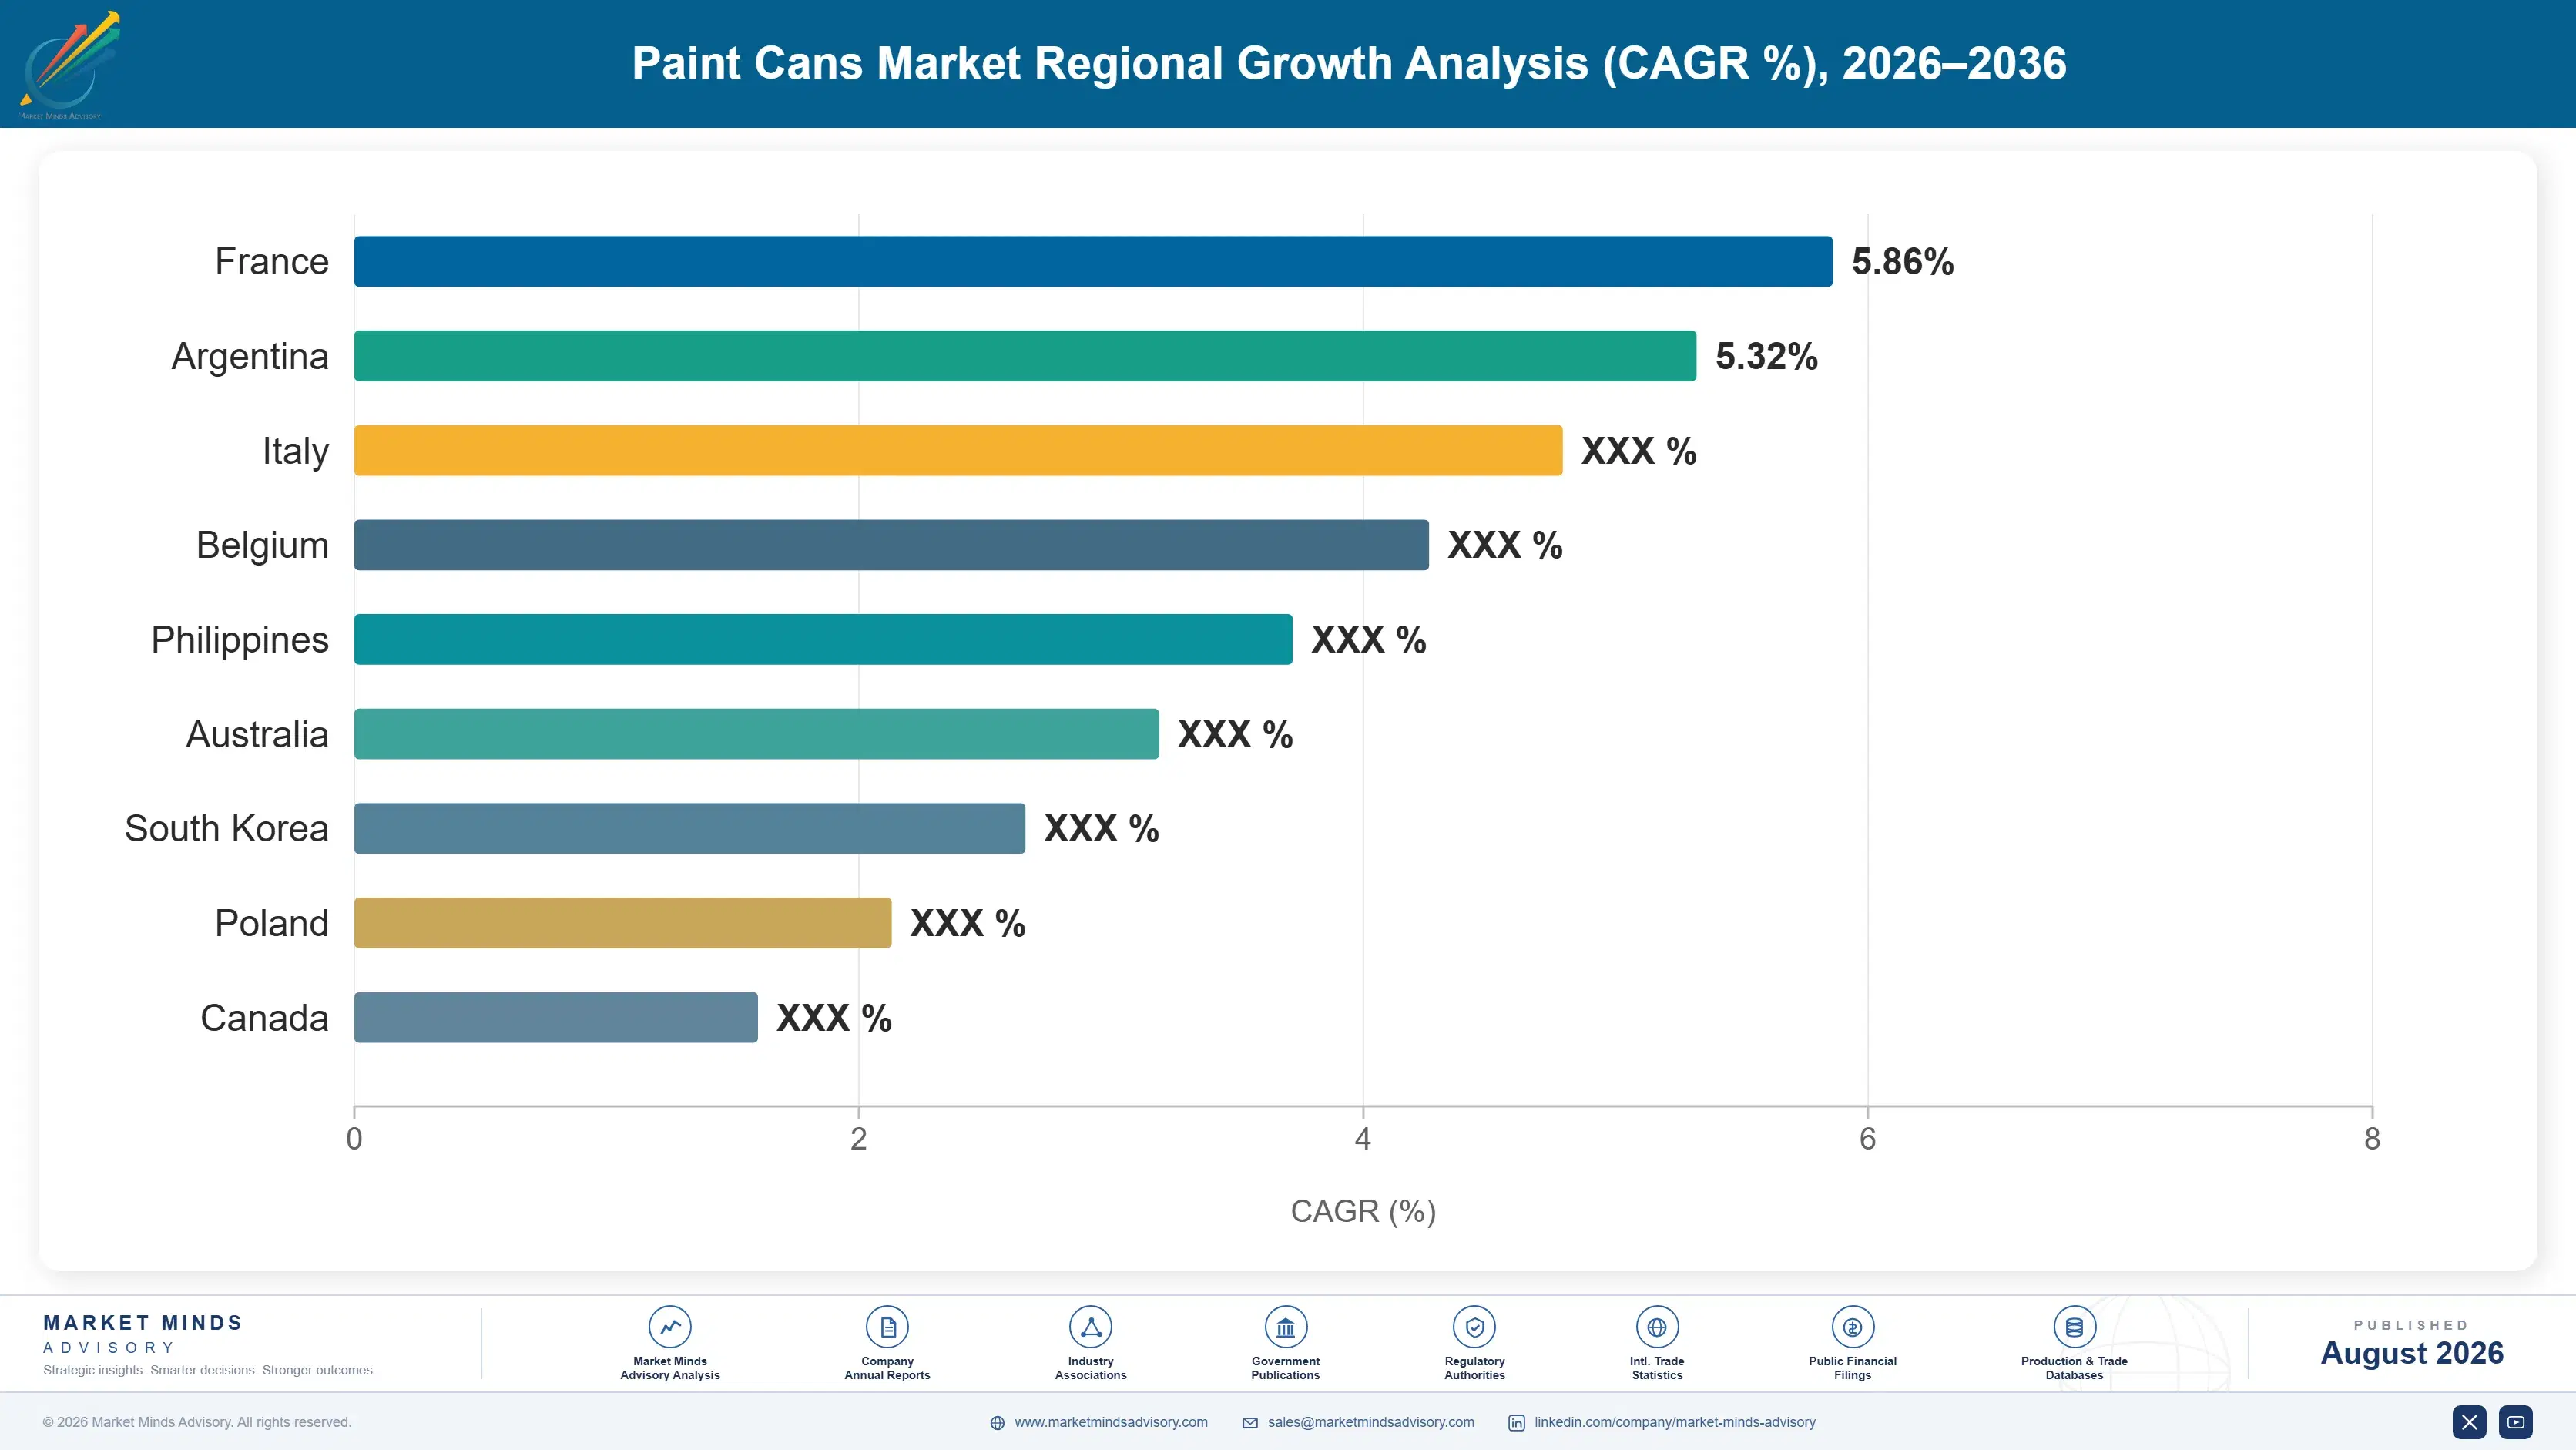
East Asia holds 34% of value here, well above the standard band, because paint consumption and container manufacture both concentrate in that region at volumes nowhere else matches. South Asia and Pacific follows at 14%, also above its usual band, on rapid Indian decorative paint expansion.

East Asia

At 34% this region sits above the standard band, because Chinese architectural and industrial coatings consumption operates at a scale nothing elsewhere approaches and container manufacture concentrated there alongside it. Domestic manufacturers compete hard on price across both metal and plastic formats, with Pacific Can and Zhongshan Zhongrong holding meaningful positions. Waterborne conversion is advancing under tightening emission rules, which is driving the same corrosion problem seen elsewhere. Packaging recovery infrastructure is developing but inconsistent, which limits how much the magnetic separability argument currently carries. Growth at 7.6% reflects coatings volume directly. Recovery infrastructure development will eventually change the material argument here as it has elsewhere. Waterborne conversion is advancing.
Share: 34% | CAGR: 7.6% (2026 to 2036)

North America

Trade decorator volume is proportionally large and professional channels dominate container specification, with larger formats and handling requirements that differ considerably from retail. Waterborne conversion is essentially complete across architectural coatings, which made the corrosion problem acute and moved substantial trade volume toward plastic pails. Recovery infrastructure is well developed and magnetic separation is standard at materials recovery facilities, which supports the metal recovery argument. Crown, Sonoco, Greif and Mauser all hold substantial regional positions. Growth at 6.0% sits below the market rate on mature paint consumption. Trade formats stored for extended periods before use are where corrosion problems appear most acutely across the region. Recovery infrastructure is well developed.
Share: 22% | CAGR: 6.0% (2026 to 2036)
Regional intelligence for 5 additional markets available in the complete report: Western Europe, South Asia and Pacific, Latin America, Middle East and Africa, Eastern Europe. Contact sales@marketmindsadvisory.com.
paint-cans-market-country-cagr-analysis-1787559672756

Where Container Value Is Decided

Four quite separate moves matter here, in a market segment where material choice is being settled by corrosion chemistry and waste stream separation rather than by any price comparison anybody expected. Two concern the two technical arguments pulling in opposite directions, and the other two concern the channel and cost realities deciding who actually profits.

Sell magnetic recovery as a compliance input

Steel separates itself from mixed waste without sorting, producing recovery around 92% against roughly 34% for plastic pails, and packaging recovery obligations are moving that from a marketing claim into a specification requirement brand owners must evidence. Manufacturers who present recovery rates as compliance data rather than sustainability messaging reach the people who now have obligations to meet. That argument works in exactly the trade applications waterborne corrosion had been losing. It works in exactly the applications corrosion had been losing. The evidence is already documented. Procurement now needs that documentation.
Market Impact: Contrasts 92% recovery against 34% for plastic pails

Invest in lining performance rather than conceding to plastic

Waterborne coatings at 78% of architectural paint corrode steel in ways solvent never did, and improved interior linings genuinely solve it while adding to a cost line already at 21% of the container. Conceding trade formats to plastic surrenders volume permanently, whereas lining investment preserves it at slightly lower margin. Given the recovery argument now running the other way, holding those formats through the corrosion problem positions a manufacturer for demand that is coming back rather than going away. Volume conceded to plastic does not come back later. Lower margin beats no volume.
Market Impact: Addresses a 21% lining share of can cost

Design for the trade channel that buys most volume

Professional decorators take roughly 46% of container volume and care about handling, stacking, resealing and empties disposal rather than about shelf appearance, which is what retail-focused design optimises for. Concentrated empty container volumes also make take-back and refill genuinely practical in trade where households make it hopeless. Manufacturers designing around retail shelves are optimising for the smaller half of their own market and missing where format innovation actually gets adopted. Empties arrive in concentrated volumes at trade counters, which is what makes return schemes practical here and hopeless anywhere else.
Market Impact: Serves 46% of the container volume being shipped

Qualify multiple tinplate sources before capacity contracts further

Tinplate capacity has contracted as steel producers exit a specialised low-volume product line, which reduces supply flexibility and raises exposure to individual mill decisions that nobody in packaging influences. Qualifying multiple sources takes time and testing that cannot be compressed once a mill announces closure. Lighter gauges conserve supply while complicating the performance being preserved, which makes source diversification the more reliable of the two available responses. With tinplate at roughly 48% of metal container cost, a supply interruption is considerably more damaging than any price movement in the material would be.
Market Impact: Protects supply covering 48% of the can cost

Who Controls the Margin Pool

Five manufacturers hold 32% of this market, measured on container revenue at manufacturer level, the basis used throughout this section. Concentration is moderate because metal and plastic container manufacture are genuinely different businesses with different capital, and freight economics keep both regional since empty containers are bulky and travel poorly relative to their value. Freight keeps both businesses regional.
Competition runs on four dimensions. Interior lining capability, which determines whether a metal container survives waterborne fill across an extended storage period. Recovery credentials, now moving from marketing language into actual specification requirements. Trade channel design capability, since professional decorators take most of the volume. And tinplate sourcing security as capacity contracts across a steel industry that barely notices this product exists.

Rankings shift toward manufacturers holding both metal and plastic capability, since the material argument is genuinely unsettled and customers want a supplier able to serve either answer without changing relationship. Metal specialists hold the lining expertise that corrosion demands. Plastic specialists hold the volume that corrosion delivered to them. Very few participants hold both capabilities convincingly enough to reassure a customer either way. That reassurance is worth real money.
paint-cans-market-company-positioning-matrix-1787559673280

Competitive Moat and Risk Dimensions

CROWN HOLDINGS

Moat: Lining technology and metal scale

The company holds deep interior lining capability developed across food and coatings applications, which matters directly because waterborne paint at 78% of the architectural market corrodes steel and lining performance decides whether a metal container survives it. Scale in tinplate purchasing also provides supply security as capacity contracts and individual mill decisions become more consequential for smaller buyers.
CROWN HOLDINGS

Risk: Limited plastic container position

The material argument is genuinely unsettled, with corrosion favouring plastic and recovery favouring metal, and customers increasingly want a supplier able to serve whichever answer they choose. A metal-weighted position cannot follow a customer who decides on plastic for trade formats. Manufacturers holding both capabilities keep the account regardless of which way the specification lands.
MAUSER PACKAGING SOLUTIONS

Moat: Both material capabilities held

The group manufactures across metal and plastic container formats, which matters unusually much in a market where the material argument remains unsettled and customers want a supplier who can serve either outcome without changing relationship. Industrial and trade channel positions also reach the professional decorator segment that takes roughly 46% of volume and specifies on handling rather than appearance.
MAUSER PACKAGING SOLUTIONS

Risk: Recovery credentials across plastic

Plastic pails recover at roughly 34% against 92% for metal, and packaging recovery obligations are converting that gap into a specification input. A portfolio weighted toward plastic in trade formats carries exposure to a requirement tightening across major markets. Metal specialists make the compliance argument without qualification.

Players Tracked

Prominent Players

Crown Holdings
Sonoco Products
Greif
Mauser Packaging Solutions
Massilly

Other Key Players

Ball Corporation
Silgan Holdings
Ardagh Metal Packaging
Berry Global
Nampak
Zhongshan Zhongrong
Jokey Group
Superfos
Pacific Can
ITC Packaging
Auer Packaging
Time Technoplast
Balmer Lawrie
Hoover Ferguson
Grupo Zapata

Recent Developments

MARCH 2025

A coatings brand specified containers on recovery rate

An architectural coatings manufacturer began specifying container material partly on documented end-of-life recovery rates rather than on cost and performance alone, responding to recycled content obligations it must evidence rather than merely assert. This was a procurement change rather than any transaction with container manufacturers.
Signal: Recovery rates are moving from marketing claims into specification inputs that procurement teams must actually document
JULY 2025

A manufacturer improved lining for extended waterborne storage

A metal container manufacturer introduced an improved interior lining system for waterborne coatings stored over extended periods, addressing corrosion that had been driving trade format substitution toward plastic pails. This was a product development rather than any acquisition or partnership arrangement. Storage trials supported the launch.
Signal: Lining investment preserves trade volume that conceding to plastic would surrender permanently to a competitor instead
NOVEMBER 2025

A steel producer withdrew from tinplate manufacture

A steel producer announced withdrawal from tinplate production, citing declining volumes and the specialised nature of the product line relative to larger opportunities available for the same capacity. This was a steel industry decision rather than any commercial action involving container manufacturers. Container manufacturers were given notice.
Signal: Tinplate capacity contraction raises exposure to individual mill decisions nobody in packaging can influence at all

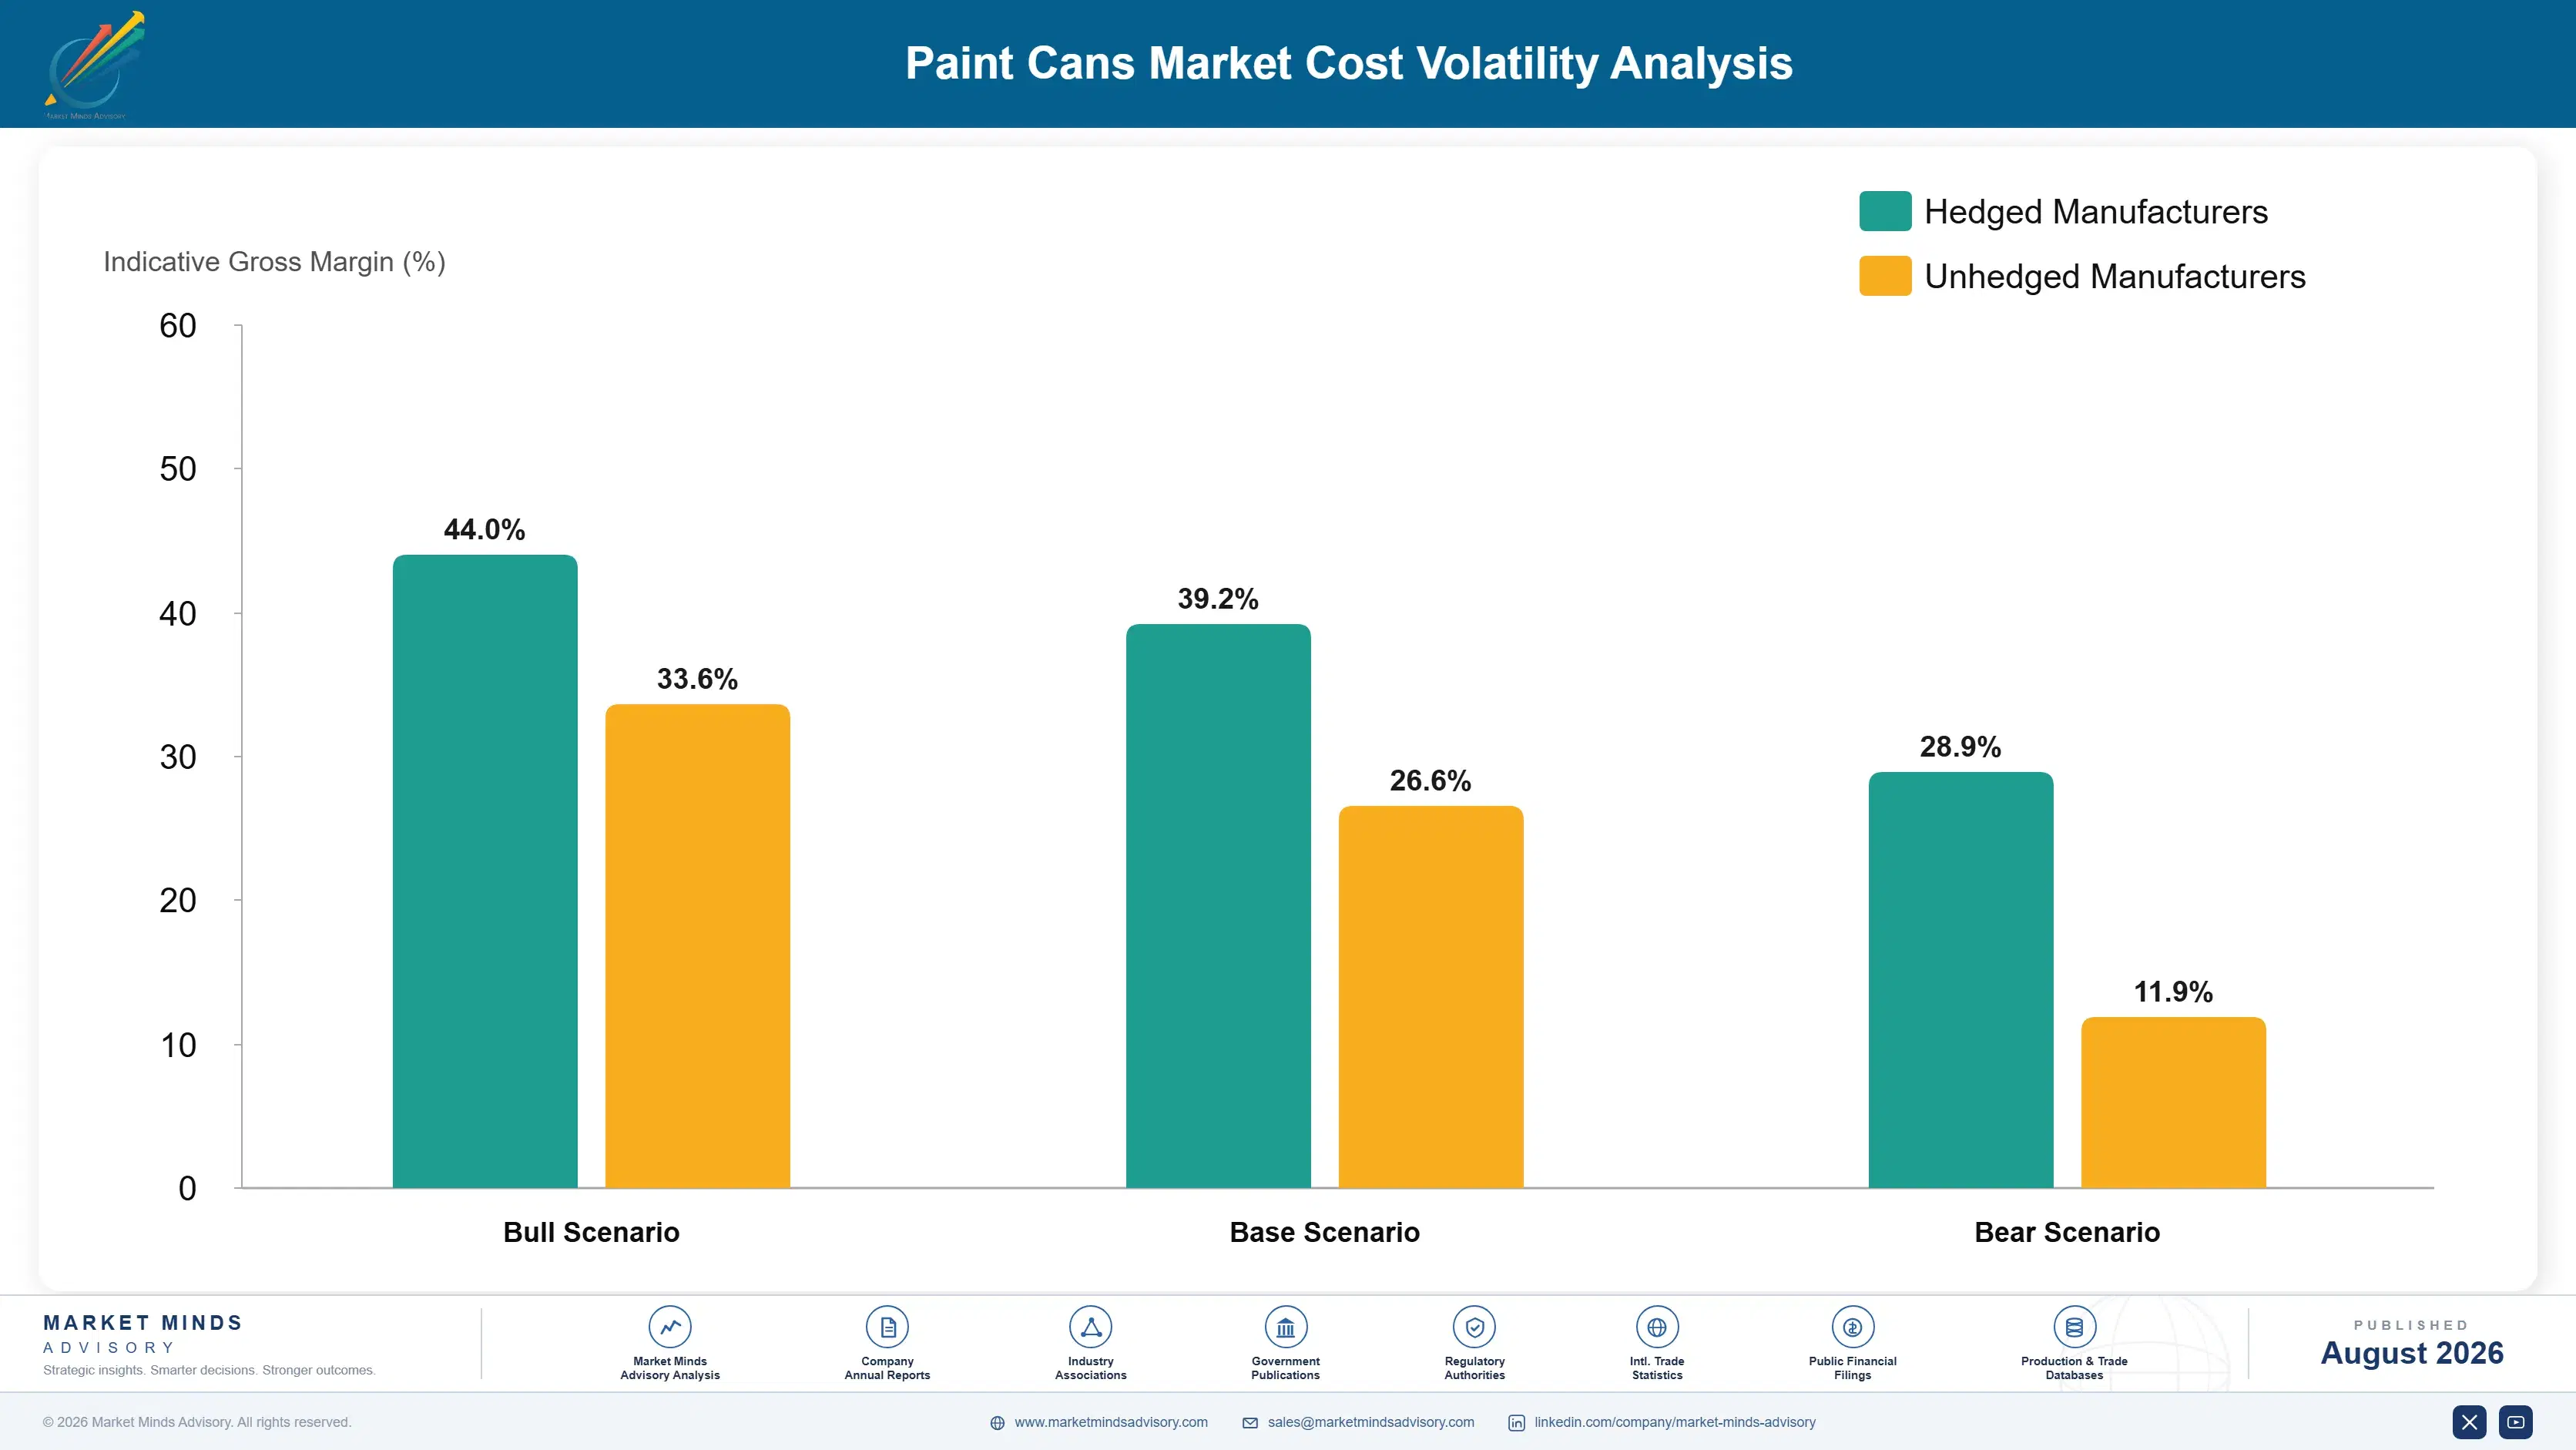
What Drives Container Cost

Tinplate accounts for roughly 48% of metal container cost and resin around 56% of plastic container cost, which makes both formats heavily exposed to input markets they do not influence. Interior lining adds about 21% on metal containers and is the line that decides whether the container works with waterborne fill. Forming, seaming and decorating take the remainder, with freight significant since empty containers are bulky.
Tinplate and resin prices both moved sharply through 2021 and 2022 as steel and petrochemical markets followed general commodity inflation and energy costs. Crown Holdings noted material and energy cost pressure across its packaging operations in its Annual Report 2022. Manufacturers on annual coatings customer contracts absorbed most of it, since paint manufacturers set retail and trade prices seasonally and resist mid-term container cost adjustment.

The disadvantage falls on manufacturers holding only one material, and it operates through customer retention rather than through cost. With corrosion favouring plastic and recovery favouring metal, coatings customers are genuinely undecided and want a supplier able to serve either outcome. A single-material manufacturer loses the account entirely when a customer switches rather than a portion of it.
paint-cans-market-cost-volatility-analysis-1787559673478

Hold capability across both container materials deliberately

Corrosion favours plastic and recovery favours metal, which leaves coatings customers genuinely undecided about material for trade formats. A manufacturer able to supply either outcome keeps the account whichever way the specification lands. A single-material position loses the whole relationship rather than a share of it, which is a far larger exposure. That is a materially larger risk.

Qualify multiple tinplate mills before capacity contracts further

Tinplate is a small specialised product within steelmaking and producers keep withdrawing from it, which reduces supply flexibility and concentrates exposure on individual mill decisions. Qualifying alternative sources requires testing and trial runs that cannot be compressed once a closure is announced. The work is inexpensive and only useful if done in advance. Timing is everything here.

Index coatings contracts to published steel and resin benchmarks

Tinplate at roughly 48% of metal cost and resin at 56% of plastic cost leave conversion margin far too thin to absorb commodity movement across an annual contract. Indexed pricing with quarterly reset moves that exposure appropriately. Paint manufacturers resist because their own retail and trade pricing is seasonal, which makes this a genuine negotiation.

Portfolio Architecture for Margin Defence

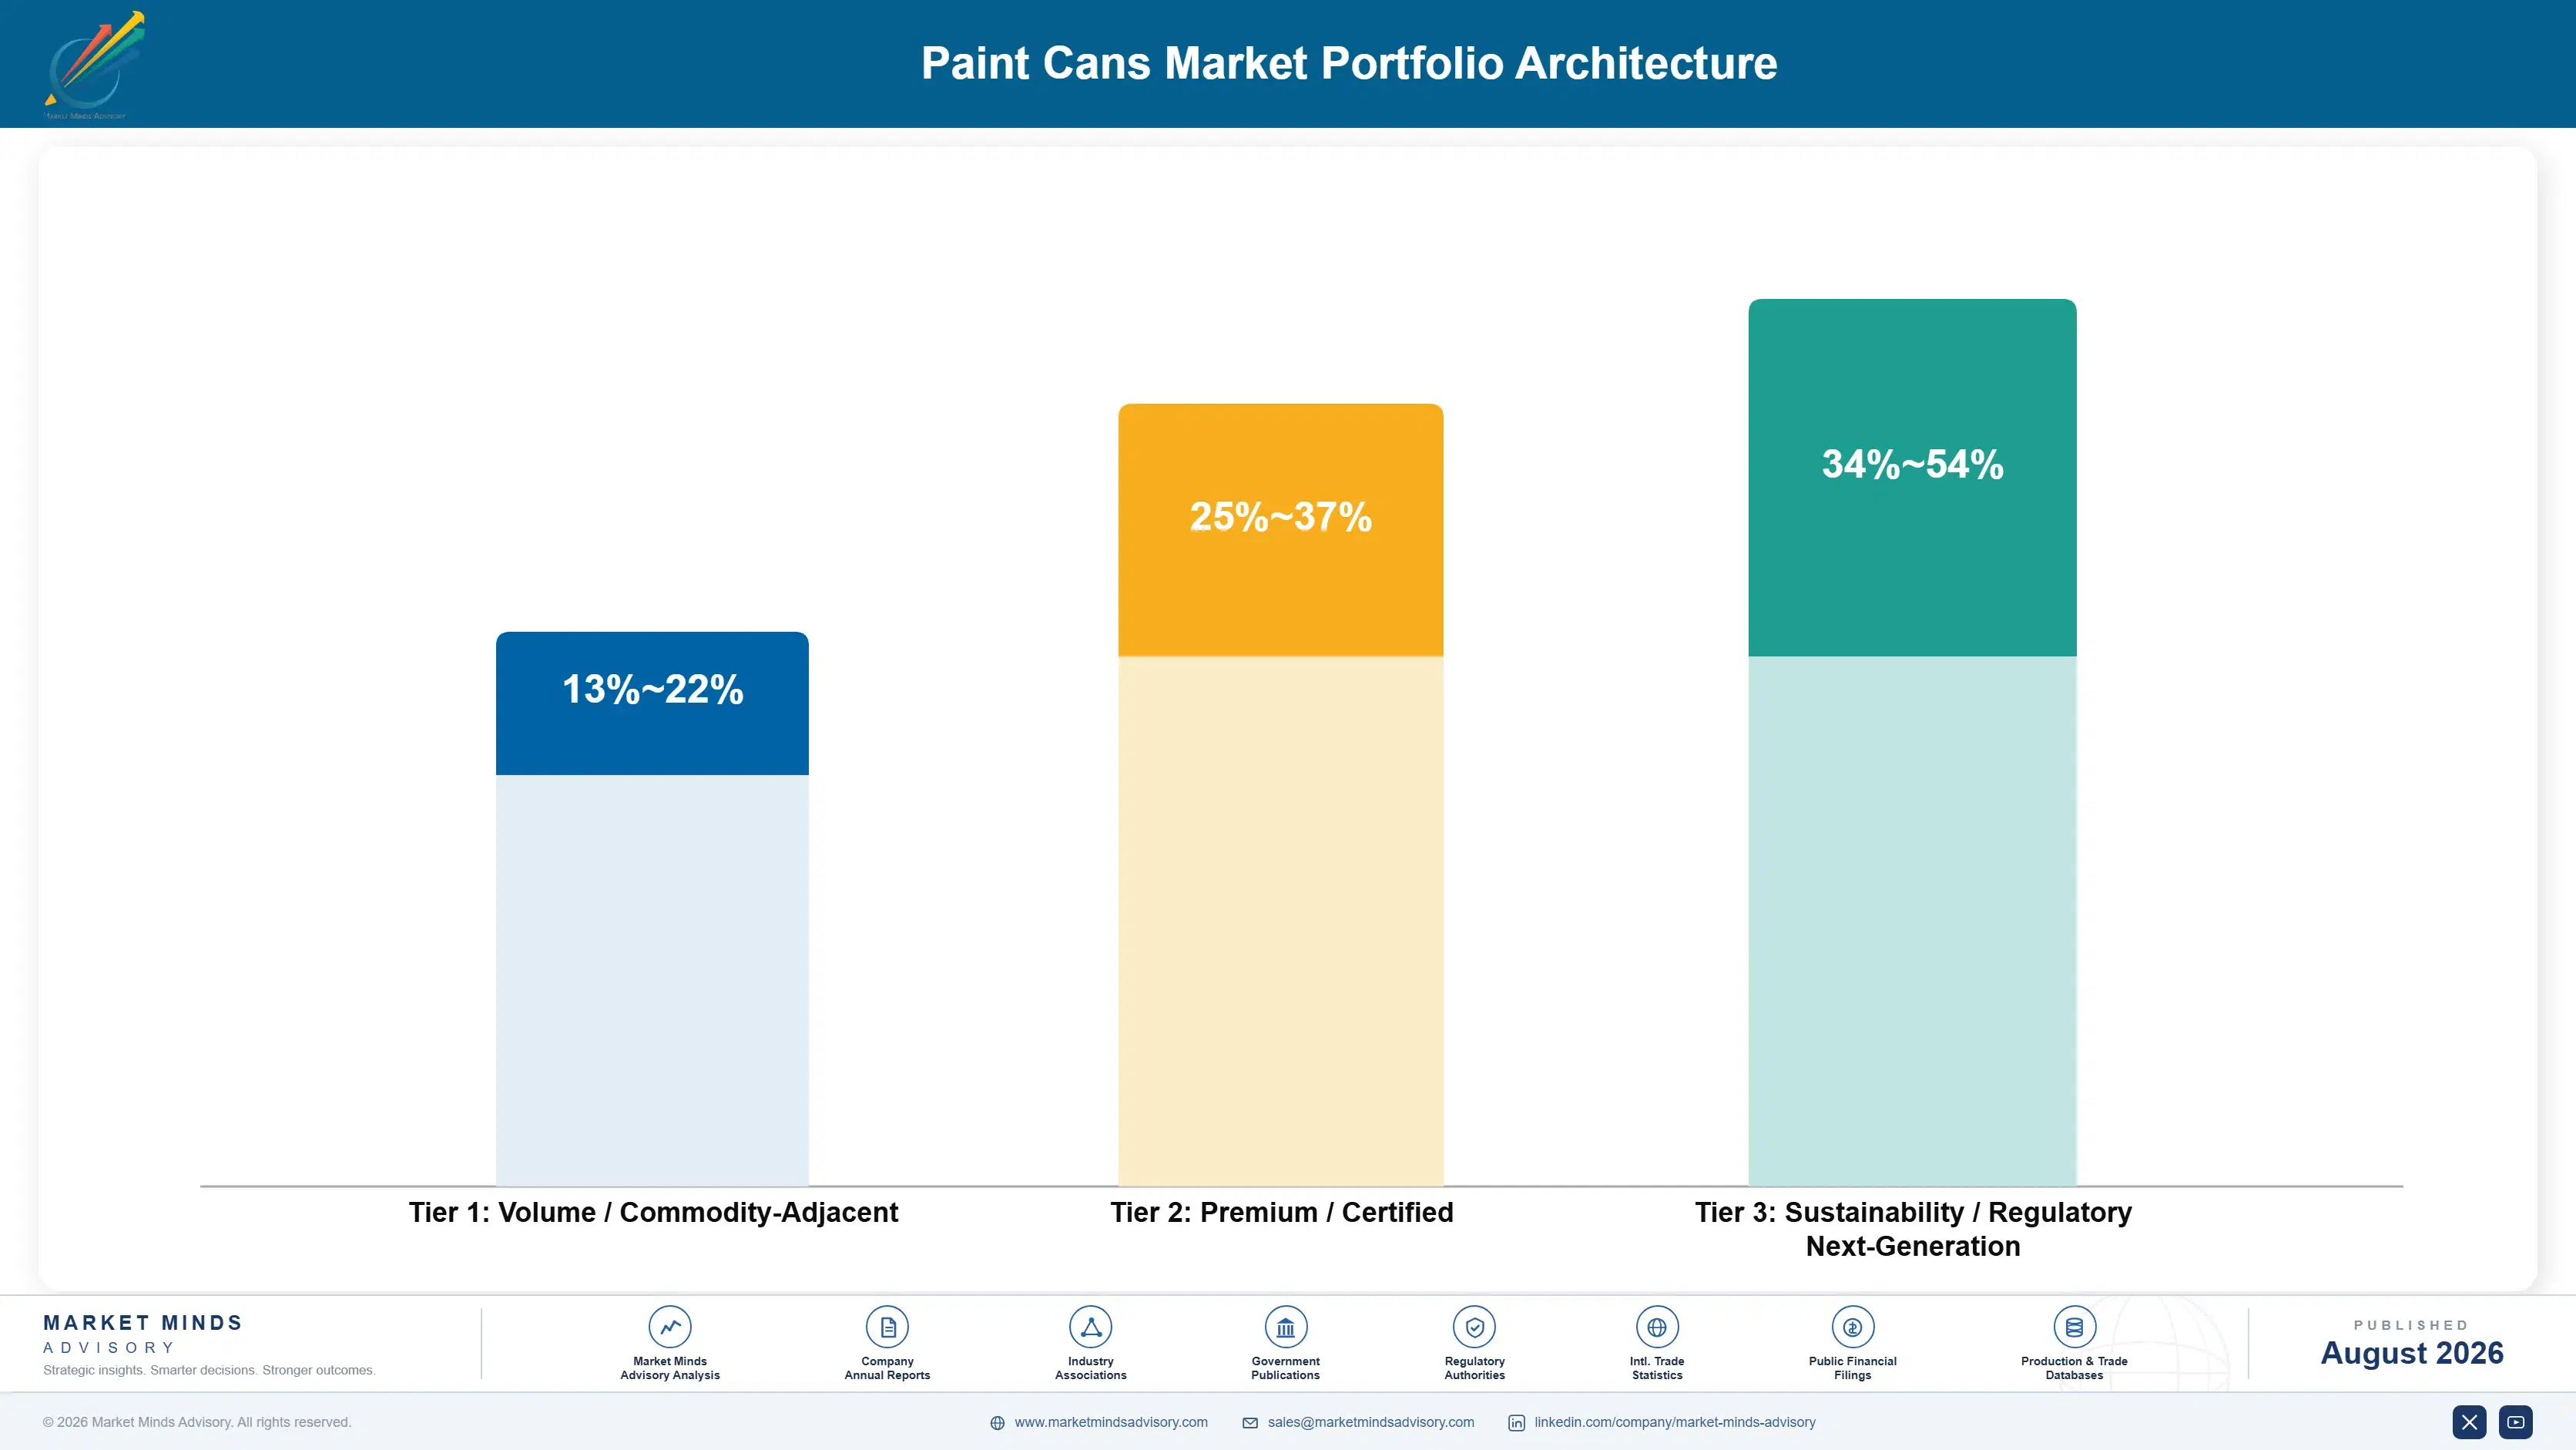
Margin separates on lining capability and format specialisation rather than on manufacturing scale, since forming a can or moulding a pail is widely available capability. Standard retail metal cans run at gross margins in the mid teens against manufacturers competing on tinplate cost and conversion efficiency. Plastic trade pails run similarly against resin cost. Specialty and small formats run better on unit economics. Composite and hybrid containers plus recovery-credentialed formats run highest, because the customer is buying compliance or performance rather than a container.
The tension is that standard formats carry the volume while lining performance and recovery credentials earn the differentiation, and both require investment in capability rather than in capacity. Manufacturers weighted toward standard formats in a single material face customers whose material choice is genuinely unsettled and who will move the whole account rather than part of it. That is an unusually binary exposure for a packaging business.

High-value pools sit in recovery-credentialed metal formats, advanced lining systems and trade channel design capability. Standard retail cans and commodity pails are where tinplate and resin cost decide everything that anybody earns. That binary quality is what makes the material question strategic rather than merely commercial.

Volume / Commodity-Adjacent

Standard retail metal cans and commodity plastic pails competing on tinplate and resin cost with conversion efficiency deciding the rest. The nine-point range separates manufacturers with material purchasing scale from smaller regional converters buying at market.
Gross Margin: 13%-22%

Premium / Certified

Specialty formats, aerosol containers and trade formats designed around handling, stacking and resealing requirements. The twelve-point spread reflects design and filling line compatibility rather than any material or manufacturing advantage.
Gross Margin: 25%-37%

Sustainability / Regulatory / Next-Generation

Advanced lining systems for extended waterborne storage, composite and hybrid constructions, and recovery-credentialed formats sold against compliance obligations. The twenty-point range is wide because lining capability and recovery documentation vary enormously between manufacturers.
Gross Margin: 34%-54%
paint-cans-market-portfolio-architecture-1787559673978

High-value Sub-segments and Strategic Watch-out

Recovery Credentialed Metal

Magnetic separation delivers around 92% recovery against roughly 34% for plastic pails, and recovery obligations are converting that into a specification input. Compliance data rather than sustainability messaging is what reaches the buyer. Obligations are tightening across every major market simultaneously. Documentation is the requirement.
Gross Margin: 36%-52%

Advanced Lining Systems

Waterborne paint at 78% of the market corrodes steel, and lining performance decides whether trade volume stays in metal or moves permanently to plastic pails that never come back afterwards. Extended storage is where the failure actually shows up. Trade storage runs for months. Nothing else fixes it.
Gross Margin: 34%-50%

Trade Format Design

Professional decorators take 46% of volume and specify on handling, stacking, resealing and empties disposal rather than shelf appearance. Concentrated empties also make take-back schemes practical here alone. Retail design optimises for the smaller half entirely. Empties concentrate at trade counters, which is what makes return schemes work here.
Gross Margin: 26%-38%

Standard Retail Formats

The line volume, competing on tinplate and resin cost with conversion efficiency deciding the remainder. Manage this for material purchasing scale rather than for margin that input markets have already settled. Purchasing scale on materials is the only real lever. Conversion efficiency does the rest.
Gross Margin: 13%-22%

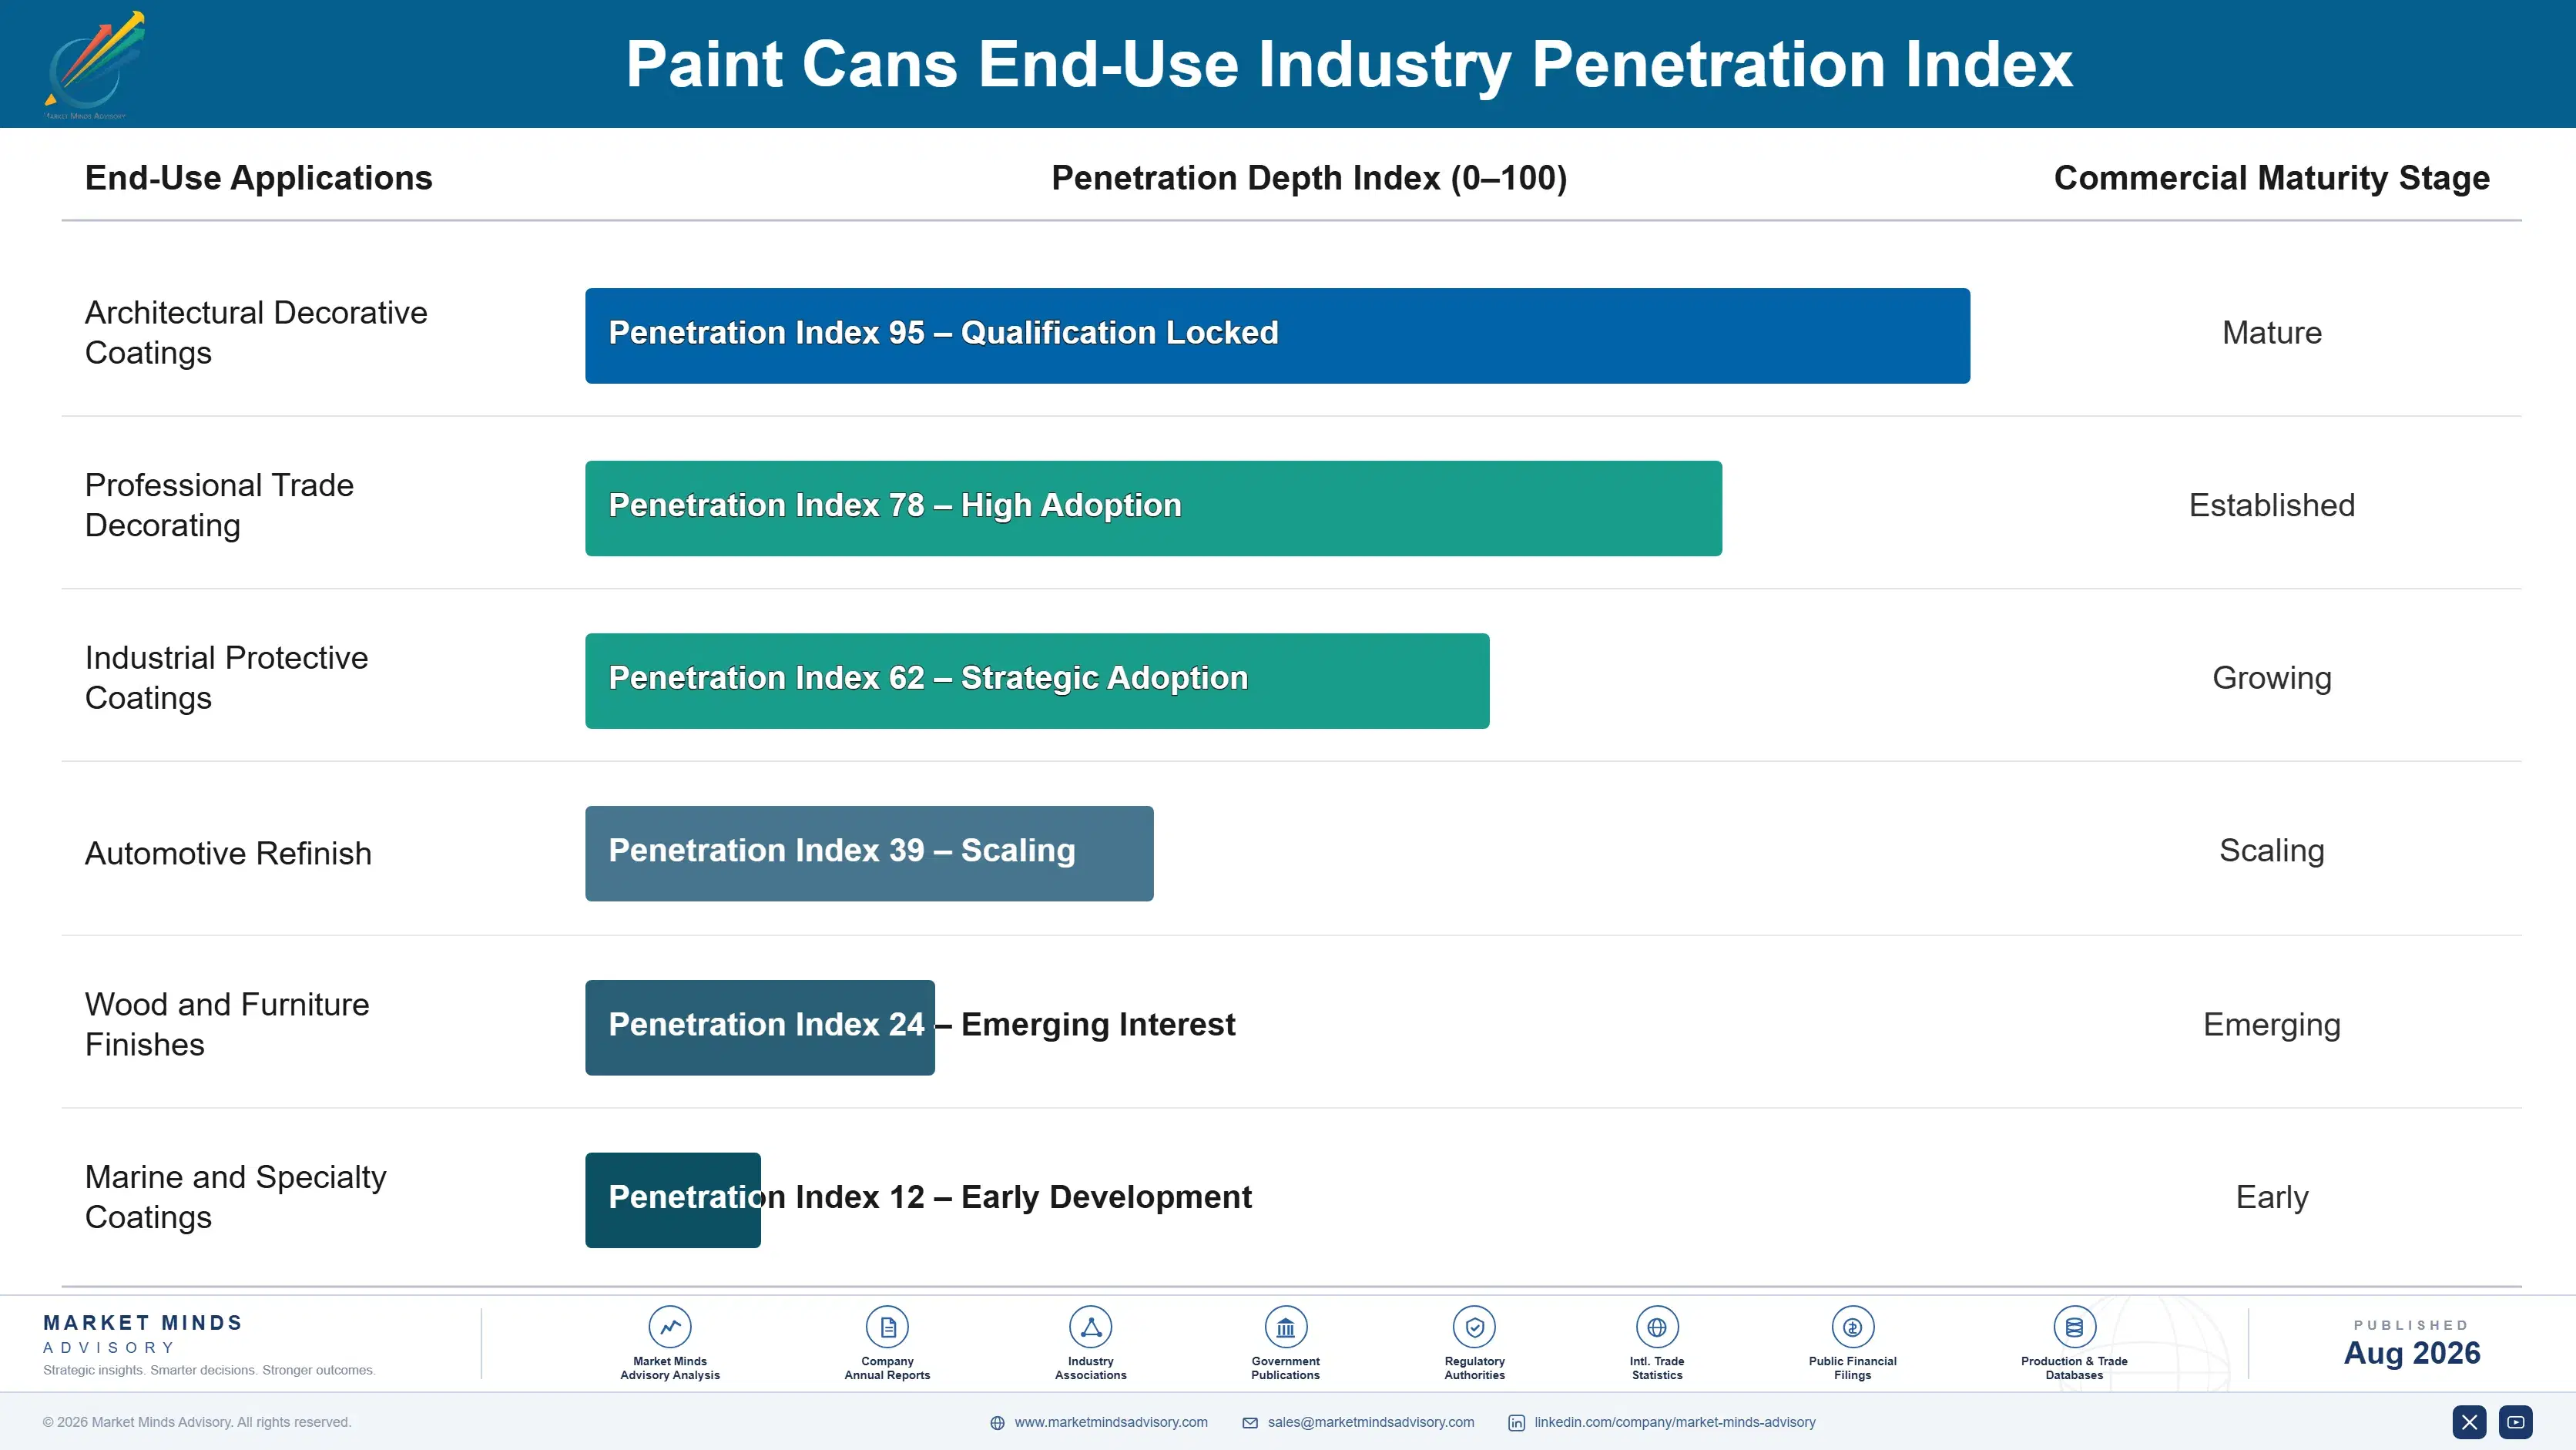
How Container Demand Renews

Demand renews with paint volume and follows a coatings manufacturer's production schedule exactly, which makes this an annuity attached to somebody else's output rather than a business with its own cycle. Architectural paint carries strong seasonality tied to weather and decorating patterns, so container demand arrives unevenly across a year in a way that complicates capacity planning considerably more than annual volume figures would suggest to anybody reading them.
Stickiness runs through filling line compatibility rather than through relationship or price. A container qualified onto a paint manufacturer's filling and seaming equipment cannot be changed without line trials and possible tooling adjustment, which nobody undertakes to save a small amount per container. That protects incumbency strongly within a material, and protects it not at all when a customer decides to change material entirely, which is the exposure that matters here.

The buyer has broadened from packaging procurement toward sustainability and technical functions together. Containers were bought on cost per thousand with a performance specification attached. Recovery obligations brought in people who must evidence recycled content and end-of-life outcomes, while waterborne corrosion brought in technical staff who care about lining performance across a storage period.
paint-cans-market-end-use-penetration-index-1787559674465

Where To Place The Bet

These are among the four positions where our research anticipates prominent divergence between winners and laggards over the coming forecast period. Each is grounded in the demand model, the regulatory perimeter, and the announced capacity pipeline.
01 / RECOVERY COMPLIANCE SELLING

Present recovery rates as data, not messaging

Steel separates itself from mixed waste at a materials recovery facility without anybody sorting it, producing recovery rates around 92% against roughly 34% for plastic pails that must be identified, sorted and cleaned before anything useful can happen to them. Packaging recovery obligations and recycled content requirements are moving that gap from a marketing claim into a specification input that procurement must document and evidence. Manufacturers presenting it as compliance data reach the people who now carry those obligations rather than the ones comparing prices.
02 / LINING INVESTMENT PRIORITY

Solve corrosion rather than surrendering the format

Waterborne coatings now represent roughly 78% of architectural paint and corrode steel in ways that solvent-based formulation simply never did, which drove substantial trade volume toward plastic pails that do not rust at all. Improved interior linings genuinely solve the problem while adding cost to a line already representing around 21% of container value. Conceding trade formats surrenders volume permanently, while lining investment preserves it at slightly lower margin and positions the manufacturer for the recovery-driven demand that is now returning to metal.
03 / TRADE CHANNEL DESIGN

Design for decorators, not for retail shelves

Professional decorators account for roughly 46% of total container volume and specify on handling, stacking, resealing and the practicalities of disposing of empties in concentrated quantities, none of which resembles what retail shelf presentation optimises for. That concentration of empty containers is also precisely what makes take-back and refill schemes genuinely practical in trade while remaining hopeless for households. Manufacturers designing around retail shelves are optimising for the smaller half of their own market entirely, which is a strange place to concentrate effort.
04 / DUAL MATERIAL CAPABILITY

Serve whichever answer the customer eventually picks

Corrosion chemistry favours plastic while waste stream separability favours metal, which leaves coatings customers genuinely undecided about material for trade formats and genuinely unlikely to resolve it soon in either direction at all. A manufacturer able to supply either outcome keeps the account whichever way a specification eventually lands, while a single-material position loses the entire relationship rather than merely a share of it. That binary exposure is considerably larger than any input cost difference between the two materials could ever be.

Engagement Snapshot From the Field

A live engagement with an industry participant carrying material or product regulatory and market exposure ahead of a defining policy shift, showing how our research translates into a defensible multi-year portfolio strategy.
MARKET MINDS ADVISORY · CLIENT ENGAGEMENT SUMMARY
Paint Cans Producer Strategic Portfolio Review and Transition Roadmap 2026·Investment Scenario on Paint Cans Exposure Evaluation 2025-26
CLIENT PROFILE
A European rigid container manufacturer with annual revenue around EUR 185 million (client-reported, unverified by MMA), supplying metal paint cans to architectural and industrial coatings customers. No plastic container capability existed. Lining technology was licensed rather than developed internally across the business. Trade volume had been eroding for years. Plastic capability was absent. Lining was licensed.
STRATEGIC CHALLENGE
Trade format volume had been lost to plastic pails over several years as waterborne conversion progressed, and management proposed price reductions on metal formats to slow the erosion. Nobody had established why customers were switching or whether price had featured in any of those decisions. Price had been assumed. Nobody had asked.
MMA APPROACH
MMA interviewed customers who had switched to establish the actual decision basis rather than accepting price as the explanation. Recovery obligations facing those customers were assessed against the metal and plastic recovery gap. Lining development options were costed against the trade volume at risk and already lost. Competitor lining was benchmarked.
KEY FINDINGS
  1. Every customer who switched cited corrosion during extended storage rather than container price, which meant price reduction would not have retained any of the volume that departed.
  2. Three of those customers now faced recycled content obligations they had to evidence, and the metal recovery advantage was material enough that two were actively reconsidering their decision.
  3. Licensed lining technology lagged available systems for extended waterborne storage, which was the specific failure mode customers described in every conversation about switching.
  4. Absence of any plastic capability meant a customer choosing plastic left entirely, whereas dual capability would have retained the relationship and a share of the volume regardless.
CLIENT PROFILE
A European rigid container manufacturer with annual revenue around EUR 185 million (client-reported, unverified by MMA), supplying metal paint cans to architectural and industrial coatings customers. No plastic container capability existed. Lining technology was licensed rather than developed internally across the business. Trade volume had been eroding for years. Plastic capability was absent. Lining was licensed.
STRATEGIC CHALLENGE
Trade format volume had been lost to plastic pails over several years as waterborne conversion progressed, and management proposed price reductions on metal formats to slow the erosion. Nobody had established why customers were switching or whether price had featured in any of those decisions. Price had been assumed. Nobody had asked.
MMA APPROACH
MMA interviewed customers who had switched to establish the actual decision basis rather than accepting price as the explanation. Recovery obligations facing those customers were assessed against the metal and plastic recovery gap. Lining development options were costed against the trade volume at risk and already lost. Competitor lining was benchmarked.
KEY FINDINGS
  1. Every customer who switched cited corrosion during extended storage rather than container price, which meant price reduction would not have retained any of the volume that departed.
  2. Three of those customers now faced recycled content obligations they had to evidence, and the metal recovery advantage was material enough that two were actively reconsidering their decision.
  3. Licensed lining technology lagged available systems for extended waterborne storage, which was the specific failure mode customers described in every conversation about switching.
  4. Absence of any plastic capability meant a customer choosing plastic left entirely, whereas dual capability would have retained the relationship and a share of the volume regardless.
RECOMMENDED STRATEGY
Phase 1: Phase one: abandon price reduction, since no customer switched on price and the reduction would simply have lowered margin on volume that was never at risk from cost. Phase 2: Phase two: invest in advanced lining capability for extended waterborne storage, which is the specific failure customers described when explaining their switch. Phase 3: Phase three: present recovery rate data to customers facing recycled content obligations, since two were already reconsidering and the evidence supports the argument.
OUTCOME
Price reduction was withdrawn and margin held on retained volume. Lining development is complete and one lost customer has returned for trade formats. Recovery data has been presented to four accounts, and the client reports two active reconsideration discussions (client-reported, unverified by MMA). Volume erosion has stopped.

Frequently Asked Questions

Foundational context covering the market sizes, CAGR, scope, country, region and competition that inform every finding below. This section is provided to cover basics and most often pre-purchase conversations, answered from the MMA Primary Research Dataset.

What is the current size of the Paint Cans Market?

The market was valued at USD 5.8 billion in 2025, rising to an estimated USD 6.18 billion in 2026. East Asia holds the largest regional share at 34% of value.

How large will the Paint Cans Market be by 2036?

MMA forecasts USD 11.72 billion by 2036 under the base case, an expansion multiple of 1.89 times the 2026 value. That represents USD 5.54 billion of incremental value.

What is the CAGR for the Paint Cans Market 2026 to 2036?

The base case runs at 6.6% compound annual growth between 2026 and 2036, with a bull case at 7.8% and a bear case at 5.4%. Historical growth from 2020 to 2025 was 4.8%.

Which segment is growing fastest?

Composite and hybrid containers lead at 9.9%, half again the market rate, combining metal barrier with lighter construction. Specialty small formats follow closely at 8.2%.

Who are the major companies in the Paint Cans Market?

Crown Holdings, Sonoco Products, Greif, Mauser Packaging Solutions and Massilly together hold 32% of the market. Freight economics and differing material capabilities keep concentration moderate.

Which country is growing fastest?

India leads at 9.8%, driven by decorative paint consumption rising with housing completion, by repaint cycles shortening, and by organised retail extending paint distribution further.

Report Segmentation Architecture

The full report scope spans multiple orthogonal segmentation dimensions, with cross-tabulated demand data provided for each dimension pair. Coverage extends further to regional breakdowns, trend trajectories, and the competitive detail needed to support segment-level decision-making.

By Container Type

  • Tinplate Round Cans
  • Plastic Pails and Buckets
  • Aerosol Cans for Coatings
  • Bulk and Intermediate Containers
  • Composite and Hybrid Containers
  • Specialty and Small Format Packs

By End-Use Industry

  • Architectural Decorative Coatings
  • Professional Trade Decorating
  • Industrial Protective Coatings
  • Automotive Refinish
  • Wood and Furniture Finishes
  • Marine and Specialty Coatings

By Distribution Channel

  • Direct Coatings Manufacturer Supply
  • Trade Merchant Distribution
  • Retail and Do-It-Yourself Channel
  • Contract Filling Operations
  • Take-Back and Refill Programmes

By Region

  • North America
  • Western Europe
  • East Asia
  • South Asia and Pacific
  • Latin America
  • Middle East and Africa
  • Eastern Europe

Scope, Methodology, and Coverage

Every figure in this report is reproducible from documented input assumptions. The scope below maps the historical period, the forecast horizon, the segmentation dimensions, and the countries covered, alongside the underlying primary and qualitative methodology.
Historical Period
2020 to 2025
Forecast Period
2026 to 2036
Base Year
2025 (USD billions; MMA Primary Research Dataset, August 2026)
Market Definition
The market comprises rigid containers manufactured for architectural and industrial coatings, including tinplate round cans, plastic pails and buckets, aerosol cans for coatings, bulk and intermediate containers, composite and hybrid containers, and specialty and small format packs, supplied through direct manufacturer, trade merchant, retail, contract filling and take-back channels. Value is measured at manufacturer level on container revenue including closures supplied with them. Coatings themselves, flexible packaging and pouches, interior lining coatings sold as chemicals, secondary and transit packaging, and containers for non-coating chemical products fall outside scope.
Quantitative Units
USD billions (current prices); million containers shipped; USD per thousand units by type and format
Segmentation Dimensions
By Container Type; By End-Use Industry; By Distribution Channel; By Region
Regions Covered
North America, Western Europe, East Asia, South Asia and Pacific, Latin America, Middle East and Africa, Eastern Europe
Countries Covered
China, Japan, South Korea, Taiwan, India, Indonesia, Thailand, Vietnam, Australia, United States, Canada, Mexico, Brazil, Argentina, Colombia, Chile, Germany, France, Italy, Spain, Netherlands, United Kingdom, Poland, Czechia, Romania, Turkey, Saudi Arabia, United Arab Emirates, Egypt, South Africa
Key Companies Profiled
Crown Holdings, Sonoco Products, Greif, Mauser Packaging Solutions, Massilly, Ball Corporation, Silgan Holdings, Ardagh Metal Packaging, Berry Global, Nampak, Zhongshan Zhongrong, Jokey Group, Superfos, Pacific Can, ITC Packaging, Auer Packaging, Time Technoplast, Balmer Lawrie, Hoover Ferguson, Grupo Zapata
Quantitative Methodology
Primary survey, n=3,800 respondents, Q4 2025, six countries; demand-side model with trade association cross-validation
Qualitative Methodology
47 expert interviews, Q4 2025; applied to validate demand model assumptions, identify emerging dynamics, and assess competitive positioning
Report Format
PDF and XLSX data workbook (Word format preview document)
Publisher
Market Minds Advisory
Report Code
MMA-2026-PAC-237
Published
August 2026
Contact
sales@marketmindsadvisory.com | www.marketmindsadvisory.com

Purchase the full Paint Cans Market Report (2026 to 2036).

The full report sizes the global paint container market to 2036 across six container types and seven regions, measured at manufacturer level on container revenue. It models material choice as a contest between waterborne corrosion and waste stream separability rather than as a cost comparison, which is how the decision is actually being made. Competitive analysis covers 20 manufacturers on one consistent revenue basis, with moat and risk assessment for the two leaders. Recovery rates and lining performance are quantified as specification inputs by region. Four quantified revenue levers close the analysis.
Six container type segments with individual growth rates
Material choice modelled as corrosion against waste stream separability
Recovery rates quantified as specification inputs by region
Trade and retail channel requirements separated across format design
Twenty-manufacturer competitive map on one consistent revenue basis
Four quantified revenue levers with commercial impact ranges

Built For The People Who Decide

From boardroom strategy to bench-side execution, this report is read cover-to-cover by leaders shaping the next decade of their industry, turning demand scenarios, market dynamics and valuation benchmarks into decisions.
CXOs/ Presidents/ VPs/ Managers
M&A and Corporate Development
Strategy Teams and R&D Heads
Procurement and Product Directors
Regulatory and Compliance Leaders
Investor Relations and Equity Analysts