Market Minds Advisory
Paint Additives Market

Paint Additives Market: Waterborne Reformulation and the Biocide Restriction Wave

Coatings formulators switching from solvent-borne to waterborne systems to meet tightening VOC regulation are discovering that their entire additive package has to be re-engineered rather than simply substituted one for one.

Lead Analyst

Bilal Shaikh

Published

September 2026

Make Smarter Decisions with Customized Research Insights

Request a free sample report and evaluate market opportunities, growth trends, and competitive dynamics relevant to your business needs.

2025 MARKET VALUE$6.8BMarket Size 2025
2036 FORECAST VALUE$13.2BBase Case , 2026 to 2036
CAGR 2026 TO 20366.2 %Bull 7.4% / Bear 5.0%
INCREMENTAL OPPORTUNITY$6.0BNet 10- year value creation
EXPANSION MULTIPLE1.83x2036 value over 2026 base
Strategic Levers
M&A Pipeline
Regional Outlook
Country Rankings
Competitive Intelligence
Segmental Deep-dive
Call-Us : 91 93563 13602

Executive Snapshot and Market Trajectory

Waterborne reformulation, not raw additive performance, now decides which supplier wins a coatings formulation slot. Suppliers with proven waterborne-compatible additive packages are winning briefs that solvent-era formulators cannot easily match. Buyers now treat that compatibility gap as a hard qualification filter from the outset.
Coatings manufacturers converting from solvent-borne to waterborne systems to meet tightening VOC regulation are pulling demand toward entirely re-engineered additive packages rather than simple substitutions, while China's coatings manufacturing scale makes it the fastest-growing national demand pool. North American and European regulators are simultaneously restricting specific biocide active ingredients, forcing formulators to requalify preservation systems at the same time they are reformulating for VOC compliance. That dual pressure compounds compliance cost for formulators stretched thin.
Competition concentrates among a handful of specialty chemical majors able to bundle rheology, dispersant, and biocide chemistry into one documented, compatible package, a capability that separates qualified suppliers from single-chemistry vendors selling components that formulators must test for compatibility themselves. Regulatory restriction cycles, waterborne conversion, and raw material price volatility are together reshaping which suppliers can convert single-product sales into full-package formulation contracts. That reshaping rewards documentation depth decisively.
Market Definition
The paint additives market covers rheology modifiers, dispersants and wetting agents, biocides and preservatives, defoamers, UV stabilizers, and anti-corrosion additives sold into architectural, industrial, automotive, and protective coatings formulations. It excludes coating resins, pigments, and unrelated adhesive or sealant additive categories.
Base Year Value
$6.8B in 2025 (MMA Primary Research Dataset, August 2026)
Forecast Period
2026 to 2036, eleven discrete annual values
CAGR
6.2% base case. Bull 7.4%. Bear 5.0%.
Fastest Growth Segment
UV Stabilizers: 9.0% CAGR
Fastest Growth Country
China: 8.5% CAGR
Fastest Growth Region
South Asia and Pacific: 8.2% CAGR
Largest Region
East Asia: 30% of 2025 global value
Market Leaders
BASF SE, Evonik Industries AG, Dow Inc., Elementis plc, BYK-Chemie GmbH. Source: MMA Analysis based on company annual reports.
Primary Survey
n=3,800 procurement and R&D decision-makers, Q4 2025, six countries
Methodology
Demand-side build-up, cross-validated against public data, 47 expert interviews

Paint Additives Market Forecast Scenarios

paint-additives-market-trends-size-forecast-scenario-1787558964593
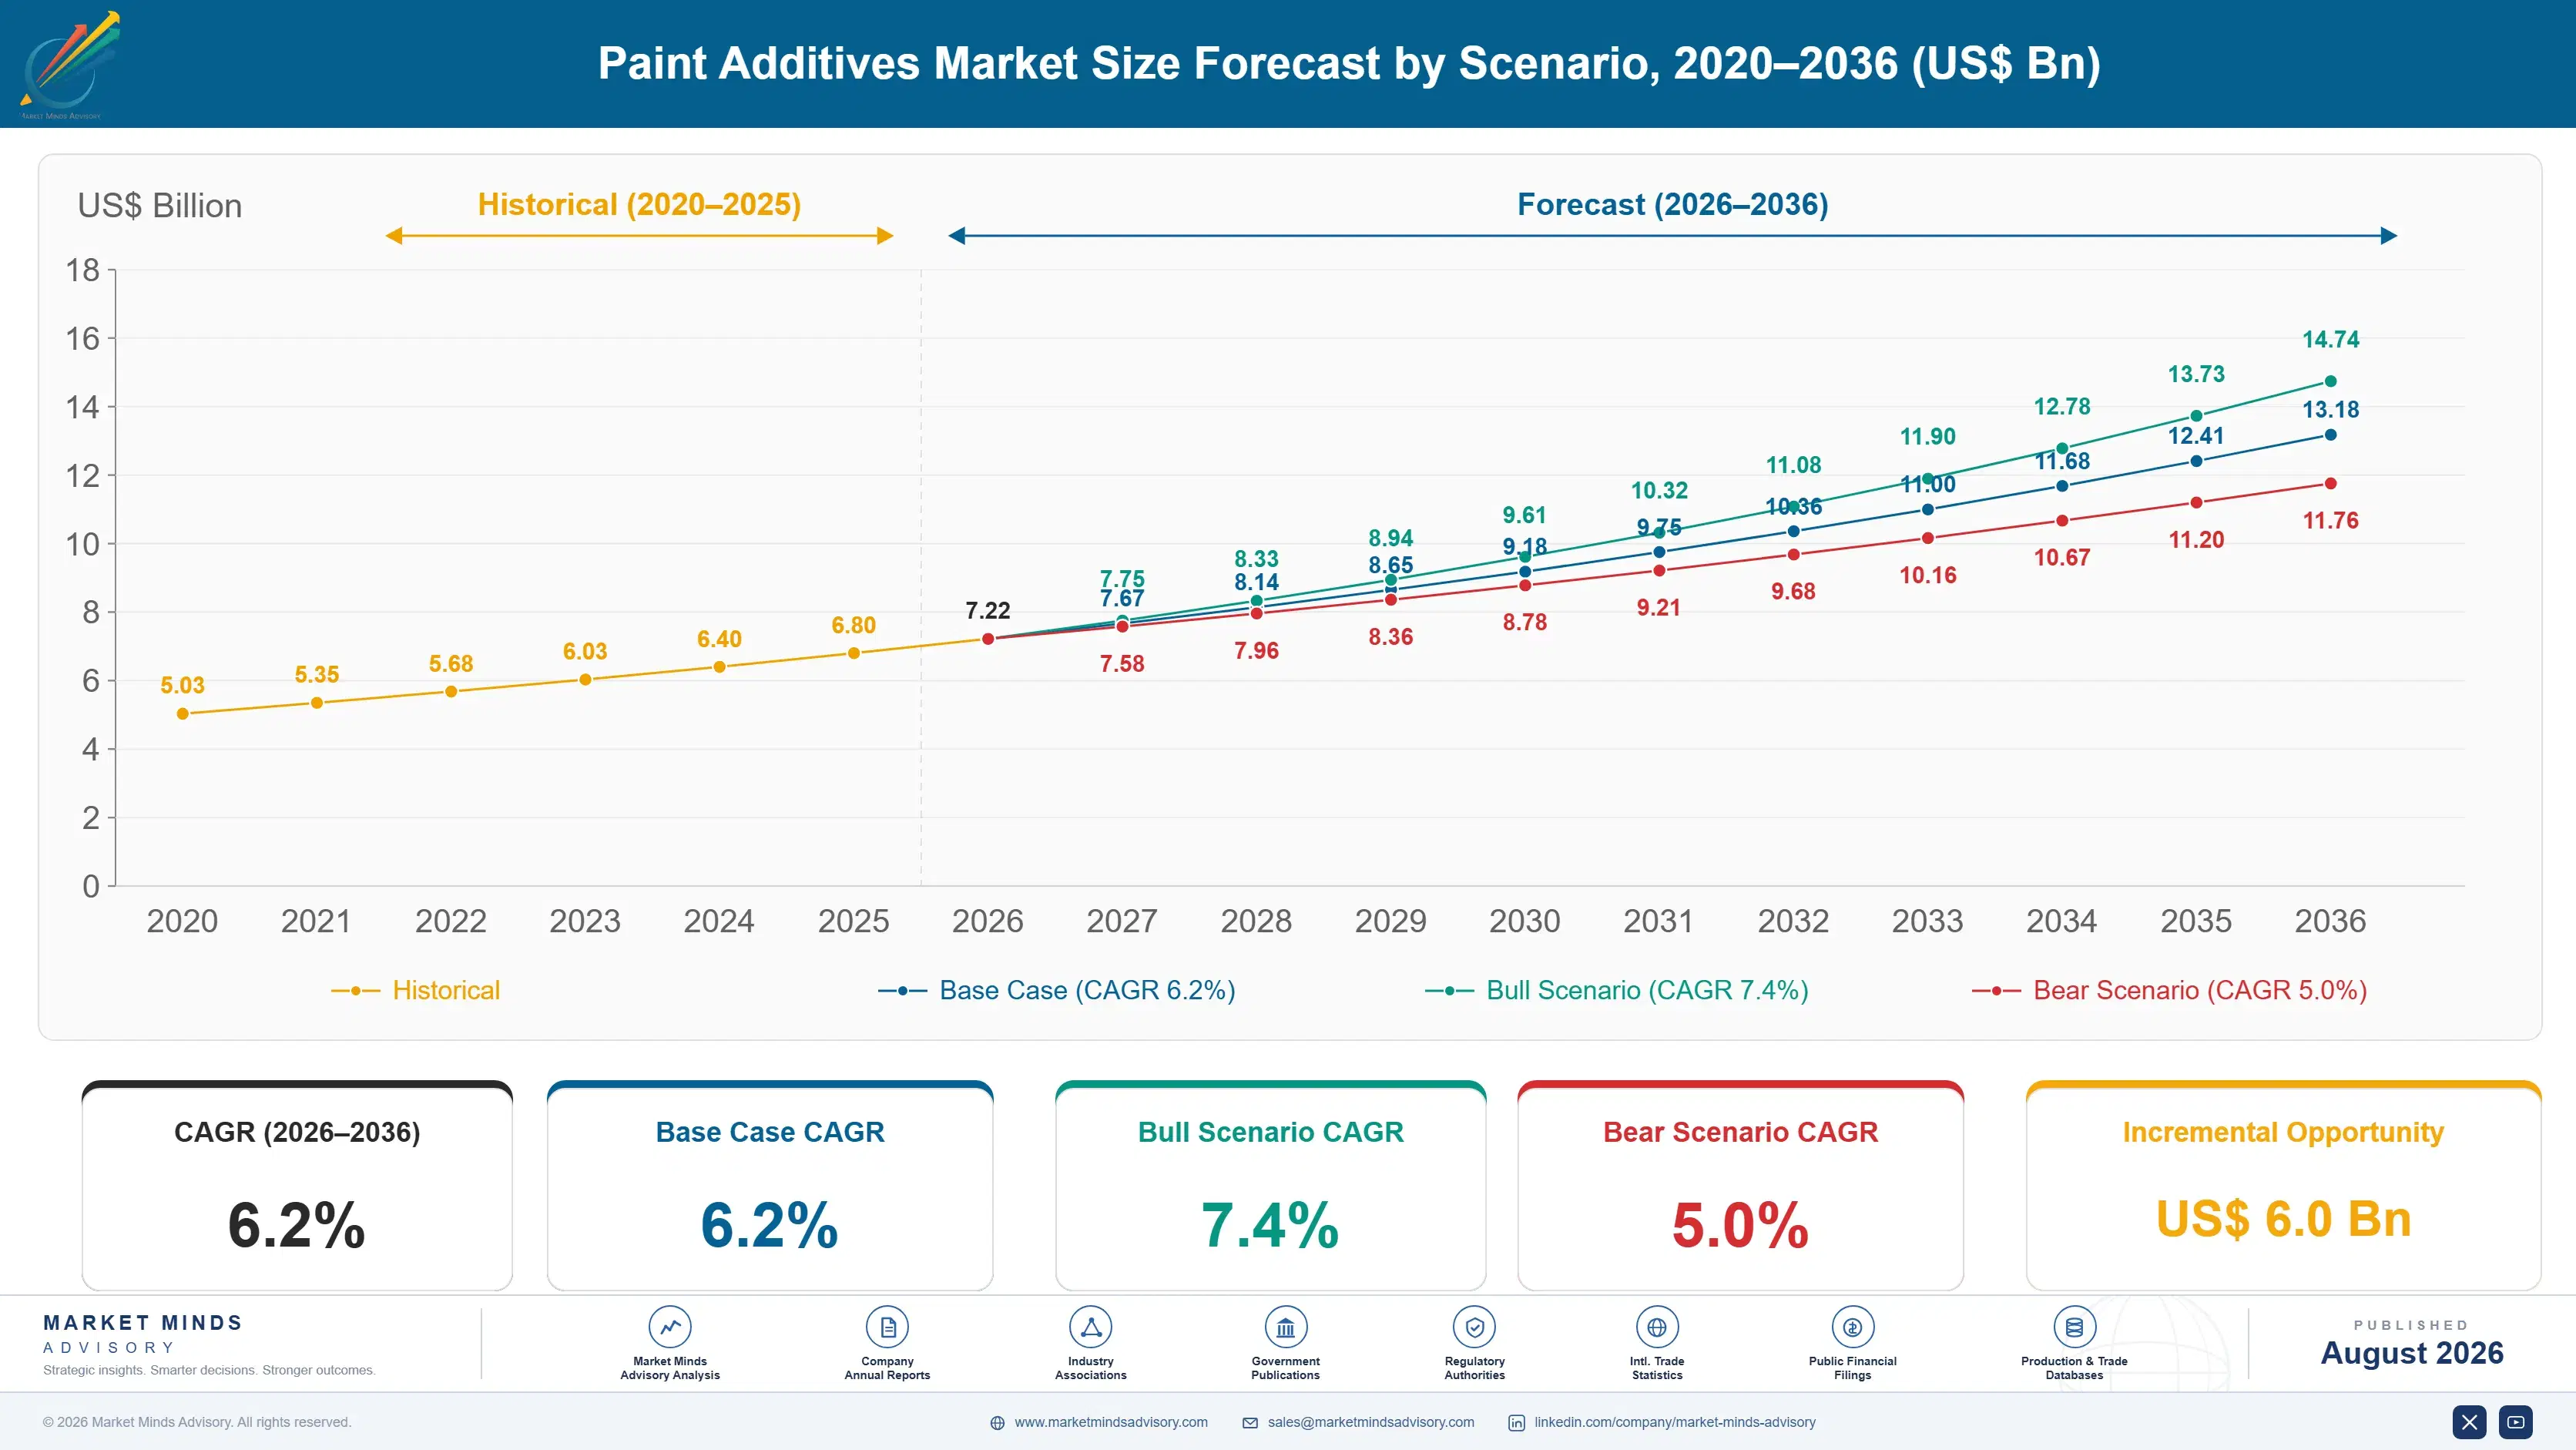
Between 2020 and 2025 the category grew near a 5.4% annual pace as waterborne coatings conversion accelerated steadily across architectural applications, before automotive and industrial coatings manufacturers began specifying premium UV stabilizer and anti-corrosion packages from 2023 onward across several major vehicle and infrastructure programmes. That shift converted paint additives from a commodity afterthought into a genuine compliance and durability investment category.
The base case carries the market to a 6.2% CAGR on three mechanisms: continued waterborne conversion across architectural and industrial coatings requiring re-engineered rheology and dispersant packages, tightening biocide restriction requirements forcing formulators toward newly qualified preservation systems, and automotive and infrastructure coatings specifying premium UV and anti-corrosion additive packages as durability requirements tighten across major export markets. These three mechanisms reinforce each other across nearly every major coatings-producing country worldwide today.
The bull case at 7.4% assumes waterborne conversion accelerates faster than currently modelled as more regions adopt European Union-style VOC regulation. The bear case at 5.0% assumes raw material price volatility and biocide reformulation cost slow adoption among price-sensitive formulators facing tighter margin pressure. Both scenarios assume no major disruption to global petrochemical feedstock supply chains.

Waterborne Reformulation and the Compatibility Premium

Three forces converge on this category. Coatings formulators need additive packages engineered specifically for waterborne chemistry rather than adapted from solvent-borne formulations, regulators across multiple regions are restricting specific biocide active ingredients simultaneously, and brand owners want durability performance that matches or exceeds legacy solvent-borne coatings. Reconciling all three demands inside one formulation specification is genuinely difficult.
TOP PRODUCER SHAREChina, 27%Share of global output concentrated in Chinese facilities
AVERAGE SELLING PRICEUSD 3.40 per kgBlended average price across major additive categories overall
PETROCHEMICAL FEEDSTOCK SHARE40% of COGSPetrochemical intermediate share of overall total production cost
WATERBORNE SEGMENT SHARE58% of volumeVolume sold directly into waterborne coatings formulations overall
FORMULATION QUALIFICATION CYCLE8 to 14 monthsTypical time to qualify a new additive package
MARKET CONCENTRATIONCR5: 34%Combined share held by five largest additive suppliers
Commercially, the category rewards documented compatibility over raw chemical performance. Suppliers that can guarantee a rheology, dispersant, and biocide package works together in a specific waterborne formulation command formulation briefs that single-chemistry vendors cannot access, which is why coatings manufacturers increasingly default to a small pool of full-package suppliers rather than sourcing opportunistically from whichever vendor offers the lowest price per chemistry. That preference has hardened as waterborne reformulation projects have proven costly to redo after failed compatibility testing. That preference rarely reverses.
Over the next decade, waterborne conversion depth, biocide restriction cycles, and premium durability additive demand will decide which suppliers convert single-chemistry sales into durable full-package formulation contracts. Suppliers without documented waterborne compatibility risk losing major coatings brand relationships entirely as compatibility testing becomes a baseline requirement rather than a differentiator. Suppliers slow to comply risk losing access permanently.
"Everyone still treats this as a bag of separate chemistries. The suppliers actually winning formulation briefs are the ones who can prove the whole package works together in the can, not just on the data sheet."
Director, Specialty Coatings Chemicals Practice · MMA Specialty Coatings Chemicals Practice · August 2026

Market Trends

VOC Regulation Accelerates Waterborne Reformulation Worldwide

Tightening volatile organic compound regulation across the European Union, United States, and an expanding list of other jurisdictions continues pushing coatings manufacturers to convert solvent-borne formulations to waterborne chemistry, a transition that requires re-engineering the entire additive package rather than substituting individual components. BASF and Evonik have both expanded dedicated waterborne additive product lines specifically to serve formulators mid-conversion, since legacy solvent-borne rheology modifiers and dispersants generally do not perform adequately in waterborne systems without significant reformulation work. This shift is pulling qualified suppliers with proven waterborne compatibility data toward those actively converting.
Market Impact: Adds 16% to waterborne procurement
Bio-Based Additive Development Responds to Brand Sustainability Commitments

Coatings brand owners increasingly specify bio-based rheology modifiers, dispersants, and defoamers as part of published corporate sustainability commitments, pushing suppliers to develop plant-derived alternatives to petrochemical-based additive chemistry. Dow and BYK-Chemie have both expanded bio-based product lines specifically to meet this brand-level sustainability requirement, even though bio-based alternatives typically cost more and face feedstock availability constraints relative to petrochemical equivalents. This shift remains a minority of total volume today but is growing fastest among premium architectural and consumer-facing coatings brands willing to pay the resulting cost premium. That gap is expected to narrow only gradually as feedstock supply expands.
Market Impact: Premium orders grow past 12% share

Market Opportunities and Growth Drivers

Waterborne Architectural Coatings Conversion Sustains Volume Growth

Architectural coatings manufacturers continue converting from solvent-borne to waterborne formulations to meet tightening VOC regulation and consumer preference for lower-odour, faster-drying paint products, and each conversion requires a fully re-engineered rheology, dispersant, and biocide package rather than a simple substitution. Major architectural coatings brands have published formulation guidelines favouring waterborne systems across new product development, giving additive suppliers with documented waterborne performance data a direct competitive advantage in formulation briefs. That conversion trend has proven durable across multiple product cycles rather than a passing regulatory response, reinforcing sustained additive procurement growth.
Market Impact: Reformulation adds 6 to 12 months

Automotive Coatings Durability Requirements Drive Premium Additive Demand

Automotive original equipment manufacturers continue tightening exterior coatings durability specifications, requiring premium UV stabilizer and anti-corrosion additive packages that extend coating life against weathering, stone chip damage, and road salt exposure well beyond legacy formulation standards. BASF and Elementis have both expanded automotive-grade additive lines specifically to serve this durability-driven demand, which requires more rigorous testing documentation than standard architectural-grade material typically carries. This shift is pulling qualified suppliers toward automotive OEM accounts that pay meaningfully more per kilogram than architectural or industrial-grade sale. That premium accounts channel has grown steadily as warranty periods extend across the industry.
Market Impact: Feedstock swings move margin 8 points

Market Restraints and Challenges

Biocide Active Ingredient Restrictions Force Repeated Reformulation

European Union and other regulators have progressively restricted specific biocide active ingredients, including certain isothiazolinone compounds long used in waterborne paint preservation, citing documented skin sensitisation and environmental toxicity concerns identified through expanded safety review. The root cause is genuine toxicological evidence rather than precautionary overreach, since affected compounds have shown measurable sensitisation rates in exposed populations that regulators consider unacceptable. Suppliers are mitigating this by developing next-generation biocide chemistry with improved safety profiles, though each restriction cycle forces formulators to requalify preservation systems across their entire waterborne product range.
Market Impact: Waterborne conversion reaches 58% of volume

Petrochemical Feedstock Volatility Compresses Manufacturing Margin

Petrochemical intermediates used across rheology modifiers, dispersants, and defoamers have swung sharply in price over recent years as global crude oil and natural gas prices moved independent of any change in underlying additive demand, since these feedstocks serve much larger chemical industries whose demand dwarfs the paint additives category. The root cause is broad petrochemical market volatility rather than any category-specific supply issue, meaning additive manufacturers absorb the same commodity price swings affecting far larger petrochemical-consuming industries. Manufacturers are mitigating this through longer-term feedstock supply contracts and increased use of bio-based alternatives where customer specifications allow substitution.
Market Impact: Bio-based volume share exceeds 14%
3 additional market trends, 3 additional growth drivers, and 3 additional restraints and challenges are covered in the full report. Contact sales@marketmindsadvisory.com to access the complete intelligence.

Segment CAGR and Growth Architecture

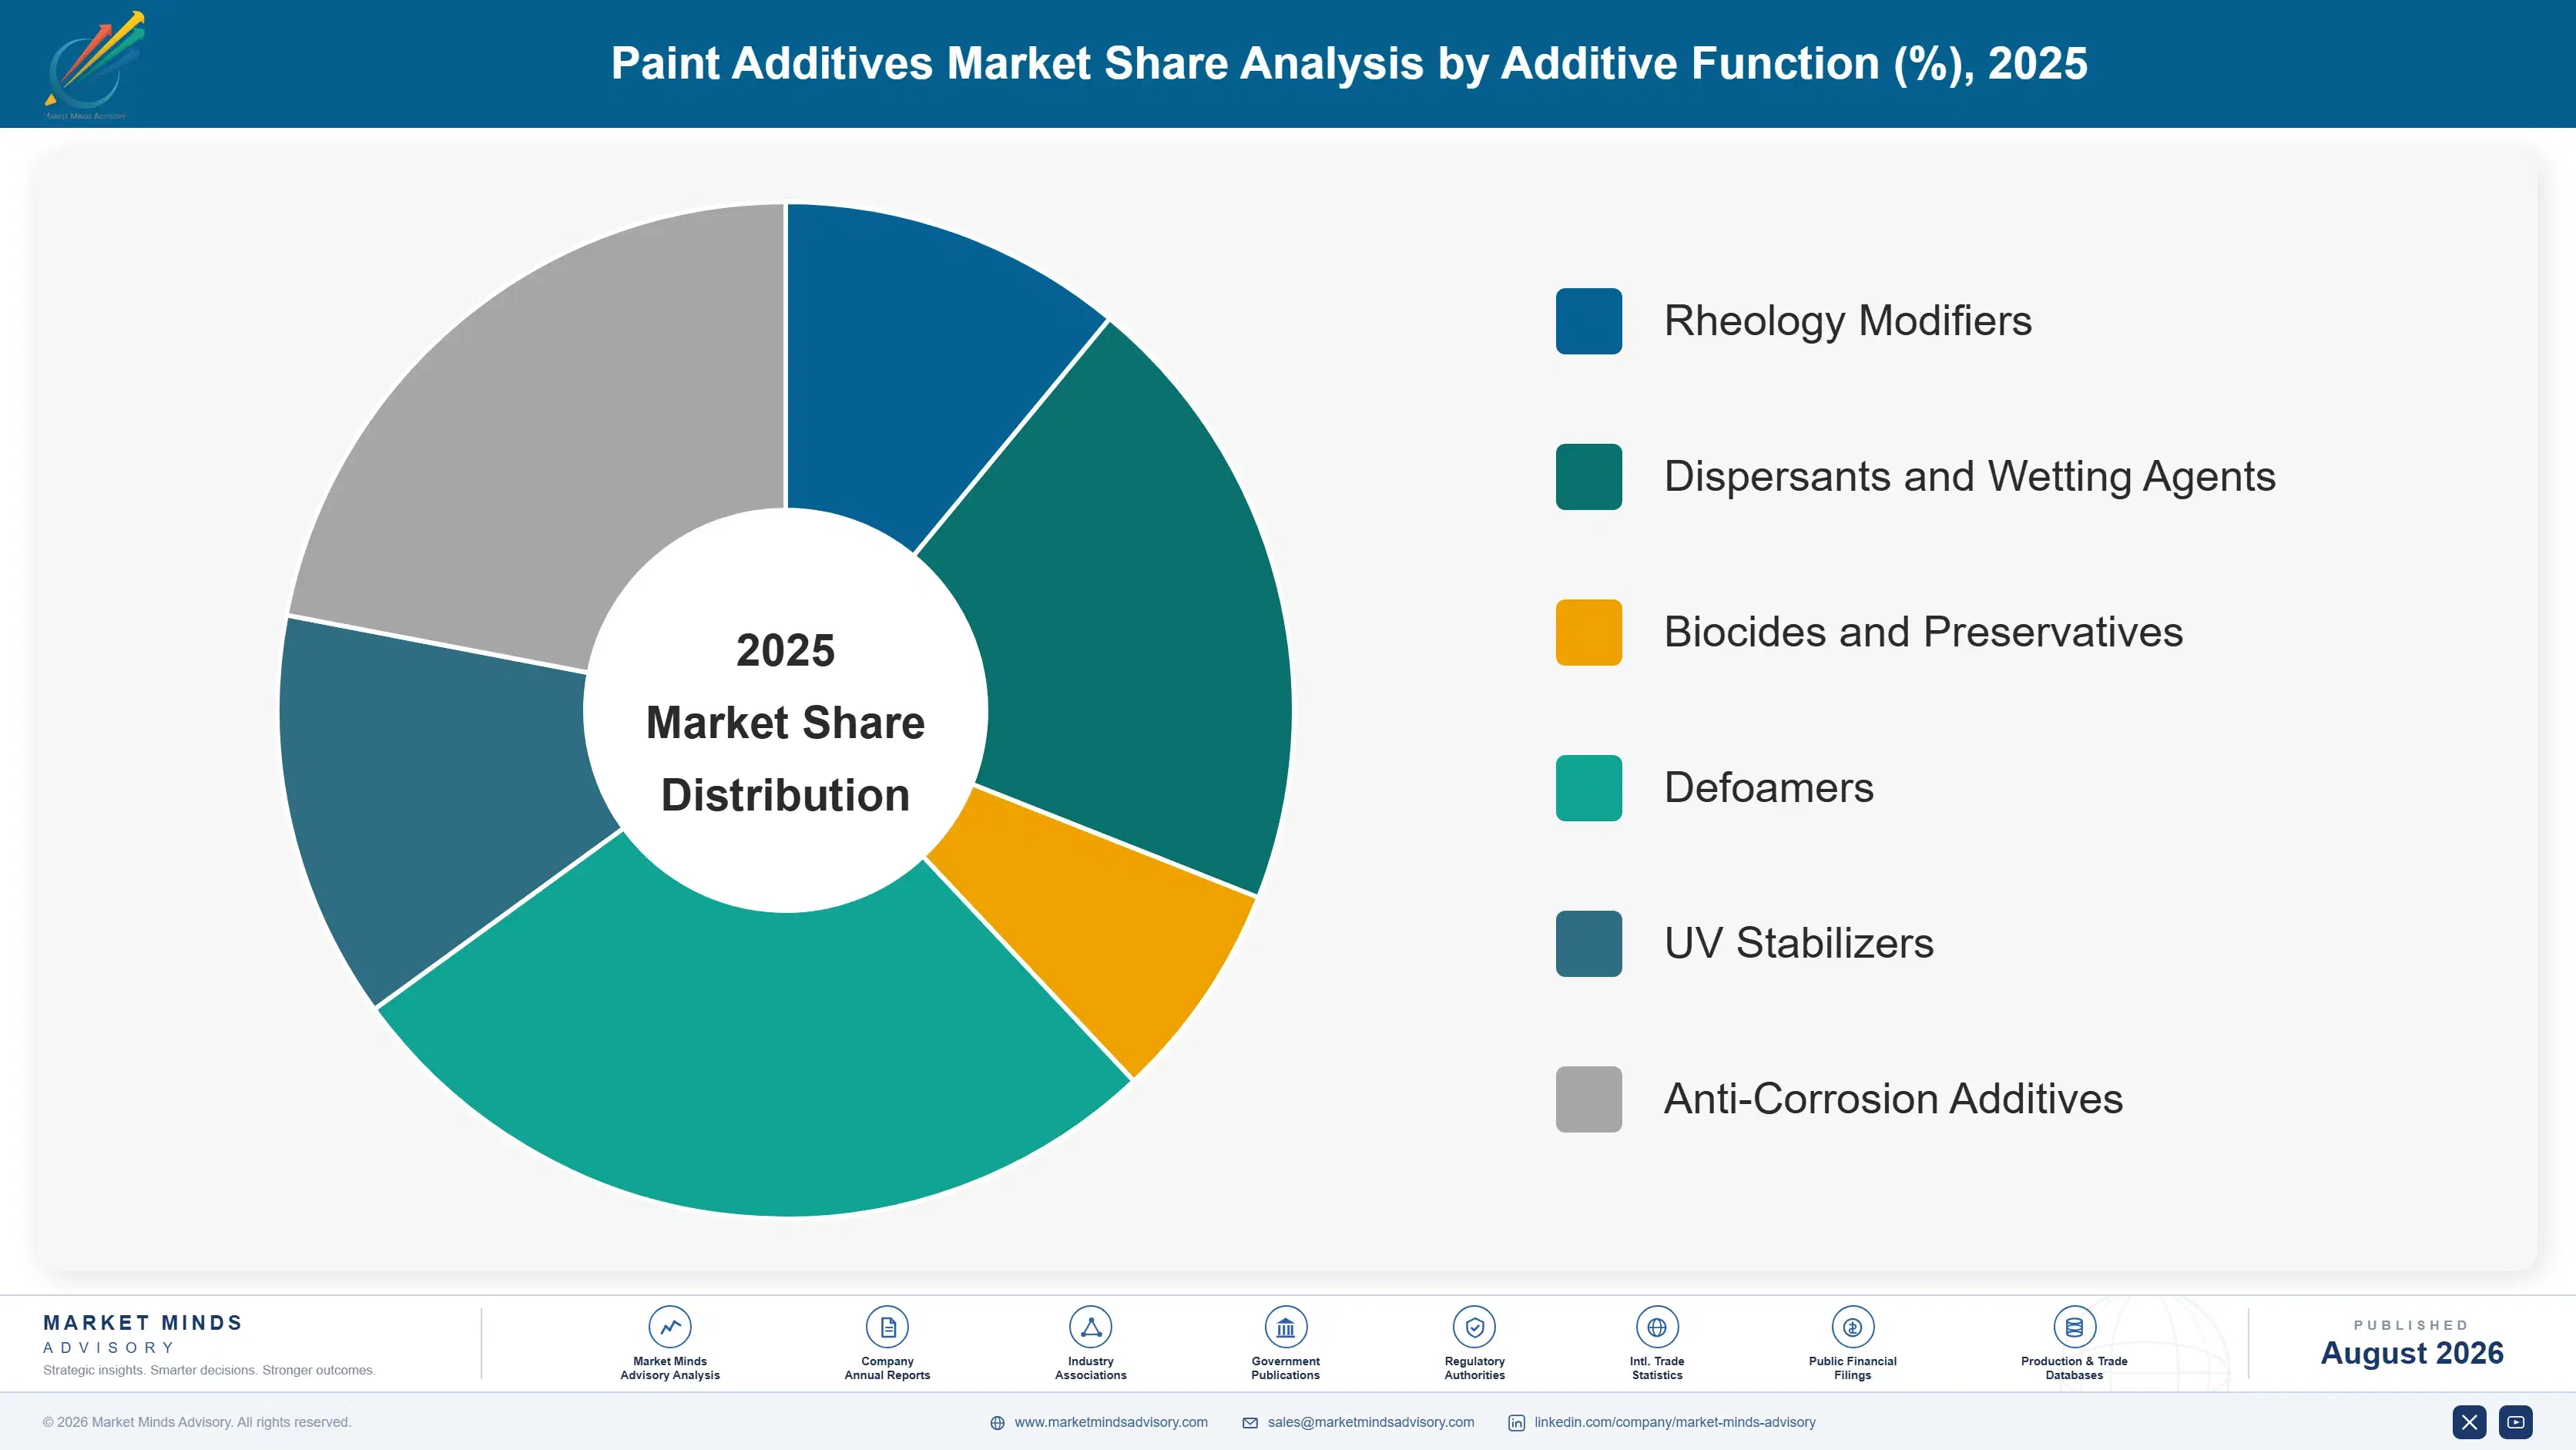
Segmentation follows additive function, a single formulation chemistry logic, since rheology, dispersant, biocide, defoamer, UV stabilizer, and anti-corrosion chemistries each require distinct molecular engineering and qualification pathways rather than differing by distribution channel or customer type. That alignment keeps formulation investment matched to chemistry platform. That alignment lets buyers evaluate suppliers on consistent, comparable formulation criteria across every chemistry.
paint-additives-market-trends-market-share-analysis-1787558965131

UV Stabilizers

UV stabilizers grow fastest at 9.0%, about 1.45 times the overall 6.2% rate, as automotive and architectural exterior coatings both specify enhanced weathering resistance to extend coating life under increasingly demanding durability warranties. These additives protect coating film from ultraviolet degradation that causes chalking, fading, and premature failure, a performance requirement that grows more stringent as brands extend published durability warranties. BASF and Evonik lead qualified UV stabilizer supply, competing on documented weathering performance and formulation compatibility data rather than price alone. Growth concentrates in automotive OEM and premium architectural coatings, where warranty extension directly drives specification upgrades. Export volume into automotive OEM export markets compounds this advantage further with each qualification cycle completed.
CAGR 9.0%

Biocides and Preservatives

Biocides and preservatives grow at 7.8%, the second-fastest chemistry, as waterborne coatings conversion expands the addressable market for in-can and dry-film preservation simultaneously with regulatory restrictions forcing repeated reformulation toward newly qualified active ingredients. Dow and Troy Corporation lead qualified next-generation biocide supply, competing on documented safety profile and regulatory compliance depth rather than raw preservation efficacy alone. Unlike UV stabilizers, this segment faces recurring qualification cycles as regulators restrict additional active ingredients, so regulatory monitoring capability matters as much as the underlying chemistry itself. Suppliers unable to sustain regulatory monitoring capability across every major jurisdiction rarely retain formulation contracts once a restriction cycle forces reformulation, since coatings manufacturers cannot risk supply disruption mid-production run.
CAGR 7.8%
Full segment breakdown across 6 segments available in the complete report.

Regional Architecture and Country Demand Map

East Asia leads on Chinese coatings manufacturing scale, while North America and Western Europe drive the deepest waterborne reformulation and biocide restriction compliance activity. Latin America and South Asia and Pacific contribute smaller but steadily expanding demand of their own across the coming decade ahead.

North America

Automotive OEM durability requirements and continued architectural waterborne conversion give North America 24% of global value, reflecting the region's deep coatings brand presence rather than domestic petrochemical feedstock advantage alone. Dow and Elementis's American operations supply both domestic coatings manufacturers and export packages meeting United States Environmental Protection Agency VOC compliance requirements. United States automotive manufacturers increasingly specify premium UV and anti-corrosion additive packages as extended warranty commitments push durability specifications higher. Growth of 6.8% tracks waterborne conversion and automotive durability specification more directly than any broader coatings volume trend. Canadian coatings manufacturers increasingly follow comparable regulatory timelines, reinforcing consistent North American demand for certified waterborne additive packages across the continent.
Share: 24% | CAGR: 6.8% (2026 to 2036)

Western Europe

Europe's leading role in both VOC regulation and biocide restriction, having originated much of the regulatory framework now spreading globally, explains why Western Europe holds 22% of global value despite a coatings manufacturing base smaller than East Asia's. BASF and Evonik, both headquartered within the region, hold deep regulatory compliance relationships with European coatings manufacturers navigating overlapping VOC and biocide restriction timelines simultaneously. German and French formulators increasingly specify next-generation biocide chemistry ahead of confirmed restriction dates to avoid reformulation disruption. Growth of 4.7%, the slowest major region, reflects an already mature regulatory compliance base rather than any underlying demand weakness. That regulatory maturity increasingly shapes global formulation standards well beyond the region itself.
Share: 22% | CAGR: 4.7% (2026 to 2036)
Regional intelligence for 5 additional markets available in the complete report: East Asia, South Asia and Pacific, Latin America, Middle East and Africa, Eastern Europe. Contact sales@marketmindsadvisory.com.
paint-additives-market-trends-country-cagr-analysis-1787558965644

Where Package Compatibility Creates Margin

Margin in this category increasingly sits in documented waterborne compatibility and full-package formulation support rather than in raw chemical manufacturing scale alone. Suppliers converting that capability into full-package formulation contracts are pulling ahead of competitors still selling single-chemistry components into price-only distribution channels. That gap is widening fastest wherever waterborne conversion pressure is tightening quickest across every region.

Bundle Full-Package Waterborne Compatibility Testing Programmes

Suppliers that bundle documented rheology, dispersant, and biocide compatibility testing into one qualified waterborne package secure formulation briefs that single-chemistry competitors cannot bid for once a formulator requires proven full-package performance. BASF's bundled testing programme illustrates how documentation investment made before formulators request it converts directly into preferred-supplier status once waterborne conversion projects begin. Suppliers building this capability only after losing a brief typically spend 10 to 16 months rebuilding compatibility documentation before requalifying. Requalification after losing a brief typically takes far longer than most suppliers expect, often exceeding a full year of renewed testing.
Market Impact: Bundled suppliers win 65% of new waterborne briefs

Develop Next-Generation Biocide Chemistry Ahead of Restrictions

Suppliers investing in next-generation biocide chemistry ahead of confirmed regulatory restriction dates capture reformulation contracts that competitors still selling soon-to-be-restricted actives cannot fulfil once a restriction takes effect. Troy Corporation's early biocide development illustrates how engineering investment made years before a restriction deadline converts directly into formulation contracts that unprepared competitors cannot access. Suppliers without a next-generation pipeline increasingly find themselves scrambling to source replacement chemistry after restrictions take effect. That development work typically takes 18 to 24 months but secures multi-year formulation relationships once restrictions take effect industry-wide. That timing advantage rarely erodes quickly.
Market Impact: Early biocide development wins 55% of all reformulations

Qualify Premium UV and Anti-Corrosion Packages for OEM Contracts

Suppliers that qualify premium UV stabilizer and anti-corrosion packages against specific automotive OEM durability specifications ahead of confirmed demand capture supporting infrastructure sales that generic architectural-grade additives cannot serve adequately. Elementis's automotive-grade qualification programme illustrates how purification and testing investment converts directly into OEM contracts that unqualified competitors cannot access. That qualification typically takes 12 to 18 months but opens a meaningfully higher-margin customer segment. Suppliers entering automotive qualification only after losing a major OEM contract typically spend well over a year rebuilding the testing documentation required to requalify successfully.
Market Impact: OEM qualification lifts blended margin by roughly 15%

Expand Bio-Based Alternatives for Sustainability-Committed Brands

Suppliers offering bio-based rheology modifiers, dispersants, and defoamers alongside petrochemical-based equivalents capture premium pricing from brands pursuing published sustainability commitments without abandoning proven chemistry entirely. Bio-based material commands a documented price premium of roughly 18% to 28% over petrochemical equivalents, reflecting additional feedstock cost and more constrained supply relative to petrochemical volume. Suppliers without bio-based capability cannot compete for this sustainability-sensitive segment regardless of their petrochemical product's performance quality. Dow and BYK-Chemie's bio-based supply relationships illustrate how feedstock diversification converts directly into premium contracts that petrochemical-only competitors cannot access at comparable margin, regardless of their underlying chemistry quality.
Market Impact: Bio-based additives command an 18% to 28% premium

Who Controls the Margin Pool

Concentration sits at a moderate CR5 of 34%, reflecting a category where full-package compatibility depth, not raw manufacturing scale, separates a small group of specialty chemical leaders from a long tail of single-chemistry and regional suppliers. BASF leads on documented waterborne compatibility breadth, and the gap to mid-tier challengers is measured in formulation testing investment rather than in production capacity alone. That gap has persisted. That gap has persisted.
All participants are assessed on unit shipment volume across single-chemistry and full-package bundled sales, a consistent basis given how widely compatibility documentation varies by supplier. Current competitive activity concentrates on three fronts: bundling full-package waterborne compatibility testing, developing next-generation biocide chemistry ahead of restrictions, and qualifying premium UV and anti-corrosion packages for OEM contracts. That pattern spans every major consuming region. That pattern spans every region.

Emerging pressure comes from Chinese domestic producers scaling commodity-tier volume faster than expected, backed by proximity to the world's largest coatings manufacturing base. Rankings are likely to shift toward suppliers who combine full-package compatibility depth with biocide regulatory readiness, since neither manufacturing scale nor brand heritage alone is deciding formulation contract awards anymore. Newer entrants exemplify that shift.
paint-additives-market-trends-company-positioning-matrix-1787558966166

Competitive Moat and Risk Dimensions

BASF SE

Moat: Broadest waterborne compatibility testing

BASF's decades of formulation science and established waterborne compatibility testing infrastructure give it documented package performance across more coatings categories than any single competitor can currently match. That breadth lets it qualify for formulation briefs spanning architectural, automotive, and industrial coatings simultaneously from one qualified testing base.
BASF SE

Risk: Diversified Portfolio Distraction Risk

Paint additives represent one of many business lines within BASF's much broader chemicals portfolio, meaning internal capital allocation and management attention could shift toward larger business lines during any broader corporate restructuring, leaving additive-focused specialists room to capture share in specific high-growth segments. That risk has not yet materialised but remains a genuine consideration.
EVONIK INDUSTRIES AG

Moat: Deep rheology modifier engineering

Evonik's specialised rheology modifier engineering, built over decades of coatings formulation partnership, gives it a technical depth in waterborne thickener chemistry that competitors without comparable research investment cannot easily replicate. That depth lets it solve compatibility problems that generic rheology suppliers cannot resolve without extended trial-and-error testing.
EVONIK INDUSTRIES AG

Risk: Narrower Chemistry Portfolio Exposure

Evonik's competitive strength concentrates heavily in rheology and specialty silica chemistry specifically, leaving it more exposed than full-package competitors like BASF should formulators increasingly demand single-supplier bundled packages spanning every additive category rather than best-of-breed component sourcing. Should formulators consolidate purchasing toward fewer full-package vendors, Evonik's narrower scope could become a genuine competitive disadvantage.

Players Tracked

Prominent Players

BASF SE
Evonik Industries AG
Dow Inc.
Elementis plc
BYK-Chemie GmbH

Other Key Players

Clariant AG
Arkema S.A.
Solvay S.A.
Ashland Global Holdings
Lubrizol Corporation
Allnex Netherlands B.V.
Munzing Chemie GmbH
King Industries Inc.
Troy Corporation
Michelman Inc.
Kemira Oyj
Nouryon
Wacker Chemie AG
Momentive Performance Materials
Emerald Kalama Chemical

Recent Developments

FEBRUARY 2025

BASF Expands Waterborne Compatibility Testing Laboratory

BASF announced a capacity expansion at its European formulation testing facility specifically to increase waterborne compatibility testing throughput for coatings customers converting from solvent-borne systems. The investment was an organic capacity expansion, not an acquisition or joint venture, reinforcing BASF's preference for wholly owned testing infrastructure.
Signal: Organic capacity build, not M&A, shows waterborne testing demand now justifies dedicated investment. across every major market.
JUNE 2025

Troy Corporation Signs Multi-Year Biocide Supply Agreement

Troy Corporation signed a multi-year supply agreement with a major coatings manufacturer to provide next-generation biocide chemistry ahead of the manufacturer's planned reformulation programme. The arrangement was a supply agreement, not an acquisition or joint venture, securing guaranteed volume ahead of upcoming restriction deadlines. directly.
Signal: A supply agreement, not M&A, shows biocide restriction now drives multi-year procurement planning. more than headline pricing.
OCTOBER 2025

Elementis Acquires Minority Stake in Bio-Based Additive Startup

Elementis acquired a minority equity stake in a bio-based additive technology startup, aiming to integrate plant-derived rheology chemistry into its existing additive product line. The transaction was an equity investment rather than a full acquisition or merger, giving Elementis early technology access without full integration risk.
Signal: A minority stake, not a full acquisition, shows established players hedging bio-based technology bets. rather than committing full capital.

Petrochemical Feedstock and Formulation Testing Exposure

Petrochemical intermediates including acrylic monomers and specialty surfactant feedstocks account for roughly 40% of unit cost, sourced from established petrochemical producers across the United States, Germany, and China, with formulation testing and quality documentation adding a further 14% to 18% depending on compatibility certification depth. Specialty surfactant precursors add further cost variability beyond acrylic monomer pricing.
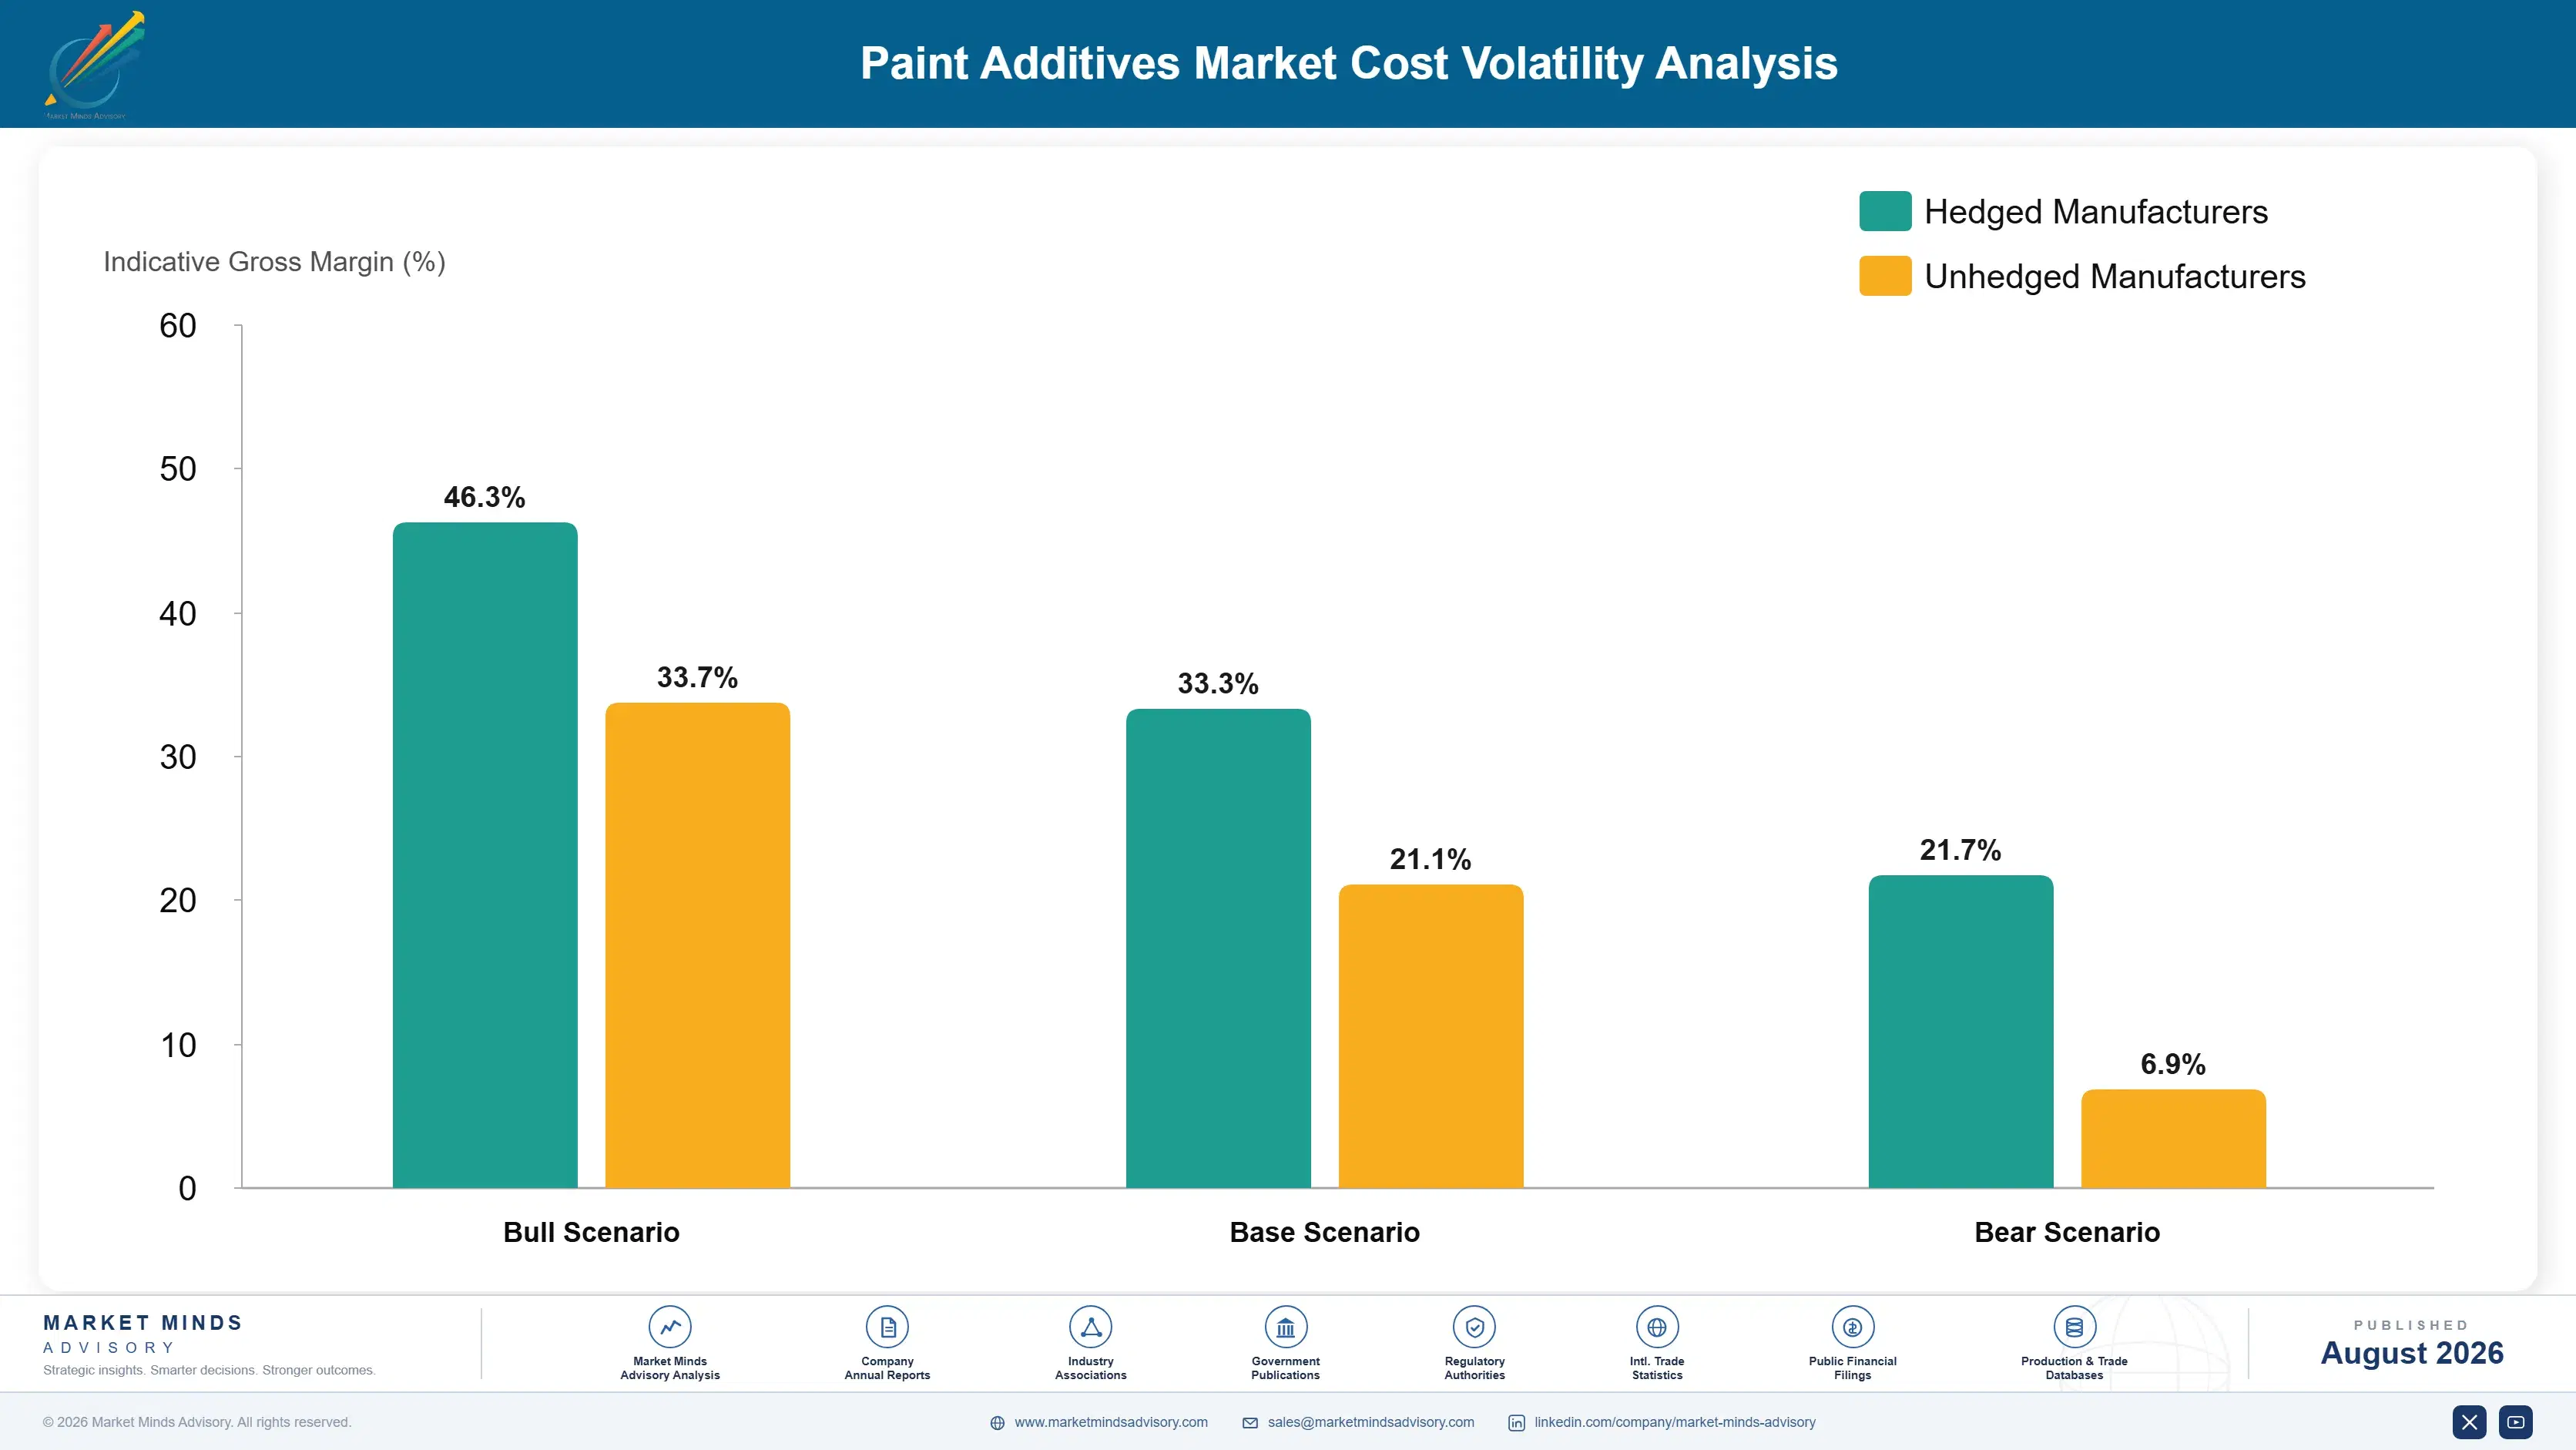
Petrochemical feedstock prices climbed sharply through 2021 and 2022 as global crude oil and natural gas prices moved on broader energy market disruption unrelated to coatings demand, before easing through 2023 and 2024 as energy markets normalised. The American Chemistry Council has documented that volatility as a recurring feature of the broader petrochemical cycle rather than a one-time disruption, and additive manufacturers without hedged feedstock contracts absorbed the cost spike directly into margin.

Exposure varies by manufacturer scale and sourcing diversity. Larger integrated manufacturers like BASF and Dow hedge feedstock exposure through long-term petrochemical supply contracts and vertical integration into upstream production, while smaller specialty producers buying on spot markets absorb price swings immediately into unit cost. That gap leaves smaller producers at a persistent cost disadvantage precisely when feedstock prices spike, even as they participate less in any subsequent price relief.
paint-additives-market-trends-cost-volatility-analysis-1787558966362

Secure long-term petrochemical feedstock supply contracts

Locking acrylic monomer and surfactant feedstock volume through long-term supplier contracts protects production schedules from spot market shortages during periods of peak coatings manufacturing demand. This trades some pricing flexibility for delivery certainty that full-package formulation contracts increasingly require as a condition of the relationship. Several manufacturers have already extended these arrangements to multi-year terms.

Diversify petrochemical sourcing across multiple producing regions

Qualifying petrochemical feedstock suppliers across the United States, Germany, and China simultaneously reduces exposure to any single region's energy market disruption or export policy shift. Manufacturers with diversified sourcing recovered from the 2021 to 2022 spike measurably faster than single-source buyers did. Manufacturers with diversified sourcing recovered from the 2021 spike measurably faster overall.

Expand bio-based feedstock substitution where customer specifications allow

Shifting a portion of product mix toward bio-based feedstock alternatives, where certification and performance requirements permit, reduces exposure to petrochemical price cycles over time. Producers with growing bio-based product lines are gradually insulated from future petrochemical volatility in a way petrochemical-only competitors are not. Producers with growing bio-based lines report measurable margin stability improvements over time.

Portfolio Architecture for Margin Defence

The portfolio splits into three tiers with clear margin separation tied to compatibility documentation and application type. Single-chemistry commodity additives compete on price and earn thin margins, full-package waterborne bundles for mainstream coatings earn considerably more, and next-generation premium durability and bio-based additives carry the highest margin given their engineering depth and certification barriers to entry. That separation is widening as certification becomes an industry-wide baseline requirement.
The tension between volume and premium reflects application type: premium automotive and architectural brands reward documented compatibility and durability performance over price, pulling suppliers toward sustained testing investment, while much of the industrial and commodity coatings market still buys on price and delivery volume alone. Suppliers running both product lines must manage genuinely distinct testing, formulation, and sales organisations without letting either investment starve the other. Few suppliers manage that balance well.

High-value margin pools concentrate in full-package waterborne bundles and premium automotive durability additives, where documented compatibility and performance both reward proven supplier capability directly. The volume core of single-chemistry commodity additives remains necessary for manufacturing scale but contributes comparatively little to blended margin across the portfolio as a whole. That concentration is unlikely to reverse soon across any major region.

Volume / Commodity-Adjacent Tier

Single-chemistry commodity additives sold without full-package compatibility documentation, competing on price with limited testing investment and thin batch-to-batch consistency guarantees behind them. and thin brand differentiation across most regional markets.
Gross Margin: 8-16%

Premium / Certified Tier

Full-package waterborne bundles combining rheology, dispersant, and biocide chemistry sold under documented compatibility certification into mainstream coatings formulation contracts. requiring documented compatibility testing that smaller producers rarely complete consistently across batches.
Gross Margin: 20-30%

Sustainability / Regulatory / Next-Generation Tier

Premium automotive durability packages and bio-based additive alternatives engineered for extended warranty performance and sustainability-committed brand requirements. with engineering depth and regulatory readiness that most competitors are still years away from matching.
Gross Margin: 26-38%
paint-additives-market-trends-portfolio-architecture-1787558966858

High-value Sub-segments and Strategic Watch-out

UV Stabilizers

High value and the fastest-growing chemistry at 9.0% CAGR, carrying both a durability-warranty premium and genuine formulation engineering barriers to entry. The wide margin range reflects varying testing maturity across suppliers rather than differences in underlying petrochemical cost. Suppliers investing earliest capture the deepest automotive relationships.
Gross Margin: 26-38%

Next-Generation Biocides

High value with strong growth, sustained by recurring regulatory restriction cycles forcing reformulation. Margin varies with how much regulatory monitoring and pipeline development depth a supplier holds ahead of confirmed restriction dates. Suppliers without documented pipeline depth rarely win the largest reformulation contracts available today.
Gross Margin: 20-30%

Standard Rheology and Dispersant Additives

The volume core, competing on price across most mainstream coatings formulations worldwide. Margin stays thin and the range is narrow because feedstock cost, not compatibility depth, dominates pricing decisions in this tier. Suppliers competing here rarely invest heavily in compatibility depth beyond basic requirements today.
Gross Margin: 8-16%

Bio-Based Alternative Chemistry

The strategic watch-out, where feedstock availability constraints and cost premiums leave broader commercial adoption genuinely dependent on continued brand sustainability commitment funding. Margin range is wide because pricing power varies sharply by individual customer relationship. Few suppliers report meaningful commercial volume in this category today.
Gross Margin: 12-26%

Formulation Lock-In and Reformulation Cycles

Demand behaves like an annuity once a supplier wins a formulation slot: coatings manufacturers rarely reformulate a stable product line mid-cycle, since replacing an approved additive package means repeating months of stability and compatibility testing against a formula that already works. That repeat-purchase pattern gives incumbent qualified suppliers a durable revenue base that competitors cannot easily displace once a formulation has launched. Suppliers depend on that pattern.
Adoption depth varies sharply by application. Automotive OEM and premium architectural buyers have converted deepest, since durability warranty and brand reputation requirements make qualified full-package sourcing close to mandatory rather than optional. Mainstream architectural buyers adopt more cautiously, weighing cost more heavily, while industrial and commodity coatings buyers remain the shallowest adopters, often defaulting to whatever single-chemistry material is cheapest at the point of purchase. That gap persists.

Buyer profiles are shifting generationally. Younger formulation chemists increasingly default to documented full-package waterborne specifications without evaluating single-chemistry alternatives at all, treating compatibility data as a baseline requirement rather than an optional upgrade. That default is spreading faster among premium and brand-conscious coatings manufacturers than among industrial buyers, who still weigh upfront cost most heavily at purchase. That shift favours documented suppliers.
paint-additives-market-trends-end-use-penetration-index-1787558967347

Compatibility Depth Beats Chemical Performance

These are among the four positions where our research anticipates prominent divergence between winners and laggards over the coming forecast period. Each is grounded in the demand model, the regulatory perimeter, and the announced capacity pipeline.
01 / FULL-PACKAGE BUNDLING STRATEGY

Suppliers without waterborne compatibility data will lose formulation briefs by 2029

Major coatings manufacturers increasingly require documented full-package waterborne compatibility testing before approving any new additive combination, and suppliers without that documentation cannot bid on premium formulation briefs regardless of price offered. BASF's bundled testing investment illustrates how documentation completed years before requirements tightened converts directly into preferred-supplier status that competitors cannot quickly replicate. As more brands formalise compatibility requirements, this documentation gap compounds rather than narrows, a gap unlikely to close without significant new testing investment from smaller regional competitors specifically.
02 / BIOCIDE RESTRICTION TIMING

Early next-generation biocide development will decide reformulation contract share

Regulatory restriction cycles increasingly determine which biocide suppliers can continue supplying waterborne coatings, and suppliers without a next-generation development pipeline cannot serve customers once a restriction deadline arrives. Troy Corporation's early development investment shows how engineering work completed ahead of restriction dates converts directly into reformulation contracts that unprepared competitors cannot fulfil. That advantage will compound as additional biocide restrictions continue rolling out, especially as more jurisdictions adopt comparable restriction frameworks across every product line they support well into the next decade.
03 / PREMIUM DURABILITY POSITIONING

Automotive OEM qualification will separate premium suppliers from commodity sellers

Automotive manufacturers extending exterior coatings durability warranties increasingly specify premium UV stabilizer and anti-corrosion packages that generic architectural-grade additives cannot meet, and suppliers without OEM qualification cannot bid on these meaningfully higher-margin contracts regardless of their standard-grade quality. Elementis's automotive qualification programme shows how testing investment converts directly into OEM contracts that unqualified competitors cannot access. That advantage most standard-grade competitors cannot easily close, even with years of dedicated testing investment behind them that arrives too late to matter competitively.
04 / BIO-BASED FEEDSTOCK POSITIONING

Bio-based alternatives will capture the premium sustainability-sensitive segment

Brands pursuing published sustainability commitments increasingly specify bio-based additive alternatives despite higher cost, and suppliers without bio-based capability cannot compete for this growing segment at all. Dow and BYK-Chemie's bio-based investment shows how early feedstock diversification converts directly into premium-priced access that petrochemical-only competitors cannot match. That advantage will compound further as more brands publish similar sustainability commitments across the industry over the coming years, a gap unlikely to close for petrochemical-only producers regardless of manufacturing scale or brand heritage.

Engagement Snapshot From the Field

A live engagement with an industry participant carrying material or product regulatory and market exposure ahead of a defining policy shift, showing how our research translates into a defensible multi-year portfolio strategy.
MARKET MINDS ADVISORY · CLIENT ENGAGEMENT SUMMARY
Paint Additives Producer Strategic Portfolio Review and Transition Roadmap 2026·Investment Scenario on Paint Additives Exposure Evaluation 2025-26
CLIENT PROFILE
A global architectural coatings manufacturer approached MMA while evaluating whether to consolidate additive procurement across its waterborne product lines onto a single full-package supplier framework. The client reported annual additive procurement volume exceeding 18,000 tonnes and a reformulation budget surpassing USD 6.2 million tied to upcoming biocide restriction compliance (client-reported, unverified by MMA). The client operates across twelve manufacturing facilities globally.
STRATEGIC CHALLENGE
Management wanted to consolidate onto fewer suppliers to simplify compatibility management ahead of an approaching biocide restriction deadline, but had not benchmarked next-generation biocide readiness across its existing supplier base, nor evaluated whether any single supplier could realistically cover its full product range. The formulation team wanted rigorous testing; the procurement team wanted cost efficiency.
MMA APPROACH
MMA benchmarked waterborne compatibility documentation, next-generation biocide pipeline readiness, and existing production capacity across all six suppliers in the client's current additive category. We modelled reformulation timelines against the client's compliance deadline and quantified realistic consolidation scenarios using comparable coatings manufacturer benchmarks. We also interviewed the client's regulatory affairs team to validate compliance timeline assumptions directly.
KEY FINDINGS
  1. Only two of six existing suppliers held next-generation biocide chemistry sufficient to meet the client's compliance deadline without gaps (client-reported, unverified by MMA).
  2. Consolidating onto two qualified suppliers added roughly 5% to procurement cost while meaningfully accelerating compliance timeline certainty. within the first two quarters of transition.
  3. The fastest realistic reformulation timeline for a new, unproven supplier ran eleven months, longer than the client's compliance deadline allowed for two product lines.
  4. Suppliers with existing full-package compatibility data delivered materially faster requalification since much of the testing work was already complete. reinforcing the case for full consolidation.
CLIENT PROFILE
A global architectural coatings manufacturer approached MMA while evaluating whether to consolidate additive procurement across its waterborne product lines onto a single full-package supplier framework. The client reported annual additive procurement volume exceeding 18,000 tonnes and a reformulation budget surpassing USD 6.2 million tied to upcoming biocide restriction compliance (client-reported, unverified by MMA). The client operates across twelve manufacturing facilities globally.
STRATEGIC CHALLENGE
Management wanted to consolidate onto fewer suppliers to simplify compatibility management ahead of an approaching biocide restriction deadline, but had not benchmarked next-generation biocide readiness across its existing supplier base, nor evaluated whether any single supplier could realistically cover its full product range. The formulation team wanted rigorous testing; the procurement team wanted cost efficiency.
MMA APPROACH
MMA benchmarked waterborne compatibility documentation, next-generation biocide pipeline readiness, and existing production capacity across all six suppliers in the client's current additive category. We modelled reformulation timelines against the client's compliance deadline and quantified realistic consolidation scenarios using comparable coatings manufacturer benchmarks. We also interviewed the client's regulatory affairs team to validate compliance timeline assumptions directly.
KEY FINDINGS
  1. Only two of six existing suppliers held next-generation biocide chemistry sufficient to meet the client's compliance deadline without gaps (client-reported, unverified by MMA).
  2. Consolidating onto two qualified suppliers added roughly 5% to procurement cost while meaningfully accelerating compliance timeline certainty. within the first two quarters of transition.
  3. The fastest realistic reformulation timeline for a new, unproven supplier ran eleven months, longer than the client's compliance deadline allowed for two product lines.
  4. Suppliers with existing full-package compatibility data delivered materially faster requalification since much of the testing work was already complete. reinforcing the case for full consolidation.
RECOMMENDED STRATEGY
Phase 1: Phase 1 (0 to 4 months): Transition to the two suppliers with existing next-generation biocide chemistry to meet the compliance deadline. Phase 2: Phase 2 (4 to 12 months): Complete full-package requalification across all remaining product lines using the consolidated supplier base. and documenting variance for future reference. Phase 3: Phase 3 (12 to 24 months): Reassess supplier consolidation depth annually against compliance performance and pricing benchmarks. across every remaining product category.
OUTCOME
The client proceeded with the two-supplier consolidation, completing compliance-critical reformulation ahead of the restriction deadline. The client reported avoiding an estimated three-month compliance delay it had modelled under a single-source, unproven-supplier scenario (client-reported, unverified by MMA). Two additional product lines have since adopted the same consolidated supplier framework.

Frequently Asked Questions

Foundational context covering the market sizes, CAGR, scope, country, region and competition that inform every finding below. This section is provided to cover basics and most often pre-purchase conversations, answered from the MMA Primary Research Dataset.

What is the current size of the Paint Additives Market?

The Paint Additives Market stood at USD 6.8 billion in 2025, based on MMA Primary Research Dataset estimates. Waterborne coatings conversion is the primary near-term demand driver.

How large will the Paint Additives Market be by 2036?

MMA projects the market reaching USD 13.18 billion by 2036 under the base case scenario. That represents a 1.83 times expansion over the 2026 base value.

What is the CAGR for the Paint Additives Market 2026 to 2036?

The base case CAGR is 6.2% annually. The bull case reaches 7.4% and the bear case falls to 5.0%, depending on waterborne conversion pace and feedstock costs.

Which segment is growing fastest?

UV stabilizers grow fastest at 9.0% CAGR, about 1.45 times the overall market rate. Automotive and architectural durability warranty extensions both drive that growth directly across the industry.

Who are the major companies in the Paint Additives Market?

BASF, Evonik, Dow, Elementis, and BYK-Chemie lead the category. Combined, the top five hold a CR5 of 34% across a moderately concentrated field where certification breadth increasingly separates leaders from smaller challengers.

Which country is growing fastest?

China grows fastest at 8.5% CAGR, driven by its dominant coatings manufacturing scale. Rapid waterborne conversion and domestic feedstock proximity are both reinforcing that pace further.

Report Segmentation Architecture

The full report scope spans multiple orthogonal segmentation dimensions, with cross-tabulated demand data provided for each dimension pair. Coverage extends further to regional breakdowns, trend trajectories, and the competitive detail needed to support segment-level decision-making.

By Additive Function

  • Rheology Modifiers
  • Dispersants and Wetting Agents
  • Biocides and Preservatives
  • Defoamers
  • UV Stabilizers
  • Anti-Corrosion Additives

By End-Use Application

  • Architectural Coatings
  • Automotive OEM Coatings
  • Industrial Coatings
  • Protective and Marine Coatings
  • Wood and Furniture Coatings

By Commercial Dimension

  • Single-Chemistry Direct Sale
  • Full-Package Formulation Contracts
  • Distributor and Catalogue Channel
  • Custom Formulation Support Agreements

By Region

  • North America
  • Western Europe
  • East Asia
  • South Asia and Pacific
  • Latin America
  • Middle East and Africa
  • Eastern Europe

Scope, Methodology, and Coverage

Every figure in this report is reproducible from documented input assumptions. The scope below maps the historical period, the forecast horizon, the segmentation dimensions, and the countries covered, alongside the underlying primary and qualitative methodology.
Historical Period
2020 to 2025
Forecast Period
2026 to 2036
Base Year
2025 (USD billions; MMA Primary Research Dataset, August 2026)
Market Definition
The paint additives market comprises rheology modifiers, dispersants and wetting agents, biocides and preservatives, defoamers, UV stabilizers, and anti-corrosion additives sold into architectural, industrial, automotive, and protective coatings formulations. Coating resins, pigments, and unrelated adhesive or sealant additive categories are excluded.
Quantitative Units
USD billions (current prices); production volume in metric tonnes where applicable
Segmentation Dimensions
By Additive Function; By End-Use Application; By Commercial Dimension; By Region
Regions Covered
North America, Western Europe, East Asia, South Asia and Pacific, Latin America, Middle East and Africa, Eastern Europe
Countries Covered
USA, China, Germany, France, UK, Japan, South Korea, India, Australia, Canada, Brazil, Mexico, Indonesia, Vietnam, Thailand, Malaysia, UAE, Saudi Arabia, South Africa, Nigeria, Turkey, Poland, Netherlands, Italy, Spain, Sweden, Switzerland, Argentina, Colombia, Singapore, and additional markets relevant to this sector
Key Companies Profiled
BASF SE, Evonik Industries AG, Dow Inc., Elementis plc, BYK-Chemie GmbH, Clariant AG, Arkema S.A., Solvay S.A., Ashland Global Holdings, Lubrizol Corporation, Allnex Netherlands B.V., Munzing Chemie GmbH, King Industries Inc., Troy Corporation, Michelman Inc., Kemira Oyj, Nouryon, Wacker Chemie AG, Momentive Performance Materials, Emerald Kalama Chemical
Quantitative Methodology
Primary survey, n=3,800 respondents, Q4 2025, six countries; demand-side model with trade association cross-validation
Qualitative Methodology
47 expert interviews, Q4 2025; applied to validate demand model assumptions, identify emerging dynamics, and assess competitive positioning
Report Format
PDF and XLSX data workbook (Word format preview document)
Publisher
Market Minds Advisory
Report Code
MMA-2026-CHM-217
Published
August 2026
Contact
sales@marketmindsadvisory.com | www.marketmindsadvisory.com

Purchase the full Paint Additives Market Report (2026 to 2036).

The full MMA Paint Additives report sizes the market across six additive functions, five end-use applications, four commercial dimensions, and seven regions through 2036. It profiles 20 suppliers on a consistent unit shipment volume basis, scoring each on waterborne compatibility documentation, biocide regulatory readiness, and premium durability qualification depth. Scenario models quantify how waterborne conversion, biocide restriction cycles, and petrochemical price movements shift both volume and realised price across additive functions. The report also includes delivered-cost modelling by function, a regulatory exposure screen, and full-package bundling premium analysis built for supplier strategy, procurement, and investment teams.
Six-function segmentation with cross-tabulated regional demand
Twenty-company competitive benchmarking on shipment volume
Waterborne compatibility and full-package bundling tracking
Biocide restriction pipeline and reformulation exposure analysis
Petrochemical feedstock cost scenario modelling through 2036
Country-level VOC and biocide regulatory policy tracking

Built For The People Who Decide

From boardroom strategy to bench-side execution, this report is read cover-to-cover by leaders shaping the next decade of their industry, turning demand scenarios, market dynamics and valuation benchmarks into decisions.
CXOs/ Presidents/ VPs/ Managers
M&A and Corporate Development
Strategy Teams and R&D Heads
Procurement and Product Directors
Regulatory and Compliance Leaders
Investor Relations and Equity Analysts