

Market Minds Advisory
Padded Divider Market

Padded Divider Market: Insurance economics, the fibre substitution limit and machine erection value to 2036

This product is priced as a material and functions as insurance, and procurement compares the first number while the business quietly pays the second one every single time something breaks.

Lead Analyst

Bilal Shaikh

Published

September 2026

Make Smarter Decisions with Customized Research Insights

Request a free sample report and evaluate market opportunities, growth trends, and competitive dynamics relevant to your business needs.

2025 MARKET VALUE$3.4BMarket Size 2025
2036 FORECAST VALUE$7.0BBase Case , 2026 to 2036
CAGR 2026 TO 20366.8 %Bull 8.0% / Bear 5.6%
INCREMENTAL OPPORTUNITY$3.4BNet 10- year value creation
EXPANSION MULTIPLE1.93x2036 value over 2026 base
Strategic Levers
M&A Pipeline
Regional Outlook
Country Rankings
Competitive Intelligence
Segmental Deep-dive
Call-Us : 91 93563 13602

Executive Snapshot and Market Trajectory

A damaged shipment costs roughly 6.4 times the product value once return freight, replacement shipping, customer service handling and the damaged relationship are all counted properly. The divider preventing it represents about 3% of packed cost. Those two numbers live in different budgets entirely.
Procurement compares that 3% against a cost reduction target while the business absorbs the multiple somewhere else entirely, usually in a logistics or customer service budget that never speaks to the packaging buyer. Suppliers quoting per thousand pieces are competing on the smaller of the two numbers available to them. Nobody inside the customer organisation is incentivised to assemble the two figures into one calculation. A supplier who does that work wins specifications on it.
Moulded pulp inserts grow at 10.2%, half again the market rate of 6.8%, as packaging waste rules displace foam. The honest limit is that foam absorbs roughly 2.3 times the impact energy of fibre at equal thickness, so universal substitution will produce claims costing more than the material saved. Fibre works for most things and not for everything, and specifying it universally is how a saving becomes a loss.
Market Definition
This report covers padded dividers, partitions and protective inserts used to separate and cushion items within cases and containers, spanning corrugated fibre dividers, moulded pulp inserts, foam and expanded polymer dividers, returnable plastic dunnage, textile and wrapped protective dividers, and paperboard and chipboard partitions. Value is measured at converter level on divider and insert revenue. Excluded are outer cases and cartons, void fill and loose cushioning, pallets and unit load devices, wrapping films and bubble materials sold in roll form, and returnable container bodies themselves.
Base Year Value
$3.4B in 2025 (MMA Primary Research Dataset, August 2026)
Forecast Period
2026 to 2036, eleven discrete annual values
CAGR
6.8% base case. Bull 8.0%. Bear 5.6%.
Fastest Growth Segment
Moulded Pulp Inserts: 10.2% CAGR
Fastest Growth Country
India: 10.4% CAGR
Fastest Growth Region
South Asia and Pacific: 8.8% CAGR
Largest Region
East Asia: 30% of 2025 global value
Market Leaders
Smurfit Westrock, DS Smith, Sonoco Products, Huhtamaki and Sealed Air lead the market. Source: MMA Primary Research Dataset, July 2026.
Primary Survey
n=3,800 procurement and R&D decision-makers, Q4 2025, six countries
Methodology
Demand-side build-up, cross-validated against public data, 47 expert interviews

Padded Divider Market Forecast Scenarios

padded-divider-market-size-forecast-scenario-1787559633300
Growth ran at 5.4% between 2020 and 2025 as e-commerce parcel volumes rose sharply and multi-item shipments created separation requirements the retail supply chain had never needed. Packaging waste rules and retailer plastic commitments began displacing foam toward moulded fibre through the second half of the period, and returnable dunnage expanded with automotive supply chain reshoring.
The 6.8% base case rests on three mechanisms. Moulded pulp inserts at 10.2% as material substitution continues under regulatory and retailer pressure. Returnable plastic dunnage at 7.6% on closed-loop industrial supply chains where a divider completes around 85 trips before replacement. And Indian growth at 10.4%, the fastest of any country, on manufacturing and e-commerce parcel volumes rising together. None of the three depends on flat partition volume recovering at all.
The 8.0% bull case is damage cost being quantified properly in packaging specification, which would shift purchasing from material price toward protection performance across the category. The 5.6% bear case is fibre substitution proceeding faster than performance justifies, producing damage claims that discredit the transition and force expensive reversals on high-value fragile products. Reversals of that kind are expensive and unusually public.

Priced As Material, Valued As Insurance

The commercial problem in this category is a framing problem rather than a technical one. A padded divider costs pennies and represents around 3% of total packed cost, which is what a packaging buyer sees and compares against a cost reduction target. What it prevents costs roughly 6.4 times the product value once return freight, replacement shipping, customer service handling and the damaged customer relationship are all counted honestly. Those two numbers sit in different budgets whose owners rarely speak.
TOP-FIVE CONCENTRATION24%Combined position across supply held by the leading converters
DAMAGE CLAIM COST MULTIPLE6.4xTrue cost of a damaged shipment against the product value
DIVIDER COST SHARE3%Portion of total packed cost represented by the insert
RETURNABLE DUNNAGE CYCLE LIFE85 tripsJourneys a reusable divider completes before replacement becomes necessary
FOAM ENERGY ABSORPTION ADVANTAGE2.3xImpact protection relative to a moulded fibre equivalent thickness
MACHINE ERECTION COMPATIBILITY41%Share of formats a packing line assembles unaided
Material substitution is now proceeding under packaging waste rules and retailer plastic reduction commitments, moving dividers from expanded polymer toward moulded fibre, and moulded pulp inserts grow at 10.2% as a result. The honest technical position is that fibre performs adequately for most applications and poorly for some. Foam absorbs roughly 2.3 times the impact energy of moulded fibre at equal thickness, which matters little for a sturdy item and a great deal for something genuinely fragile and expensive.
The other underexploited dimension is automation. Only around 41% of divider formats can be erected and inserted by a packing line without hand work, in plants that already struggle to staff manual packing at all.
"Nobody in packaging procurement has ever been shown what a broken shipment actually costs. They see three per cent of packed cost and a savings target, and the damage claim lands in a logistics budget two floors away. Show them the six point four and the conversation changes completely."
Director, Protective Packaging and Transit Systems Practice · MMA Packaging and Converting Materials Practice · August 2026

Market Trends

Fibre substitution advances into applications it does not suit

Packaging waste rules and retailer plastic reduction commitments are moving dividers from expanded polymer toward moulded fibre, and pulp inserts grow at 10.2% accordingly. Foam absorbs roughly 2.3 times the impact energy of fibre at equivalent thickness, which is immaterial for a sturdy product and decisive for a fragile expensive one. Commercially the substitution is being applied more broadly than performance justifies in several categories, and the resulting damage claims will cost considerably more than the material saved, which tends to produce expensive and public reversals. The reversals tend to be public and expensive.
Market Impact: Dividers are 3% of packed cost

Machine-erectable formats gain value as packing labour disappears

Only around 41% of divider formats can be erected and inserted by a packing line without manual intervention, and the plants buying them are frequently the same plants unable to staff manual packing at all. A divider that a machine can handle is therefore worth considerably more than an equivalent one requiring hands, regardless of material cost. Commercially this is a design opportunity rather than a manufacturing one, and converters treating divider geometry as a packing line problem rather than a material specification capture value competitors leave alone. Geometry rather than material is the lever here.
Market Impact: Indian demand compounds at 10.4%

Market Opportunities and Growth Drivers

Multi-item parcels need separation retail never required

A shipment to a store is a case of identical products that need no separation from one another, while a parcel to a consumer frequently contains several different items of different shapes and fragilities travelling together. That is a genuinely new packaging requirement rather than a larger version of an old one, and it grew from almost nothing within a decade. Commercially it created demand for configurable and cut-to-order dividers that traditional case partition converting was never designed to supply at parcel volumes. Configurable and cut-to-order formats serve it where fixed partitions cannot.
Market Impact: Damage costs 6.4 times product value

Indian manufacturing and parcel volumes expand simultaneously

Indian growth at 10.4% leads every country in this market, driven by manufacturing output and e-commerce parcel volumes rising at the same time rather than one substituting for the other. Domestic converting capacity is expanding to serve both, and glass, ceramic and appliance manufacturing all consume substantial divider volume in transit packaging. Commercially the market is growing from a base where damage rates are high and protective specification is basic, which means both volume and specification quality can improve together. Damage rates across regional distribution are high and protective specification remains basic.
Market Impact: Dunnage lasts about 85 trips

Market Restraints and Challenges

Damage cost sits in a budget buyers never see

A damaged shipment costs roughly 6.4 times product value once return freight, replacement, handling and customer relationship damage are counted, and none of that lands in the packaging budget where the divider was purchased. The root cause is organisational rather than technical, since the cost of failure and the cost of prevention sit in different reporting lines entirely. Commercially this pushes specification toward the cheapest divider that mostly works. Suppliers are building damage cost models for customers, which converts the conversation when anybody will listen. Very few organisations have connected the two figures.
Market Impact: Foam absorbs 2.3 times more energy

Returnable dunnage requires logistics most customers cannot run

A returnable divider completes around 85 trips before replacement, which makes the economics compelling on a closed loop between a supplier and an assembly plant and impossible on any open distribution route. The root cause is that somebody has to collect, inspect, clean and return the asset. Commercially this confines reusable formats to automotive and industrial supply chains with existing return logistics. Providers are offering managed pool services to open the model wider, which works where trip density supports the collection cost and nowhere else. Trip density is the variable that decides it.
Market Impact: Only 41% erect without hand work
4 additional market trends, 3 additional growth drivers, and 2 additional restraints and challenges are covered in the full report. Contact sales@marketmindsadvisory.com to access the complete intelligence.

Segment CAGR and Growth Architecture

Value is classified here by material and format, since protective performance, cost per unit and end-of-life handling all follow directly from what the divider is made of. End-use industry, distribution model and erection method are handled separately in the framework below, because most materials serve several industries with adjusted geometry rather than different construction.
padded-divider-market-market-share-analysis-1787559633833

Moulded Pulp Inserts

Growing at 10.2%, half again the market rate, moulded pulp is displacing expanded polymer under packaging waste rules and retailer plastic reduction commitments rather than on any performance argument. It moulds to product geometry well, recycles through existing paper streams and satisfies the sustainability requirement a buyer is increasingly obliged to meet. The technical limit is genuine: foam absorbs roughly 2.3 times the impact energy at equal thickness, so a fragile high-value item substituted carelessly will arrive broken more often. Tooling cost for moulded geometry also makes short runs expensive, which pushes lower volume products toward corrugate partitions instead. Recycling through existing paper streams is a genuine advantage regardless. Tooling cost pushes short runs elsewhere.
CAGR 10.2%

Returnable Plastic Dunnage

Reusable dividers completing around 85 trips before replacement make excellent economic sense on a closed loop between a component supplier and an assembly plant, and no sense whatever on an open distribution route where nobody collects them. Growth at 7.6% follows automotive and industrial supply chain activity rather than any packaging development. This is asset management with return logistics rather than a material sale, which makes it a different business requiring tracking, cleaning and inspection capability. Managed pool services extend the model where trip density supports the collection cost, and they fail quietly wherever it does not. Tracking, cleaning and inspection capability are required rather than optional. It is a service operation with an asset attached.
CAGR 7.6%
Full segment breakdown across 6 segments available in the complete report.

Regional Architecture and Country Demand Map

East Asia holds 30% of value on manufacturing and export packaging volume, with North America following at 26% on e-commerce parcel separation demand. Western Europe sits at 22% and drives material substitution worldwide through its packaging waste requirements. Freight range constrains every participant here considerably.

East Asia

Chinese, Japanese and Korean manufacturing generates enormous divider demand across electronics, appliances, glass and automotive components, much of it in export packaging where transit distances make protection genuinely consequential. Chinese converting capacity is extensive and competes hard on price for standard partitions, while Japanese suppliers hold precision moulded fibre positions serving electronics manufacturers with demanding requirements. Returnable dunnage is well established in regional automotive supply chains operating closed loops. Material substitution is less advanced than in Europe, since regulatory pressure is lighter. Growth at 7.8% reflects manufacturing and export volume together. Freight economics keep converting regional rather than concentrated, since dividers travel poorly relative to their value. Export transit distances matter.
Share: 30% | CAGR: 7.8% (2026 to 2036)

North America

E-commerce parcel volumes drive the most distinctive regional demand, with multi-item shipments requiring separation that store-bound case shipping never needed and creating a genuinely new product requirement. Damage claim costs are increasingly quantified by large retailers, which is slowly changing how dividers get specified. Returnable dunnage is well established across automotive supply chains between component plants and assembly. Retailer plastic reduction commitments drive material substitution ahead of any regulation. Growth at 7.4% sits above the market rate on parcel volume and specification improvement together. Machine erection matters increasingly as packing labour becomes harder to recruit across distribution and manufacturing alike. Retailers increasingly quantify claim cost, which is slowly changing how transit packaging gets specified across the region.
Share: 26% | CAGR: 7.4% (2026 to 2036)
Regional intelligence for 5 additional markets available in the complete report: Western Europe, South Asia and Pacific, Latin America, Middle East and Africa, Eastern Europe. Contact sales@marketmindsadvisory.com.
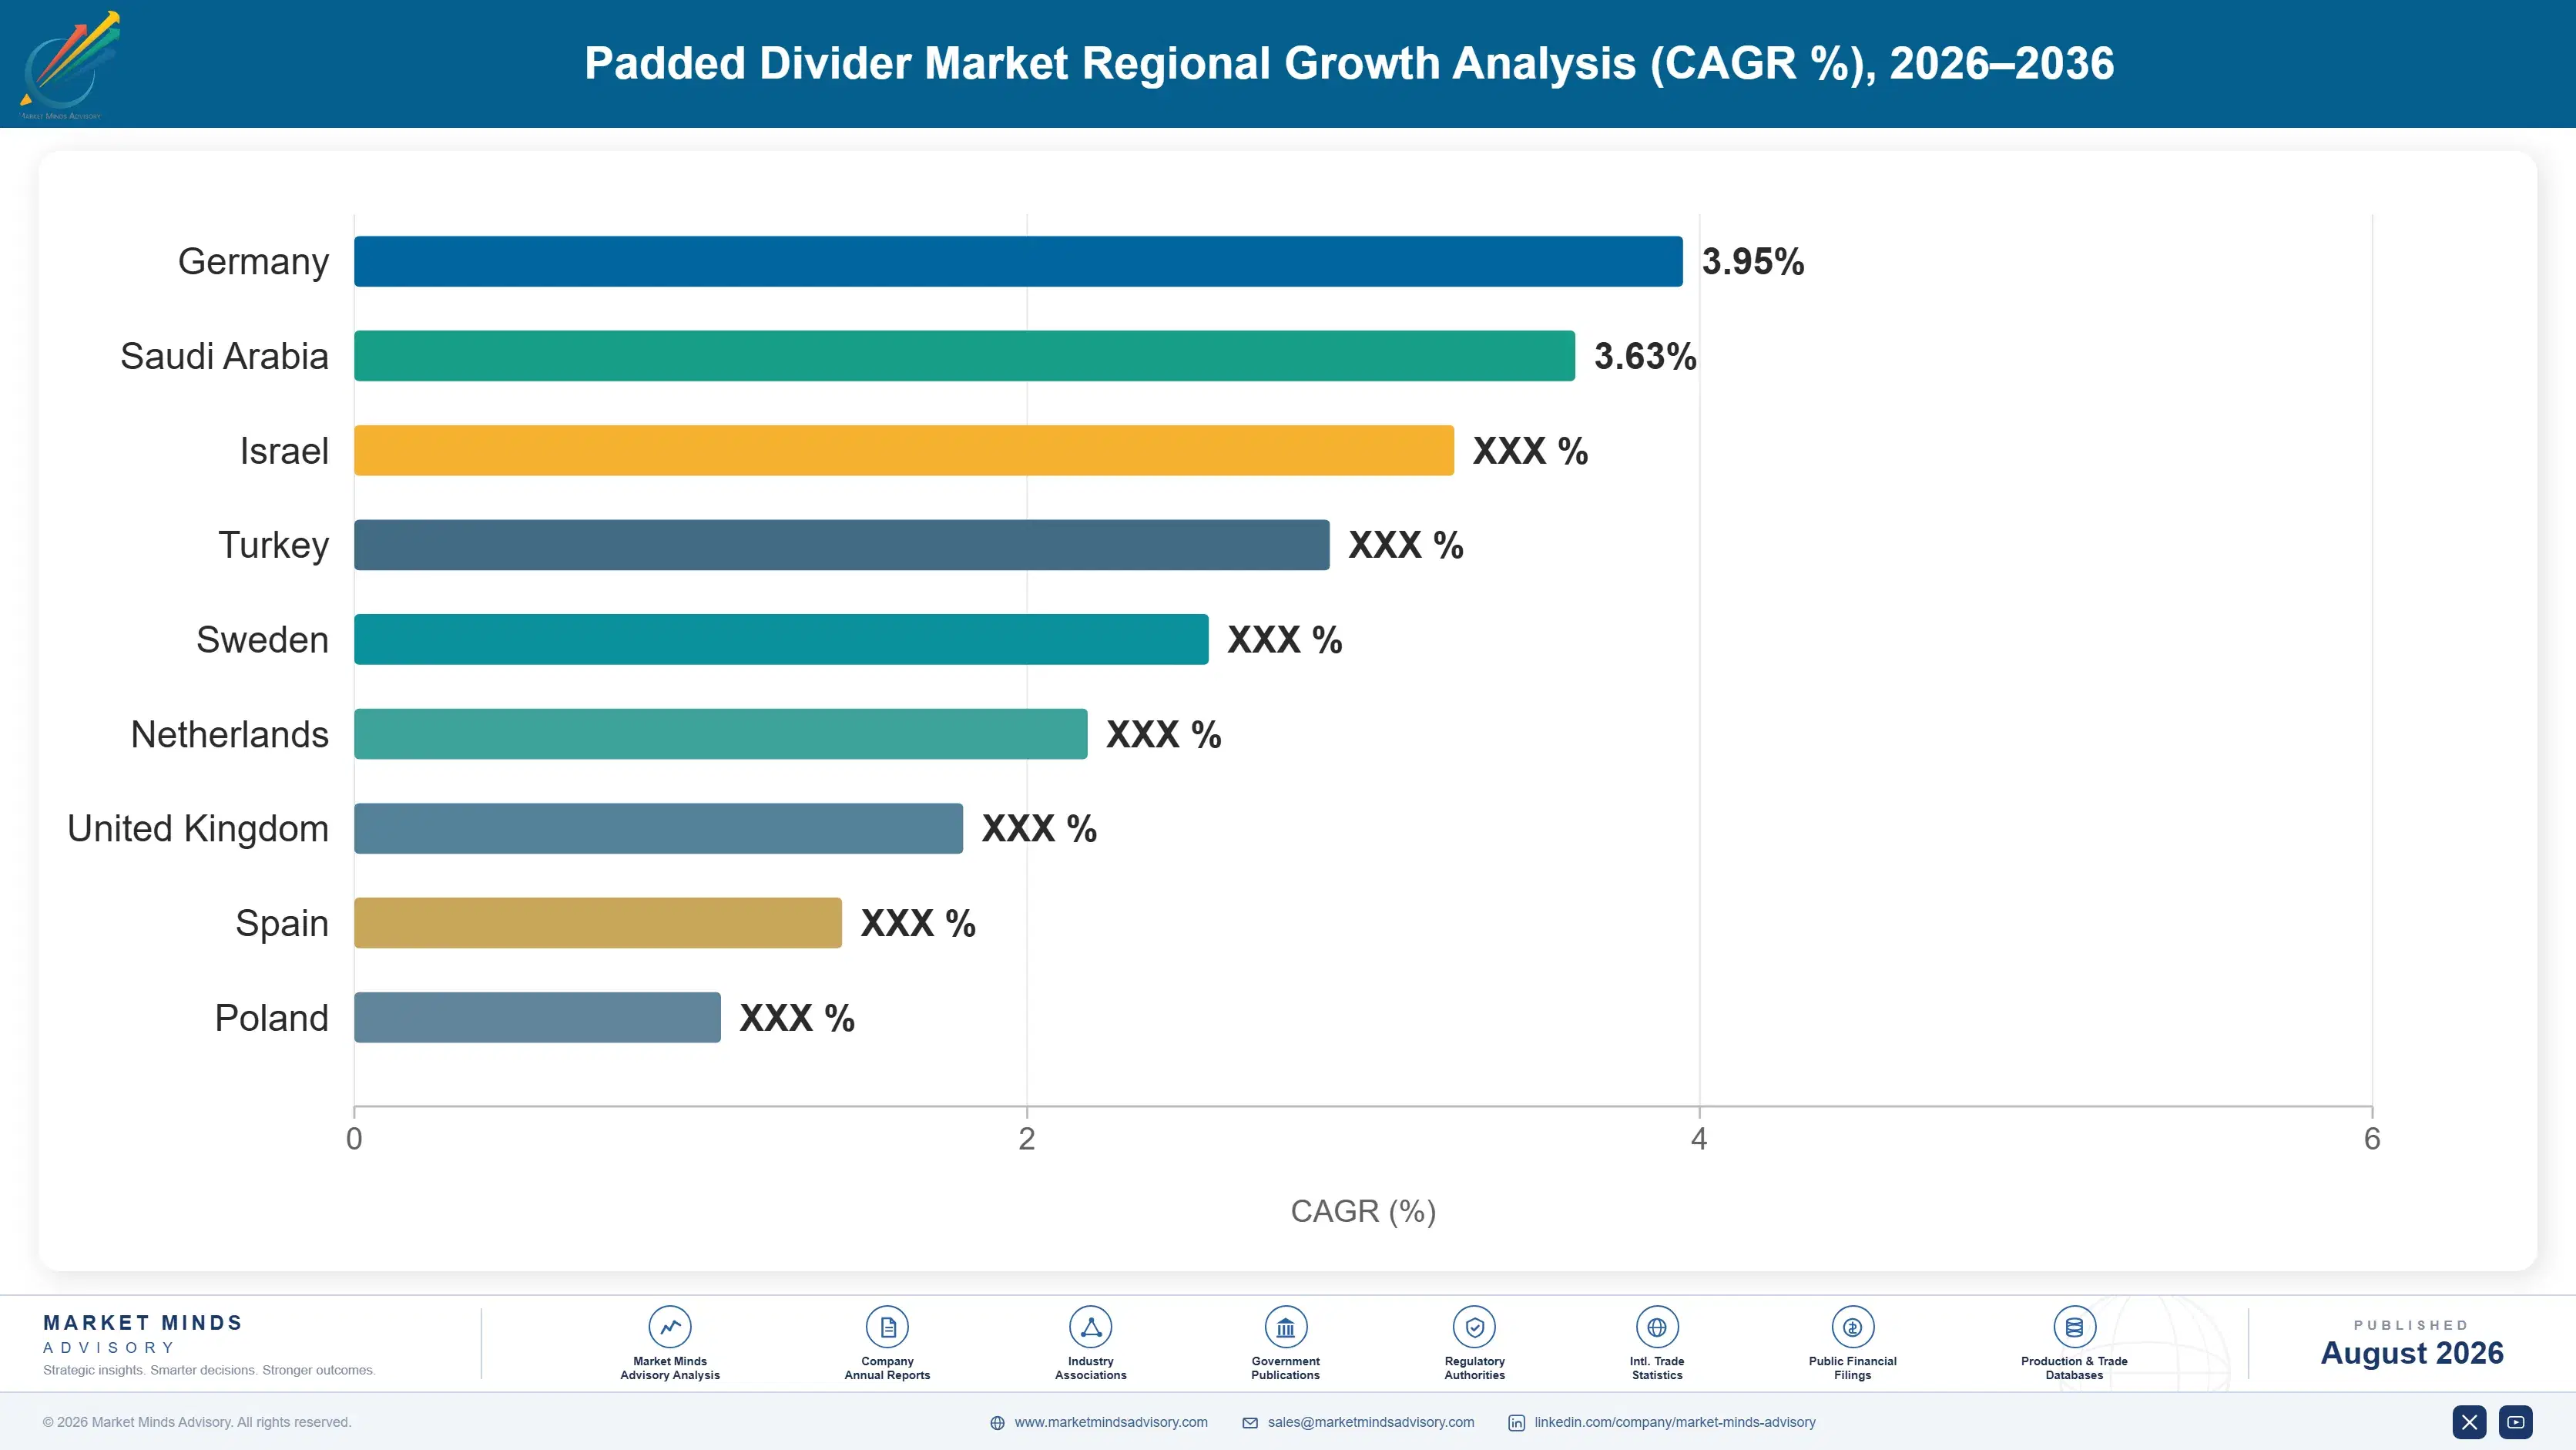
padded-divider-market-country-cagr-analysis-1787559634350

Where Divider Value Gets Decided

Four quite separate moves matter for a product costing pennies that prevents losses worth multiples of the goods it protects, in a market where the buyer sees only one of those two numbers. Two concern reframing the purchase honestly, and two concern the format and material decisions determining whether protection actually holds in transit.

Build the damage cost model for the customer

A damaged shipment costs roughly 6.4 times product value once return freight, replacement, handling and relationship damage are counted, while the divider is around 3% of packed cost and sits in a different budget entirely. A supplier who assembles that arithmetic using the customer's own damage rates and freight terms changes the specification conversation from a price comparison into a loss avoidance calculation. Nobody inside the customer's organisation is incentivised to do that work, which is precisely why it wins specifications. That is precisely why the exercise wins specifications. The model is straightforward to build.
Market Impact: Quantifies a 6.4 times true cost of damage

Design formats a packing line can erect unaided

Only around 41% of divider formats can be erected and inserted by machine without manual intervention, and the plants buying them are frequently the ones unable to staff manual packing in the first place. A divider a machine handles is worth more than an equivalent needing hands, irrespective of material cost. This is a geometry and design problem rather than a manufacturing one, and converters treating it as a packing line question rather than a material specification capture value that competitors simply leave alone. Competitors leave this alone almost entirely.
Market Impact: Improves on a 41% machine erection compatibility rate

Be honest about where fibre does not perform

Moulded pulp grows at 10.2% under waste rules and retailer commitments, and foam absorbs roughly 2.3 times the impact energy at equal thickness. A supplier who substitutes everywhere will eventually explain a damage spike on a fragile high-value line, and that conversation costs far more than the volume gained. Recommending fibre where it works and defending foam where it does not builds the credibility that makes the rest of the portfolio believable to a customer weighing advice. Credibility earned that way carries across the whole portfolio. Customers weigh advice differently after that.
Market Impact: Respects a 2.3 times difference in impact protection

Offer managed pools only where trip density supports collection

Returnable dividers completing around 85 trips are compelling on a closed automotive loop and hopeless on an open distribution route, because somebody must collect, inspect, clean and return each unit. Managed pool services extend the model where trip density carries the collection cost and fail quietly wherever it does not. Assessing route density before offering the service protects both the customer and the provider from an arrangement that looks attractive in a proposal and loses money in operation. A proposal that reads well and loses money helps nobody. Density can be assessed before committing.
Market Impact: Serves reusable assets lasting around 85 trips each

Who Controls the Margin Pool

Five converters hold 24% of this market, measured on divider and insert revenue at converter level, the basis used throughout this section. Concentration is low because corrugate partition converting is regionally fragmented and freight-limited, while moulded fibre, foam and returnable plastic each require quite different manufacturing capability that few participants hold across the whole range. Very few participants span the full material range.
Competition runs on four dimensions. Damage cost modelling capability, which changes how a specification gets decided rather than merely how it gets priced. Moulded fibre tooling and geometry capability as material substitution continues. Machine erection design, worth more than material cost in plants that cannot staff manual packing. And return logistics capability for reusable formats, which is a different business requiring quite different competence.

Rankings shift toward converters with moulded fibre capability and design capability for automated handling, and away from those supplying flat partitions purely on price. Large paper groups hold corrugate scale and increasingly the fibre tooling behind substitution. Protective specialists hold foam and engineered formats alongside transit testing. Returnable providers hold the return logistics that nobody else wants to operate.
padded-divider-market-company-positioning-matrix-1787559634869

Competitive Moat and Risk Dimensions

SMURFIT WESTROCK

Moat: Fibre scale and design resource

The group holds corrugate and moulded fibre capability at scale alongside packaging design resources that can model damage cost and machine handling for a customer, which matters far more than material price in specifications decided on protection performance. Regional converting footprint also addresses the freight limitation that constrains how far any divider can economically travel from where it was made.
SMURFIT WESTROCK

Risk: Limited foam and reusable capability

Foam absorbs roughly 2.3 times the impact energy of fibre and remains necessary for genuinely fragile high-value products, while returnable dunnage growing at 7.6% is an asset management business requiring return logistics rather than converting capability. A fibre-weighted portfolio cannot honestly recommend against its own materials, which limits credibility exactly where protection advice matters most.
SEALED AIR

Moat: Protective engineering and testing

The company holds genuine protective packaging engineering capability including transit testing, which lets it specify against measured damage risk rather than against material price. That competence supports the damage cost argument that changes how specifications get decided, and it applies across foam, fibre and hybrid formats rather than favouring whichever material the company happens to convert.
SEALED AIR

Risk: Material substitution against foam

Packaging waste rules and retailer plastic commitments are displacing expanded polymer toward moulded fibre at 10.2% growth, and that transition proceeds on regulatory and reputational grounds rather than on performance comparison. Engineering credibility slows the substitution where it genuinely should not happen and does not stop it elsewhere. Fibre tooling capability determines who captures the volume that moves.

Players Tracked

Prominent Players

Smurfit Westrock
DS Smith
Sonoco Products
Huhtamaki
Sealed Air

Other Key Players

Mondi
Ranpak
Pregis
Storopack
Hartmann Packaging
UFP Technologies
Nefab
ORBIS Corporation
Schoeller Allibert
Tri-Wall
Green Bay Packaging
Packaging Corporation of America
Cascades
Klabin
Nippon Molding

Recent Developments

MARCH 2025

A retailer quantified damage cost across its packaging specifications

A large retailer began modelling full damage cost including return freight, replacement and handling when specifying transit packaging, replacing a purchasing approach based on packaging cost per unit alone. This was an internal procurement change rather than any transaction with converters. Packaging cost per unit ceased being the criterion.
Signal: Damage cost modelling shifts specification from material price toward protection performance right across a whole category
JULY 2025

A manufacturer reversed fibre substitution on a fragile product line

A consumer goods manufacturer reverted to foam inserts on a fragile high-value product line after moulded fibre substitution produced a measurable increase in transit damage claims exceeding the material saving. This was an operational reversal rather than any commercial dispute with suppliers. Claim data drove the decision.
Signal: Substitution applied beyond where performance supports it produces reversals costing far more than the material saving
NOVEMBER 2025

A converter launched machine-erectable divider geometry

A packaging converter introduced divider formats designed for automated erection and insertion without manual handling, targeting plants that cannot staff manual packing rather than competing on material cost. This was a product launch rather than any acquisition or partnership arrangement. Manual handling had been the constraint.
Signal: Divider geometry designed around the packing line is worth more than material savings in labour-scarce plants

What Drives Converted Cost

Containerboard, recovered fibre or polymer resin accounts for roughly 52% of converted divider cost depending on the format, which makes this a material-heavy business with modest conversion margin. Tooling amortisation matters disproportionately in moulded fibre, where geometry is built into the mould rather than into a cutting die. Converting energy and labour add around 19%. Freight is significant, since dividers are bulky relative to value and travel poorly.
Containerboard and recovered fibre prices moved sharply through 2021 and 2022 alongside packaging demand and energy costs, while polymer followed petrochemical markets over the same period. DS Smith noted fibre and energy cost pressure across its packaging operations in its Annual Report 2022. Converters on annual customer pricing absorbed most of the movement, since divider specifications are contracted alongside outer packaging on the same terms.

The disadvantage falls on converters without moulded fibre tooling capability, and it operates through addressable demand rather than through cost. Substitution is moving volume from foam and flat partitions toward moulded geometry that requires tooling investment and design capability. A converter holding only cutting dies cannot serve that demand at all, and the volume moves regardless.
padded-divider-market-cost-volatility-analysis-1787559635064

Model damage cost using the customer's own claim data

A divider is around 3% of packed cost while a damaged shipment costs roughly 6.4 times product value, and those numbers sit in separate budgets that rarely meet. Building the model from the customer's own damage rates and freight terms is work nobody inside their organisation is incentivised to do. It converts a price comparison into a loss calculation.

Invest in moulded fibre tooling ahead of substitution demand

Volume is moving from foam and flat partitions toward moulded geometry under waste rules and retailer commitments, and that requires tooling and design capability rather than converting capacity. Converters holding only cutting dies cannot address the demand at all. Tooling investment made before customers ask is considerably cheaper than being excluded from their specification process.

Site converting close to packing operations to manage freight

Dividers are bulky relative to their value and travel poorly, which makes freight a substantial share of delivered cost and rewards regional capacity over manufacturing scale. A converter several hundred kilometres closer to a packing plant beats a more efficient one further away. This constrains market geography more than most participants acknowledge when planning.

Portfolio Architecture for Margin Defence

Margin separates on engineering and tooling content rather than on converting scale, which is unusual in a paper-heavy category. Flat corrugate and chipboard partitions run at gross margins in the mid teens against regional converters where freight rather than efficiency decides delivered cost. Foam dividers run modestly better on protective specification. Moulded fibre inserts run considerably higher on tooling and geometry content. Returnable dunnage with managed pool services runs highest, because the customer is buying an operation rather than a product.
The tension is that flat partitions carry the volume while moulded geometry and managed services earn the returns, and moving toward them requires tooling investment or return logistics capability rather than more converting capacity. Converters weighted toward flat partitions face substitution moving volume away from them and freight economics preventing them from expanding their geographic reach to compensate. Both constraints tighten together.

High-value pools sit in moulded fibre tooling, machine-erectable design and managed returnable pools where trip density supports them. Flat partition converting is where freight and regional competition have already decided how much anybody earns. Both constraints tighten at the same time, which is what makes the position uncomfortable rather than merely difficult.

Volume / Commodity-Adjacent

Flat corrugate and chipboard partitions competing on delivered cost against regional converters within freight range. The nine-point range separates converters with fibre integration and scale from independents buying board at prevailing market terms.
Gross Margin: 14%-23%

Premium / Certified

Foam and engineered protective dividers where transit testing and protective specification decide selection rather than material price. The twelve-point spread reflects protective engineering capability rather than any manufacturing advantage over competitors.
Gross Margin: 26%-38%

Sustainability / Regulatory / Next-Generation

Moulded fibre inserts with custom tooling, machine-erectable formats and managed returnable pool services. The twenty-point range is wide because tooling investment, design capability and service scope vary enormously between converters and programmes.
Gross Margin: 36%-56%
padded-divider-market-portfolio-architecture-1787559635566

High-value Sub-segments and Strategic Watch-out

Moulded Fibre Tooling

Compounding at 10.2% as waste rules displace foam, requiring tooling and geometry capability rather than converting capacity. Converters holding only cutting dies cannot address any of this demand at all. Tooling investment made before customers ask is far cheaper than exclusion. Substitution shows no sign of reversing.
Gross Margin: 38%-54%

Machine-Erectable Formats

Only 41% of formats erect without hand work, in plants that frequently cannot staff manual packing. Geometry designed around the packing line is worth more than any material saving available. Material cost differences barely register against a labour constraint. Plants cannot staff manual insertion anyway.
Gross Margin: 34%-48%

Managed Returnable Pools

Assets completing around 85 trips where trip density supports collection, inspection and cleaning. This is an operation rather than a product, and it fails quietly wherever route density does not carry the cost. Route assessment before offering protects both parties involved. Collection cost decides viability entirely.
Gross Margin: 40%-56%

Flat Partition Converting

The volume base, competing on delivered cost within freight range against regional converters. Manage this for plant location and board purchasing rather than for margin that geography has already settled. Regional competition inside freight range decides everything here. Board purchasing is the only real lever.
Gross Margin: 14%-23%

How Divider Demand Renews

Demand renews per shipment for single-use formats and per replacement cycle for returnable ones, which produces two annuities behaving completely differently. A converted divider is consumed and reordered continuously against production volume. A returnable divider is purchased once and replaced after roughly 85 trips, which makes that revenue lumpy and the service around it continuous instead. Reporting both together produces a growth figure describing neither business accurately.
Stickiness runs through tooling and qualification rather than through relationship. A moulded fibre insert made in a customer-specific mould cannot be sourced elsewhere without somebody paying for new tooling, which makes those positions durable for the product's whole life. Flat partitions are cut from standard board to a drawing anybody can follow, and they change supplier on delivered price at every contract without any friction at all.

The buyer has begun shifting from packaging procurement toward logistics and quality functions in the organisations that have done the damage arithmetic. Dividers were bought on cost per thousand by people with savings targets. Where damage cost has been quantified properly, the specification decision moves toward whoever can demonstrate protection performance, and price becomes a secondary consideration rather than the whole conversation.
padded-divider-market-end-use-penetration-index-1787559636053

Where To Place The Bet

These are among the four positions where our research anticipates prominent divergence between winners and laggards over the coming forecast period. Each is grounded in the demand model, the regulatory perimeter, and the announced capacity pipeline.
01 / DAMAGE COST QUANTIFICATION

Do the arithmetic nobody inside the customer will

A damaged shipment costs roughly 6.4 times the product value once return freight, replacement shipping, customer service handling and the damaged customer relationship are all counted honestly, while the divider preventing it represents around 3% of packed cost and sits in an entirely separate budget. Nobody inside the customer organisation is incentivised to assemble those two numbers into a single calculation. A supplier who builds that model from the customer's own damage rates converts a price comparison into a loss avoidance decision.
02 / MACHINE HANDLING DESIGN

Design the divider around the packing line

Only around 41% of divider formats can be erected and inserted by a packing line without manual intervention, and the plants purchasing them are frequently precisely the plants that cannot staff manual packing operations at all any more. A divider a machine can handle unaided is therefore worth considerably more than an equivalent one requiring hands, entirely irrespective of the material cost difference between them. This is a geometry and design problem rather than a manufacturing one, and most converters leave it alone completely.
03 / SUBSTITUTION HONESTY DISCIPLINE

Defend foam where fibre genuinely will not do

Moulded pulp compounds at 10.2% under packaging waste rules and retailer plastic commitments, while foam absorbs roughly 2.3 times the impact energy of moulded fibre at equivalent thickness, which is immaterial for sturdy products and decisive for fragile expensive ones. A supplier substituting everywhere will eventually be explaining a damage spike on a high-value line, and that conversation costs far more than the volume it gained. Recommending fibre where it works and defending foam where it does not builds credibility across the entire portfolio.
04 / POOL DENSITY DISCIPLINE

Only offer managed returns where routes support it

Returnable dividers completing around 85 trips before replacement make compelling economic sense on a closed loop between a component supplier and an assembly plant, and no sense whatsoever on an open distribution route where nobody has any reason to collect them. Managed pool services extend that model wherever trip density carries the collection, inspection and cleaning cost involved. Assessing route density honestly before offering the service protects both parties from an arrangement that reads well in a proposal and loses money in operation.

Engagement Snapshot From the Field

A live engagement with an industry participant carrying material or product regulatory and market exposure ahead of a defining policy shift, showing how our research translates into a defensible multi-year portfolio strategy.
MARKET MINDS ADVISORY · CLIENT ENGAGEMENT SUMMARY
Padded Divider Producer Strategic Portfolio Review and Transition Roadmap 2026·Investment Scenario on Padded Divider Exposure Evaluation 2025-26
CLIENT PROFILE
A North American converter with annual revenue around USD 118 million (client-reported, unverified by MMA), supplying flat corrugate partitions and some foam inserts to appliance, glass and consumer goods manufacturers. No moulded fibre tooling existed. Quotations were priced per thousand pieces throughout the business. Volume had been flat for three years. Moulded fibre was absent.
STRATEGIC CHALLENGE
Volume had been flat for three years while customers converted to moulded fibre with competitors, and management proposed price reductions on flat partitions to defend share. Nobody had established whether flat partition volume could be defended at all, or where the customers going elsewhere were actually going. The question went unasked.
MMA APPROACH
MMA traced lost volume to the material and format that replaced it rather than to the competitor who supplied it. Moulded fibre tooling investment was costed against the volume already lost and that likely to follow. Damage cost modelling was tested with three customers to see whether it changed their specification behaviour.
KEY FINDINGS
  1. Lost volume had gone almost entirely to moulded fibre rather than to cheaper flat partitions, which meant price reduction would have defended nothing and simply reduced margin on remaining business.
  2. Tooling investment for moulded fibre was substantial but well below the value of volume already lost, and the substitution trend showed no sign whatever of reversing in the client's categories.
  3. All three customers shown a damage cost model changed their specification discussion immediately, and two increased protective specification rather than reducing packaging cost as planned.
  4. Machine erection had never been raised by the client in any quotation despite two customers running automated packing lines that required manual divider insertion, which they disliked considerably.
CLIENT PROFILE
A North American converter with annual revenue around USD 118 million (client-reported, unverified by MMA), supplying flat corrugate partitions and some foam inserts to appliance, glass and consumer goods manufacturers. No moulded fibre tooling existed. Quotations were priced per thousand pieces throughout the business. Volume had been flat for three years. Moulded fibre was absent.
STRATEGIC CHALLENGE
Volume had been flat for three years while customers converted to moulded fibre with competitors, and management proposed price reductions on flat partitions to defend share. Nobody had established whether flat partition volume could be defended at all, or where the customers going elsewhere were actually going. The question went unasked.
MMA APPROACH
MMA traced lost volume to the material and format that replaced it rather than to the competitor who supplied it. Moulded fibre tooling investment was costed against the volume already lost and that likely to follow. Damage cost modelling was tested with three customers to see whether it changed their specification behaviour.
KEY FINDINGS
  1. Lost volume had gone almost entirely to moulded fibre rather than to cheaper flat partitions, which meant price reduction would have defended nothing and simply reduced margin on remaining business.
  2. Tooling investment for moulded fibre was substantial but well below the value of volume already lost, and the substitution trend showed no sign whatever of reversing in the client's categories.
  3. All three customers shown a damage cost model changed their specification discussion immediately, and two increased protective specification rather than reducing packaging cost as planned.
  4. Machine erection had never been raised by the client in any quotation despite two customers running automated packing lines that required manual divider insertion, which they disliked considerably.
RECOMMENDED STRATEGY
Phase 1: Phase one: abandon price reduction on flat partitions, since the lost volume went to a different material rather than to a cheaper version of the same one. Phase 2: Phase two: invest in moulded fibre tooling and design capability, which is where the volume has gone and where it will continue to go. Phase 3: Phase three: build damage cost modelling into the sales process and design machine-erectable geometry for customers running automated packing lines.
OUTCOME
Price reduction was withdrawn and margin on flat partitions held. Moulded fibre tooling is commissioned and has recovered two lost accounts. Damage cost modelling is now standard in quotations, and the client reports specification discussions moving away from price entirely (client-reported, unverified by MMA). Margin improved on flat volume.

Frequently Asked Questions

Foundational context covering the market sizes, CAGR, scope, country, region and competition that inform every finding below. This section is provided to cover basics and most often pre-purchase conversations, answered from the MMA Primary Research Dataset.

What is the current size of the Padded Divider Market?

The market was valued at USD 3.4 billion in 2025, rising to an estimated USD 3.63 billion in 2026. East Asia holds the largest regional share at 30% of value.

How large will the Padded Divider Market be by 2036?

MMA forecasts USD 7.01 billion by 2036 under the base case, an expansion multiple of 1.93 times the 2026 value. That represents USD 3.38 billion of incremental value.

What is the CAGR for the Padded Divider Market 2026 to 2036?

The base case runs at 6.8% compound annual growth between 2026 and 2036, with a bull case at 8.0% and a bear case at 5.6%. Historical growth from 2020 to 2025 was 5.4%.

Which segment is growing fastest?

Moulded pulp inserts lead at 10.2%, half again the market rate, as packaging waste rules displace expanded polymer. Returnable plastic dunnage follows closely at 7.6%.

Who are the major companies in the Padded Divider Market?

Smurfit Westrock, DS Smith, Sonoco Products, Huhtamaki and Sealed Air hold 24% of the market. Freight limits and differing material capabilities keep concentration unusually low.

Which country is growing fastest?

India leads at 10.4%, with manufacturing output and e-commerce parcel volumes both expanding rapidly rather than either one of them substituting for the other at all.

Report Segmentation Architecture

The full report scope spans multiple orthogonal segmentation dimensions, with cross-tabulated demand data provided for each dimension pair. Coverage extends further to regional breakdowns, trend trajectories, and the competitive detail needed to support segment-level decision-making.

By Material and Format

  • Corrugated Fibre Dividers
  • Moulded Pulp Inserts
  • Foam and Expanded Polymer Dividers
  • Returnable Plastic Dunnage
  • Textile and Wrapped Protective Dividers
  • Paperboard and Chipboard Partitions

By End-Use Industry

  • Glass, Ceramics and Fragile Goods
  • Automotive and Component Handling
  • Electronics and Precision Products
  • Beverage and Bottled Products
  • E-commerce and Multi-Item Fulfilment
  • Cosmetics and Personal Care

By Distribution Model

  • Single-Use Converted Supply
  • Closed-Loop Returnable Systems
  • Managed Pool Services
  • Cut-to-Order Fulfilment Supply
  • Distributor and Regional Channel

By Region

  • North America
  • Western Europe
  • East Asia
  • South Asia and Pacific
  • Latin America
  • Middle East and Africa
  • Eastern Europe

Scope, Methodology, and Coverage

Every figure in this report is reproducible from documented input assumptions. The scope below maps the historical period, the forecast horizon, the segmentation dimensions, and the countries covered, alongside the underlying primary and qualitative methodology.
Historical Period
2020 to 2025
Forecast Period
2026 to 2036
Base Year
2025 (USD billions; MMA Primary Research Dataset, August 2026)
Market Definition
The market comprises padded dividers, partitions and protective inserts used to separate and cushion items within cases and containers, including corrugated fibre dividers, moulded pulp inserts, foam and expanded polymer dividers, returnable plastic dunnage, textile and wrapped protective dividers, and paperboard and chipboard partitions, supplied under single-use, closed-loop, managed pool, cut-to-order and distributor arrangements. Value is measured at converter level on divider and insert revenue. Outer cases and cartons, void fill and loose cushioning, pallets and unit load devices, wrapping films sold in roll form, and returnable container bodies fall outside scope.
Quantitative Units
USD billions (current prices); million units supplied; USD per thousand units by material and format
Segmentation Dimensions
By Material and Format; By End-Use Industry; By Distribution Model; By Region
Regions Covered
North America, Western Europe, East Asia, South Asia and Pacific, Latin America, Middle East and Africa, Eastern Europe
Countries Covered
China, Japan, South Korea, Taiwan, India, Thailand, Vietnam, Indonesia, Australia, United States, Canada, Mexico, Brazil, Argentina, Colombia, Chile, Germany, France, Italy, Spain, Netherlands, United Kingdom, Sweden, Poland, Czechia, Slovakia, Hungary, Turkey, United Arab Emirates, South Africa
Key Companies Profiled
Smurfit Westrock, DS Smith, Sonoco Products, Huhtamaki, Sealed Air, Mondi, Ranpak, Pregis, Storopack, Hartmann Packaging, UFP Technologies, Nefab, ORBIS Corporation, Schoeller Allibert, Tri-Wall, Green Bay Packaging, Packaging Corporation of America, Cascades, Klabin, Nippon Molding
Quantitative Methodology
Primary survey, n=3,800 respondents, Q4 2025, six countries; demand-side model with trade association cross-validation
Qualitative Methodology
47 expert interviews, Q4 2025; applied to validate demand model assumptions, identify emerging dynamics, and assess competitive positioning
Report Format
PDF and XLSX data workbook (Word format preview document)
Publisher
Market Minds Advisory
Report Code
MMA-2026-PAC-230
Published
August 2026
Contact
sales@marketmindsadvisory.com | www.marketmindsadvisory.com

Purchase the full Padded Divider Market Report (2026 to 2036).

The full report sizes the global padded divider and protective insert market to 2036 across six materials and formats and seven regions, measured at converter level. It quantifies full damage cost against divider cost, which is the arithmetic that changes how these products get specified and which almost no purchasing process performs. Competitive analysis covers 20 converters on one consistent revenue basis, with moat and risk assessment for the two leaders. Material substitution is assessed against measured protective performance rather than regulatory direction alone. Four quantified revenue levers close the analysis.
Six material and format segments with individual growth rates
Full damage cost quantified against divider cost per pack
Material substitution assessed against measured protective performance
Machine erection compatibility mapped across format types
Twenty-converter competitive map on one consistent revenue basis
Four quantified revenue levers with commercial impact ranges

Built For The People Who Decide

From boardroom strategy to bench-side execution, this report is read cover-to-cover by leaders shaping the next decade of their industry, turning demand scenarios, market dynamics and valuation benchmarks into decisions.
CXOs/ Presidents/ VPs/ Managers
M&A and Corporate Development
Strategy Teams and R&D Heads
Procurement and Product Directors
Regulatory and Compliance Leaders
Investor Relations and Equity Analysts