Market Minds Advisory
Packaging Waste Recycling Market

Packaging Waste Recycling Market: A Fee Business With a Materials By-Product

Producer fees rather than commodity sales pay for most of this system, which is why a tonne of packaging waste is worth several times more in one jurisdiction than in the one next door.

Lead Analyst

Bilal Shaikh

Published

September 2026

Make Smarter Decisions with Customized Research Insights

Request a free sample report and evaluate market opportunities, growth trends, and competitive dynamics relevant to your business needs.

2025 MARKET VALUE$62.4BMarket Size 2025
2036 FORECAST VALUE$142.6BBase Case , 2026 to 2036
CAGR 2026 TO 20367.8 %Bull 9.0% / Bear 6.6%
INCREMENTAL OPPORTUNITY$75.3BNet 10- year value creation
EXPANSION MULTIPLE2.12x2036 value over 2026 base
Strategic Levers
M&A Pipeline
Regional Outlook
Country Rankings
Competitive Intelligence
Segmental Deep-dive
Call-Us : 91 93563 13602

Executive Snapshot and Market Trajectory

Almost everyone models this as a commodities business and gets the economics wrong from the start. Producer responsibility fees fund 58% of system revenue, and material sales fund the volatile remainder. What a tonne is worth depends mostly on which jurisdiction happened to collect it.
Growth here follows regulation rather than material demand. Food-grade polyester recycling grows fastest at 11.7%, exactly 1.50 times the market rate, because recycled content mandates created obligated demand that reprocessing capacity has never matched. Flexible film recovery follows at 10.3%, growing from a very low base indeed. Western Europe holds the largest value pool, well above its framework band, because mature fee systems there pay for collection that commodity value alone would never fund.
Concentration reaches only 16% across the top five on annual packaging tonnage processed, because municipal contracts are awarded locally and nobody has ever consolidated them. The number the industry avoids publishing is yield: around 61% of collected tonnage leaves reprocessing as usable output. Everything else is contamination, moisture, rejects, or plain process loss. Headline recycling rates measured at the kerbside overstate performance considerably, and everybody in the industry knows it.
Market Definition
This market covers collection, sorting, and reprocessing of post-consumer and post-commercial packaging waste into secondary raw materials, measured across producer responsibility fee revenue, gate fees, and recovered material sales. Scope spans paper and board, glass, aluminium and steel, polyester, rigid polyolefins, and flexible film streams. Non-packaging waste streams, landfill and energy recovery operations, virgin material production, converter process scrap handled internally, and reusable packaging pool services are excluded.
Base Year Value
$62.4B in 2025 (MMA Primary Research Dataset, August 2026)
Forecast Period
2026 to 2036, eleven discrete annual values
CAGR
7.8% base case. Bull 9.0%. Bear 6.6%.
Fastest Growth Segment
Food-Grade Polyester Recycling: 11.7% CAGR
Fastest Growth Country
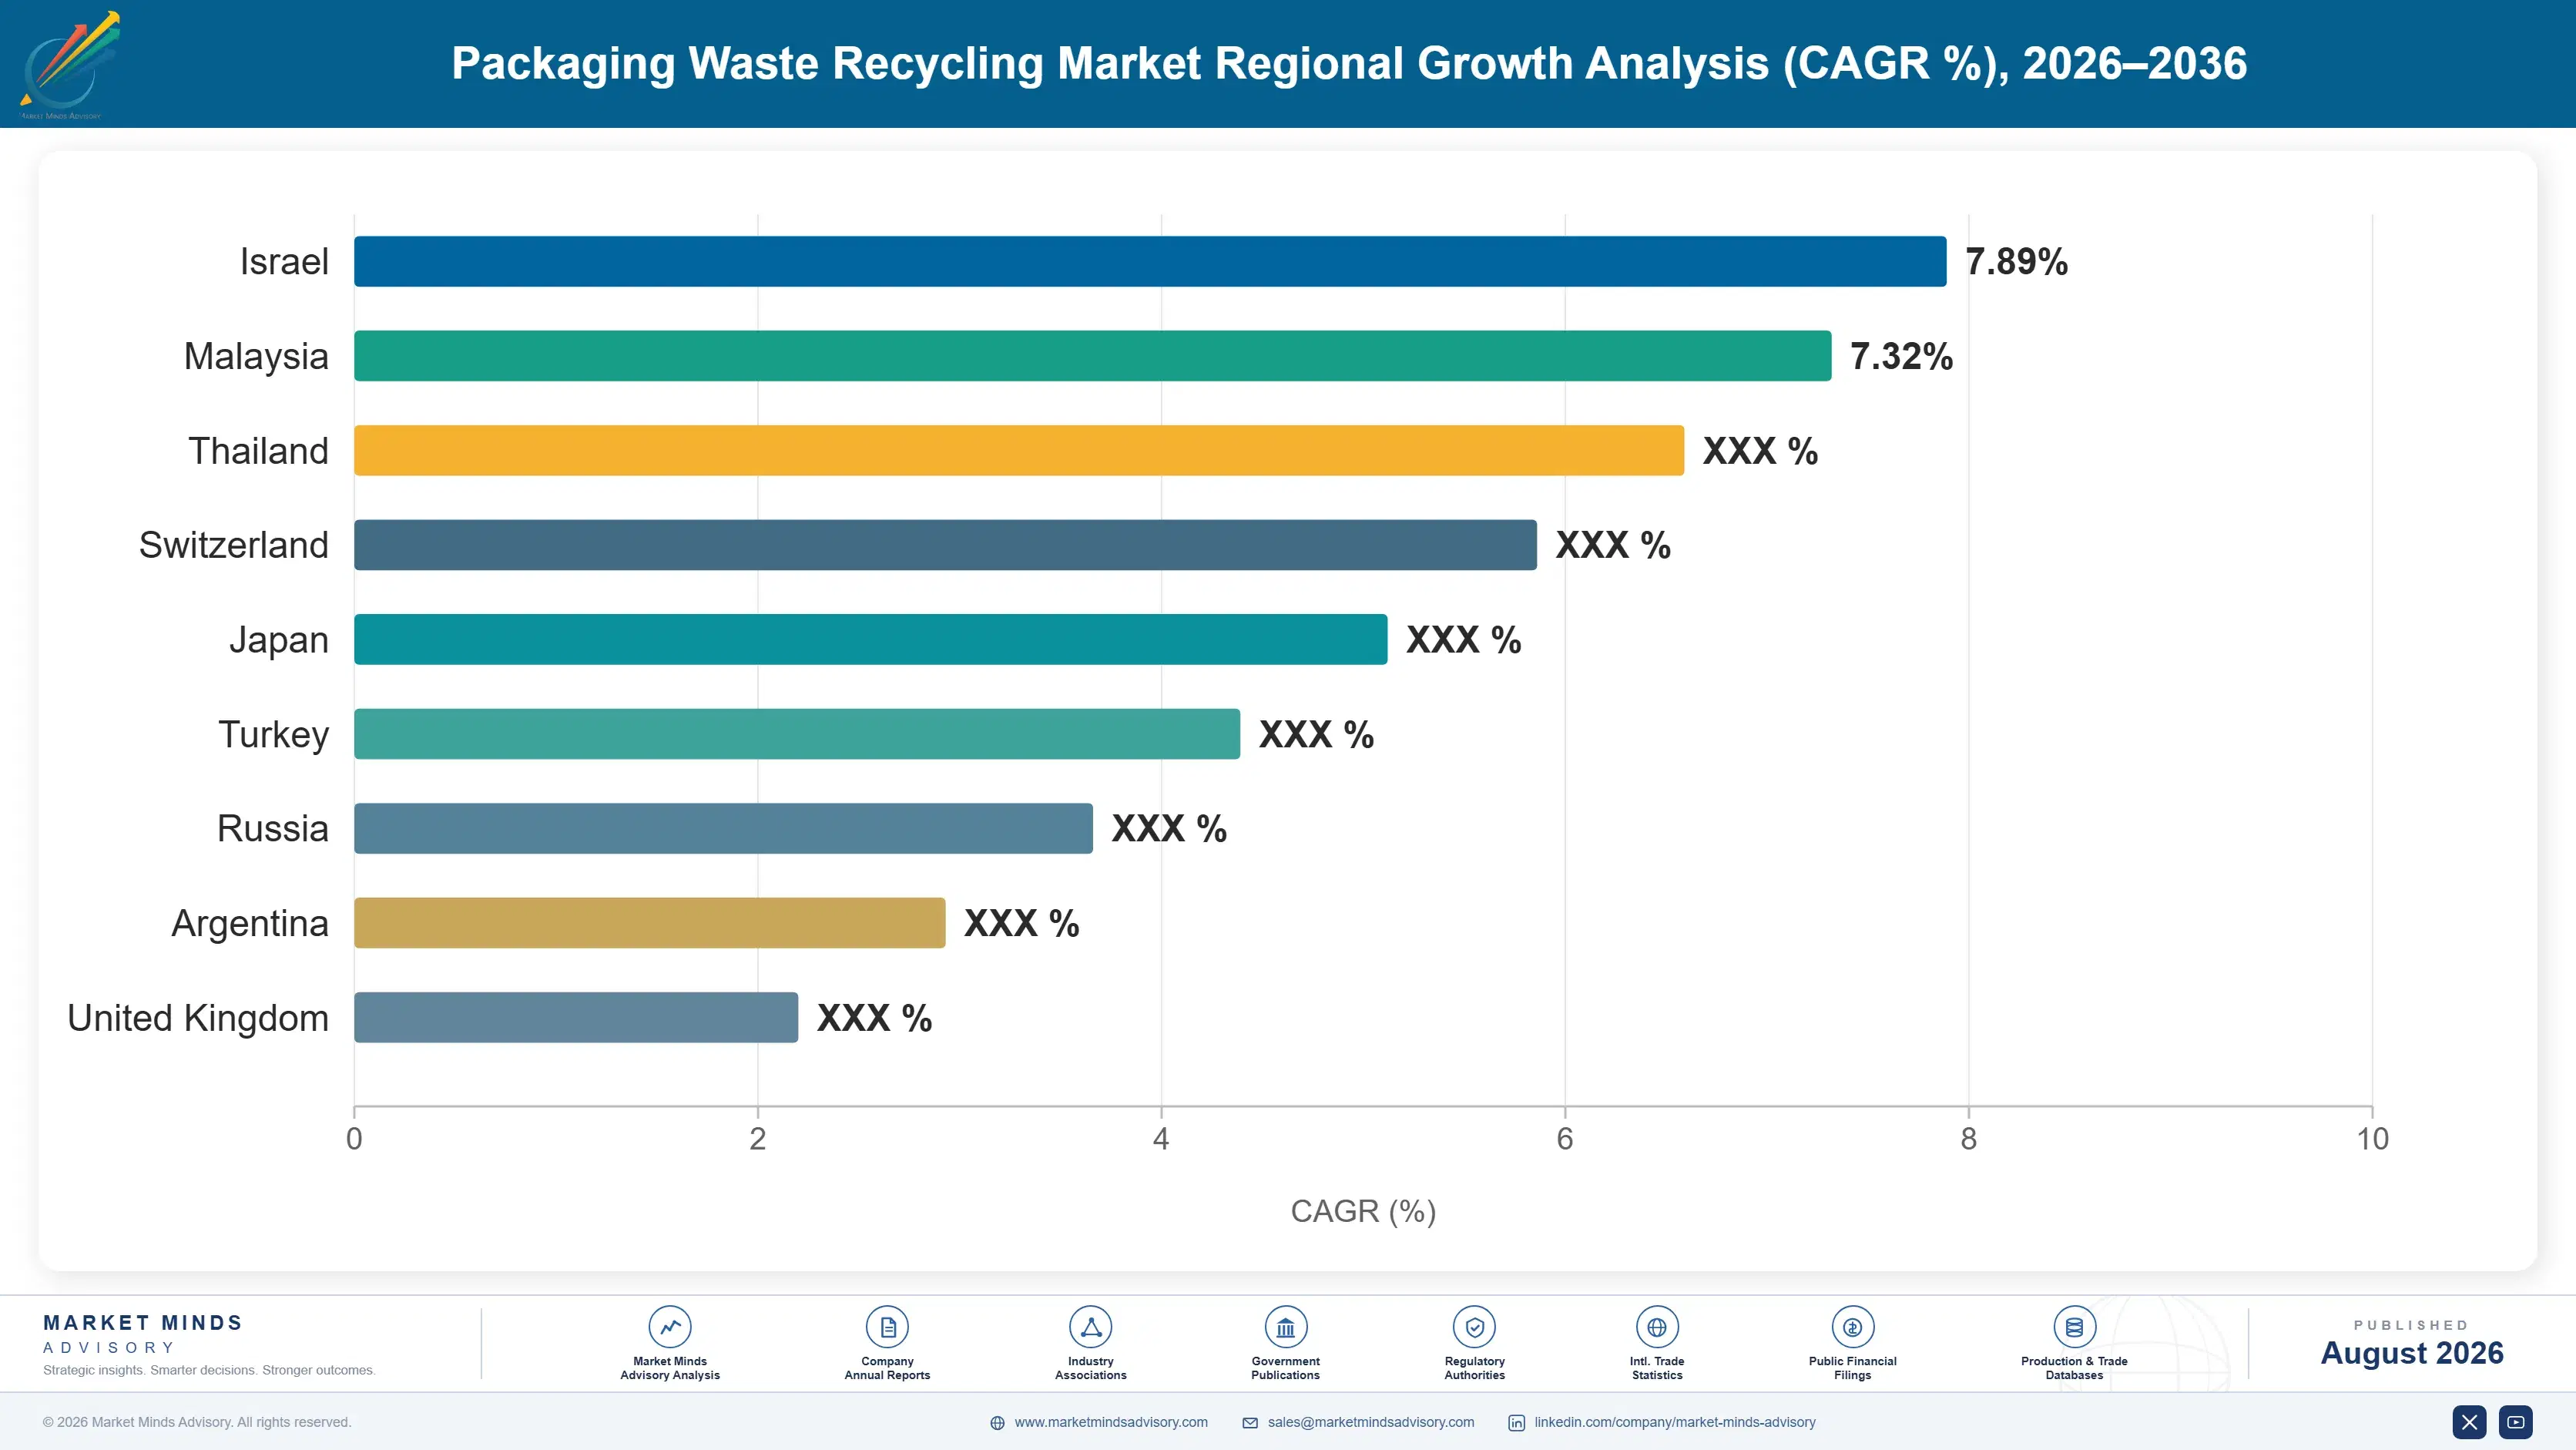
India: 13.8% CAGR
Fastest Growth Region
South Asia and Pacific: 10.0% CAGR
Largest Region
Western Europe: 31% of 2025 global value
Market Leaders
Veolia. Remondis. Suez. Waste Management. Republic Services. Source: MMA Analysis based on company annual reports.
Primary Survey
n=3,800 procurement and R&D decision-makers, Q4 2025, six countries
Methodology
Demand-side build-up, cross-validated against public data, 47 expert interviews

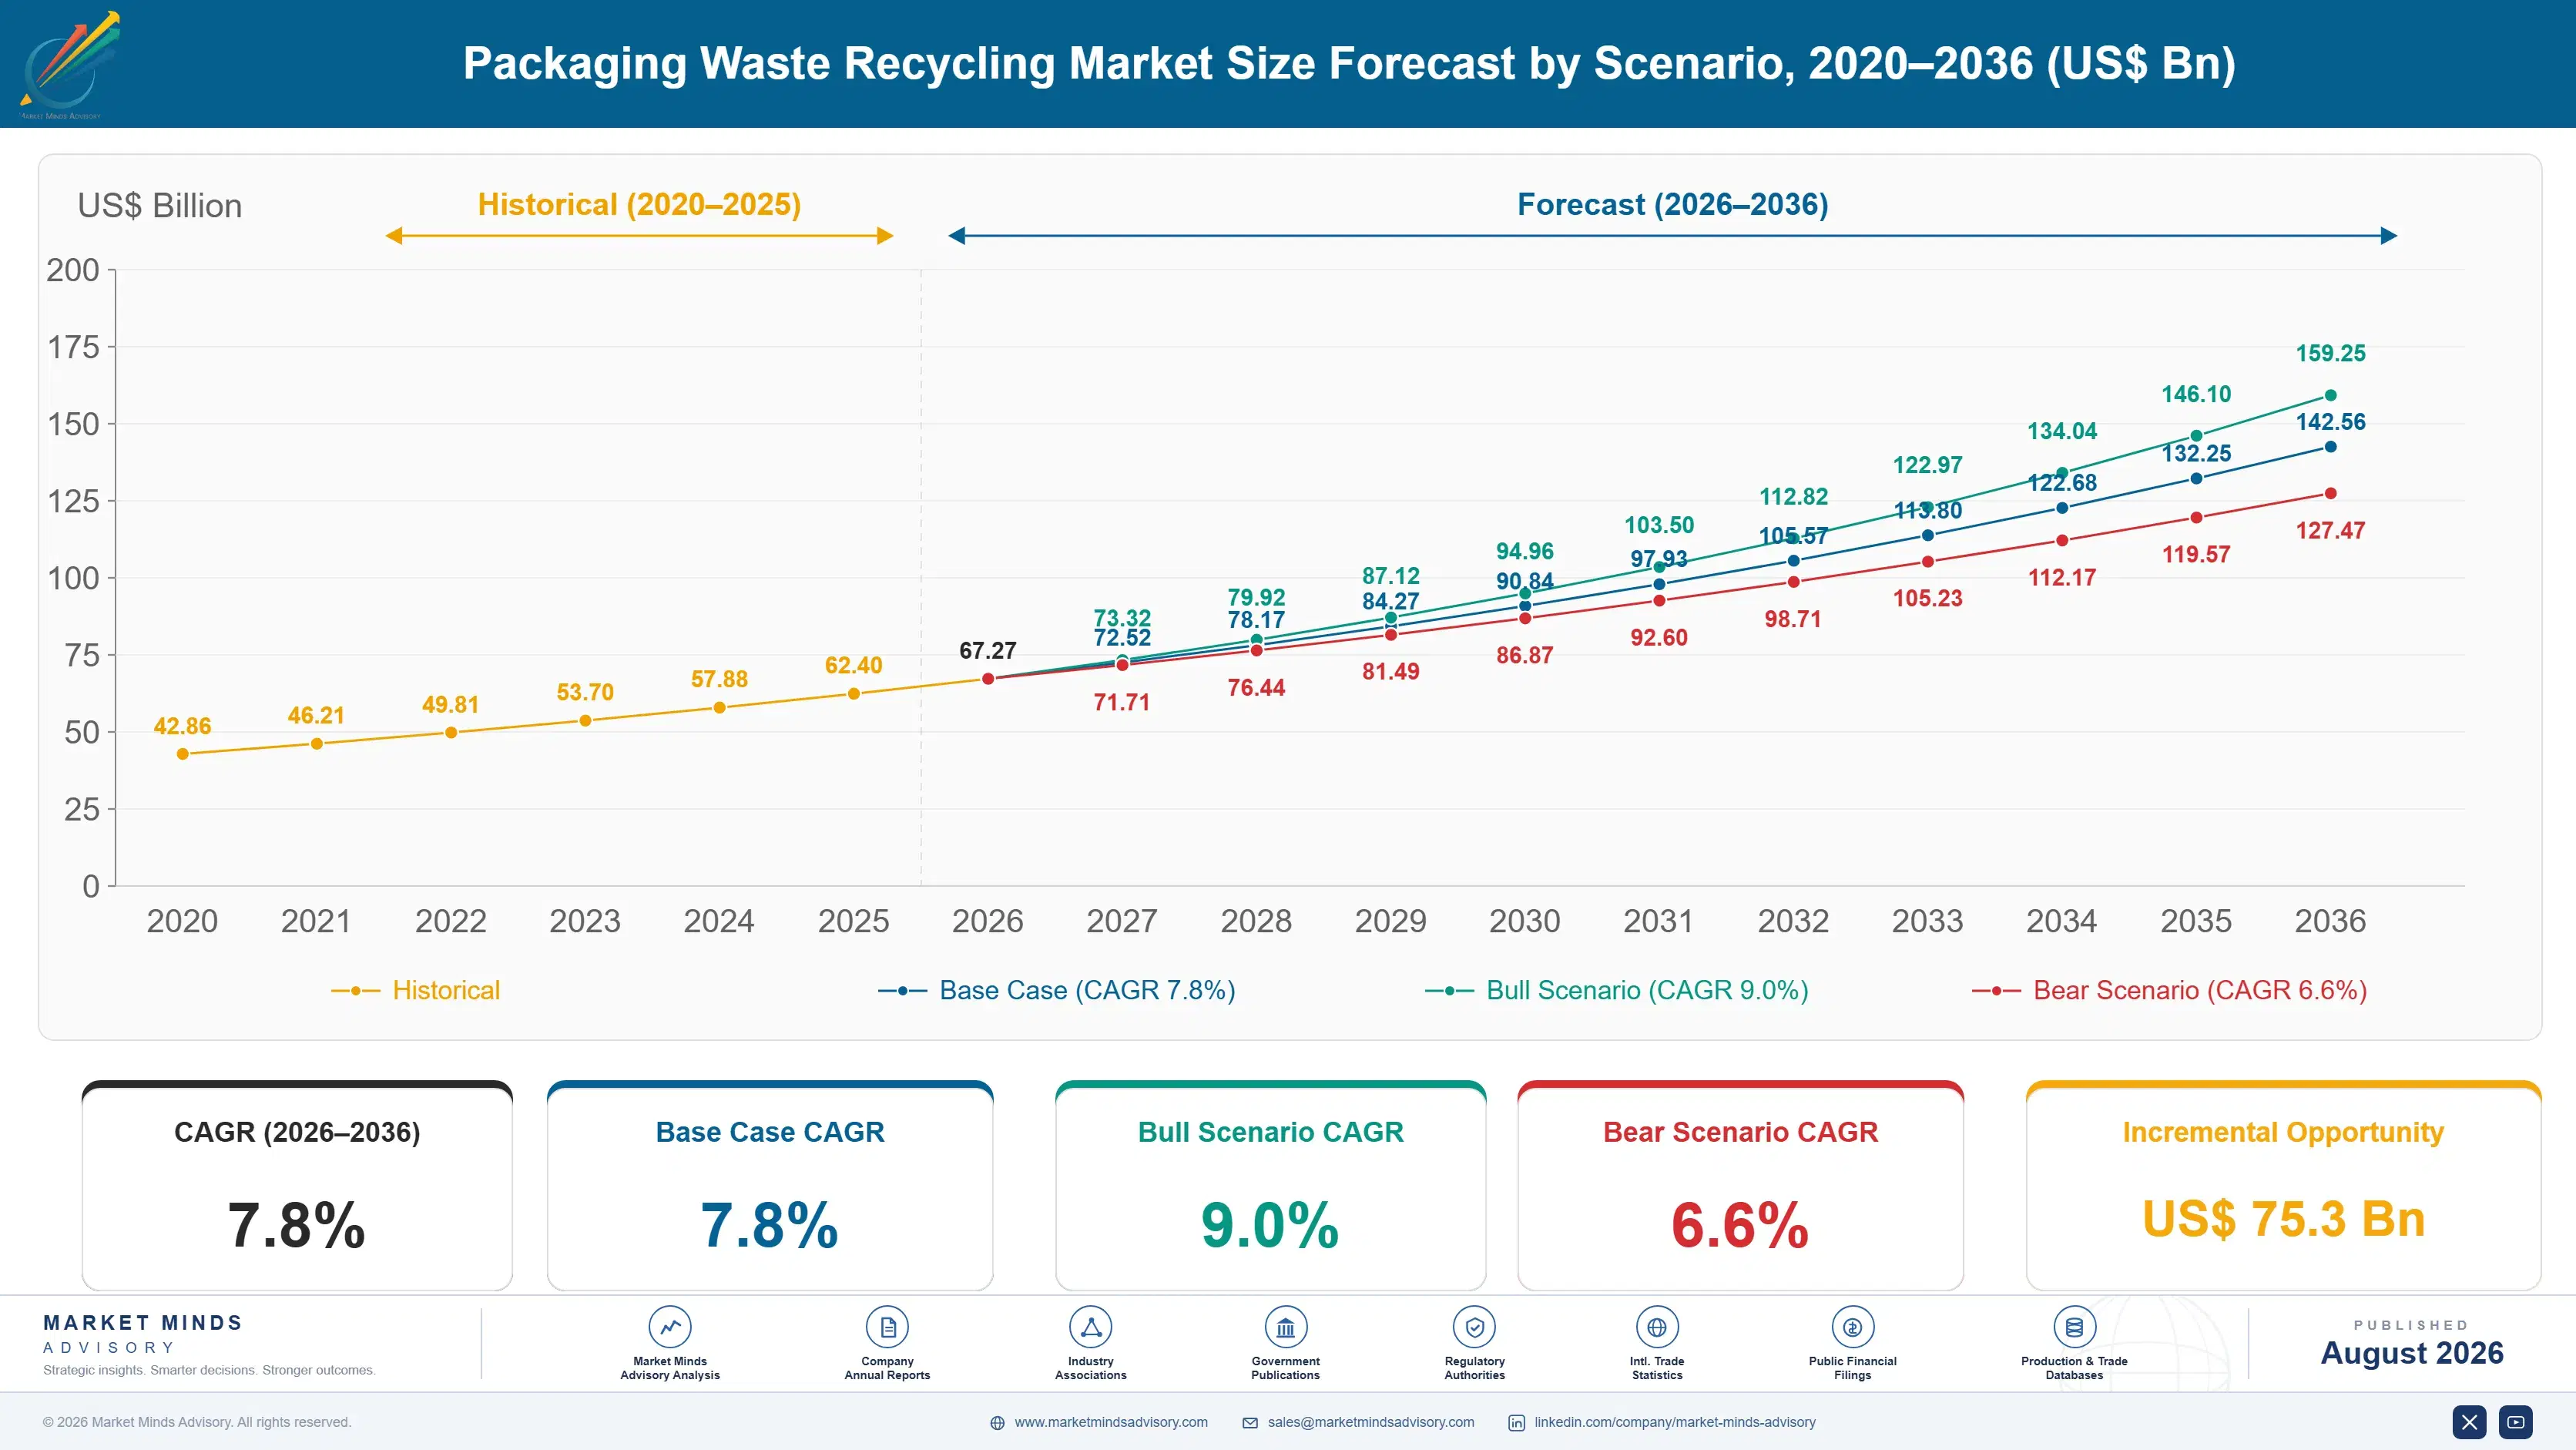
Packaging Waste Recycling Market Forecast Scenarios

packaging-waste-recycling-market-size-forecast-scenario-1787299149630
The 2020 to 2025 period was reshaped by import restrictions and then by mandates. Chinese and subsequent Southeast Asian bans on contaminated recovered material collapsed export routes that Western collection systems had depended on for decades, forcing domestic reprocessing investment. Recycled content mandates then arrived and inverted the economics of polyester entirely. A 6.4% historical rate averages a collapse in export value against a mandate-driven scramble for domestic capacity.
Three mechanisms carry the 7.8% base case. Producer responsibility scheme expansion is the largest, with United States states. India, and further Asian markets introducing fee systems that fund collection where material value never could. Recycled content mandates are the second, creating obligated demand for specific grades that nobody can substitute away from. And eco-modulated fee structures are the third, which raise average fees as producers are charged more for packaging that sorts badly.
The 9.0% bull case rests on digital watermarking or comparable identification reaching commercial sorting scale, which would bring flexible laminates into recovery from a 12% base and add an entire stream. The 6.6% bear case is chemical recycling capacity underdelivering against announced projects, leaving mandated recycled content unattainable and forcing regulators to soften targets rather than enforce them.

Where the Money Actually Comes From

Producer responsibility fees fund 58% of this system, which means the operator's principal customer is a packaging brand rather than a commodity buyer. That single structural fact explains why identical material carries wildly different value across borders, why operators bid on municipal contracts rather than on material spreads, and why a change in fee legislation moves this market more than any change in resin pricing ever has.
TOP FIVE CONCENTRATION16%Municipal contracting keeps this among the most fragmented sectors
PRODUCER FEE FUNDING SHARE58%Producer fees rather than material sales fund the system
COLLECTION TO OUTPUT YIELD61%Tonnes leaving reprocessing against tonnes entering collection points
FOOD-GRADE RECYCLED PREMIUM19%Recycled polyester trades above virgin instead of below it
FLEXIBLE FILM RECOVERY RATE12%Laminated and multi-layer packaging actually reprocessed anywhere today
ECO-MODULATED FEE SPREAD3.4xDifference between best and worst recyclability fee bands
The second fact the industry prefers not to discuss is yield. Roughly 61% of what enters a collection system leaves reprocessing as usable secondary material. The rest is contamination, moisture, sorting rejects, and process loss, and headline recycling rates measured at the collection point rather than at reprocessing output overstate performance considerably. Investment decisions get built on tonnage that does not exist.
Two forces shape the next decade. Recycled content mandates inverted polyester economics, so food-grade recycled resin now trades 19% above virgin while recycled polyolefins still trade below it. And eco-modulated fees, spreading 3.4 times between best and worst recyclability bands, are changing packaging design faster than any recycled content rule has managed. Neither force originated with anybody working in recovery, and both now govern where the money goes.
"Ask an operator what a tonne of mixed plastics is worth and they will ask you which country it was collected in before they answer. That tells you everything. The material has a price, but the fee attached to it has a much bigger one, and the fee is set by legislators rather than by markets."
Director. Circular Materials and Recovery Systems Practice · MMA Packaging and C

Market Trends

Eco-Modulated Fees Change Packaging Design Faster Than Mandates

Producer responsibility schemes increasingly vary fees by how recyclable a pack actually is, and the spread between best and worst bands now reaches around 3.4 times in the more developed systems. That turns a design decision into a recurring cost line visible on a brand's own accounts every quarter. Recycled content mandates ask producers to buy something; eco-modulation charges them for something, which reaches procurement far more directly. Packaging redesign attributable to fee bands is now running ahead of redesign attributable to any content requirement anywhere. Fee bands reach procurement in a way mandates never do.
Market Impact: India grows at 13.8% annually
Recycled Content Mandates Inverted Polyester Economics Completely

Beverage bottle recycled content requirements created obligated demand for food-grade recycled polyester that bottle-to-bottle capacity has never matched, so the recycled grade now trades roughly 19% above virgin resin. Every textbook assumption about recycled material being the cheap option fails here. Recycled polyolefins face no equivalent mandate and still trade below virgin, which means one operator can be selling two output streams whose economics run in opposite directions. Investment naturally follows the mandated grade, leaving polyolefin recovery chronically underfunded. Investment naturally follows the mandated grade rather than need, which leaves polyolefin recovery chronically underfunded.
Market Impact: Yield improved from 61% baseline

Market Opportunities and Growth Drivers

Producer Responsibility Schemes Reach Markets That Never Had Them

Several United States states have enacted producer responsibility legislation for packaging. India enforces obligations under its plastic waste rules, and further Asian and Latin American markets are drafting schemes. Each introduction converts a cost-recovery problem into a funded system almost overnight, because fees pay for collection and sorting that material value alone cannot support. India contributes the fastest national growth rate in this forecast at 13.8%. Operators positioned before a scheme starts capture contracts that latecomers find already awarded for five or seven years. Contracts run five to seven years once awarded.
Market Impact: Only 12% of flexibles recovered

Import Restrictions Forced Domestic Reprocessing Capacity Investment

Export routes that absorbed contaminated recovered material for decades closed when China and then Southeast Asian markets restricted imports, and the material had nowhere to go. That forced domestic sorting and reprocessing investment across Europe. North America, and Australia at a scale nobody had planned for. The resulting capacity is now an asset rather than a cost, since mandated recycled content requires domestic supply that imports would not have satisfied anyway. Quality standards rose sharply once material had to be reprocessed rather than shipped away. Mandated recycled content requires domestic supply anyway.
Market Impact: Yield sits at 61% of intake

Market Restraints and Challenges

Flexible Laminates Defeat Every Sorting Technology In Service

Near-infrared optical sorting identifies material by reflected spectrum, and a multi-layer laminate returns a signal that belongs to no single polymer while carbon-black pigmented packs return almost nothing at all. Only about 12% of flexible packaging is recovered anywhere. The root cause is that these structures were engineered for barrier performance decades before anybody considered how they would be identified at end of life. Digital watermarking, tracer additives, and design simplification are all being trialled, and none has yet reached commercial sorting scale. Producer fees cover the entire cost of handling them.
Market Impact: Fee spread reaches 3.4 times

Yield Loss Undermines Every Published Recycling Statistic

Around 61% of collected tonnage emerges from reprocessing as usable secondary material, and the remainder disappears into contamination, moisture, sorting rejects, and process loss. The root cause is that collection systems are measured at the kerbside while performance should be measured at reprocessing output, and the two figures differ enormously. Commercial impact is investment decisions built on tonnage that does not exist. Operators are moving toward output-based contracting, improved front-end contamination control, and public reporting measured at the final recycling operation. Output-based contracting aligns the operator with the outcome, which tonnage-based contracting never did.
Market Impact: Recycled polyester trades 19% above
4 additional market trends, 2 additional growth drivers, and 3 additional restraints and challenges are covered in the full report. Contact sales@marketmindsadvisory.com to access the complete intelligence.

Segment CAGR and Growth Architecture

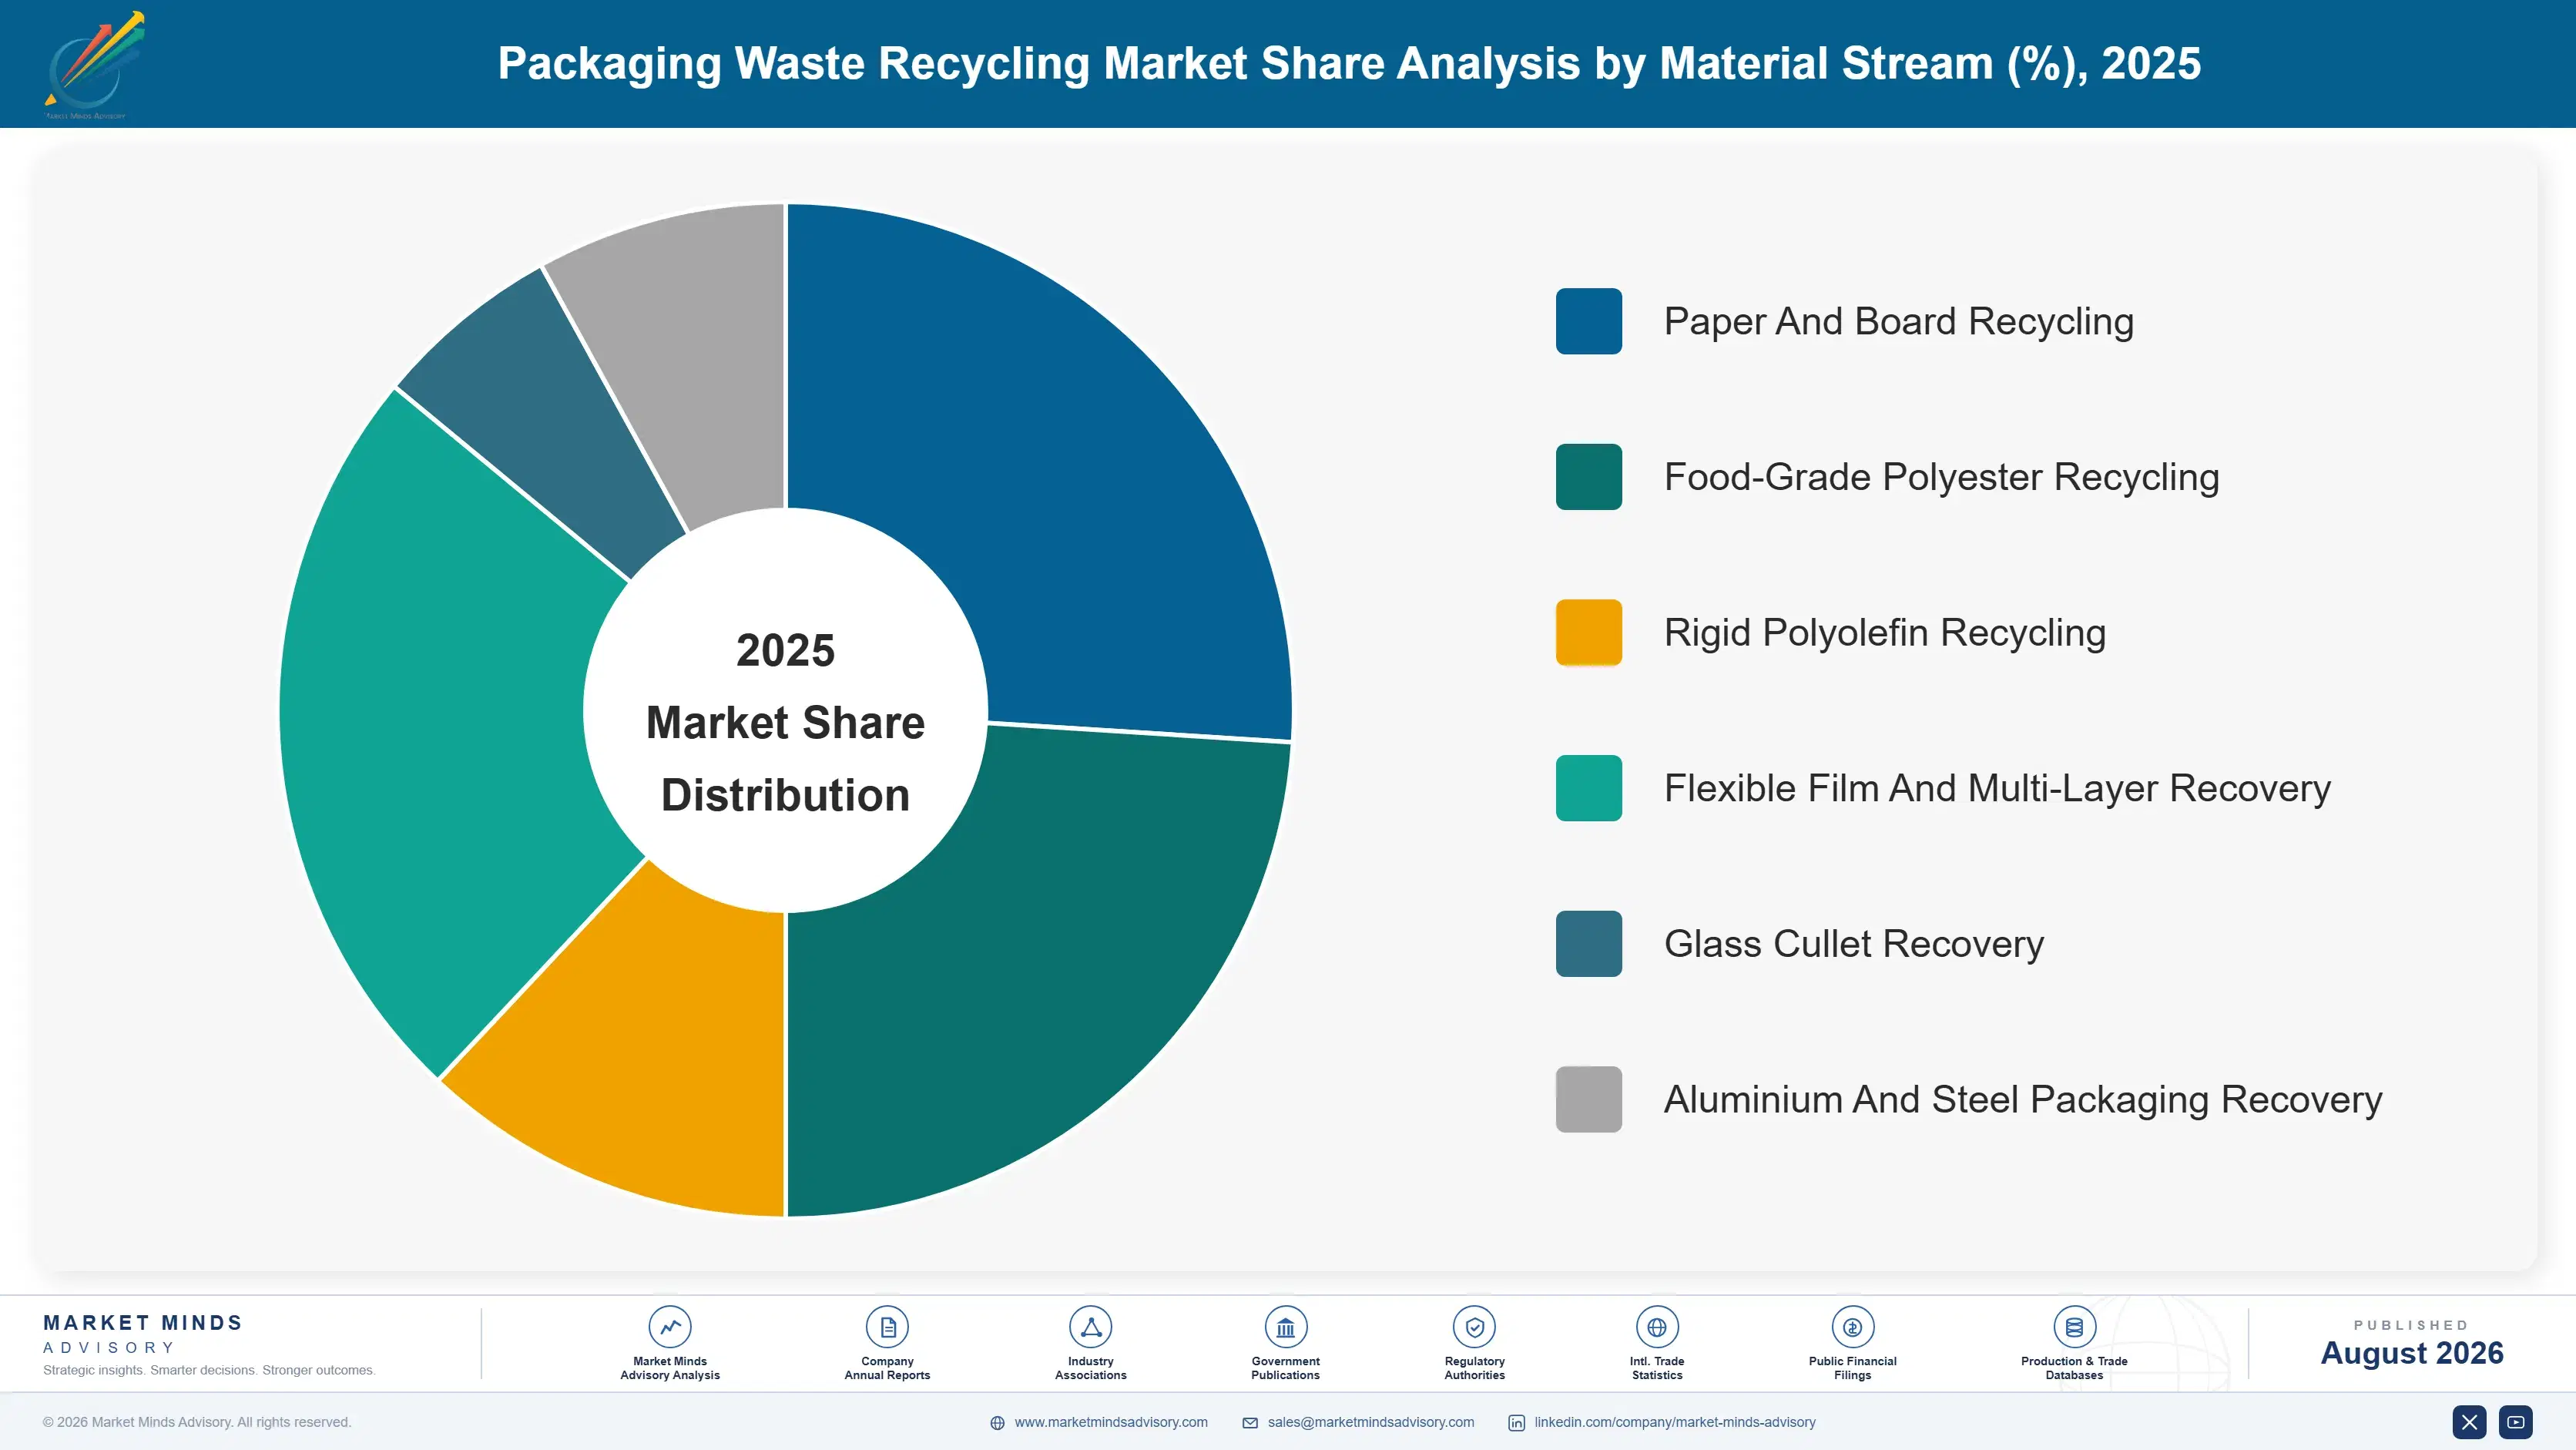
Segmentation follows material stream, because each stream carries its own collection infrastructure, sorting technology, reprocessing route, and entirely separate economics on the output side. Collection channel and geography both cut across every stream rather than separating them, so neither functions as a workable primary dimension for this market. Six streams result, and their output economics differ completely.
packaging-waste-recycling-market-market-share-analysis-1787299150160

Food-Grade Polyester Recycling

The fastest stream at 11.7%, exactly 1.50 times the market rate, and the only one where recycled output commands a premium over virgin material. Beverage bottle content mandates created obligated demand that bottle-to-bottle capacity has never matched, so food-grade recycled polyester trades around 19% above virgin resin. That inversion draws investment away from every other stream, which is both rational and a problem for the system as a whole. Deposit return schemes deliver the cleanest feedstock and the highest yields available anywhere in packaging recovery. The constraint is collection rather than reprocessing, since bottles not captured cannot be recycled at any price. Deposit return delivers the cleanest feedstock available anywhere.
CAGR 11.7%

Flexible Film And Multi-Layer Recovery

Second fastest at 10.3%, growing quickly from a base so low that almost any progress registers as growth. Only around 12% of flexible packaging is recovered anywhere, because near-infrared sorting cannot identify multi-layer laminates and reads carbon-black pigment as nothing at all. Mono-material polyethylene and polypropylene structures designed for recyclability are the upstream answer and they are arriving slowly. Chemical recycling handles mixed flexibles that mechanical routes cannot, though capacity remains far below announced ambition. This is the stream where producer responsibility fees do most of their work, since material value here is frequently negative. Mono-material structures are the upstream answer and arriving slowly, though chemical routes handle mixtures mechanical ones cannot.
CAGR 10.3%
Full segment breakdown across 6 segments available in the complete report.

Regional Architecture and Country Demand Map

Value in this category follows producer responsibility legislation rather than waste tonnage collected, and the gap between the two is enormous. Western Europe sits well above its framework band because mature fee systems pay for collection and sorting that commodity value alone would never fund.

Western Europe

Thirty-one percent, well above the framework band, and the justification is that producer responsibility fee revenue here dwarfs what recovered material is worth. German. French. Belgian, and Nordic schemes have operated for decades, and eco-modulation across those systems now reaches a 3.4 times spread between recyclability bands. Collection infrastructure is dense, deposit return covers beverage containers across most markets, and reporting is measured at the final recycling operation rather than at the kerbside. Growth at 6.3% is the slowest of any region precisely because the systems are already built and fee levels rise only gradually. Deposit return covers beverage containers across most markets here, which delivers far better polyester feedstock.
Share: 31% | CAGR: 6.3% (2026 to 2036)

North America

Twenty-two percent, and the region where the funding model is changing fastest. Several states have enacted producer responsibility legislation for packaging and more are drafting it, which converts municipally funded collection into producer funded systems and multiplies the revenue attached to identical tonnage. Deposit return operates in a minority of states and delivers markedly better polyester feedstock where it does. Import restrictions forced substantial domestic reprocessing investment that is now an asset. Growth at 8.9% is among the highest of any region, driven almost entirely by legislation rather than by any change in waste volume. Deposit return operates in a minority of states only, and delivers markedly better feedstock where it does.
Share: 22% | CAGR: 8.9% (2026 to 2036)
Regional intelligence for 5 additional markets available in the complete report: East Asia, South Asia and Pacific, Latin America, Eastern Europe, Middle East and Africa. Contact sales@marketmindsadvisory.com.
packaging-waste-recycling-market-country-cagr-analysis-1787299150684

How Recovery Operators Actually Earn

Commodity spreads are volatile, publicly visible, and competed away within a few weeks of first appearing anywhere at all. Durable margin comes instead from winning fee-funded contracts, from improving yield rather than chasing raw tonnage, from building capacity against the one grade that trades above virgin, and from advising producers well before they design anything.

Bid For Fee-Funded Contracts Rather Than Commodity Spread

Producer responsibility fees fund 58% of system revenue and arrive on contracted terms lasting five to seven years, while material sales arrive at whatever the spot market pays that month. Operators structured around fee contracts hold predictable revenue that survives a commodity trough intact, and those structured around material spreads do not. Winning a scheme contract typically requires demonstrated yield performance and audited reporting rather than the lowest gate fee. Building that capability costs around 3 million dollars and changes which tenders an operator can credibly enter at all. Commodity troughs do not touch contracted fee revenue.
Market Impact: Reporting capability costs roughly 3 million dollars total

Improve Yield Instead Of Collecting More Tonnage

Around 61% of collected tonnage becomes usable output, so a five point yield improvement adds more saleable material than an eight percent increase in collection volume, and it costs far less to achieve. Front-end contamination control, improved optical sorting, and moisture management all contribute. Operators chase tonnage because tonnage is what municipal contracts historically measured, which is exactly the wrong incentive. Moving contracts onto output-based measurement aligns the operator with the outcome and typically improves yield by four to seven points within two years. Tonnage is what municipal contracts historically measured, which is precisely the wrong incentive.
Market Impact: Adds 4 to 7 points of output yield

Build Food-Grade Polyester Capacity Against Mandated Demand

Food-grade recycled polyester trades roughly 19% above virgin because mandated content requirements outrun bottle-to-bottle capacity, and the next mandated step raises required volumes again. A food-grade reprocessing line costs around 40 million dollars and produces the only recycled output in packaging that commands a premium rather than a discount. Feedstock access through deposit return schemes is the binding constraint rather than reprocessing technology. Operators without a food-grade line are selling into markets where recycled material still trades below virgin. Every other recycled output still trades below virgin resin, which makes this the only premium available.
Market Impact: A food-grade line costs 40 million dollars upfront

Advise Producers On Fee Bands Before Packaging Is Designed

Eco-modulated fees spread 3.4 times between best and worst recyclability bands, and most brand packaging teams do not know which band their design falls into until the invoice arrives. Operators who advise at the design stage build relationships that outlast any single contract and steer material toward streams they can actually process. The service costs little to deliver and is charged at consultancy rates. It also reduces the contamination and unsortable material arriving at the operator's own facility, which improves the yield number simultaneously. It also reduces the unsortable material arriving at your own gate.
Market Impact: Recyclability fee bands differ by 3.4 times over

Who Controls the Margin Pool

Concentration reaches only 16% across the top five measured on annual packaging tonnage processed, and the fragmentation is structural rather than transitional. Collection contracts are awarded by municipalities and scheme operators locally, material travels badly, and no operator has ever consolidated a national position outside a handful of European markets. The leaders are diversified environmental services groups for whom packaging recovery is one line among several. Packaging recovery is on
Competition runs on three fronts. Scheme contract capability is the first, requiring audited reporting and demonstrated yield rather than the lowest price. Sorting technology and yield performance is the second, and it separates operators far more than scale does. Food-grade reprocessing capability is the third, and the qualified operator set remains small. Scale separates operators far less than yield performance does.

Pressure builds from two directions. Chemical recycling entrants promise to handle streams mechanical operators cannot, though delivered capacity trails announcements badly. And brand-owned closed loop arrangements bypass municipal collection entirely for the cleanest and most valuable feedstock. Both pressures target the cleanest and most valuable feedstock, which is exactly what funds everything else.
packaging-waste-recycling-market-company-positioning-matrix-1787299151211

Competitive Moat and Risk Dimensions

VEOLIA

Moat: Scheme contracting and audited reporting

Producer responsibility contracts are awarded on demonstrated yield, audited chain of custody, and reporting that satisfies regulators, none of which a regional operator assembles easily. Holding those capabilities across many jurisdictions lets the company bid where smaller competitors cannot qualify at all. Contracts run five to seven years.
VEOLIA

Risk: Packaging competes for internal capital

Packaging recovery sits inside a water, energy, and waste group where capital competes against infrastructure projects with different return profiles and longer horizons. Specialist reprocessors move faster on food-grade capacity and on sorting technology. Diversified overhead also shows up in gate fee competitiveness against regional operators who carry none of it and bid aggressively on local contracts.
REMONDIS

Moat: Dense German collection network

Operating at high density inside the world's most developed producer responsibility system gives the company scale where fee revenue per tonne is highest. Collection density lowers cost per tonne in a way no processing efficiency matches, and the German system's requirements are thoroughly understood. Building comparable density elsewhere means acquiring incumbents.
REMONDIS

Risk: Concentrated in a mature system

The strongest position sits in a market growing at the slowest rate of any region, where infrastructure is already built and fee levels rise only gradually. Growth is happening where producer responsibility legislation is newly arriving, and those markets require entirely different operating models to serve.

Players Tracked

Prominent Players

Veolia
Remondis
Suez
Waste Management
Republic Services

Other Key Players

Waste Connections
Biffa
Alba Group
Der Grune Punkt
Reclay Group
FCC Environment
Indaver
PreZero
Renewi
TOMRA
Loop Industries
Eastman
Cleanaway Waste Management
Ramky Enviro Engineers
China Tianying

Recent Developments

JANUARY 2025

United States state producer responsibility scheme begins fee collection

A state producer responsibility programme for packaging began collecting fees from obligated producers and awarding collection and sorting contracts to qualified regional operators. The programme is a legislated scheme administered by a producer organisation rather than any commercial arrangement, and contract terms run several years.
Signal: Legislation converts municipally funded collection into producer funded systems, multiplying revenue attached to identical tonnage overnight
MAY 2025

European operator commissions food-grade polyester reprocessing line

A recovery operator commissioned bottle-to-bottle food-grade polyester reprocessing capacity fed by deposit return scheme material. The investment was organic capital expenditure funded internally rather than any joint venture with a resin producer, and offtake is contracted with beverage brand customers. Capacity figures were not disclosed publicly.
Signal: Food-grade capacity is the only recycled output trading above virgin, and everyone is building toward the same feedstock
SEPTEMBER 2025

Indian certificate trading tightens under enforced producer obligations

Indian authorities tightened verification requirements for extended producer responsibility certificates, restricting issuance to reprocessors able to document actual material processing. The action was regulatory enforcement of existing obligations rather than new legislation, and it affects certificate pricing and availability directly. Certificate pricing moved sharply afterwards.
Signal: Enforcement rather than legislation is what turns a paper obligation into a funded system, and India is now enforcing

What It Costs to Recover a Tonne

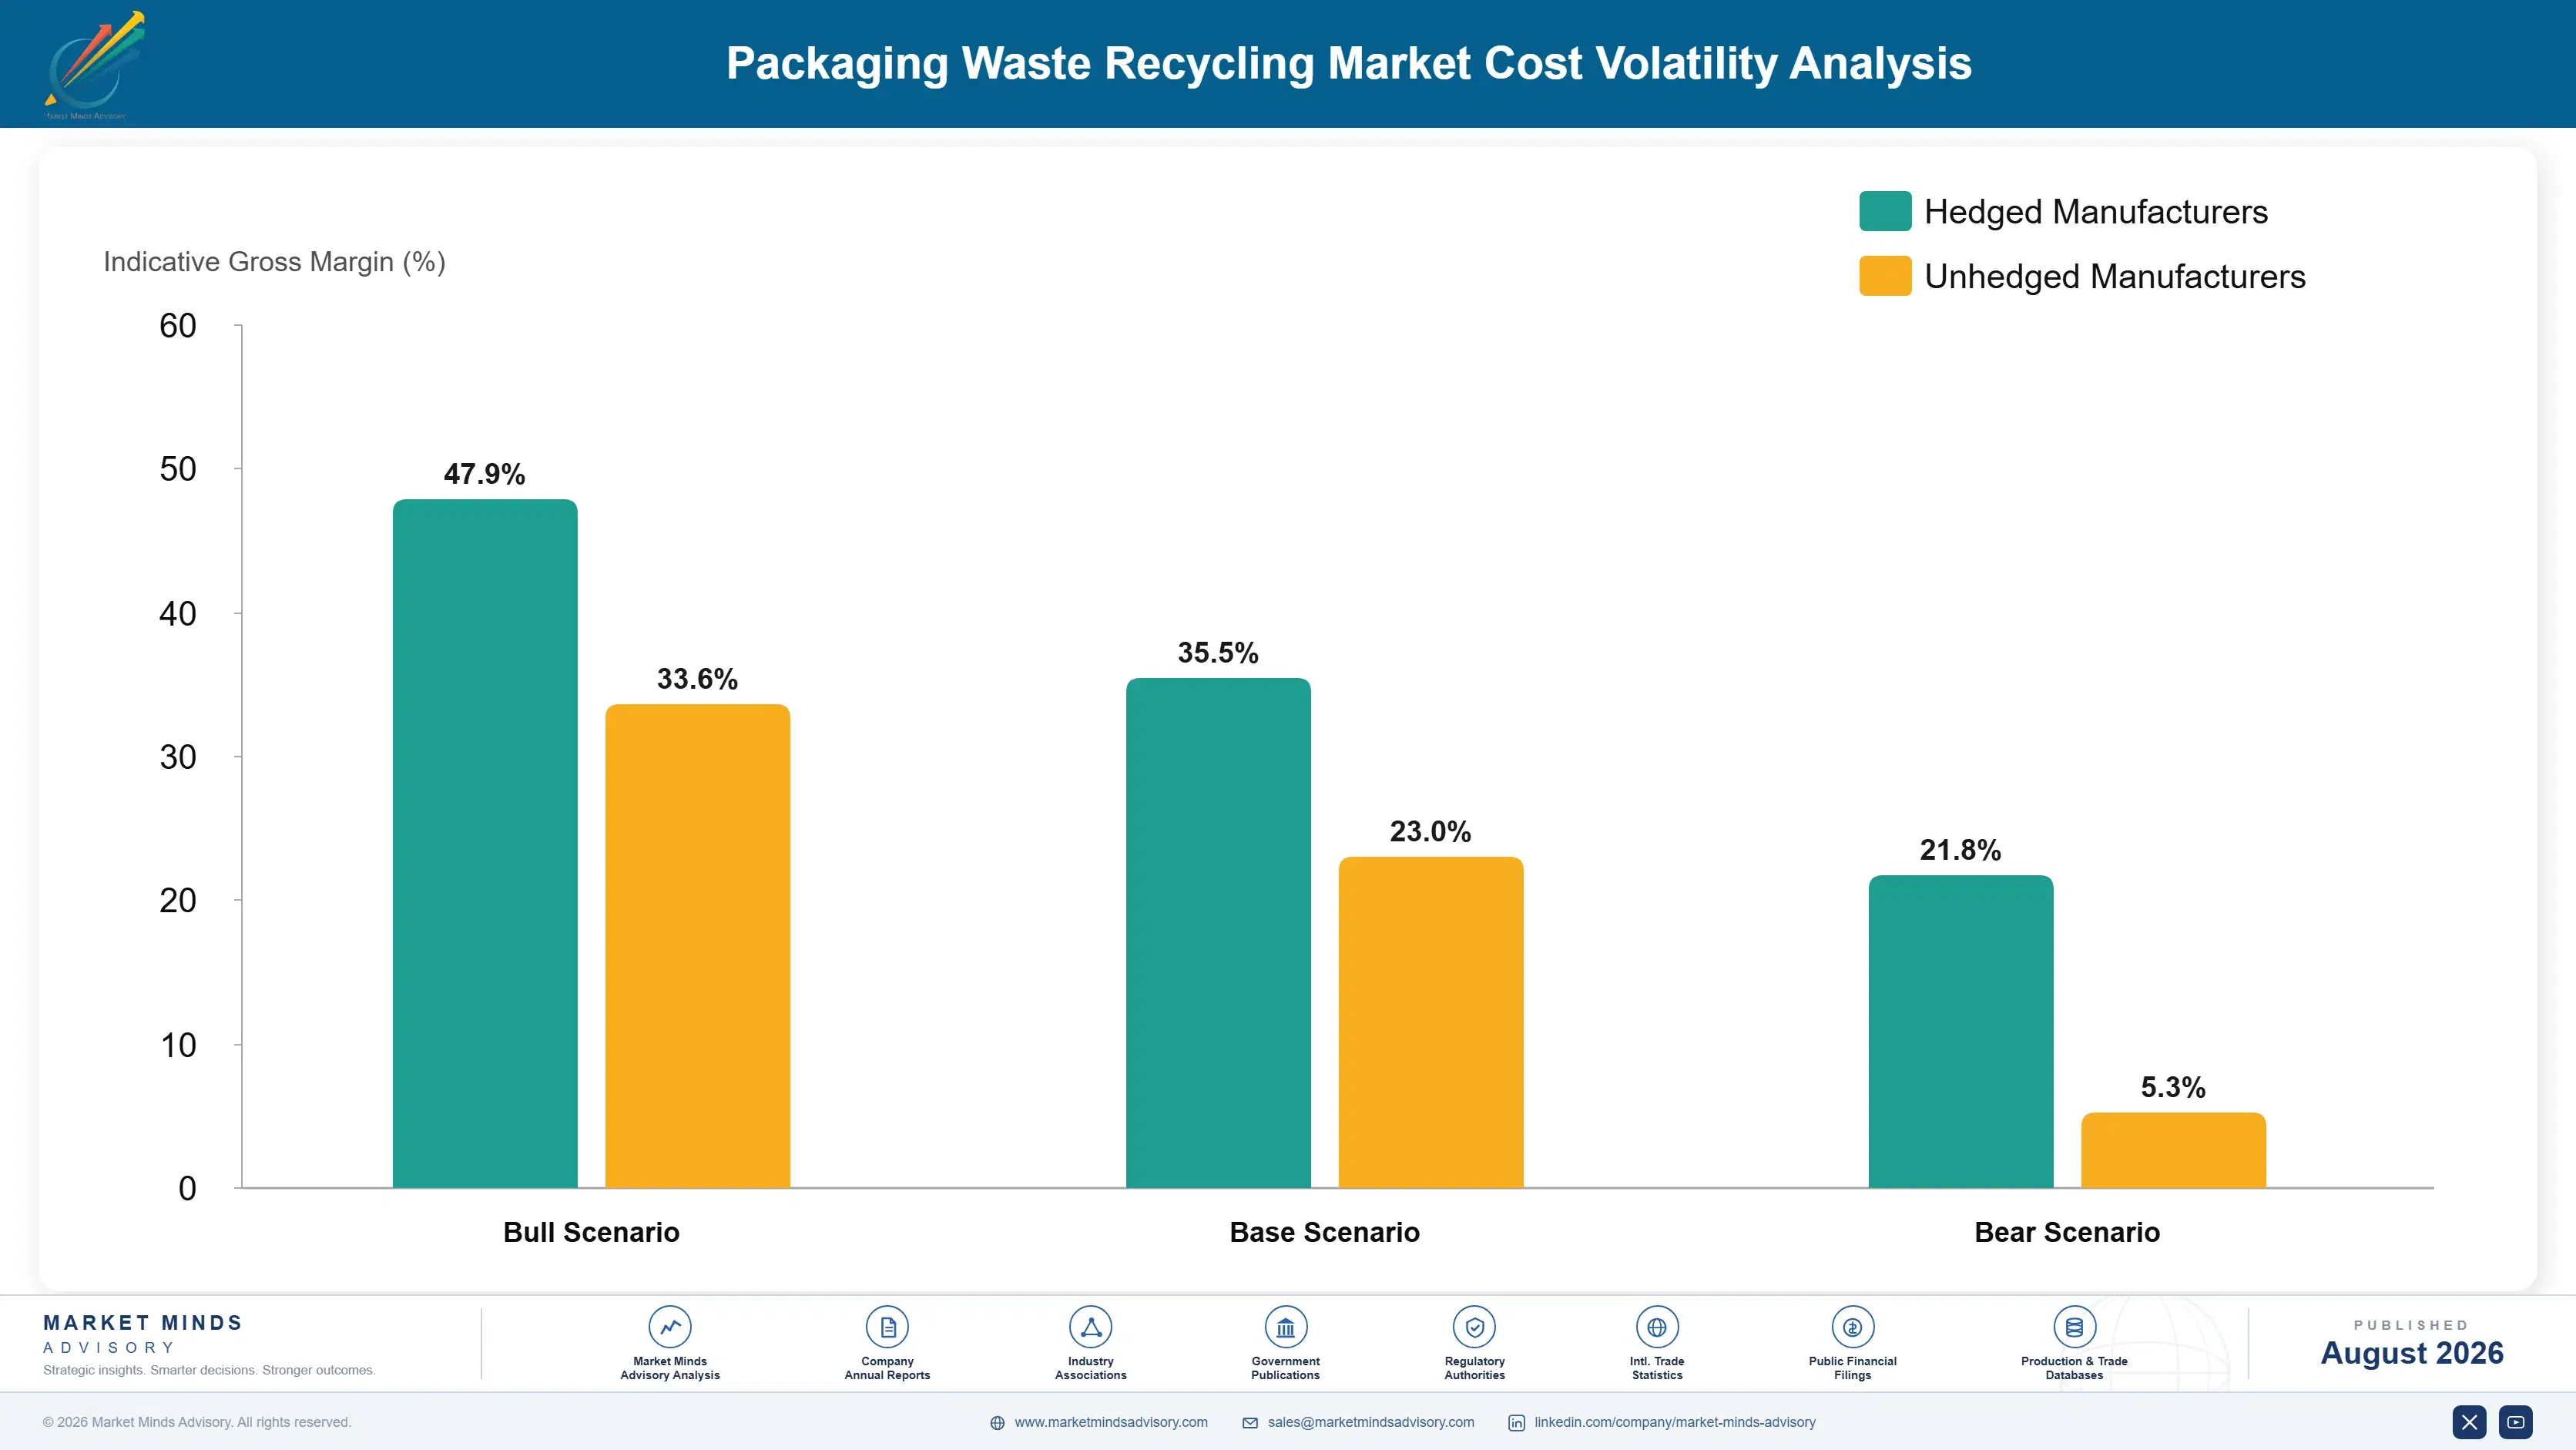
Collection dominates and always has. Kerbside and commercial collection, meaning vehicles, fuel, and crews, runs about 44% of total cost per tonne recovered, and it is almost entirely local. Sorting facility operation adds roughly 23%, reprocessing energy and consumables around 18%, and residue disposal charges make up most of the remainder, rising as landfill taxes increase across most jurisdictions.
Diesel and residue disposal were the exposures that mattered. Fuel prices moved sharply through the recent period and collection fleets have limited ability to reduce consumption, while landfill tax escalators in Europe and parts of North America raised the cost of the 39% of intake that never becomes usable output. EIA reporting on fuel markets documents the first, and the second appears clearly in company annual reports across environmental services.

The competitive disadvantage mechanism runs through collection density rather than processing efficiency. An operator serving a dense urban route recovers a tonne at a fraction of what a rural route costs, and no amount of sorting technology closes that gap. Operators holding contiguous municipal contracts compound that advantage, while those holding scattered contracts pay for fleet mileage without the tonnage to justify it.
packaging-waste-recycling-market-cost-volatility-analysis-1787299151407

Bid for contiguous municipal territories rather than scattered contracts

Collection is 44% of the cost per tonne and route density decides most of that, so two adjacent contracts are worth considerably more to an operator than two distant ones covering exactly the same tonnage. Operators bidding opportunistically end up funding fleet mileage that generates no additional tonnage whatsoever, which nobody ever bothers to model.

Reduce residue tonnage before landfill escalators make it unaffordable

Around 39% of intake never becomes usable output and every tonne of it attracts disposal charges that are rising steadily under landfill tax escalators. Front-end contamination control and improved sorting reduce residue directly, which cuts both disposal cost and the tonnage handled twice. The investment competes against collection expansion for capital and generally offers better returns that nobody models.

Contract residue disposal capacity ahead of tax increases

Landfill and energy recovery gate fees rise with tax escalators that are legislated years in advance and entirely predictable. Contracting disposal capacity on multi-year terms before each step converts a rising cost into a known one. Operators renegotiating annually absorb every increase immediately, which on 39% of intake tonnage is a material margin difference over a contract term.

Portfolio Architecture for Margin Defence

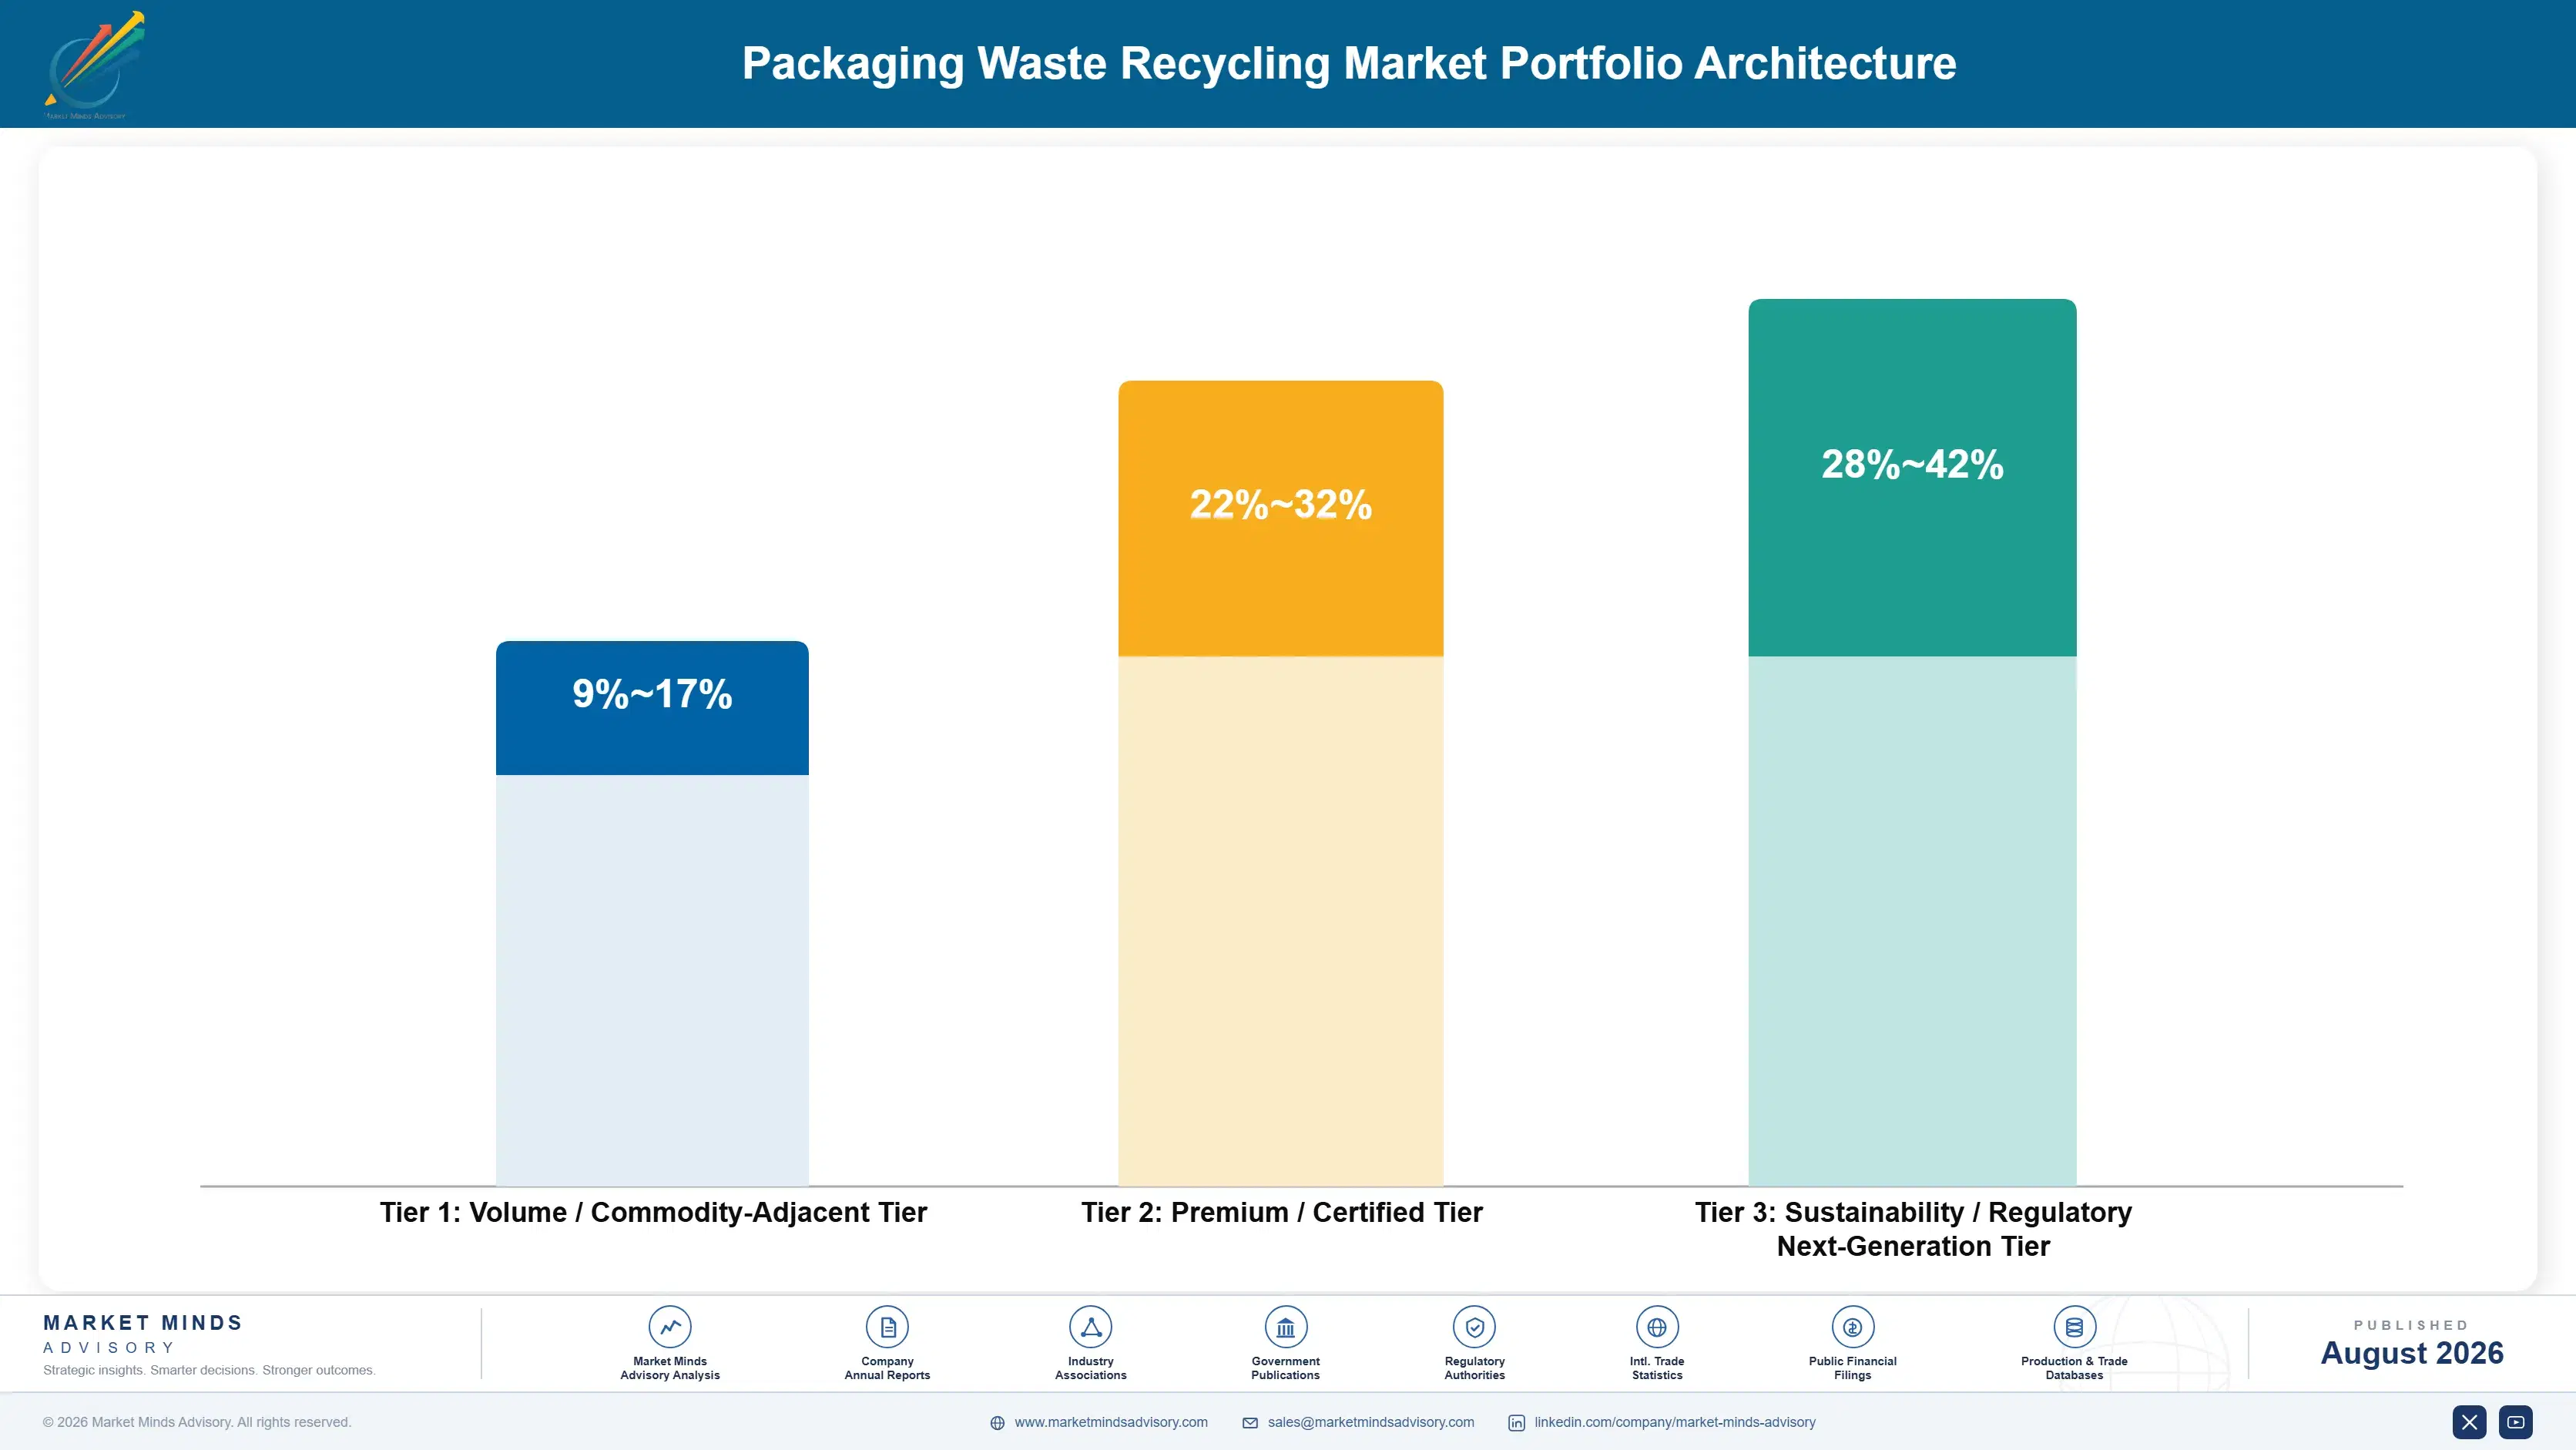
Three tiers describe this business and the margin spread reflects who pays rather than what is processed. Commodity material recovery sold at spot prices sits at the bottom, exposed to a market the operator does not influence. Fee-funded scheme contracts with audited reporting sit considerably higher, carrying five to seven year visibility. And food-grade and specification-guaranteed output occupies a third tier where the operator sells into mandated demand at a premium to virgin material.
The tension is that commodity streams and fee contracts arrive together. A scheme contract obligates an operator to handle glass, mixed plastics, and flexibles whose material value is negligible or negative alongside the polyester and metals that pay. Cherry-picking the profitable streams is not available, which is precisely why fee funding exists in the first place. That obligation is precisely why fee funding exists at all.

High-value pools concentrate where output is specification-guaranteed rather than sold as recovered material. Food-grade polyester and verified recycled content both command prices that quality-graded bales never will. Buyers pay for traceability rather than for the material, which most operators still fail to charge for, and the premium is real.

Volume / Commodity-Adjacent Tier

Baled recovered paper, glass cullet, and mixed plastics sold at prevailing spot prices into open material markets. Thin and volatile margin the operator cannot influence, and the tonnage that scheme contracts oblige them to handle regardless.
Gross Margin: 9-17%

Premium / Certified Tier

Producer responsibility scheme contracts with audited chain of custody, demonstrated yield performance, and multi-year terms. Margin reflects the compliance and reporting capability required to qualify, which most regional operators cannot assemble at all.
Gross Margin: 22-32%

Sustainability / Regulatory / Next-Generation Tier

Food-grade polyester, verified recycled content supply, and specification-guaranteed polymer output sold against mandated demand. Best margin because this is the only recycled output in packaging trading above virgin rather than at a discount.
Gross Margin: 28-42%
packaging-waste-recycling-market-portfolio-architecture-1787299151899

High-value Sub-segments and Strategic Watch-out

Food-Grade Polyester Output

Best margin and fastest growth at 11.7%, and the only recycled packaging output that trades above virgin at roughly a 19% premium. Feedstock access through deposit return rather than reprocessing technology is the genuine constraint on expanding it. Mandated step increases raise required volumes again shortly.
Gross Margin: 28-42%

Producer Responsibility Scheme Contracts

Strong margin and five to seven years of revenue visibility, funding 58% of the whole system and insulating operators from commodity troughs entirely. Qualification requires audited reporting and yield evidence that most regional operators cannot demonstrate. Renewal turns on performance evidence rather than on price.
Gross Margin: 22-32%

Baled Commodity Material Sales

The volume core at thin and volatile margin, priced by markets the operator cannot influence and obligated by the same scheme contracts that pay properly elsewhere. Cherry-picking profitable streams is not permitted, which is exactly why fees exist. Spot pricing moves faster than any contract can follow.
Gross Margin: 9-17%

Flexible And Multi-Layer Streams

The strategic watch-out, recovered at only 12% and frequently carrying negative material value, so fee funding covers the entire cost of handling it. Digital watermarking would transform this stream, and it has not reached commercial scale yet. Mono-material redesign upstream is the other possible answer.
Gross Margin: 11-24%

How Recovery Revenue Repeats

This is contract revenue rather than transactional revenue, which is the opposite of how the industry is usually described. A producer responsibility scheme contract runs five to seven years, obligates specified tonnage and reporting, and renews on demonstrated performance rather than on price alone. Municipal collection contracts behave the same way. Material sales sit on top as a volatile overlay, and operators who understand this structure bid very differently from those who do not.
Depth of relationship varies enormously by jurisdiction maturity. Mature European schemes contract on audited yield and chain of custody, which favours operators with reporting infrastructure. Newly legislated markets contract on capacity and coverage, which favours whoever can mobilise fastest. Informal collection economies operate on material value alone with no contracts at all. Brand-led closed loops are a fourth pattern, bypassing municipal systems entirely for clean feedstock.

Buyer profiles are shifting as brand sustainability functions become direct counterparties rather than fee payers at arm's length. Producers increasingly want traceable recycled content rather than a compliance certificate. Traceable recycled content is displacing the compliance certificate, and operators are slow to price that difference.
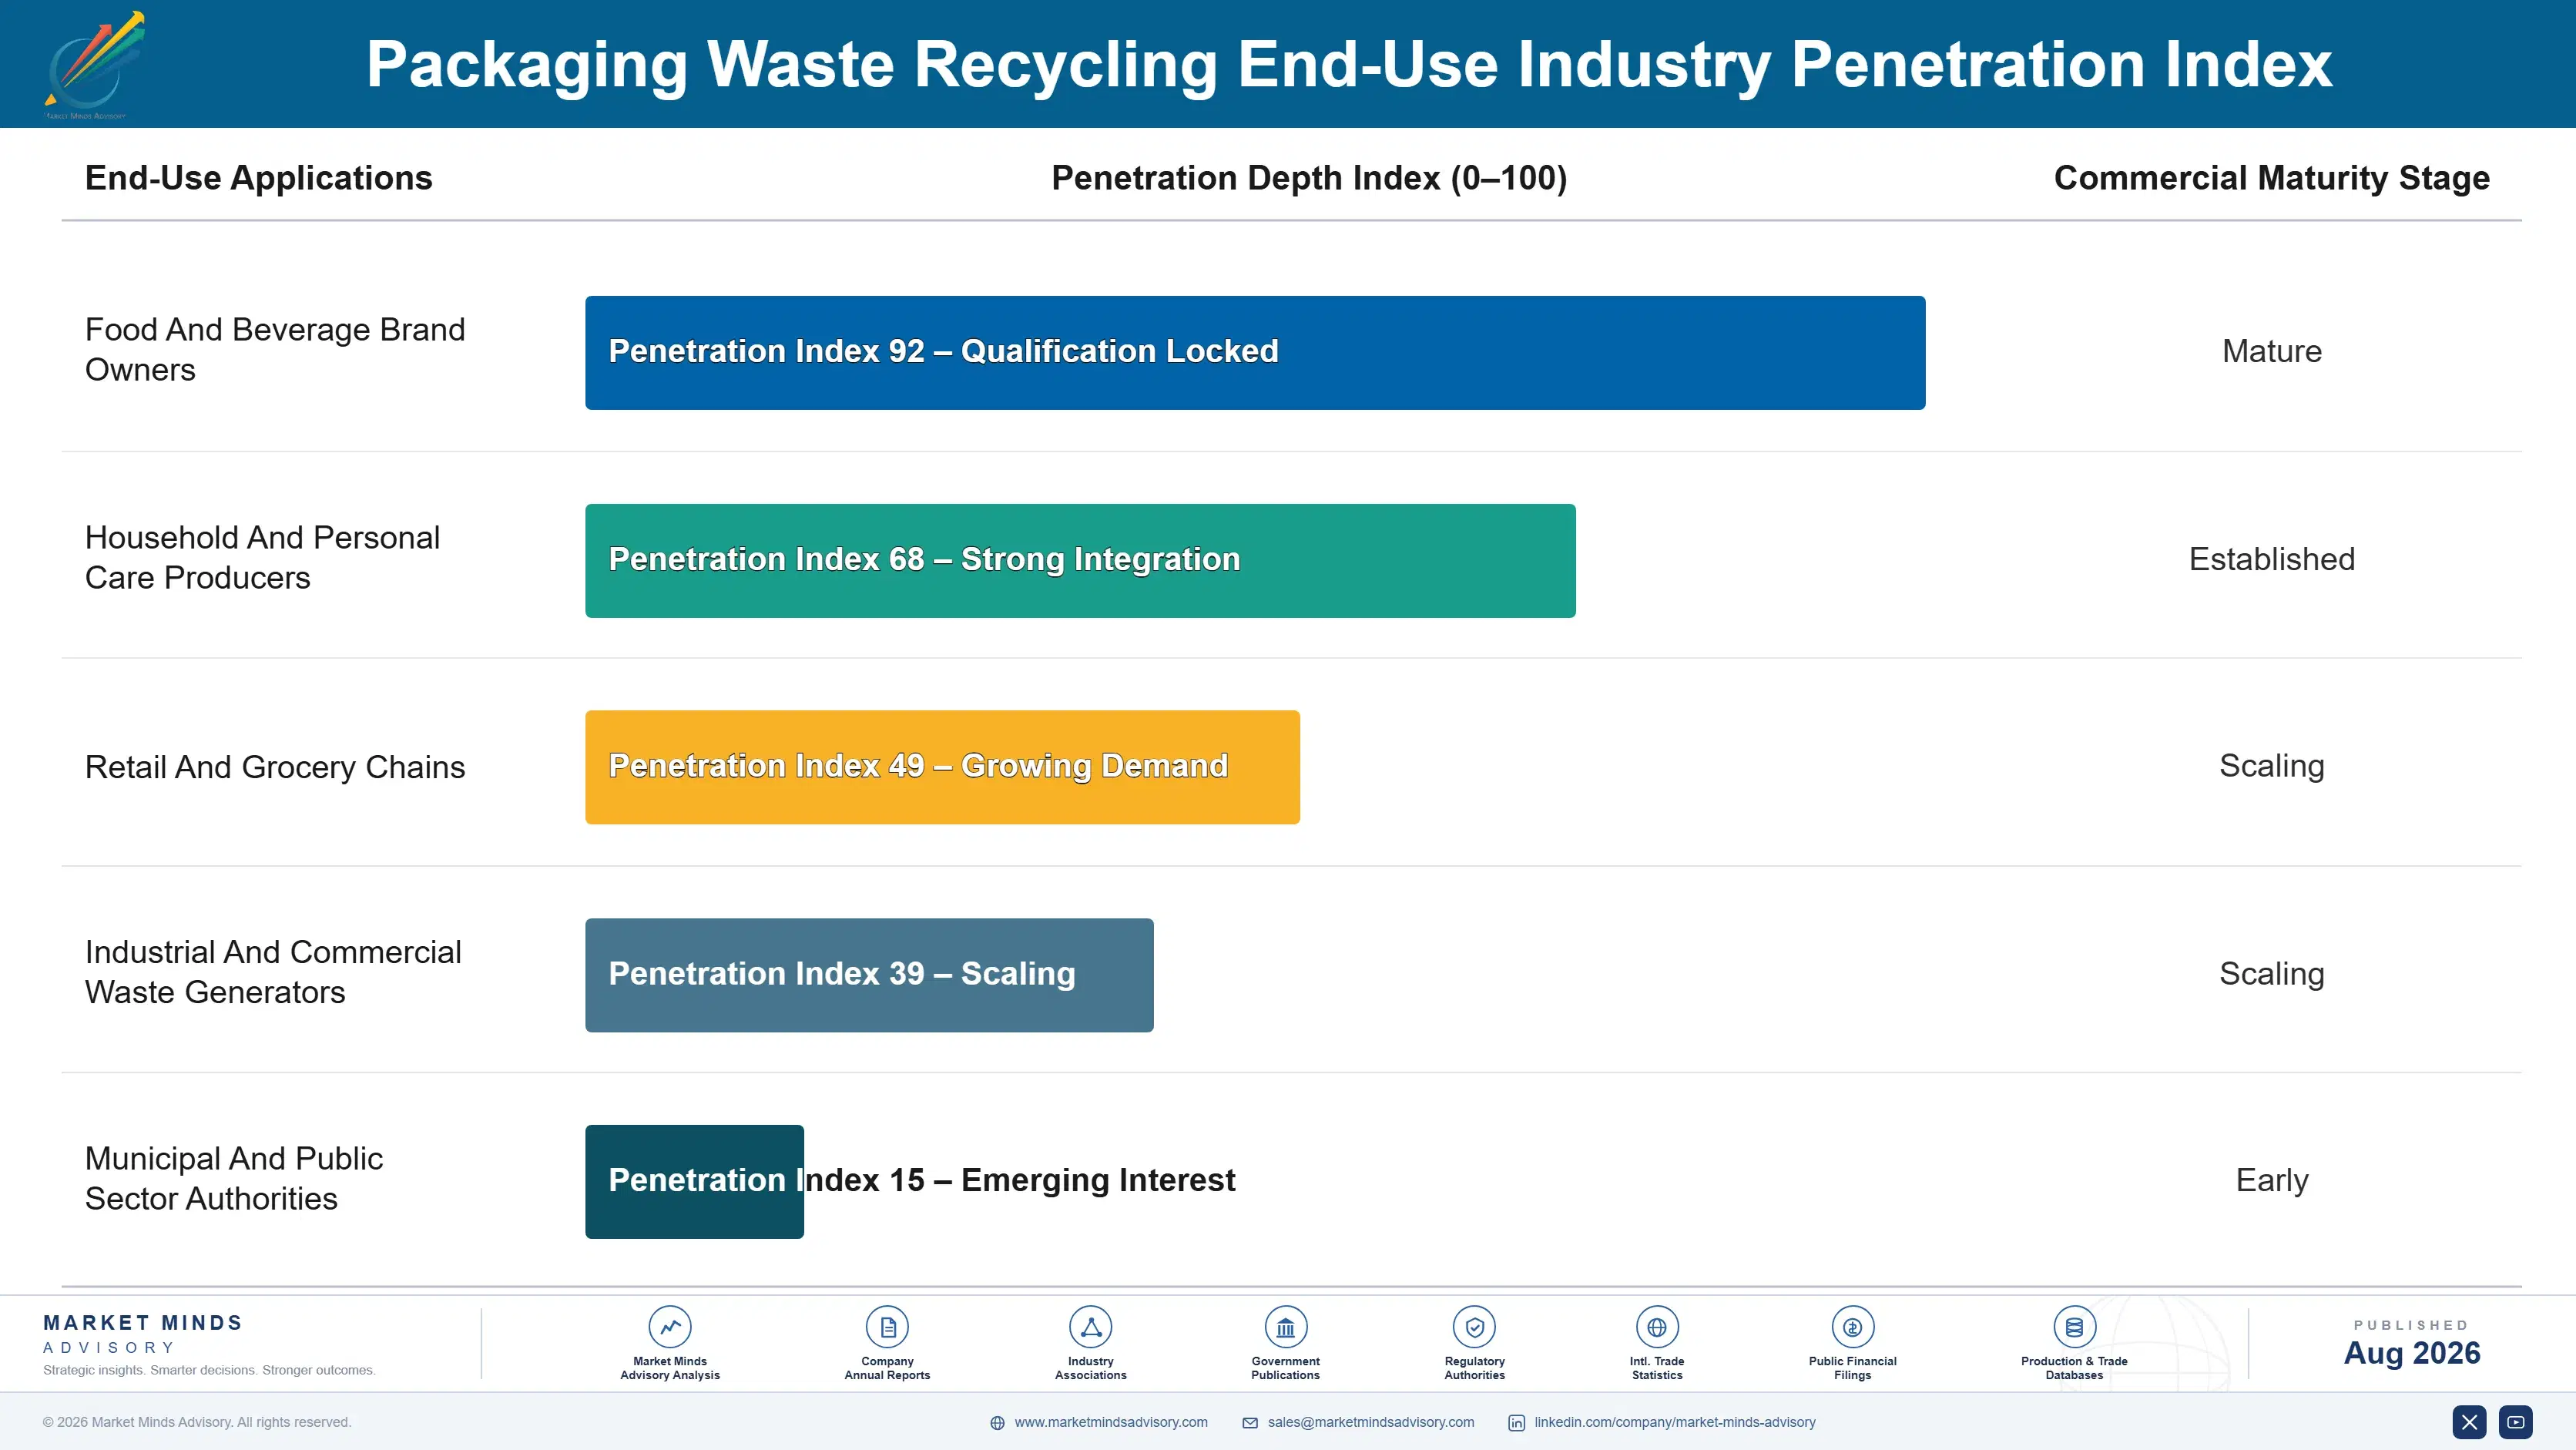
packaging-waste-recycling-market-end-use-penetration-index-1787299152385

What We Would Tell a Board

These are among the four positions where our research anticipates prominent divergence between winners and laggards over the coming forecast period. Each is grounded in the demand model, the regulatory perimeter, and the announced capacity pipeline.
01 / FEE CONTRACT POSITIONING

Sell to the producer, not to the commodity market

Producer responsibility fees fund 58% of system revenue on contracts running five to seven years, while material sales arrive at whatever the spot market happens to be paying that month. Operators structured around fee contracts survive a commodity trough entirely intact, and those structured around material spreads simply do not survive it. Qualifying for scheme contracts requires audited reporting and demonstrated yield rather than the lowest gate fee, and building that capability costs around 3 million dollars in systems and process work.
02 / YIELD OVER TONNAGE

Five yield points beat eight percent more collection

Roughly 61% of collected tonnage becomes usable output, so improving yield by five points delivers more saleable material than raising collection volume by eight percent, and it costs considerably less to achieve. Operators chase tonnage because municipal contracts have historically measured it, which is exactly the wrong incentive to be optimising a business against. Moving to output-based contracting aligns the operator with the outcome properly, and it typically lifts yield by four to seven points within two years of implementation.
03 / FOOD-GRADE CAPACITY BUILDING

One output trades above virgin; build for that one

Food-grade recycled polyester trades roughly 19% above virgin because mandated content requirements outrun bottle-to-bottle capacity, while every other recycled output right across packaging still trades at a clear discount to virgin. A food-grade reprocessing line costs around 40 million dollars, and the binding constraint on running one is feedstock access through deposit return schemes rather than any limitation in reprocessing technology. Operators without a food-grade line are selling exclusively into markets where recycled material is worth less than the virgin equivalent.
04 / ROUTE DENSITY DISCIPLINE

Two adjacent contracts beat two distant ones easily

Collection is 44% of cost per tonne and route density determines most of that, so contiguous municipal territory is worth substantially more to an operator than scattered contracts covering equivalent tonnage. Operators bidding opportunistically for whatever contract happens to come up end up funding fleet mileage that generates no additional material and no additional fee revenue whatsoever. Territory strategy matters more to margin in this business than any processing investment ever does, and yet it is frequently absent from bid decisions altogether.

Engagement Snapshot From the Field

A live engagement with an industry participant carrying material or product regulatory and market exposure ahead of a defining policy shift, showing how our research translates into a defensible multi-year portfolio strategy.
MARKET MINDS ADVISORY · CLIENT ENGAGEMENT SUMMARY
Packaging Waste Recycling Producer Strategic Portfolio Review and Transition Roadmap 2026·Investment Scenario on Packaging Waste Recycling Exposure Evaluation 2025-26
CLIENT PROFILE
A regional waste and recovery operator with approximately 410 million dollars in annual revenue (client-reported, unverified by MMA), running collection across scattered municipal territories and two sorting facilities. The company bid opportunistically on available contracts, measured performance on tonnage collected, sold all output as baled commodity material, and held no food-grade reprocessing capability of any kind.
STRATEGIC CHALLENGE
Margin had swung violently across three years with commodity prices while volumes grew steadily, and the company had lost two producer responsibility scheme tenders it considered itself well qualified for. Management proposed expanding collection coverage further. The board wanted independent assessment before committing more fleet capital. Nobody had examined the two failures together.
MMA APPROACH
We rebuilt cost per tonne by collection route against density, reconstructed yield from intake to saleable output across both sorting facilities, and reviewed both lost scheme tenders against the winning submissions. Output pricing was benchmarked against operators selling specification-guaranteed material rather than baled commodity grades. Territory contiguity was modelled across the footprint.
KEY FINDINGS
  1. Yield from intake to saleable output ran at 54% against a comparable operator benchmark near 61%, with front-end contamination accounting for most of the gap.
  2. Both lost tenders had been decided on audited yield evidence and chain of custody reporting rather than on price, and the client had submitted neither in usable form.
  3. Collection cost per tonne on the client's scattered territories ran roughly 31% above what contiguous route modelling indicated was achievable across the same footprint.
  4. Baled commodity output was realising materially less than specification-guaranteed equivalents, and no food-grade capability existed to access the only premium grade available.
CLIENT PROFILE
A regional waste and recovery operator with approximately 410 million dollars in annual revenue (client-reported, unverified by MMA), running collection across scattered municipal territories and two sorting facilities. The company bid opportunistically on available contracts, measured performance on tonnage collected, sold all output as baled commodity material, and held no food-grade reprocessing capability of any kind.
STRATEGIC CHALLENGE
Margin had swung violently across three years with commodity prices while volumes grew steadily, and the company had lost two producer responsibility scheme tenders it considered itself well qualified for. Management proposed expanding collection coverage further. The board wanted independent assessment before committing more fleet capital. Nobody had examined the two failures together.
MMA APPROACH
We rebuilt cost per tonne by collection route against density, reconstructed yield from intake to saleable output across both sorting facilities, and reviewed both lost scheme tenders against the winning submissions. Output pricing was benchmarked against operators selling specification-guaranteed material rather than baled commodity grades. Territory contiguity was modelled across the footprint.
KEY FINDINGS
  1. Yield from intake to saleable output ran at 54% against a comparable operator benchmark near 61%, with front-end contamination accounting for most of the gap.
  2. Both lost tenders had been decided on audited yield evidence and chain of custody reporting rather than on price, and the client had submitted neither in usable form.
  3. Collection cost per tonne on the client's scattered territories ran roughly 31% above what contiguous route modelling indicated was achievable across the same footprint.
  4. Baled commodity output was realising materially less than specification-guaranteed equivalents, and no food-grade capability existed to access the only premium grade available.
RECOMMENDED STRATEGY
Phase 1: Phase 1 (months one to nine): halt collection expansion, implement front-end contamination control, and establish audited yield reporting across both facilities. Phase 2: Phase 2 (months nine to twenty-four): rationalise territory toward contiguous routes and rebid scheme contracts with yield evidence in hand. Phase 3: Phase 3 (months twenty-four to thirty-six): evaluate food-grade polyester reprocessing capacity against the deposit return feedstock available across the region.
OUTCOME
The client suspended fleet expansion and invested in contamination control and reporting instead. Yield rose above the comparable benchmark within four quarters, collection cost per tonne fell as territories consolidated, and the next scheme tender was won on the audited evidence now available (client-reported, unverified by MMA).

Frequently Asked Questions

Foundational context covering the market sizes, CAGR, scope, country, region and competition that inform every finding below. This section is provided to cover basics and most often pre-purchase conversations, answered from the MMA Primary Research Dataset.

What is the current size of the Packaging Waste Recycling Market?

The market is valued at USD 62.4 billion in 2025, rising to USD 67.27 billion in 2026. Producer responsibility fees fund roughly 58% of that revenue.

How large will the Packaging Waste Recycling Market be by 2036?

MMA forecasts USD 142.57 billion by 2036, an increase of USD 75.30 billion over the 2026 base. That represents an expansion multiple of 2.12 times.

What is the CAGR for the Packaging Waste Recycling Market 2026 to 2036?

The base case CAGR is 7.8%, with a bull case of 9.0% and a bear case of 6.6%. The historical rate from 2020 to 2025 was 6.4%.

Which segment is growing fastest?

Food-grade polyester recycling at 11.7%, exactly 1.50 times the market rate. It is the only recycled packaging output trading above virgin rather than below it.

Who are the major companies in the Packaging Waste Recycling Market?

Veolia, Remondis, Suez, Waste Management, and Republic Services lead on annual packaging tonnage processed. The top five hold only 16% because collection contracts are awarded locally.

Which country is growing fastest?

India at 13.8%, driven by enforcement of producer responsibility obligations and by a certificate trading mechanism that has created a genuine market. Informal collection is being formalised rather than replaced.

Report Segmentation Architecture

The full report scope spans multiple orthogonal segmentation dimensions, with cross-tabulated demand data provided for each dimension pair. Coverage extends further to regional breakdowns, trend trajectories, and the competitive detail needed to support segment-level decision-making.

By Material Stream

  • Paper And Board Recycling
  • Food-Grade Polyester Recycling
  • Rigid Polyolefin Recycling
  • Flexible Film And Multi-Layer Recovery
  • Glass Cullet Recovery
  • Aluminium And Steel Packaging Recovery

By End-Use Industry

  • Food And Beverage Brand Owners
  • Household And Personal Care Producers
  • Retail And Grocery Chains
  • Industrial And Commercial Waste Generators
  • Municipal And Public Sector Authorities

By Revenue Model

  • Producer Responsibility Scheme Contracts
  • Municipal Collection Service Contracts
  • Recovered Material Sales At Market Prices
  • Specification-Guaranteed Offtake Agreements

By Region

  • Western Europe
  • North America
  • East Asia
  • South Asia and Pacific
  • Latin America
  • Eastern Europe
  • Middle East and Africa

Scope, Methodology, and Coverage

Every figure in this report is reproducible from documented input assumptions. The scope below maps the historical period, the forecast horizon, the segmentation dimensions, and the countries covered, alongside the underlying primary and qualitative methodology.
Historical Period
2020 to 2025
Forecast Period
2026 to 2036
Base Year
2025 (USD billions; MMA Primary Research Dataset, August 2026)
Market Definition
This market comprises the collection, sorting, and reprocessing of post-consumer and post-commercial packaging waste into secondary raw materials, measured across producer responsibility fee revenue, municipal and commercial gate fees, and recovered material sales at operator realised prices. Stream coverage spans paper and board, food-grade and non-food polyester, rigid polyolefins, flexible film and multi-layer structures, glass cullet, and aluminium and steel packaging. Non-packaging waste streams, landfill and energy recovery operations, virgin material production, converter process scrap handled internally, reusable packaging pool services, and equipment manufacture fall outside scope.
Quantitative Units
USD billions (current prices); million tonnes collected and reprocessed; realised revenue per tonne
Segmentation Dimensions
By Material Stream; By End-Use Industry; By Revenue Model; By Region
Regions Covered
Western Europe, North America, East Asia, South Asia and Pacific, Latin America, Eastern Europe, Middle East and Africa
Countries Covered
Germany, France, Italy, Spain, UK, Netherlands, Belgium, Sweden, Norway, Denmark, Austria, Poland, Czechia, Hungary, Turkey, USA, Canada, Mexico, Brazil, Chile, Colombia, China, Japan, South Korea, Taiwan, India, Australia, South Africa, UAE, and additional markets relevant to this sector
Key Companies Profiled
Veolia, Remondis, Suez, Waste Management, Republic Services, Waste Connections, Biffa, Alba Group, Der Grune Punkt, Reclay Group, FCC Environment, Indaver, PreZero, Renewi, TOMRA, Loop Industries, Eastman, Cleanaway Waste Management, Ramky Enviro Engineers, China Tianying
Quantitative Methodology
Primary survey, n=3,800 respondents, Q4 2025, six countries; demand-side model with trade association cross-validation
Qualitative Methodology
47 expert interviews, Q4 2025; applied to validate demand model assumptions, identify emerging dynamics, and assess competitive positioning
Report Format
PDF and XLSX data workbook (Word format preview document)
Publisher
Market Minds Advisory
Report Code
MMA-2026-PAC-294
Published
August 2026
Contact
sales@marketmindsadvisory.com | www.marketmindsadvisory.com

Purchase the full Packaging Waste Recycling Market Report (2026 to 2036).

The full report sizes packaging waste recycling across six material streams, five end-use industries, four revenue models, and seven regions, with country detail for the twenty largest national markets. Producer responsibility fee revenue and recovered material sales are sized separately throughout, since they behave nothing alike and are frequently conflated. Yield from collection intake to saleable output is modelled by stream and by facility class. Competitive profiling covers twenty operators on annual packaging tonnage processed. Eco-modulation fee structures and recycled content mandate timetables are tracked jurisdiction by jurisdiction.
Producer fee revenue and material sales sized separately
Yield from intake to saleable output modelled by stream
Eco-modulation fee structures tracked jurisdiction by jurisdiction
Recycled content mandate timetables against available capacity
Collection cost per tonne modelled against route density
Deposit return feedstock quality compared with kerbside collection

Built For The People Who Decide

From boardroom strategy to bench-side execution, this report is read cover-to-cover by leaders shaping the next decade of their industry, turning demand scenarios, market dynamics and valuation benchmarks into decisions.
CXOs/ Presidents/ VPs/ Managers
M&A and Corporate Development
Strategy Teams and R&D Heads
Procurement and Product Directors
Regulatory and Compliance Leaders
Investor Relations and Equity Analysts