Market Minds Advisory
Packaging Automation Market

Packaging Automation Market: Packaging Automation Market: changeover economics, the integrator bottleneck and right-sizing freight to 2036

Machinery is quoted on rated speed and the plant is losing nearly a quarter of its available hours to format changes, which is a mismatch the industry has yet to properly confront.

Lead Analyst

Bilal Shaikh

Published

August 2026

Make Smarter Decisions with Customized Research Insights

Request a free sample report and evaluate market opportunities, growth trends, and competitive dynamics relevant to your business needs.

2025 MARKET VALUE$24.6BMarket Size 2025
2036 FORECAST VALUE$61.0BBase Case , 2026 to 2036
CAGR 2026 TO 20368.6 %Bull 9.8% / Bear 7.4%
INCREMENTAL OPPORTUNITY$34.2BNet 10- year value creation
EXPANSION MULTIPLE2.28x2036 value over 2026 base
Strategic Levers
M&A Pipeline
Regional Outlook
Country Rankings
Competitive Intelligence
Segmental Deep-dive
Call-Us : 91 93563 13602

Executive Snapshot and Market Trajectory.

Retail range proliferation means a single line may run forty formats, and roughly 23% of available production time now disappears into changeovers. A machine quoted at higher nominal speed that takes longer to change over simply produces less across a week.
Overall equipment effectiveness rather than rated throughput is therefore the number that decides value, and most machinery quotations still lead with the other one. That mismatch is the largest single source of disappointed automation projects, and it originates in how the equipment was specified rather than in how it was installed or operated. Purchasing processes comparing rated throughput across competing quotations select for precisely the wrong characteristic every time.
E-commerce right-sizing grows at 12.9%, half again the market rate of 8.6%, because building a box around the order removes roughly 28% of shipping cube and freight is a considerably larger cost than corrugate. East Asia holds 32% of value on manufacturing scale, while integrator capacity sits near 94% booked. Installing automation now depends on people able to commission it rather than on any shortage of machines to buy. That capacity cannot be expanded quickly.
Market Definition
This report covers packaging automation equipment and systems supplied to manufacturers and fulfilment operations, spanning filling and dosing systems, case packing and cartoning, palletising and end-of-line, labelling coding and marking, e-commerce right-sizing and fulfilment, and integration controls and software. Value is measured at manufacturer level on equipment and systems revenue. Excluded are packaging materials of every kind, warehouse storage and retrieval systems, standalone industrial robots sold without packaging application, spare parts and consumables, and third-party maintenance services.
Base Year Value
$24.6B in 2025 (MMA Primary Research Dataset, August 2026)
Forecast Period
2026 to 2036, eleven discrete annual values
CAGR
8.6% base case. Bull 9.8%. Bear 7.4%.
Fastest Growth Segment
E-commerce Right-Sizing and Fulfilment: 12.9% CAGR
Fastest Growth Country
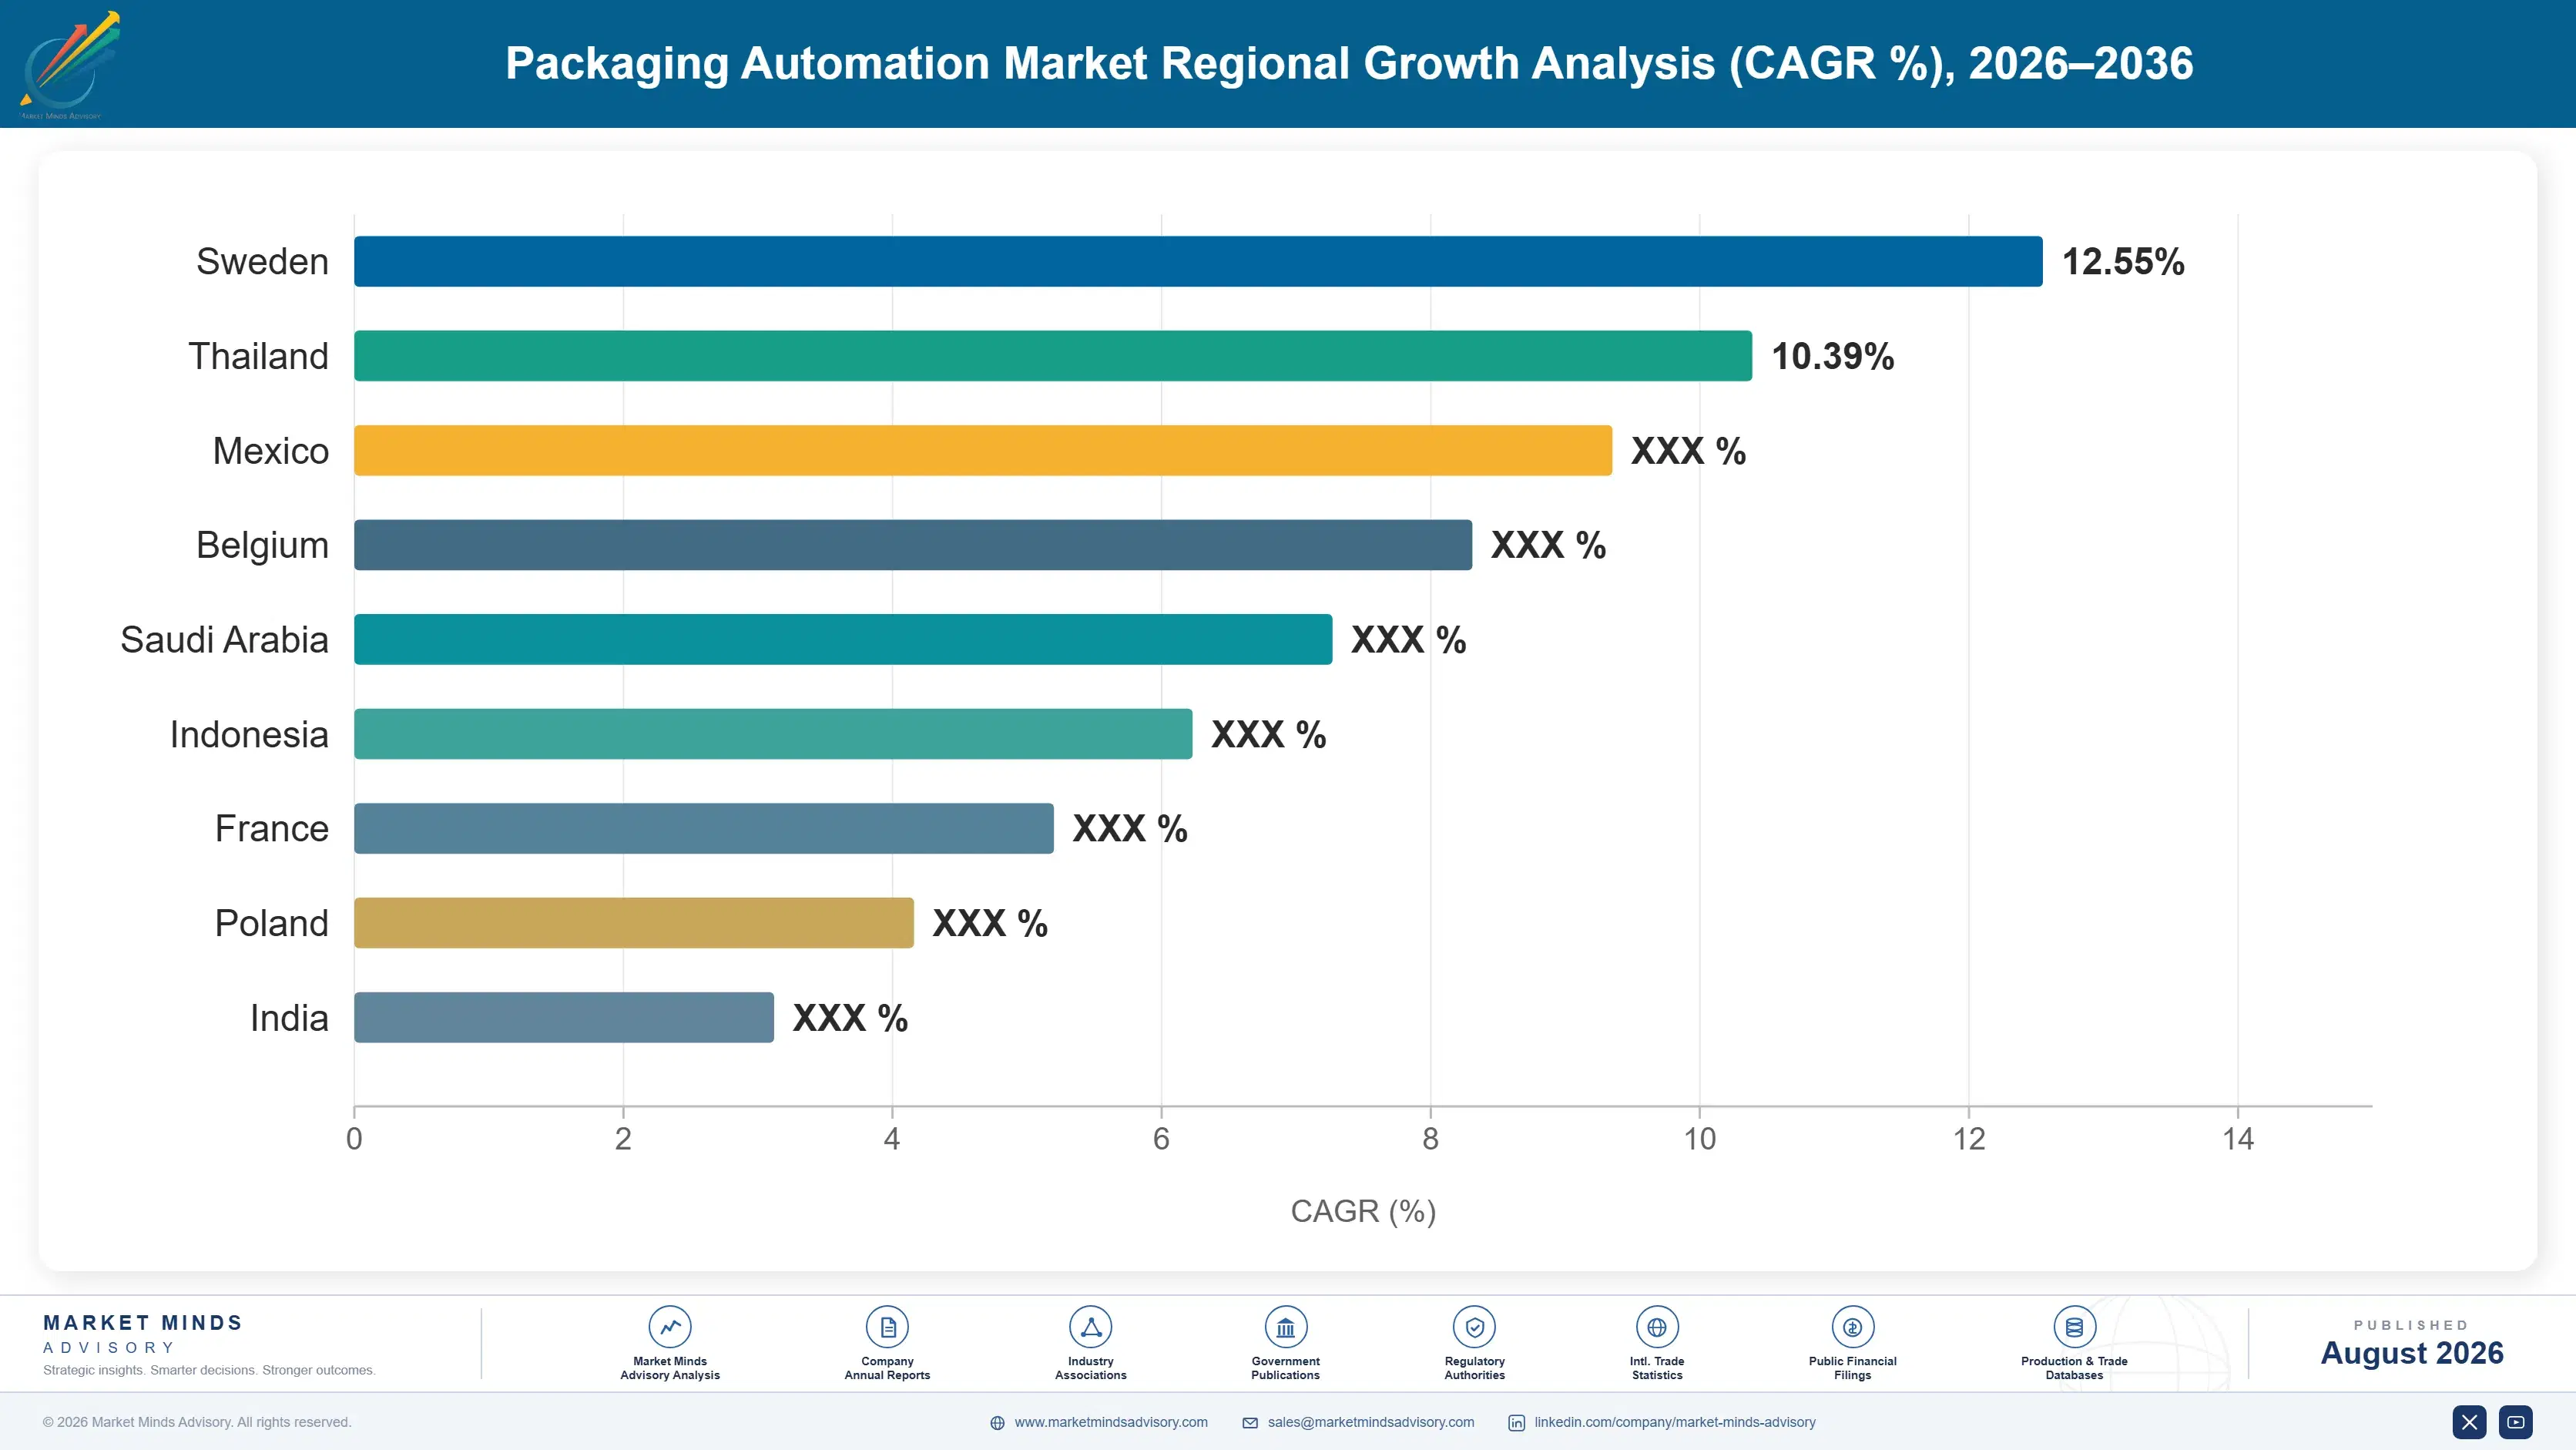
India: 12.2% CAGR
Fastest Growth Region
South Asia and Pacific: 10.6% CAGR
Largest Region
East Asia: 32% of 2025 global value
Market Leaders
Krones, Syntegon, Coesia, Tetra Pak and Marchesini Group lead the market. Source: MMA Primary Research Dataset, July 2026.
Primary Survey
n=3,800 procurement and R&D decision-makers, Q4 2025, six countries
Methodology
Demand-side build-up, cross-validated against public data, 47 expert interviews

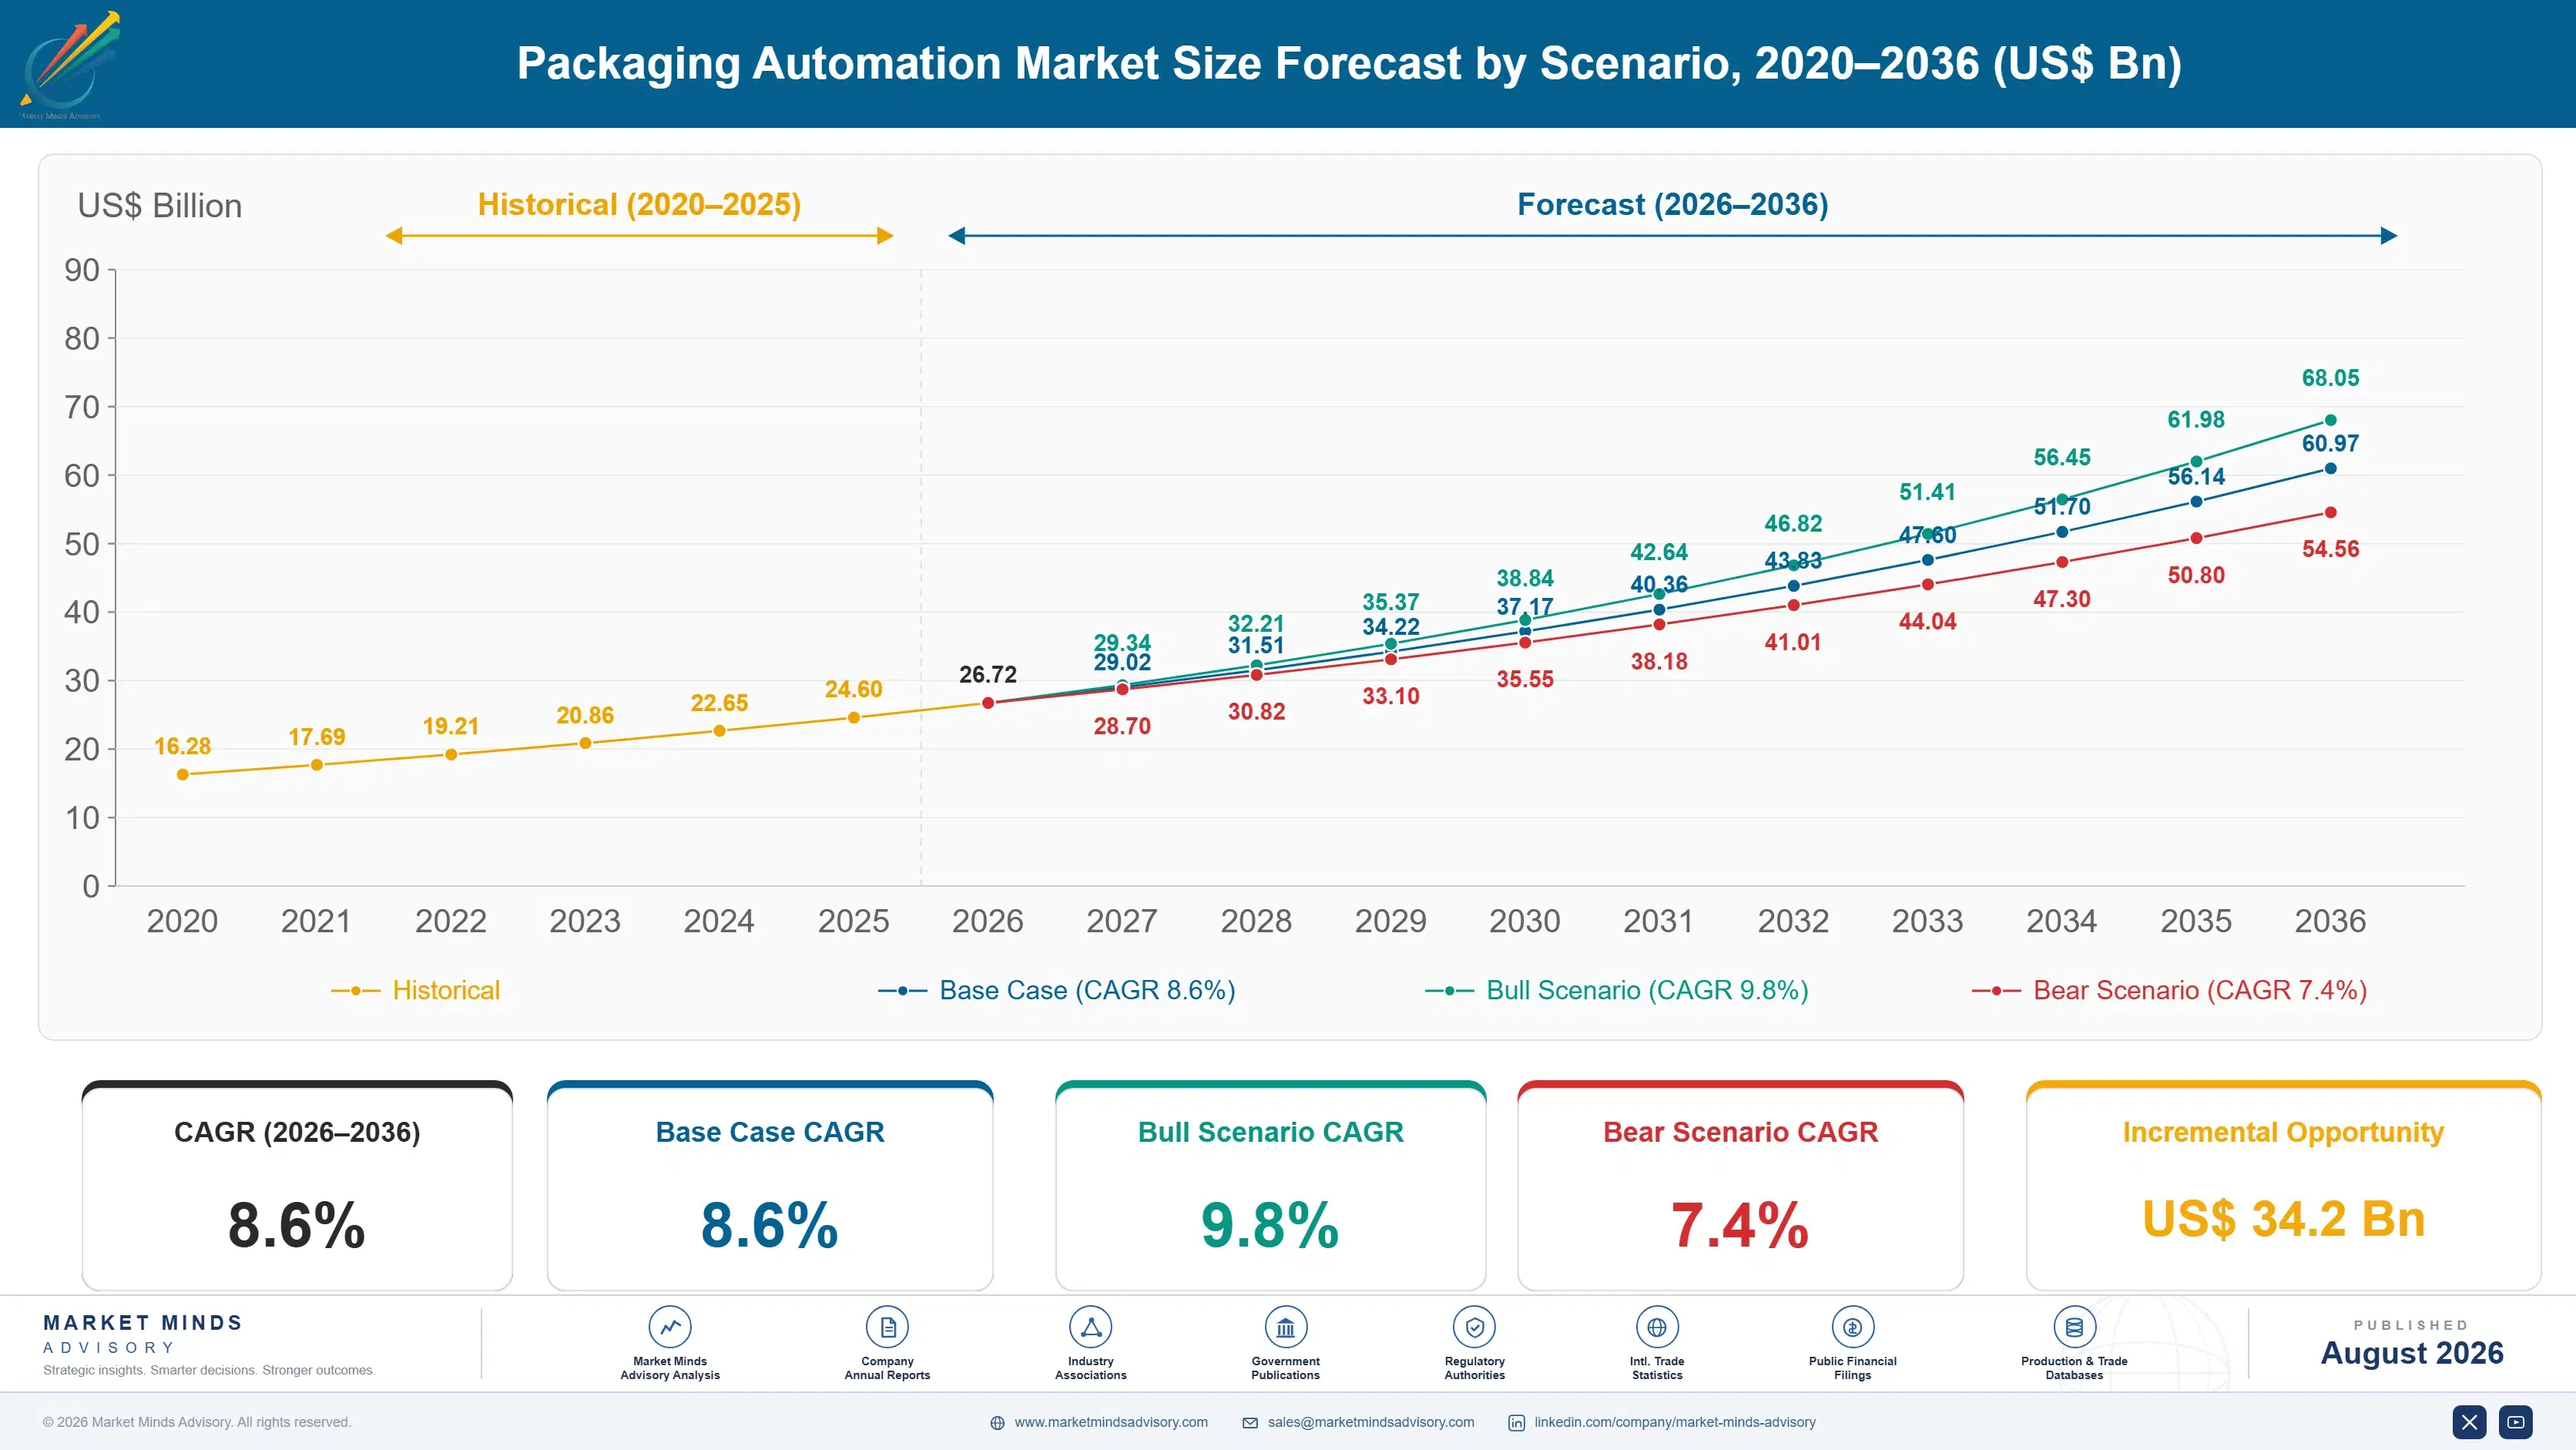
Packaging Automation Market Forecast Scenarios

packaging-automation-market-size-forecast-scenario-1787559614669
Growth ran at 7.2% between 2020 and 2025 and labour rather than production volume drove most of it. Packaging roles proved among the hardest to staff through the period, with end-of-line turnover running well above the rest of the plant, and manufacturers automated because they could not recruit rather than because output demanded it. E-commerce fulfilment automation grew from almost nothing to a genuine category.
The 8.6% base case rests on three mechanisms. E-commerce right-sizing at 12.9%, where removing shipping cube saves freight rather than corrugate. Integration, controls and software at 10.2% as the value shifts from machines toward the systems connecting them. And Indian growth at 12.2%, the fastest of any country, on packaged goods manufacturing expanding while wage inflation makes manual packing progressively less viable. Labour scarcity rather than output growth underpins all three of them.
The 9.8% bull case is changeover-optimised equipment being specified on effectiveness rather than speed, which would release retrofit projects currently failing their business cases. The 7.4% bear case is integrator capacity at 94% constraining installation regardless of order intake, since equipment nobody can commission produces nothing for anybody. Equipment nobody can commission produces nothing for anyone.

Speed Sold, Changeover Delivered

Packaging machinery was designed for a world of long runs and few formats, and that world has gone. Retail range proliferation, multipacks, promotional variants and e-commerce packs mean a single line may now handle forty distinct formats across a month, and roughly 23% of available production time disappears into changing between them. A machine rated at higher nominal speed that takes an extra hour to change over produces less across a week than a slower machine that changes in twenty minutes, and the quotation comparing them almost never says so.
TOP-FIVE CONCENTRATION26%Combined position across supply held by the leading equipment manufacturers
CHANGEOVER OUTPUT LOSS23%Available production time lost switching between packaging formats
PACKAGING LABOUR TURNOVER68%Annual staff replacement rate across end of line roles
RETROFIT PROJECT SHARE74%Installations placed into existing lines rather than new plants
INTEGRATOR CAPACITY UTILISATION94%Booking level across systems integration firms in mature markets
RIGHT-SIZING FREIGHT SAVING28%Shipping volume removed by making a box fit contents
That mismatch between what is sold and what is needed produces most of the disappointment in automation projects. The problem originates during specification rather than during installation, because a purchasing process comparing rated throughput across competing quotations selects for exactly the wrong characteristic. Overall equipment effectiveness measured across a real production schedule is the number that determines whether the investment pays, and very few tender documents ask for it in any form.
The other constraint is human. Systems integration firms in mature markets are booked at around 94% of capacity, which means installing automation depends on people rather than machines.
"I have watched plants buy the faster machine three times running and wonder why output did not move. They run forty formats and lose a quarter of the week to changeover. Nobody in the sales process ever asked how many times a day the line changes, and that is the only question that mattered."
Director, Industrial Automation and Packaging Systems Practice · MMA Construction and Industrial Equipment Practice · August 2026

Market Trends

Format proliferation makes changeover the binding constraint

Retail range expansion, multipacks, promotional variants and e-commerce packs mean a single line may run forty formats across a month, and roughly 23% of available production time is consumed switching between them. Rated machine speed becomes largely irrelevant against that. Commercially this means equipment specified on nominal throughput underperforms in real plants, and manufacturers who quote overall equipment effectiveness across an actual production schedule differentiate on the measure that decides whether a project pays back at all rather than on the one purchasing departments habitually compare. Very few tender documents ask for that figure in any form.
Market Impact: Turnover reaches 68% annually
Integration capacity rather than machine supply limits installation

Systems integration firms across mature markets are booked at roughly 94% of capacity, which means the practical constraint on installing packaging automation is people able to specify, commission and debug it rather than any shortage of equipment. That capacity cannot expand quickly because it consists of experienced engineers rather than production hours. Commercially this lengthens project timelines regardless of order intake and gives equipment manufacturers with in-house integration capability a genuine scheduling advantage that competitors cannot match by discounting. Experienced engineers cannot be recruited at short notice. Acquisition rather than hiring has become the usual route.
Market Impact: Removes 28% of shipping cube

Market Opportunities and Growth Drivers

Packaging labour turnover forces automation regardless of volume

End-of-line packaging roles turn over at roughly 68% annually because the work is cold, repetitive and physically demanding, and recruitment has become genuinely difficult across developed and increasingly developing markets. Manufacturers automate because they cannot staff the line rather than because output requires it, which is why demand keeps growing through periods when production does not. Commercially this decouples automation spending from manufacturing volume forecasts, and suppliers modelling demand against output projections consistently underestimate what labour scarcity produces. Suppliers modelling demand against output forecasts consistently underestimate what labour scarcity actually produces in capital spending terms.
Market Impact: Retrofits are 74% of projects

Right-sizing saves freight rather than corrugate

Shipping a single item to a consumer in a box built around the order removes roughly 28% of shipping cube, and since parcel carriers charge on dimensional weight that saving lands on freight rather than on material. Freight is by far the larger cost line. Growth at 12.9% follows that arithmetic rather than any sustainability argument, though the material reduction helps the case. Commercially the payback calculation is straightforward enough that fulfilment operators reach it independently, which shortens the sales cycle considerably. The material saving helps the case without carrying it.
Market Impact: Right-sizing saves 28% cube

Market Restraints and Challenges

Retrofit installations carry difficulty greenfield projects avoid

Around 74% of installations go into existing production lines rather than new plants, which means fitting equipment into space that was never designed for it and interfacing with legacy controls that may predate current standards entirely. The root cause is simply that most manufacturing capacity already exists. Commercially retrofit projects overrun on schedule and budget far more often than greenfield ones, and the difference is rarely priced into a quotation. Suppliers are investing in site survey and simulation capability before committing to timelines. Simulation before commitment is far cheaper than an overrun.
Market Impact: Changeover consumes 23% of time

Skilled maintenance shortage undermines installed equipment performance

Automated packaging lines require maintenance technicians able to diagnose control systems as well as mechanics, and plants that could not staff manual packing frequently cannot staff that role either. The root cause is that automation changes the skill required rather than removing the labour requirement altogether. Commercially this means installed equipment underperforms its specification in plants without the capability, which damages the supplier's reputation for reasons outside its control. Manufacturers are adding remote diagnostics and predictive maintenance to compensate. Remote diagnostics and predictive maintenance compensate partially without resolving the underlying skills problem.
Market Impact: Integrators booked at 94% capacity
4 additional market trends, 3 additional growth drivers, and 2 additional restraints and challenges are covered in the full report. Contact sales@marketmindsadvisory.com to access the complete intelligence.

Segment CAGR and Growth Architecture

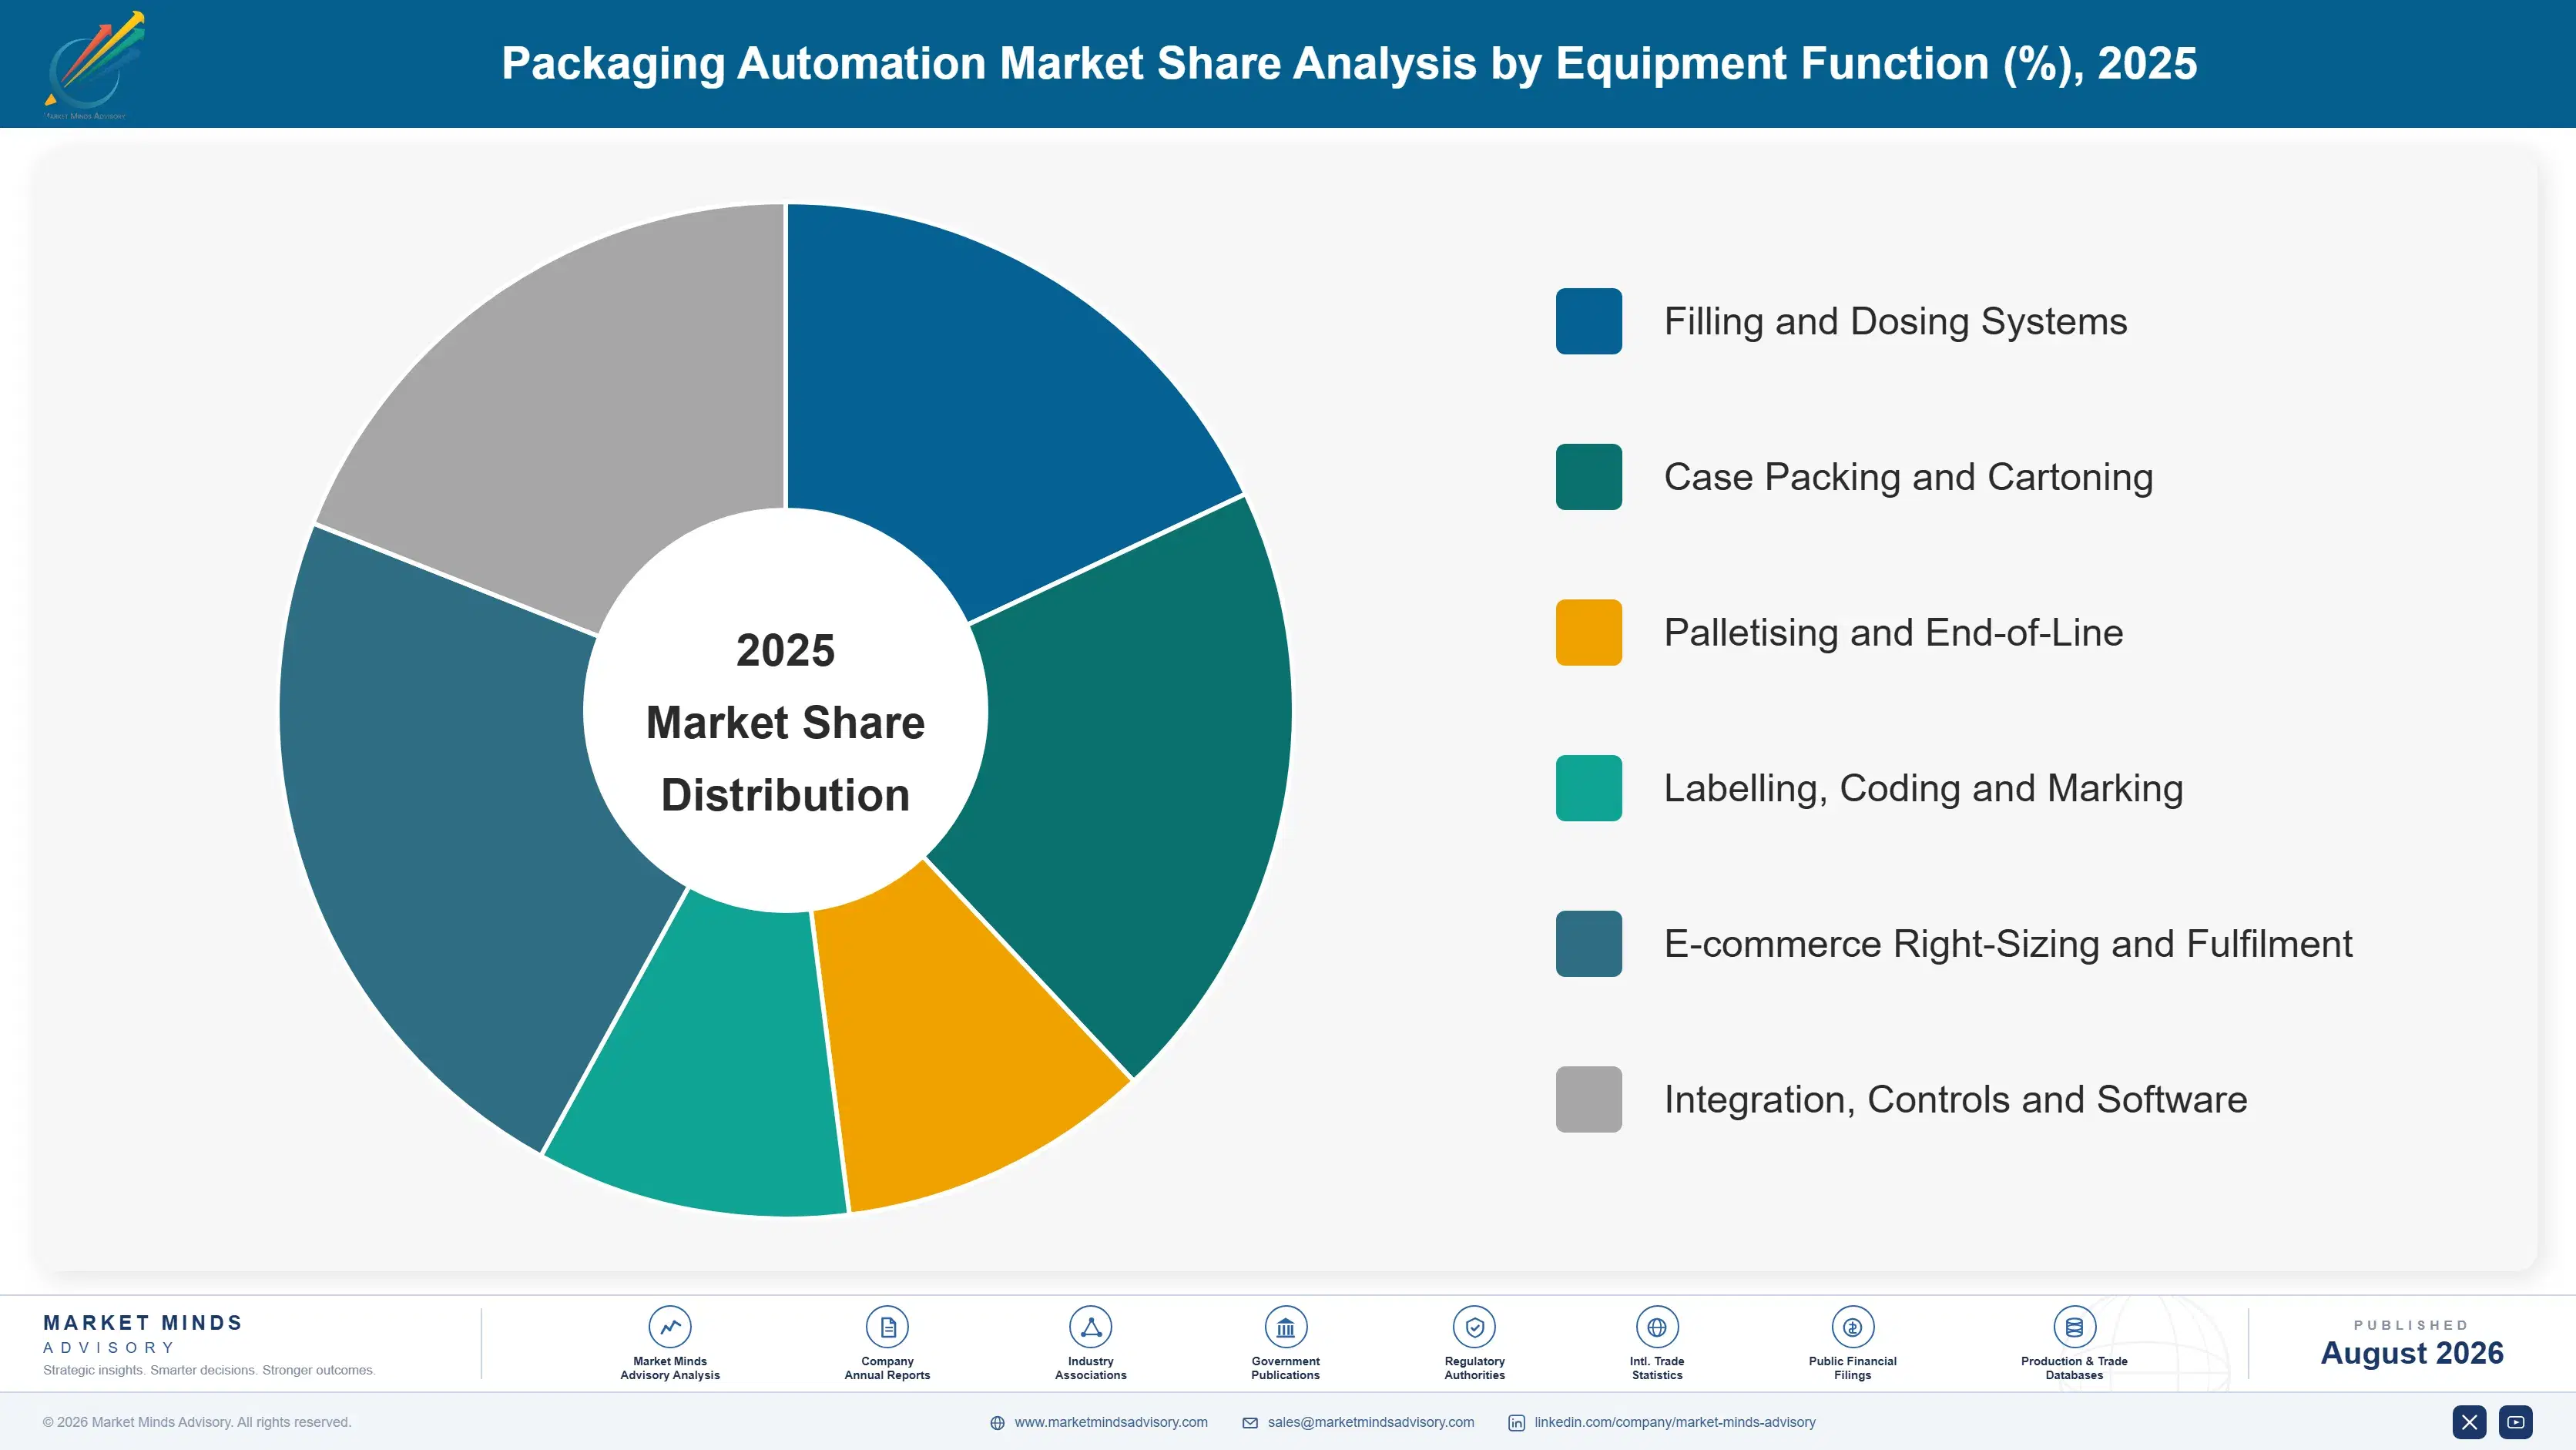
Value is classified here by equipment function, since capital cost, changeover exposure and integration difficulty all differ enormously between a filling machine and a palletiser. Line position, end-use industry and project type are each handled separately in the framework below, because most of these equipment functions appear across several industries with only adjusted specifications.
packaging-automation-market-market-share-analysis-1787559615216

E-commerce Right-Sizing and Fulfilment

Growing at 12.9%, half again the market rate and faster than anything else here, right-sizing equipment builds a box around the actual order rather than selecting from standard cartons, which removes roughly 28% of shipping cube. Because parcel carriers charge on dimensional weight, that saving lands on freight rather than on corrugate, and freight is by far the larger cost line for any fulfilment operation. The payback arithmetic is straightforward enough that operators reach it without being sold to, which shortens the sales cycle considerably. Throughput requirements are demanding and every parcel is a changeover of sorts, which suits equipment designed around variability. Every parcel is effectively its own changeover, which suits equipment built around variability.
CAGR 12.9%

Integration, Controls and Software

Value is shifting from individual machines toward the systems connecting them, because a line performs according to how its equipment coordinates rather than how each unit performs alone. Growth at 10.2% reflects that shift alongside data collection requirements that plants increasingly specify from the outset. Integration firms are booked at roughly 94% of capacity in mature markets, which makes this both the fastest growing service and the binding constraint on everything else. Equipment manufacturers with in-house capability hold a scheduling advantage competitors cannot match through pricing, since a customer needing installation this year will pay for certainty. A customer needing installation this year rather than next will pay for scheduling certainty.
CAGR 10.2%
Full segment breakdown across 6 segments available in the complete report.

Regional Architecture and Country Demand Map

East Asia holds 32% of value, marginally above the standard band, on manufacturing scale that no other region approaches anywhere. North America follows at 26% where labour scarcity rather than production growth drives investment, while Western Europe sits at 22% on machinery engineering capability rather than domestic demand.

East Asia

At 32% this region sits marginally above the standard band, because Chinese, Japanese and Korean packaged goods manufacturing operates at a scale nothing elsewhere approaches and automation investment follows it. Chinese wage inflation has made manual packing progressively less viable across coastal manufacturing, which is driving end-of-line automation faster than production growth alone would. Japanese equipment manufacturers hold deep capability in high-speed and precision applications. Domestic Chinese machinery builders compete effectively on price for standard applications while international suppliers hold the technically demanding work. Growth at 9.6% reflects labour cost and manufacturing expansion together. Format proliferation is less advanced than in Western retail, which keeps changeover lower on the purchasing agenda.
Share: 32% | CAGR: 9.6% (2026 to 2036)

North America

Labour scarcity rather than production growth drives investment here, with end-of-line packaging roles proving among the hardest in any plant to staff and turnover running well above the rest of the workforce. Manufacturers automate because they cannot recruit, which decouples spending from output forecasts entirely. E-commerce fulfilment automation is more advanced here than anywhere, with right-sizing adoption driven by parcel carrier dimensional weight pricing. Integrator capacity is the binding constraint on project delivery across the region. Growth at 9.2% sits above the market rate on labour economics rather than volume. Format proliferation across grocery retail is advanced, which makes changeover performance a genuine purchasing criterion for anybody paying attention. Fulfilment automation leads the world.
Share: 26% | CAGR: 9.2% (2026 to 2036)
Regional intelligence for 5 additional markets available in the complete report: Western Europe, South Asia and Pacific, Latin America, Middle East and Africa, Eastern Europe. Contact sales@marketmindsadvisory.com.
packaging-automation-market-country-cagr-analysis-1787559615742

Where Automation Value Is Decided

Four moves matter in a market where equipment is sold on rated speed while customers lose a quarter of their available hours to format changes and cannot find anybody to install what they buy. Two concern selling on the measure that actually matters, and two concern the delivery constraints that decide whether projects happen at all.

Quote effectiveness across a real production schedule

A plant running forty formats loses roughly 23% of available time to changeover, which makes rated speed a poor predictor of what a machine produces across a week. Suppliers who model overall equipment effectiveness against the customer's actual format schedule differentiate on the number determining payback rather than on the one purchasing habitually compares. It also exposes competitors whose faster machines change over slowly, which is a conversation those competitors have no good answer to. Purchasing departments cannot easily refuse a better number. The comparison is straightforward to present. Nobody argues with a bigger output figure.
Market Impact: Recovers 23% of the time lost to changeover

Build integration capability as a scheduling advantage

Systems integration firms in mature markets are booked at roughly 94% of capacity, which means installation timing rather than equipment availability determines when a customer gets running. An equipment manufacturer with in-house integration capability can promise commissioning dates that competitors relying on third parties cannot match at any price. Customers needing production this year rather than next will pay for that certainty, and the advantage compounds because integration experience improves specification quality too. Integration experience also improves specification quality, so the advantage compounds rather than sitting still. Certainty is what customers actually buy.
Market Impact: Beats a 94% booking level right across integrators

Sell right-sizing on freight, not on corrugate

Building a box around the order removes roughly 28% of shipping cube, and because parcel carriers charge on dimensional weight the saving lands on freight rather than on material. Freight is by far the larger line for any fulfilment operation. Suppliers presenting the material saving are quoting the smaller number and making a weaker case than the facts support. Operators presented with the freight arithmetic reach the payback themselves, which shortens the sales cycle considerably. A shorter sales cycle is worth as much as a better margin. Operators reach the payback without persuasion.
Market Impact: Serves a segment now growing at 12.9% yearly

Survey and simulate before committing retrofit timelines

Around 74% of installations go into existing lines with space constraints and legacy controls that were never designed to accommodate them, and those projects overrun far more often than greenfield ones. The overrun is rarely priced into a quotation, so it lands on the supplier as cost and reputation. Site survey and simulation before commitment costs little against a project overrun and converts an unpredictable risk into a scheduling decision made deliberately. It converts an unpredictable risk into a deliberate scheduling decision. Reputation damage is harder to recover than cost.
Market Impact: Addresses the 74% of projects that are retrofits

Who Controls the Margin Pool

Five manufacturers hold 26% of this market, measured on equipment and systems revenue at manufacturer level, the basis used throughout this section. Concentration is low because packaging automation spans filling, cartoning, palletising, coding and software, and very few participants are genuinely strong across more than two or three of those. Customers frequently buy a line from several suppliers and expect somebody to make it work together.
Competition runs on four dimensions. Changeover performance, which decides real delivered output and which very few suppliers quantify honestly in any quotation. Integration capability, given third-party integrators are booked close to capacity across mature markets. Retrofit execution, since roughly three quarters of projects go into existing lines with legacy constraints. And service network depth, because a plant unable to maintain equipment blames whoever supplied it rather than itself.

Rankings shift toward suppliers with genuine integration capability and credible changeover performance, and away from those still competing on rated throughput alone. European manufacturers hold the deepest engineering capability and the slowest home market. American suppliers hold the e-commerce fulfilment positions. Chinese builders hold standard application volume and are improving their specification quality quickly.
packaging-automation-market-company-positioning-matrix-1787559616265

Competitive Moat and Risk Dimensions

KRONES

Moat: Line integration and service depth

The company supplies complete lines rather than individual machines and holds integration capability in house, which matters disproportionately when third-party integrators are booked near capacity and installation timing rather than equipment availability determines when a customer starts producing. Service network depth across major manufacturing regions also protects installed performance in plants that struggle to staff maintenance.
KRONES

Risk: Exposure to mature European demand

Western European demand grows at 7.0%, the weakest on this table, while Indian growth at 12.2% and East Asian expansion at 9.6% sit where the company competes against domestic builders on price for standard applications. Line integration capability commands a premium in complex projects and considerably less in the volume applications driving regional growth.
PROMACH

Moat: Breadth across line positions

The group covers filling, cartoning, labelling, end-of-line and e-commerce fulfilment across a portfolio of specialist businesses, which lets it supply most of a line from one commercial relationship in a market where customers otherwise buy from several suppliers and struggle to make them work together. That breadth also gives it visibility of e-commerce right-sizing demand growing at 12.9%.
PROMACH

Risk: Coordination across acquired businesses

Breadth assembled through acquisition delivers a single commercial relationship rather than genuinely integrated engineering, and customers increasingly want line performance guarantees rather than component supply. Suppliers designing lines as systems from the outset can quote overall effectiveness credibly. A portfolio of specialists must coordinate internally to make the same claim stand up.

Players Tracked

Prominent Players

Krones
Syntegon
Coesia
Tetra Pak
Marchesini Group

Other Key Players

ProMach
Barry-Wehmiller
IMA Group
Multivac
KHS
Sidel
Duravant
Fuji Machinery
Nichrome
Sealed Air
Ranpak
ABB
KUKA
Rockwell Automation
Schneider Electric

Recent Developments

FEBRUARY 2025

A manufacturer began quoting effectiveness against customer format schedules

An equipment manufacturer began presenting overall equipment effectiveness modelled against each customer's actual production schedule rather than rated line speed, reflecting the share of available time that format changeovers consume in practice. This was a commercial approach change rather than any transaction. Format schedules were requested during tendering.
Signal: Quoting effectiveness rather than rated speed exposes competitors whose faster machines change over far more slowly
JUNE 2025

A fulfilment operator standardised right-sizing across distribution centres

A fulfilment operator installed automated right-sizing across its distribution network, citing dimensional weight freight charges rather than corrugate consumption as the justification for the capital commitment. This was an operational investment rather than any partnership with an equipment supplier. Corrugate saving was treated as secondary.
Signal: Freight rather than material is the number that makes right-sizing pay, and operators reach it themselves
OCTOBER 2025

An equipment group acquired a systems integration business

A packaging equipment group acquired a systems integration firm, citing installation scheduling as the constraint on converting order intake into commissioned lines given integrator capacity across the region. This was an acquisition rather than any commercial supply arrangement between the parties. Order intake had outrun installation capacity.
Signal: Integration capacity is being bought rather than built, which confirms it as the binding delivery constraint

What Drives Equipment Cost

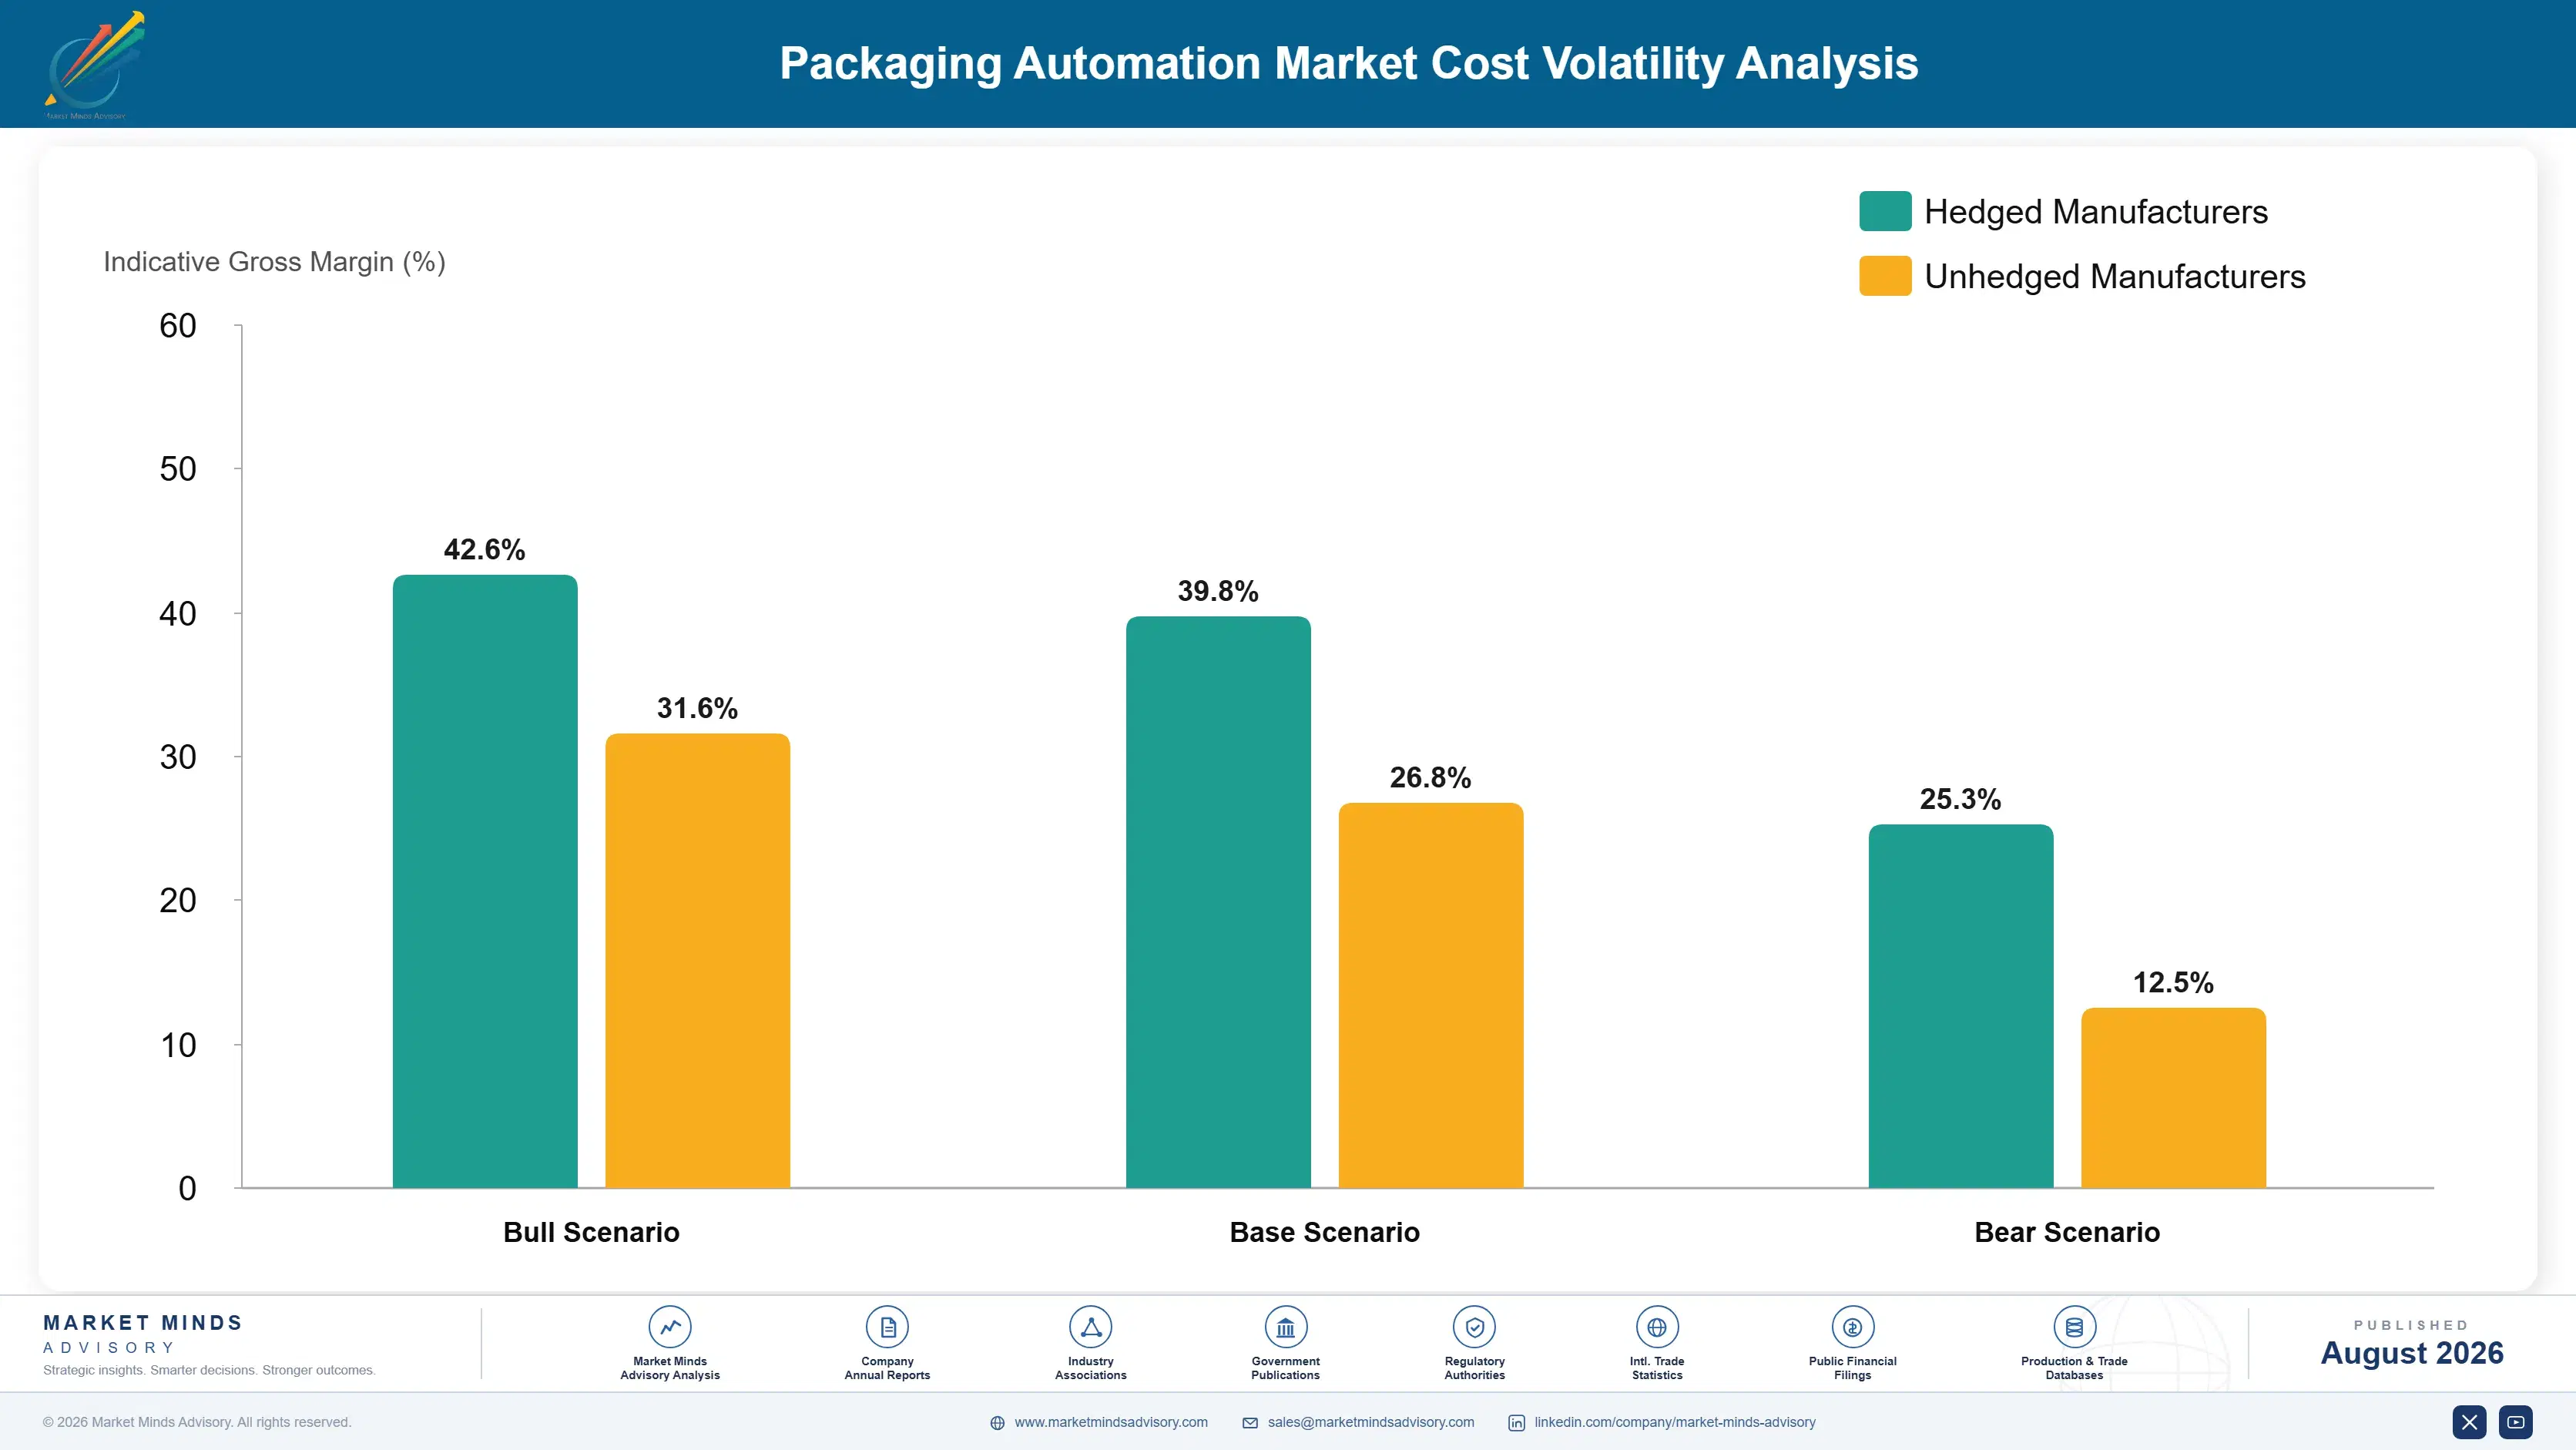
Bought-in components including drives, motors, controls, sensors and pneumatics account for roughly 44% of equipment cost, and packaging machinery builders assemble far more than they manufacture. Fabricated steel and machining add around 18%. Engineering, software development and commissioning labour take about 26%, which is high and rising as lines become more software-defined and less purely mechanical.
Component availability rather than price dominated through 2021 and 2022, with drives, controllers and sensors on extended lead times that delayed machine delivery regardless of order books. Krones noted supply chain and component availability pressure across its operations in its Annual Report 2022. Manufacturers holding fixed-price project contracts absorbed the cost movement, and several extended quoted delivery times substantially rather than commit to dates they could not meet.

The disadvantage falls on manufacturers without integration capability, and it operates through delivery timing rather than through equipment cost. With third-party integrators booked at around 94%, a supplier depending on them cannot promise commissioning dates and loses projects to competitors who can. That is a scheduling problem rather than a pricing one, and discounting does not address it in any way that a customer needing production this year finds useful.
packaging-automation-market-cost-volatility-analysis-1787559616461

Secure component allocation on drives, controls and sensors

Bought-in components at roughly 44% of equipment cost proved to be an availability problem rather than a price problem, and a missing controller delays an entire machine. Multi-year allocation agreements with component suppliers cost a modest premium and protect delivery dates. Customers remember which manufacturers delivered on schedule during the last shortage and specify accordingly.

Build or acquire integration capacity rather than subcontracting it

Third-party integrators booked near 94% of capacity means a supplier relying on them cannot commit to commissioning dates that customers increasingly require before ordering. Building the capability internally converts a scheduling dependency into a competitive advantage. Acquisition is faster than recruitment, which is why several groups have chosen that route recently. Recruitment simply cannot move fast enough.

Standardise platforms to cut engineering hours per project

Engineering, software and commissioning labour run near 26% of cost and rise with every bespoke element in a machine. Standardised platforms configured rather than designed per customer cut those hours substantially while preserving the flexibility that format proliferation demands. The discipline is commercial rather than technical, since sales teams accept customer-specific requests too readily.

Portfolio Architecture for Margin Defence

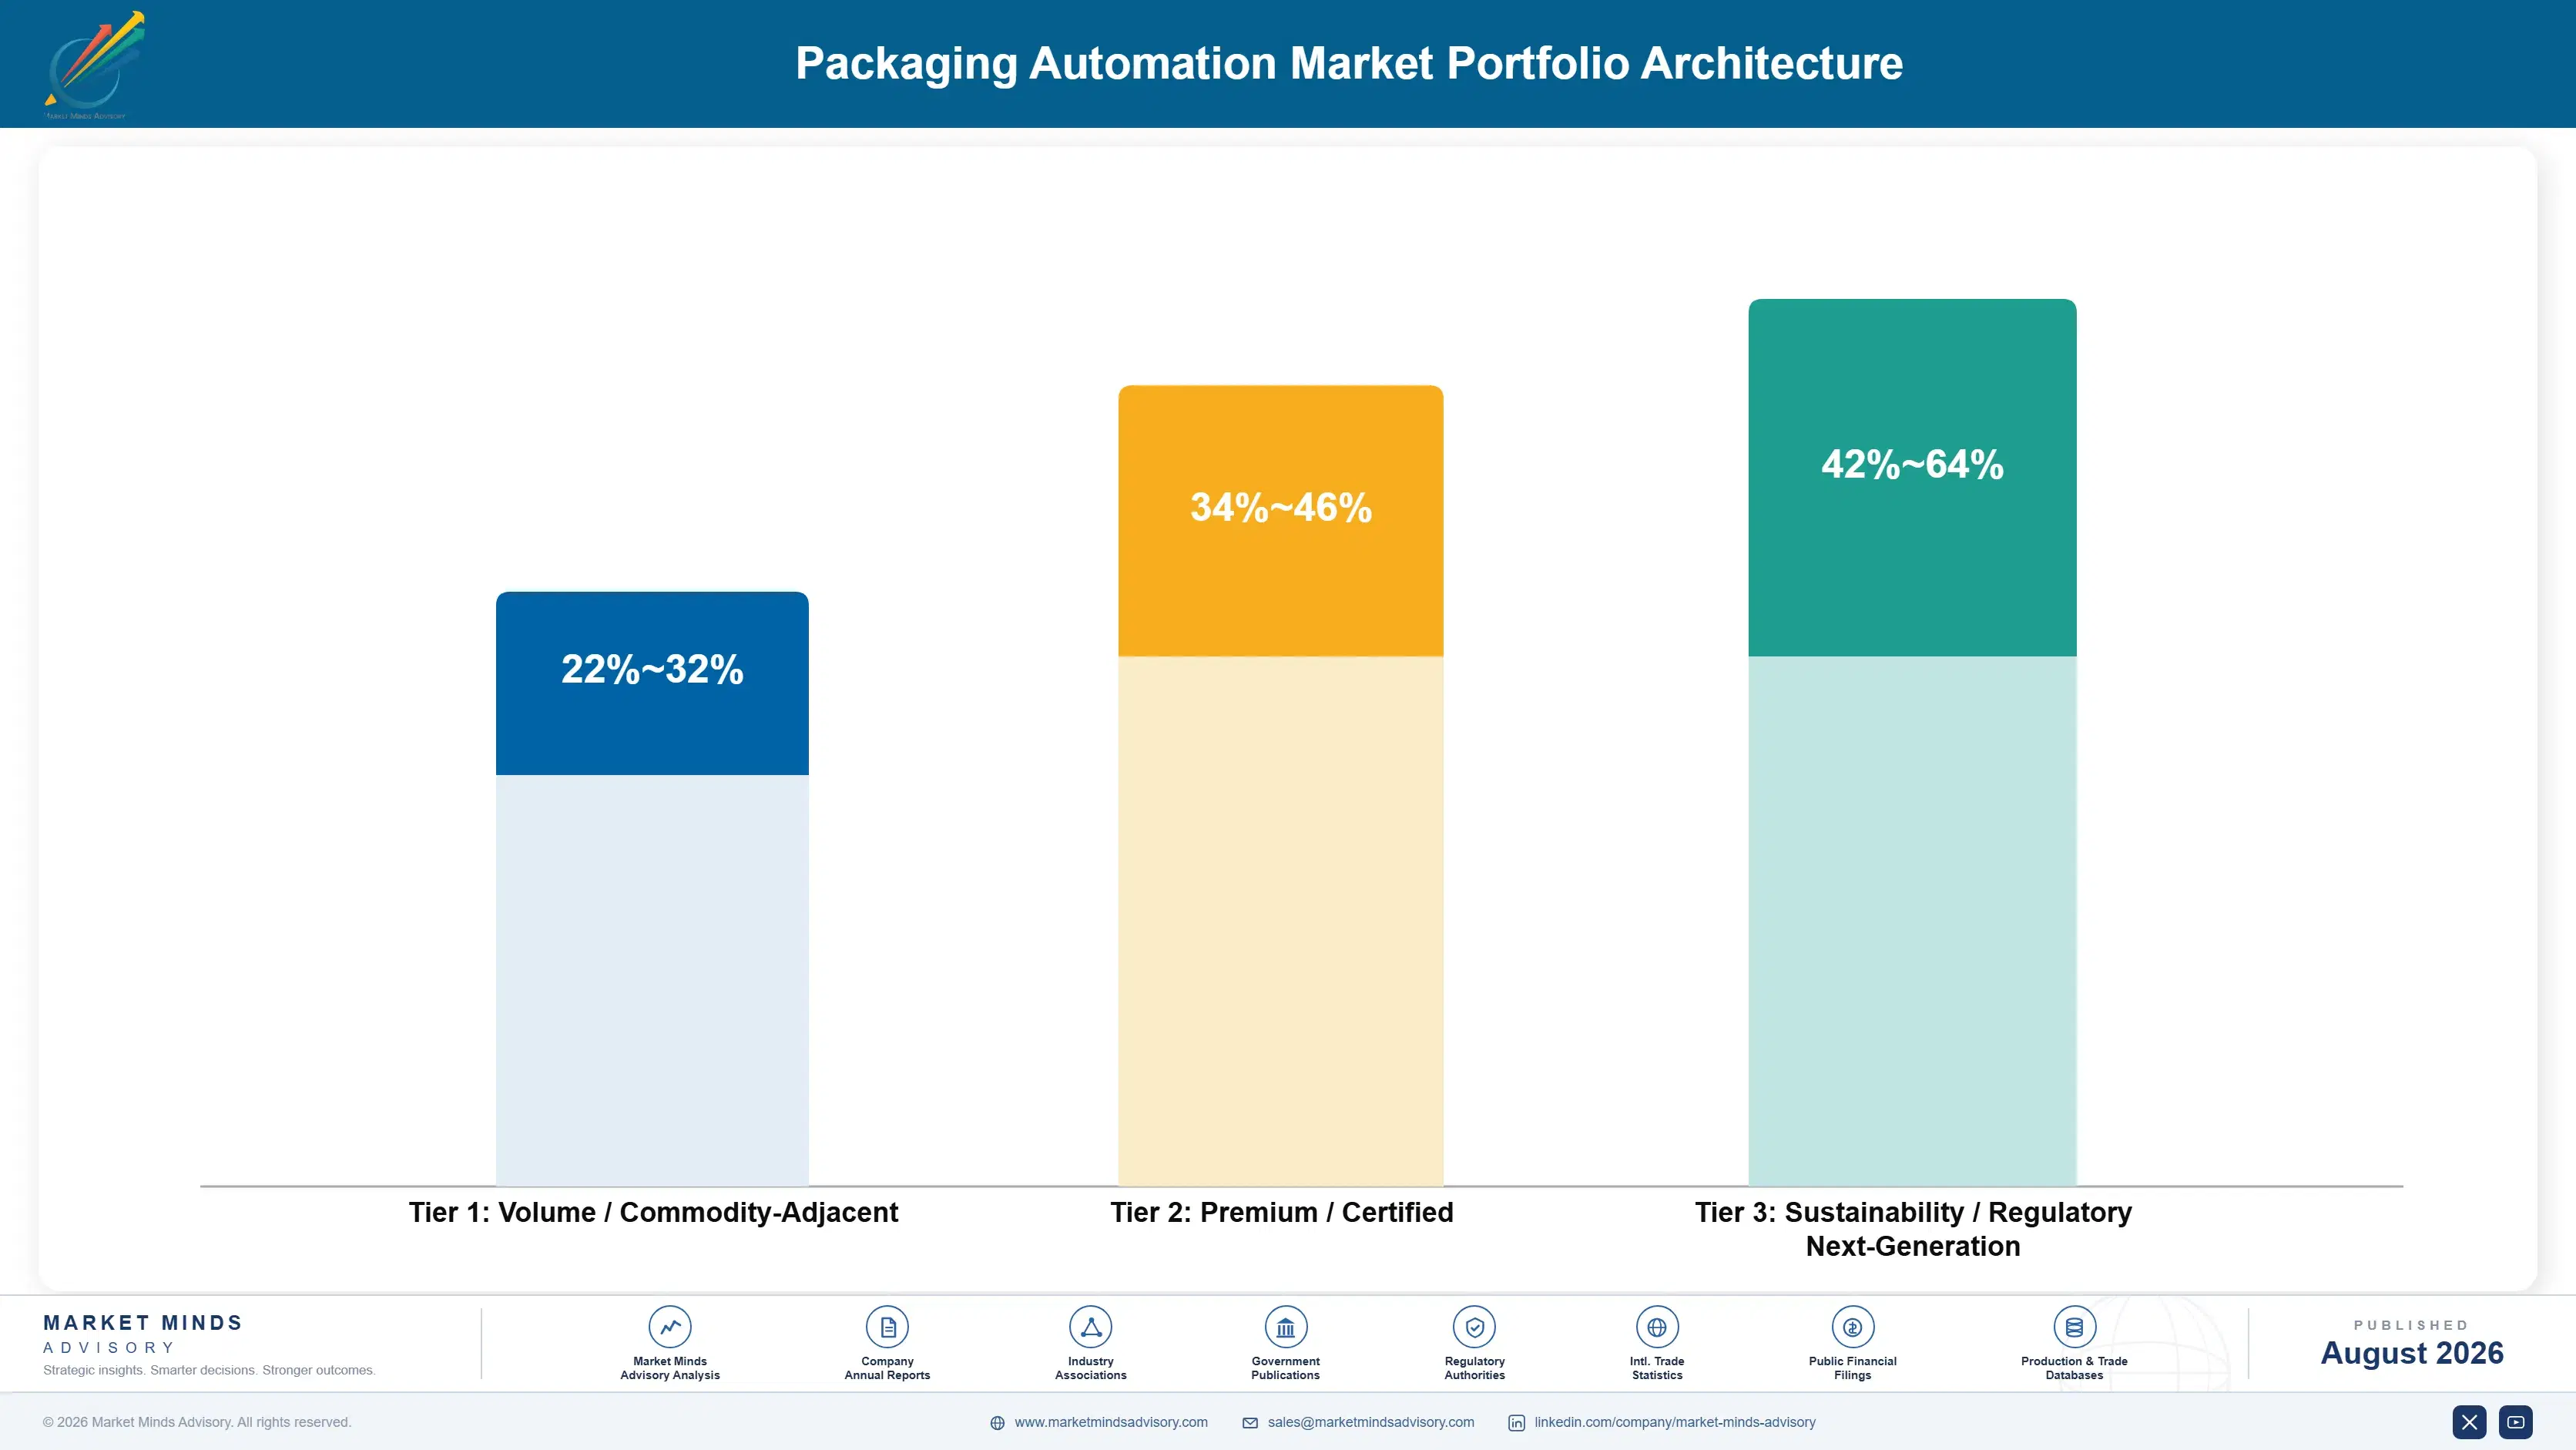
Margin separates on engineering content and integration rather than on manufacturing scale, which follows from packaging machinery builders assembling bought-in components more than making anything. Standard filling, labelling and coding equipment runs at gross margins in the mid twenties against many competent suppliers offering comparable specification. Cartoning and case packing run better on application complexity. Complete line integration runs considerably higher. Software, controls and effectiveness-guaranteed systems run highest, because the customer is buying an outcome rather than a machine.
The tension is that standard equipment volume fills the factories while integration and software earn the returns, and building integration capability requires experienced engineers who are precisely the scarce resource limiting the whole market. Manufacturers weighted toward standalone machines face customers who increasingly want line performance guarantees they cannot credibly offer. Several are acquiring integrators rather than recruiting, which is expensive and considerably faster.

High-value pools sit in line integration, effectiveness-guaranteed systems and e-commerce right-sizing. Standard machine supply is where component cost and competent competitors have already settled how much anybody earns. Component parity means nobody wins there for long, and the differentiation has to come from somewhere else entirely.

Volume / Commodity-Adjacent

Standard filling, labelling and coding equipment competing on specification and price against many capable suppliers. The ten-point range separates manufacturers with component purchasing scale and standardised platforms from those engineering each project largely from scratch.
Gross Margin: 22%-32%

Premium / Certified

Cartoning, case packing and end-of-line systems where application complexity and format handling create genuine engineering differentiation. The twelve-point spread reflects changeover design capability rather than any advantage in the underlying mechanical content.
Gross Margin: 34%-46%

Sustainability / Regulatory / Next-Generation

Complete line integration, controls and software, and effectiveness-guaranteed systems. The twenty-two-point range is wide because integration scope and performance commitment vary enormously between projects and between what suppliers will actually underwrite.
Gross Margin: 42%-64%
packaging-automation-market-portfolio-architecture-1787559616961

High-value Sub-segments and Strategic Watch-out

Line Integration Services

Growing at 10.2% and booked near 94% of capacity across mature markets, which makes this both the fastest service and the binding constraint on everything else. Scheduling certainty commands a premium competitors cannot discount against. Acquisition has become the usual route to building it quickly.
Gross Margin: 44%-64%

E-commerce Right-Sizing

Compounding at 12.9% because removing 28% of shipping cube saves freight rather than corrugate, and freight is the far larger cost. Operators reach the payback themselves, which shortens the sales cycle. Dimensional weight pricing does the persuading rather than the supplier. Freight is the larger cost line by far.
Gross Margin: 40%-56%

Effectiveness Guaranteed Systems

Quoting output against a customer's real format schedule rather than rated speed, where roughly 23% of time disappears into changeover. Very few suppliers will underwrite the number they imply. Underwriting the figure is what separates a claim from a commitment. Very few suppliers will actually underwrite it.
Gross Margin: 42%-58%

Standard Machine Supply

The factory volume, competing on specification against many capable suppliers with similar bought-in components. Manage this for platform standardisation and component allocation rather than for margin expansion. Bought-in components dominate cost and everybody buys the same ones. Platform standardisation is the only real lever available.
Gross Margin: 22%-32%

How Automation Demand Renews

Demand renews on capital cycles rather than on consumption, which makes this a lumpy project business dressed as an equipment market. A packaging line installed today runs for fifteen to twenty years with upgrades along the way, so the replacement annuity is long and the immediate revenue arrives as discrete projects. Spare parts and service generate the continuous element, and suppliers who neglect it forfeit a revenue stream that outlasts the original machine considerably.
Stickiness runs through installed base and operator familiarity rather than through any contractual mechanism. A plant whose engineers know one manufacturer's controls and hold spares for its equipment will specify the same supplier again, because retraining and stocking a second platform costs more than any price difference recovers. Greenfield plants make genuinely open decisions, which is why the 26% of projects that are not retrofits attract disproportionate competitive attention.

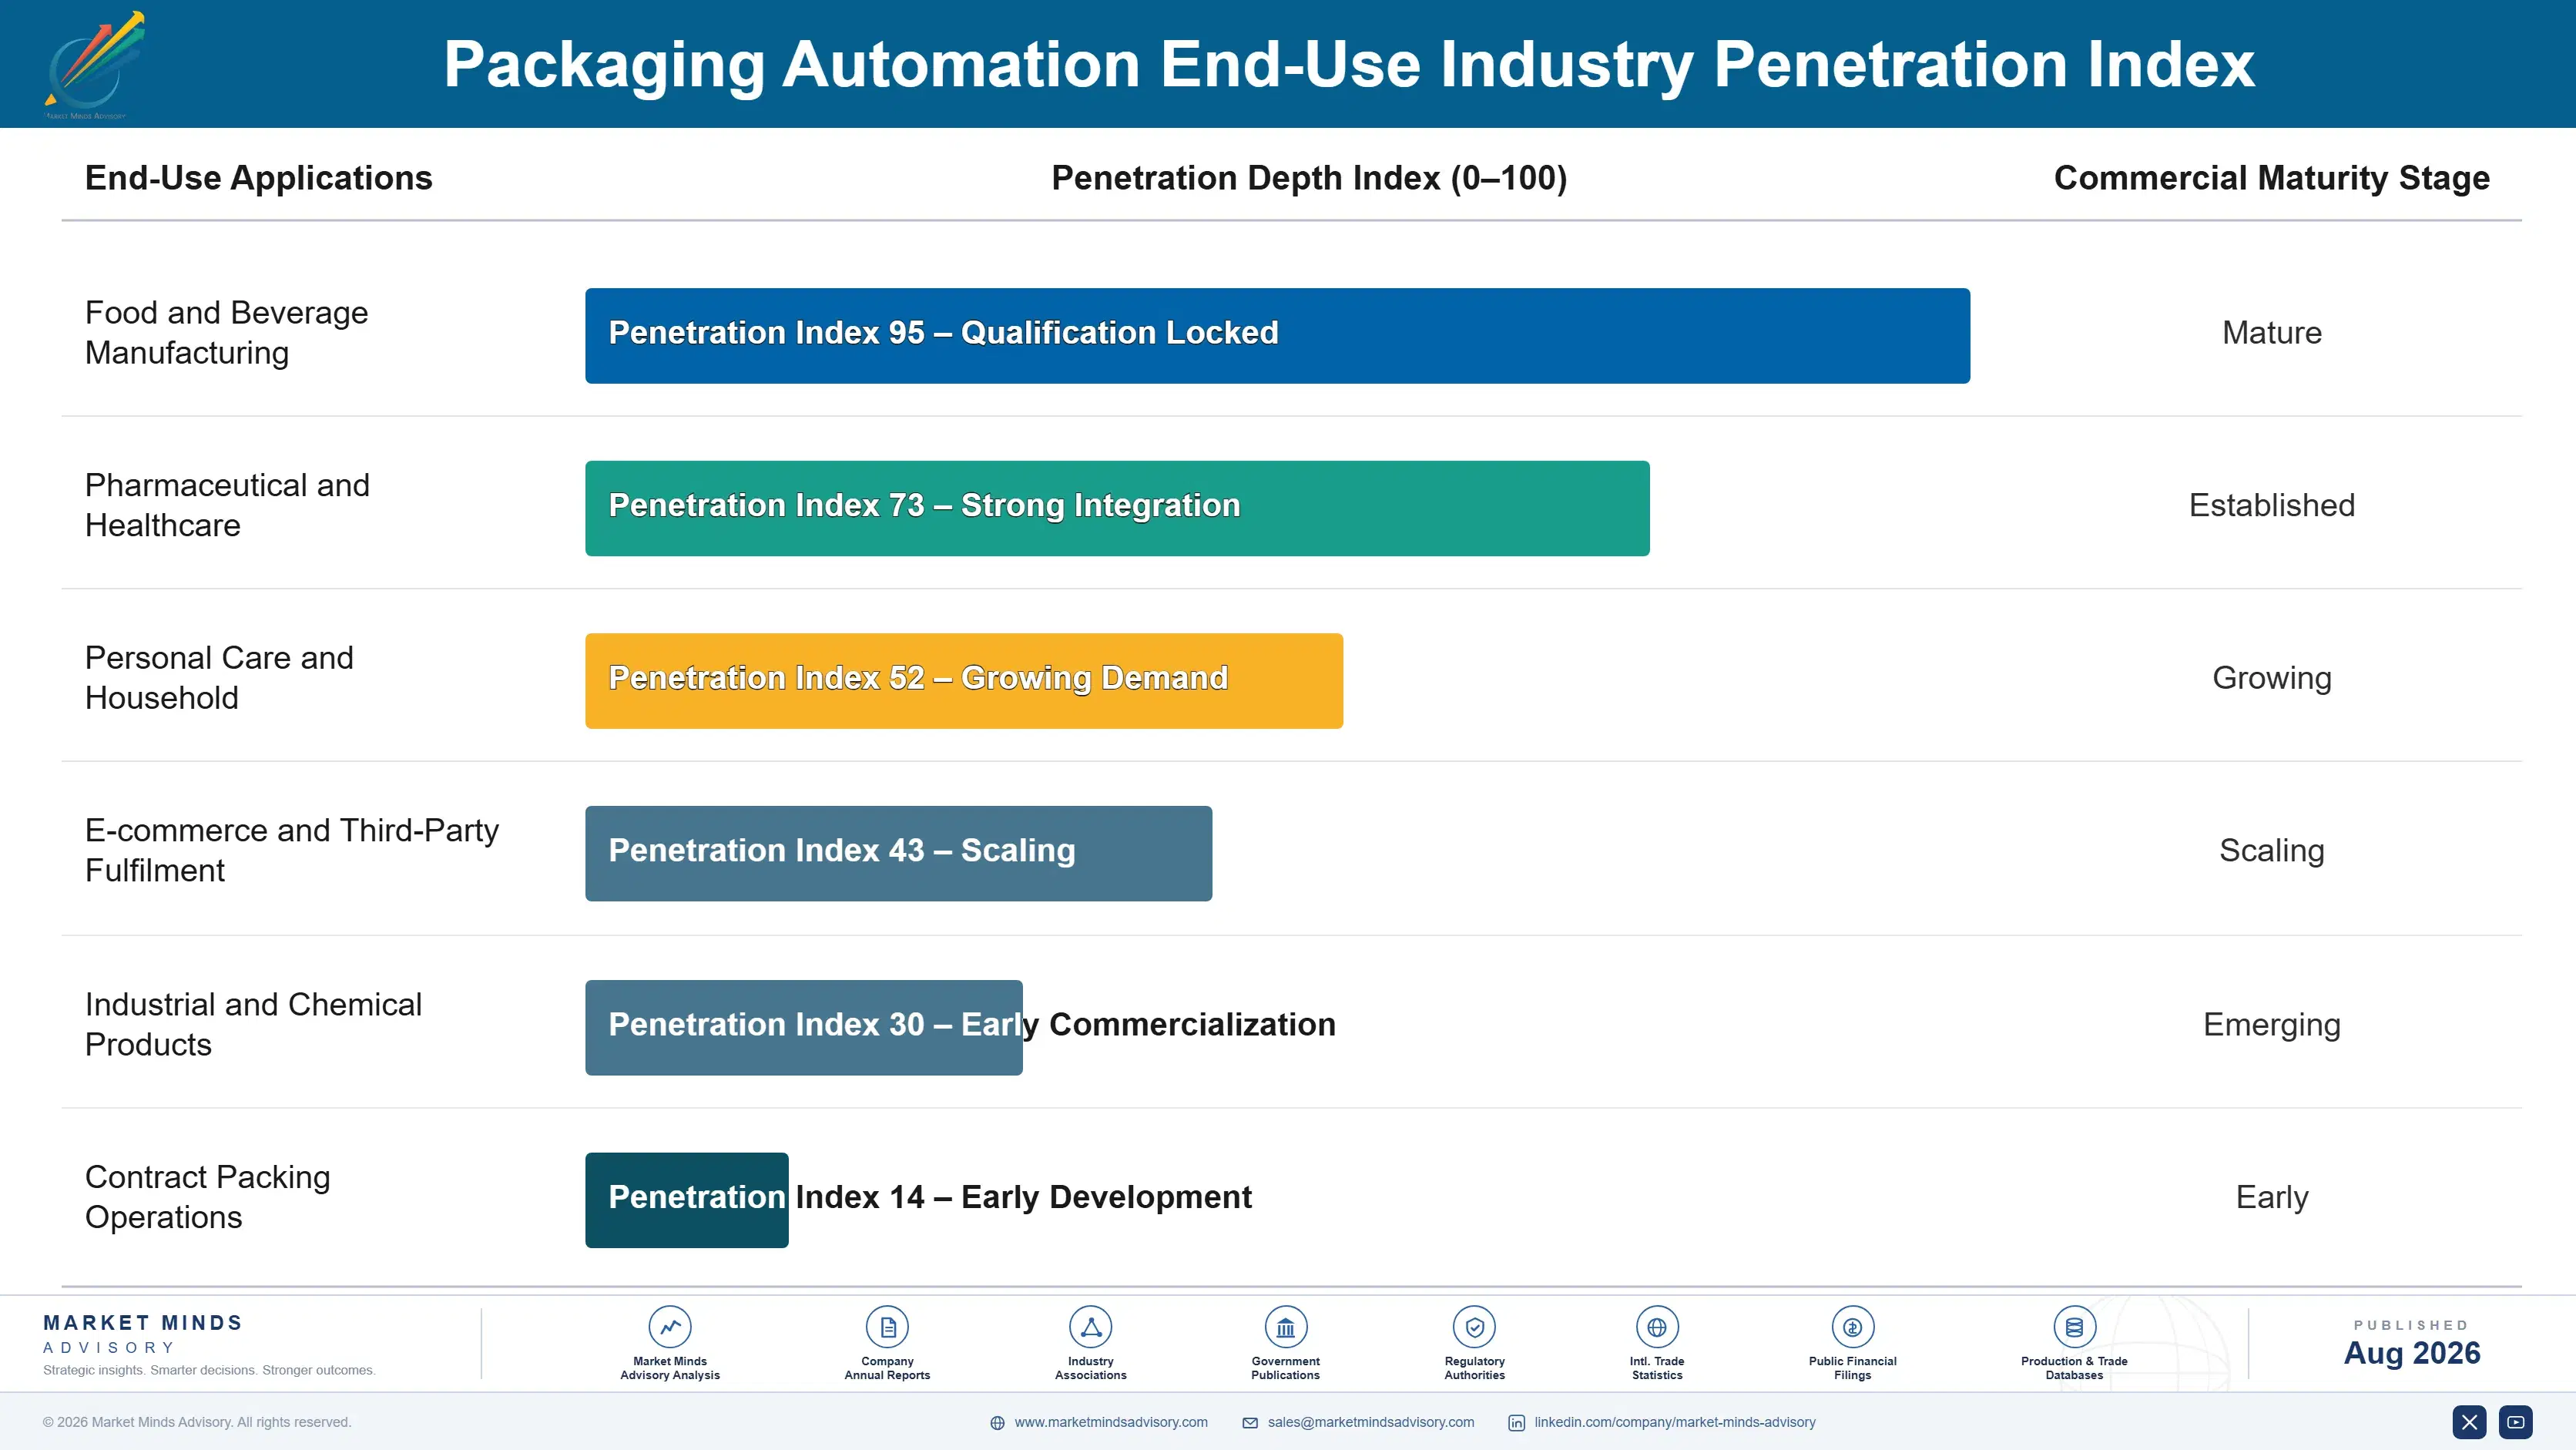
The buyer has broadened from engineering toward operations and finance together. Machinery was specified by plant engineers comparing technical capability. Automation projects justified on labour scarcity now involve operations managers who cannot staff the line and finance functions assessing payback, and neither of them is persuaded by a rated speed figure they have no way of evaluating.
packaging-automation-market-end-use-penetration-index-1787559617451

Where To Place The Bet

These are among the four positions where our research anticipates prominent divergence between winners and laggards over the coming forecast period. Each is grounded in the demand model, the regulatory perimeter, and the announced capacity pipeline.
01 / EFFECTIVENESS BASED QUOTING

Model their schedule, not your rated speed

A plant running forty distinct packaging formats loses roughly 23% of its available production time to changeovers, which makes rated machine speed a genuinely poor predictor of what any given line will produce across a working week. Suppliers who model overall equipment effectiveness against a customer's actual format schedule differentiate on the number that determines payback rather than the one purchasing departments habitually compare across quotations. It also exposes competitors whose faster machines change over slowly, a conversation those competitors cannot win.
02 / INTEGRATION CAPACITY OWNERSHIP

Own the commissioning date you are promising

Systems integration firms across mature markets are booked at roughly 94% of capacity, which means installation scheduling rather than equipment availability now determines when a customer actually starts producing anything from a project. An equipment manufacturer holding integration capability in house can commit to commissioning dates that competitors relying on third parties simply cannot match at any price they might offer. Customers needing production this year rather than next will pay for that certainty without very much argument at all, which is unusual in a capital equipment negotiation.
03 / FREIGHT ARGUMENT SELLING

Right-sizing saves shipping, not cardboard

Building a box around the actual order removes roughly 28% of shipping cube, and because parcel carriers charge on dimensional weight rather than actual weight, that saving lands squarely on freight rather than on corrugate consumption. Freight is by a considerable margin the larger cost line for any fulfilment operation of meaningful size. Suppliers presenting the material saving are quoting the smaller number and making a weaker case than the facts genuinely support, while operators shown the freight arithmetic reach payback independently.
04 / RETROFIT RISK PRICING

Survey before you commit to a timeline

Around 74% of packaging automation installations go into existing production lines with space constraints and legacy control systems that were never designed to accommodate them, and those projects overrun on schedule and budget considerably more often than greenfield equivalents do. That overrun is rarely priced into the original quotation, so it lands on the supplier as both cost and reputational damage. Site survey and simulation before commitment costs very little against a project overrun and converts unpredictable risk into a deliberate decision.

Engagement Snapshot From the Field

A live engagement with an industry participant carrying material or product regulatory and market exposure ahead of a defining policy shift, showing how our research translates into a defensible multi-year portfolio strategy.
MARKET MINDS ADVISORY · CLIENT ENGAGEMENT SUMMARY
Packaging Automation Producer Strategic Portfolio Review and Transition Roadmap 2026·Investment Scenario on Packaging Automation Exposure Evaluation 2025-26
CLIENT PROFILE
A European packaging machinery manufacturer with annual revenue around EUR 240 million (client-reported, unverified by MMA), supplying filling and end-of-line equipment to food and consumer goods producers. Integration was subcontracted entirely. Quotations led with rated line speed. Retrofit projects represented most of the order book. Win rates had been declining. Service revenue was neglected. Integration was subcontracted.
STRATEGIC CHALLENGE
Win rates had declined against competitors offering comparable machines, and management attributed it to price. Nobody had examined why customers were choosing elsewhere or whether the specification basis the company competed on reflected what those customers actually needed from a line. Price had been assumed rather than verified as the cause.
MMA APPROACH
MMA reviewed lost tenders to establish the stated and actual reasons for each decision rather than accepting price as the explanation. Customer format schedules were modelled against machine changeover times to compare effective output. Integration subcontractor availability was assessed against the client's quoted delivery commitments. Service revenue was benchmarked. Win rates were decomposed.
KEY FINDINGS
  1. Losses concentrated where competitors could commit to earlier commissioning dates, and the client's subcontracted integration had been the constraint rather than any aspect of equipment price or specification.
  2. On real customer format schedules the client's machines produced more than several faster-rated competitors, and nothing in its quotations had ever communicated that to anybody.
  3. Retrofit projects had overrun on schedule in a majority of recent installations, and none of that risk had been surveyed in advance or priced into the original commitment.
  4. Spare parts and service revenue was substantially below what the installed base should generate, because nobody had treated it as a business rather than an obligation.
CLIENT PROFILE
A European packaging machinery manufacturer with annual revenue around EUR 240 million (client-reported, unverified by MMA), supplying filling and end-of-line equipment to food and consumer goods producers. Integration was subcontracted entirely. Quotations led with rated line speed. Retrofit projects represented most of the order book. Win rates had been declining. Service revenue was neglected. Integration was subcontracted.
STRATEGIC CHALLENGE
Win rates had declined against competitors offering comparable machines, and management attributed it to price. Nobody had examined why customers were choosing elsewhere or whether the specification basis the company competed on reflected what those customers actually needed from a line. Price had been assumed rather than verified as the cause.
MMA APPROACH
MMA reviewed lost tenders to establish the stated and actual reasons for each decision rather than accepting price as the explanation. Customer format schedules were modelled against machine changeover times to compare effective output. Integration subcontractor availability was assessed against the client's quoted delivery commitments. Service revenue was benchmarked. Win rates were decomposed.
KEY FINDINGS
  1. Losses concentrated where competitors could commit to earlier commissioning dates, and the client's subcontracted integration had been the constraint rather than any aspect of equipment price or specification.
  2. On real customer format schedules the client's machines produced more than several faster-rated competitors, and nothing in its quotations had ever communicated that to anybody.
  3. Retrofit projects had overrun on schedule in a majority of recent installations, and none of that risk had been surveyed in advance or priced into the original commitment.
  4. Spare parts and service revenue was substantially below what the installed base should generate, because nobody had treated it as a business rather than an obligation.
RECOMMENDED STRATEGY
Phase 1: Phase one: rebuild quotations around effectiveness modelled on each customer's actual format schedule, since the client's machines already win that comparison and nobody knew it. Phase 2: Phase two: acquire or build integration capability, since subcontractor availability rather than equipment or price has been costing the company projects it should have won. Phase 3: Phase three: survey retrofit sites before committing timelines, and treat spare parts and service as a business rather than an after-sales obligation.
OUTCOME
Effectiveness-based quoting reversed the win rate on tenders where it was applied. An integration business was acquired and commissioning commitments have tightened materially. Retrofit surveys have reduced overruns, and the client reports service revenue growing faster than equipment sales (client-reported, unverified by MMA). Pricing was never reduced.

Frequently Asked Questions

Foundational context covering the market sizes, CAGR, scope, country, region and competition that inform every finding below. This section is provided to cover basics and most often pre-purchase conversations, answered from the MMA Primary Research Dataset.

What is the current size of the Packaging Automation Market?

The market was valued at USD 24.6 billion in 2025, rising to an estimated USD 26.72 billion in 2026. East Asia holds the largest regional share at 32% of value.

How large will the Packaging Automation Market be by 2036?

MMA forecasts USD 60.96 billion by 2036 under the base case, an expansion multiple of 2.28 times the 2026 value. That represents USD 34.24 billion of incremental value.

What is the CAGR for the Packaging Automation Market 2026 to 2036?

The base case runs at 8.6% compound annual growth between 2026 and 2036, with a bull case at 9.8% and a bear case at 7.4%. Historical growth from 2020 to 2025 was 7.2%.

Which segment is growing fastest?

E-commerce right-sizing and fulfilment leads at 12.9%, half again the market rate, by removing 28% of shipping cube. Integration, controls and software follow at 10.2%.

Who are the major companies in the Packaging Automation Market?

Krones, Syntegon, Coesia, Tetra Pak and Marchesini hold 26% of the market. Fragmentation reflects how few suppliers are genuinely strong across more than a few line positions.

Which country is growing fastest?

India leads at 12.2%, driven by packaged goods manufacturing expanding rapidly while wage inflation and labour availability together make manual packing progressively harder to sustain.

Report Segmentation Architecture

The full report scope spans multiple orthogonal segmentation dimensions, with cross-tabulated demand data provided for each dimension pair. Coverage extends further to regional breakdowns, trend trajectories, and the competitive detail needed to support segment-level decision-making.

By Equipment Function

  • Filling and Dosing Systems
  • Case Packing and Cartoning
  • Palletising and End-of-Line
  • Labelling, Coding and Marking
  • E-commerce Right-Sizing and Fulfilment
  • Integration, Controls and Software

By End-Use Industry

  • Food and Beverage Manufacturing
  • Pharmaceutical and Healthcare
  • Personal Care and Household
  • E-commerce and Third-Party Fulfilment
  • Industrial and Chemical Products
  • Contract Packing Operations

By Project Type

  • Greenfield Line Installation
  • Retrofit Into Existing Lines
  • Capacity Debottlenecking
  • Controls and Software Upgrade
  • Service and Performance Contracts

By Region

  • North America
  • Western Europe
  • East Asia
  • South Asia and Pacific
  • Latin America
  • Middle East and Africa
  • Eastern Europe

Scope, Methodology, and Coverage

Every figure in this report is reproducible from documented input assumptions. The scope below maps the historical period, the forecast horizon, the segmentation dimensions, and the countries covered, alongside the underlying primary and qualitative methodology.
Historical Period
2020 to 2025
Forecast Period
2026 to 2036
Base Year
2025 (USD billions; MMA Primary Research Dataset, August 2026)
Market Definition
The market comprises packaging automation equipment and systems supplied to manufacturers and fulfilment operations, including filling and dosing systems, case packing and cartoning, palletising and end-of-line, labelling coding and marking, e-commerce right-sizing and fulfilment, and integration controls and software, delivered through greenfield, retrofit, debottlenecking, upgrade and service contract projects. Value is measured at manufacturer level on equipment and systems revenue. Packaging materials, warehouse storage and retrieval systems, standalone industrial robots sold without packaging application, spare parts and consumables, and third-party maintenance services fall outside scope.
Quantitative Units
USD billions (current prices); systems and machines installed; USD per line by function and project type
Segmentation Dimensions
By Equipment Function; By End-Use Industry; By Project Type; By Region
Regions Covered
North America, Western Europe, East Asia, South Asia and Pacific, Latin America, Middle East and Africa, Eastern Europe
Countries Covered
China, Japan, South Korea, Taiwan, India, Thailand, Vietnam, Indonesia, Australia, United States, Canada, Mexico, Brazil, Argentina, Colombia, Chile, Germany, Italy, France, Netherlands, Switzerland, Spain, United Kingdom, Sweden, Poland, Czechia, Hungary, Romania, Saudi Arabia, South Africa
Key Companies Profiled
Krones, Syntegon, Coesia, Tetra Pak, Marchesini Group, ProMach, Barry-Wehmiller, IMA Group, Multivac, KHS, Sidel, Duravant, Fuji Machinery, Nichrome, Sealed Air, Ranpak, ABB, KUKA, Rockwell Automation, Schneider Electric
Quantitative Methodology
Primary survey, n=3,800 respondents, Q4 2025, six countries; demand-side model with trade association cross-validation
Qualitative Methodology
47 expert interviews, Q4 2025; applied to validate demand model assumptions, identify emerging dynamics, and assess competitive positioning
Report Format
PDF and XLSX data workbook (Word format preview document)
Publisher
Market Minds Advisory
Report Code
MMA-2026-CON-340
Published
August 2026
Contact
sales@marketmindsadvisory.com | www.marketmindsadvisory.com

Purchase the full Packaging Automation Market Report (2026 to 2036).

The full report sizes the global packaging automation market to 2036 across six equipment functions and seven regions, measured at manufacturer level on equipment and systems revenue. It models changeover loss rather than rated speed as the determinant of delivered output, which is the correction most equipment specification processes need. Competitive analysis covers 20 manufacturers on one consistent revenue basis, with moat and risk assessment for the two leaders. Integrator capacity is quantified as the binding constraint on project delivery by region. Four quantified revenue levers close the analysis.
Six equipment function segments with individual growth rates
Changeover loss modelled against rated speed for delivered output
Integrator capacity quantified as the binding delivery constraint
Retrofit and greenfield project economics separated by region
Twenty-manufacturer competitive map on one consistent revenue basis
Four quantified revenue levers with commercial impact ranges

Built For The People Who Decide

From boardroom strategy to bench-side execution, this report is read cover-to-cover by leaders shaping the next decade of their industry, turning demand scenarios, market dynamics and valuation benchmarks into decisions.
CXOs/ Presidents/ VPs/ Managers
M&A and Corporate Development
Strategy Teams and R&D Heads
Procurement and Product Directors
Regulatory and Compliance Leaders
Investor Relations and Equity Analysts