Market Minds Advisory
Packaging Additives Market

Packaging Additives Market: Recyclate Stabilisation, Food Contact Positive Lists and the Chemistry Nobody Sees

Recycled polymer arrives already degraded and carrying the additive package of whatever it used to be, which means the stabiliser dose that worked for virgin resin will not get it through a second life.

Lead Analyst

Bilal Shaikh

Published

September 2026

Make Smarter Decisions with Customized Research Insights

Request a free sample report and evaluate market opportunities, growth trends, and competitive dynamics relevant to your business needs.

2025 MARKET VALUE$6.4BMarket Size 2025
2036 FORECAST VALUE$13.7BBase Case , 2026 to 2036
CAGR 2026 TO 20367.2 %Bull 8.4% / Bear 6.0%
INCREMENTAL OPPORTUNITY$6.8BNet 10- year value creation
EXPANSION MULTIPLE2.00x2036 value over 2026 base
Strategic Levers
M&A Pipeline
Regional Outlook
Country Rankings
Competitive Intelligence
Segmental Deep-dive
Call-Us : 91 93563 13602

Executive Snapshot and Market Trajectory

An additive package is a fraction of a percent of a package by weight and it decides whether the material survives processing. Nobody outside the compounding room thinks about it until a recycled batch turns yellow, smells, or fails a drop test. Nothing about it is visible earlier.
Recyclate stabilisation compounds at 10.8%, exactly 1.50 times the market, because recycled polymer arrives already partly degraded and carrying whatever additives its previous life required. Restoring processability takes a different and heavier package than virgin resin ever needed. East Asia holds 31% of demand, reflecting converting capacity rather than any regulatory pull. Recycled content requirements arrived later there, so additive intensity per tonne still runs below Western levels.
Five suppliers hold 44%. Food contact positive lists are the commercial barrier: an additive not listed for the polymer and application cannot be used at all, whatever its performance, and getting one listed takes years. That gate has kept the field narrow through several waves of new chemistry. Roughly 68% of packaging additive volume goes into food contact applications where that constraint applies. Listing holdings, not manufacturing capability, decide who can supply.
Market Definition
The market covers functional chemical additives incorporated into polymer packaging materials during compounding or conversion, spanning stabilisers and antioxidants, recyclate stabilisation and restoration systems, slip and antiblock agents, clarifiers and nucleating agents, antimicrobial and oxygen scavenging additives, and antistatic and antifog agents. Colourants and masterbatch pigments, processing aids for non-packaging polymers, coatings, adhesives and packaging materials themselves are excluded.
Base Year Value
$6.4B in 2025 (MMA Primary Research Dataset, August 2026)
Forecast Period
2026 to 2036, eleven discrete annual values
CAGR
7.2% base case. Bull 8.4%. Bear 6.0%.
Fastest Growth Segment
Recyclate Stabilisation and Restoration Additives: 10.8% CAGR
Fastest Growth Country
India: 10.4% CAGR
Fastest Growth Region
South Asia and Pacific: 9.4% CAGR
Largest Region
East Asia: 31% of 2025 global value
Market Leaders
BASF, SI Group, Clariant, Songwon Industrial, Avient. Source: MMA Analysis based on company annual reports.
Primary Survey
n=3,800 procurement and R&D decision-makers, Q4 2025, six countries
Methodology
Demand-side build-up, cross-validated against public data, 47 expert interviews

Packaging Additives Market Forecast Scenarios

packaging-additives-market-size-forecast-scenario-1787307961439
Growth ran at an implied 5.8% across 2020 to 2025 and it accelerated in the back half for a reason that had nothing to do with packaging volumes. Recycled content mandates arriving from 2022 raised the additive intensity per tonne of polymer, because recyclate needs more stabilisation than virgin resin, and value per tonne rose faster than tonnage did. Tonnage was never the driver.
The base case at 7.2% rests on three mechanisms. Recycled content requirements keep rising across European and North American markets, and every point of recyclate raises the additive dose the compounder must add. Mono-material structures need clarity, barrier and processing performance from a single polymer that formerly came from a laminate. And food contact positive list barriers keep pricing power with listed incumbents. All three mechanisms raise value per tonne rather than tonnage itself.
The bull case at 8.4% assumes mechanical recycling volumes expand faster than expected, since every additional tonne of recyclate consumes a heavier additive package than the virgin resin it displaces. The bear case at 6.0% follows from chemical recycling scaling instead, which returns polymer close to virgin quality and would reduce the restoration chemistry demand that currently drives the fastest segment.

Half a Percent That Decides the Whole Package

Packaging additives are the least visible part of a package and among the most decisive. At around 0.6% of mass they control whether the polymer survives extrusion without degrading, whether film separates on a fast line, whether a container stays clear rather than hazy, and whether anything migrates into the food. None of that is apparent to anyone until it goes wrong.
TOP FIVE CONCENTRATION44%Combined share held by the five largest global additive suppliers
RECYCLATE ADDITIVE INTENSITY2.4 times virginStabiliser dose required against equivalent virgin polymer processing
ADDITIVE LOADING SHARE0.6% by massTypical functional additive loading in a converted packaging material
POSITIVE LIST APPROVAL TIME38 monthsTypical period to add a substance to authorisation lists
MELT FLOW RECOVERY71% restorationProcessability recovered in degraded recyclate through restoration chemistry
FORMULATION CHANGE REQUALIFICATION16 weeksTime for a converter to requalify after formulation change
Recycled content changed the arithmetic entirely. Virgin polymer arrives fresh from polymerisation with a known additive history. Recyclate has already been through heat, shear and ultraviolet exposure, has lost molecular weight, and carries the additive package of whatever it used to be, which nobody records. Stabilising it takes roughly 2.4 times the dose virgin resin requires, and restoration chemistry can recover about 71% of lost processability.
The commercial gate is regulatory rather than technical. Food contact rules operate on positive lists, so an additive not listed for that polymer and that application cannot be used regardless of how well it performs. Adding a substance takes around 38 months. That barrier has kept five suppliers holding 44% of a market where the chemistry itself is widely understood.
"The recycling industry spent a decade arguing about collection rates and sorting technology, and then discovered the polymer coming out the other end will not process without a considerably more expensive additive package than anyone had budgeted for. That bill lands on the compounder."
Director, Polymer Additives and Packaging Chemistry Practice · MMA Polymer Addit

Market Trends

Recyclate Restoration Chemistry Becomes a Category of Its Own

Recycled polymer arrives with reduced molecular weight, oxidation products, contaminant residues and an unknown legacy additive package. Standard stabilisation was never designed for that starting point. Restoration systems combining chain extenders, acid scavengers and heavier antioxidant loadings recover roughly 71% of lost processability and suppress the odour and yellowing that otherwise limit recyclate to dark or non-food applications. The segment compounds at 10.8% against a market at 7.2%, and demand scales directly with mandated recycled content rather than with packaging volume. That decoupling makes it unusually resilient to volume cycles.
Market Impact: Recyclate needing 2.4 times the dos

Mono-Material Structures Move Function Into the Additive Package

Recyclable single-polymer packaging removes the specialised layers that used to deliver clarity, barrier and stiffness, so those properties have to come from somewhere else. Clarifiers and nucleating agents make polypropylene transparent enough to replace polyester in some applications. Oxygen scavengers substitute partially for barrier layers. Slip systems compensate for surface behaviour a laminate previously provided. Function that once sat in a structure now sits in a formulation, which raises additive intensity per tonne substantially across converting. Somebody has to pay for that migration of function, and it is generally the compounder who discovers the cost first.
Market Impact: Food contact covering 68% of volume

Market Opportunities and Growth Drivers

Recycled Content Mandates Raise Additive Dose Per Tonne

European Union single-use plastics rules require 25% recycled content in polyethylene terephthalate beverage bottles from 2025 rising to 30% by 2030, with the Packaging and Packaging Waste Regulation extending obligations across further formats. Several United States states have adopted comparable requirements. Each point of recycled content raises the stabiliser dose the compounder must add, because recyclate needs roughly 2.4 times the additive loading of virgin polymer. That makes additive demand grow faster than packaging tonnage, which is unusual for a polymer input. Value per tonne rises alongside it. Tonnage alone understates the growth.
Market Impact: Threat to 10.8% growth segment

Food Contact Positive Lists Protect Listed Incumbents

European Regulation 10/2011 and United States Food and Drug Administration food contact rules operate on positive lists, meaning an additive not listed for the specific polymer and application cannot be used regardless of performance. Adding a substance takes around 38 months of toxicological and migration work. That gate keeps newer entrants out of food applications entirely and lets listed suppliers price against a genuinely restricted field. Roughly 68% of packaging additive volume goes into food contact applications where the constraint applies. Technical merit alone opens nothing, which newer entrants consistently underestimate when they enter the category.
Market Impact: Requalification costing 16 weeks

Market Restraints and Challenges

Chemical Recycling Would Remove the Restoration Requirement

Chemical recycling depolymerises waste back to monomer and repolymerises it, producing material effectively equivalent to virgin polymer. The root cause of the threat is straightforward: material that has not degraded needs no restoration chemistry, so the fastest-growing additive segment would lose its reason to exist. Deployment remains limited and expensive, but capacity announcements have been substantial. Suppliers mitigate by developing chemistry for the mechanical recycling volumes that will persist regardless, and by holding positions in stabilisation that both routes require equally. Mechanical recycling volumes will persist regardless. Stabilisation is required by both routes equally.
Market Impact: Restoration recovering 71% of proce

Additive Cost Is Invisible Until Somebody Looks For It

At 0.6% of pack mass the additive package rarely appears as a line item, so procurement functions periodically discover it and treat it as an easy saving. The root cause is that the consequences of under-dosing appear weeks later as degradation, haze or line stoppages, by which time nobody connects them to the formulation change. Requalification alone takes 16 weeks. Suppliers mitigate by quantifying the processing and yield consequences directly rather than defending a cost per kilogram nobody can contextualise. Processing consequences dwarf the additive cost entirely. Nobody connects the two events afterwards.
Market Impact: Additive intensity up 34% per tonne
4 additional market trends, 3 additional growth drivers, and 2 additional restraints and challenges are covered in the full report. Contact sales@marketmindsadvisory.com to access the complete intelligence.

Segment CAGR and Growth Architecture

Segmentation follows additive function, because function determines the regulatory pathway, the polymer compatibility and the problem the converter is trying to solve. A clarifier and an oxygen scavenger share a delivery route into the polymer and nothing else in chemistry, listing status or commercial logic. Listing status decides which chemistries a converter may actually use.
packaging-additives-market-market-share-analysis-1787307962013

Recyclate Stabilisation and Restoration Additives

Recyclate stabilisation compounds at 10.8%, exactly 1.50 times the market rate, because recycled polymer presents a problem virgin resin never did. Material arriving for its second life has lost molecular weight through heat and shear, carries oxidation products and contaminant residues, and contains whatever additive package its first application required, which nobody documented. Restoration systems combine chain extenders to rebuild molecular weight, acid scavengers to neutralise degradation products, and antioxidant loadings well above virgin levels. Together they recover roughly 71% of lost processability and suppress the yellowing and odour that otherwise confine recyclate to dark, non-food applications. Demand scales with mandated recycled content rather than with packaging tonnage, which decouples it from volume cycles.
CAGR 10.8%

Clarifiers and Nucleating Agents

Clarifiers and nucleating agents grow at 9.0% on the shift toward recyclable single-polymer packaging. Polypropylene is naturally hazy because it crystallises into structures that scatter light, and a clarifier controls that crystallisation to produce transparency approaching polyester. That matters because mono-material conversion frequently means replacing a clear polyester component with polypropylene, and consumers will not accept a hazy pack for a product they expect to see. Nucleating agents separately raise stiffness and shorten cycle times, which converters value directly in moulding economics. Food contact listing status is the practical constraint on which specific chemistries a converter can use, and the listed field is narrower than the technically capable one. Consumers reject hazy packs.
CAGR 9.0%
Full segment breakdown across 6 segments available in the complete report.

Regional Architecture and Country Demand Map

Demand follows polymer converting capacity rather than packaging consumption, since additives are incorporated during compounding and conversion. Recycled content regulation determines additive intensity per tonne, which varies far more between regions than converting volume alone would suggest. Regulation rather than tonnage sets the value per region here.

East Asia

East Asia holds 31% of global demand, the largest regional share. Note: this exceeds the standard band because Chinese polymer conversion for packaging exceeds any other region by a wide margin, and additives are incorporated during conversion. Domestic additive producers serve most of that volume at prices international suppliers cannot approach on standard chemistry. Recycled content requirements have been slower to arrive than in Europe, so additive intensity per tonne runs below Western levels, which is why the regional revenue share sits below its share of converted tonnage. Japanese demand is smaller, technically exacting and concentrated in high-clarity and food contact applications. Korean converting supports specialty chemistry. Growth of 8.2% reflects both volume expansion and gradually rising recycled content requirements.
Share: 31% | CAGR: 8.2% (2026 to 2036)

South Asia and Pacific

The fastest growing region at 9.4%, with India compounding at 10.4%, South Asia and Pacific holds 12% of demand. Indian packaging conversion has expanded rapidly with organised retail and packaged food penetration, and Extended Producer Responsibility rules introduced under national plastic waste management provisions have begun raising recycled content in packaging materials. That combination lifts both tonnage and additive intensity together. Indian additive producers serve much of the standard requirement domestically while specialty and food contact listed chemistry is imported. Southeast Asian converting has grown with manufacturing relocation. Australian demand is smaller and resembles Western Europe in its regulatory profile and additive intensity per tonne. Specialty and listed chemistry remains largely imported.
Share: 12% | CAGR: 9.4% (2026 to 2036)
Regional intelligence for 5 additional markets available in the complete report: North America, Western Europe, Latin America, Middle East and Africa, Eastern Europe. Contact sales@marketmindsadvisory.com.
packaging-additives-market-country-cagr-analysis-1787307962564

Selling Chemistry Nobody Can See

An additive package is 0.6% of pack mass and periodically gets treated as an easy saving by somebody who has never seen what under-dosing does eight weeks later. The positions worth holding are those where a regulation, a recyclate problem or a lost function makes the chemistry genuinely unavoidable. Four qualify. None is defended on price.

Build Restoration Systems for Mechanically Recycled Polymer

Recyclate arrives with reduced molecular weight, oxidation products and an undocumented legacy additive package, and standard stabilisation was never designed for that. Restoration systems combining chain extenders, acid scavengers and heavy antioxidant loadings recover roughly 71% of lost processability and suppress the yellowing and odour that otherwise confine recyclate to dark applications. The segment compounds at 10.8% and carries gross margins 15 to 23 points above conventional stabilisation. Demand scales with mandated recycled content rather than with packaging tonnage, which makes it unusually resilient to volume cycles. The converter cannot solve it alone.
Market Impact: Restoration systems carrying 15 to

Hold Food Contact Listings Ahead of Commercial Demand

Adding a substance to European or United States food contact positive lists takes around 38 months of toxicological and migration work, and an unlisted additive cannot be used at all whatever its performance. That timeline is usually treated as a compliance cost when it is a durable barrier. Roughly 68% of packaging additive volume goes into food contact applications where it applies. Listing chemistry ahead of demand, chosen for breadth of polymer and application coverage rather than for a single customer request, blocks competitors for over three years regardless of their technical capability.
Market Impact: Listings blocking every rival for 3

Replace the Functions Mono-Material Structures Removed

Recyclable single-polymer packaging strips out the layers that delivered clarity, barrier and surface behaviour, and those functions have to be recovered from the formulation instead. Clarifiers make polypropylene transparent enough to replace polyester, oxygen scavengers substitute partially for barrier layers, and slip systems compensate for lost surface properties. Additive intensity per tonne rises roughly 34% in converted mono-material structures. Selling into a recyclability programme reaches a sustainability budget holder with a deadline rather than a procurement function comparing cost per kilogram. Deadlines rather than cost targets drive that budget, and the conversation happens well before procurement is involved at all.
Market Impact: Mono-material lifting additive inte

Quantify Processing Consequences Rather Than Defend Price

At 0.6% of pack mass an additive package is periodically rediscovered by procurement and cut, with degradation, haze or line stoppages appearing weeks later when nobody connects them to the change. Requalification alone costs 16 weeks. Suppliers that arrive with measured line yield, scrap rate and cycle time data rather than a cost per kilogram argument reframe the conversation entirely, because the processing consequences dwarf the additive cost by a wide margin and the converter's operations function already knows it. Operations already understands the arithmetic, so the argument lands without needing to be explained twice.
Market Impact: Requalification alone costing a ful

Who Controls the Margin Pool

Five suppliers hold 44% of the market measured on additive revenue, the basis applied consistently through this section. Concentration is moderate for a specialty chemical category, and food contact listing rather than manufacturing scale explains most of it. BASF and SI Group lead, with Clariant, Songwon Industrial and Avient forming a credible second tier. Chemistry itself is widely understood across the field.
Competition operates on three dimensions. Food contact listing holdings decide which chemistries a supplier can offer for a given polymer and application at all. Recyclate restoration capability decides participation in the fastest-growing segment, where the technical problem is genuinely new. And formulation service depth decides whether a supplier sells packages or sells individual components on price. All three take years to build rather than capital to buy.

Two pressures will move rankings. Chinese and Indian producers compete aggressively on standard stabilisation chemistry in their home converting markets, where recycled content requirements have been slower to raise the technical bar. Against that, recyclate restoration rewards formulation depth newer entrants have not built. Rankings will shift toward whoever pairs restoration capability with broad food contact listings. Very few hold both today.
packaging-additives-market-company-positioning-matrix-1787307963095

Competitive Moat and Risk Dimensions

BASF

Moat: Listing breadth and formulation depth

BASF holds one of the broadest food contact listing portfolios in the industry across multiple polymers and applications, which lets it answer a converter's requirement immediately where competitors face a multi-year approval path. That breadth is paired with formulation service that sells complete packages rather than components, keeping the discussion on performance rather than on cost per kilogram.
BASF

Risk: Standard chemistry price exposure

Conventional stabilisers and slip agents represent substantial volume and face Chinese and Indian producers competing hard on price in their home converting markets, where recycled content rules have not yet raised the technical requirement. Corporate cost structure sits above regional producers, and in commodity chemistry that difference shows directly in every quotation for standard grades.
SI GROUP

Moat: Antioxidant and stabiliser specialisation

SI Group's concentration in phenolic antioxidants and stabiliser chemistry positions it directly in the recyclate restoration problem, where the requirement is heavier and more sophisticated antioxidant loading rather than any new functional class. Specialisation means development resources concentrate on exactly the chemistry that mandated recycled content is making more valuable each year.
SI GROUP

Risk: Chemical recycling substitution risk

Chemical recycling returns polymer close to virgin quality, and material that has not degraded needs no restoration chemistry at all. A portfolio concentrated in stabilisation is more exposed to that shift than a broader additive range would be. Deployment remains limited today, but announced capacity is substantial enough that the risk is real rather than theoretical.

Players Tracked

Prominent Players

BASF
SI Group
Clariant
Songwon Industrial
Avient

Other Key Players

Dow
Evonik Industries
Milliken and Company
Adeka Corporation
Kaneka Corporation
Croda International
Solvay
Baerlocher
PolyOne Distribution
Ampacet Corporation
Cabot Corporation
Fine Organics
Sabo
Everlight Chemical
Rianlon Corporation

Recent Developments

JANUARY 2025

European recycled content threshold lifts stabiliser demand per tonne

The 25% recycled content requirement for beverage bottles took effect across European Union member states, raising stabiliser and restoration additive dosing at compounders serving those converters. This was a regulatory threshold rather than any commercial development, and it lifted additive intensity independently of packaging volume.
Signal: Additive demand is now growing faster than
JUNE 2025

Mono-material conversions shift clarity and barrier into formulation

Brand owners converting to recyclable single-polymer structures moved clarity, oxygen barrier and surface performance requirements from packaging construction into additive formulation. This reflects packaging design change rather than any corporate transaction between chemical suppliers, and it raises additive intensity per converted tonne. Compounders are absorbing that cost first.
Signal: Function removed from a structure has to r
OCTOBER 2025

Chemical recycling capacity announcements raise substitution questions

Further chemical recycling capacity was announced across Europe and North America, targeting polymer streams that mechanical recycling handles poorly. These were project announcements rather than operating capacity, and material produced by that route requires no restoration chemistry at all. Announced capacity makes the risk genuinely real.
Signal: Polymer returned to virgin quality removes

Intermediates, Energy and Toxicology

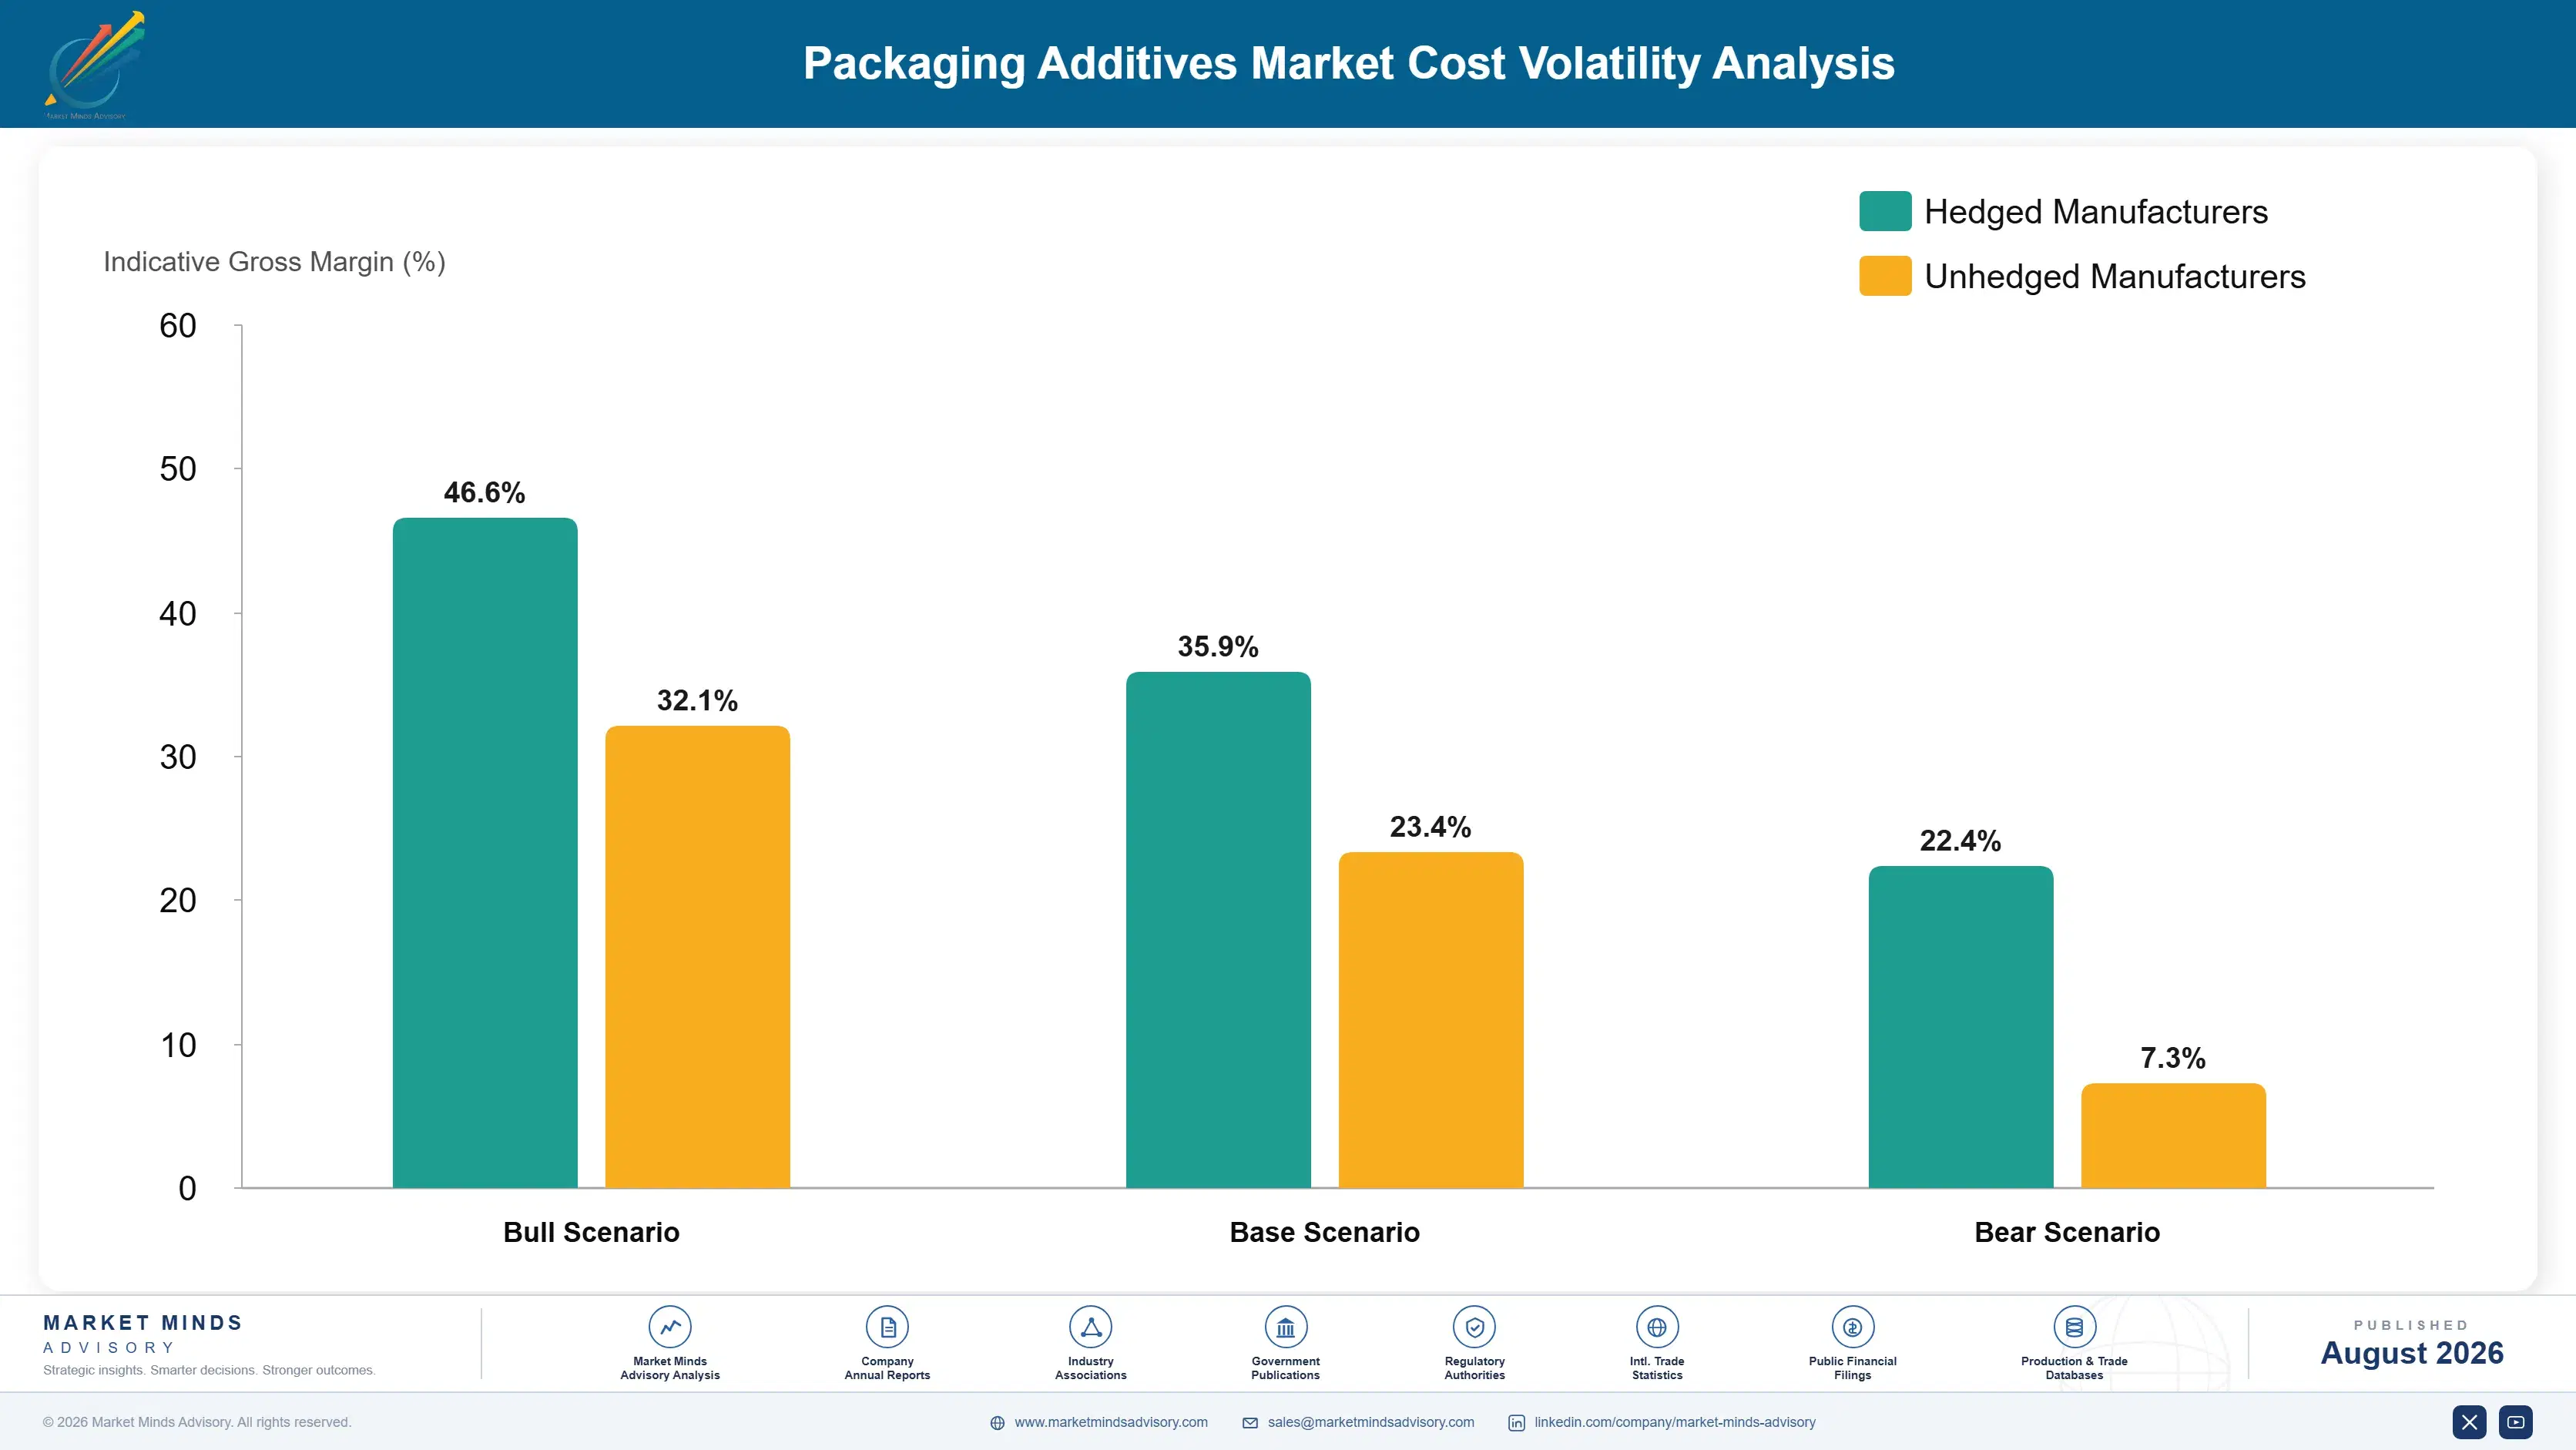
Chemical intermediates account for roughly 51% of cost of goods, principally phenolic compounds, phosphites, hindered amines and speciality organics purchased from fine chemical producers. Energy for synthesis and purification runs a further 17%, weighted toward European production. Toxicological studies, migration testing and listing maintenance sit largely outside cost of goods but represent substantial ongoing commitment.
Phenolic and phosphite intermediate pricing moved sharply through 2022 and 2023 as European energy disruption raised production costs across the fine chemical base, and International Energy Agency reporting across that period documents the underlying movement. Additive producers passed through only part of it, because converters facing their own resin cost increases resisted formulation price rises simultaneously. Company annual reports covering additive segments disclose the resulting margin compression through several quarters.

Exposure divides by portfolio position rather than by scale. Suppliers weighted toward standard stabilisers compete against Chinese and Indian producers with materially lower energy and intermediate costs, and cannot pass increases through at all. Those weighted toward listed food contact and restoration chemistry price against a restricted field, where a converter cannot substitute without a 38 month listing wait or a 16 week requalification it has no appetite for.
packaging-additives-market-cost-volatility-analysis-1787307963294

Dual-source key intermediates before listing a formulation

A listed additive cannot change intermediate source without confirming the substance remains identical, so the time to qualify a second supply route is during development rather than after commercialisation. Qualifying two intermediate sources costs one additional analytical exercise and removes an exposure that becomes very difficult to address once customers have formulated around the product.

Weight the portfolio toward listed and restoration chemistry

Standard stabilisers compete against producers with lower energy and intermediate costs, while listed food contact and recyclate restoration chemistry prices against a genuinely restricted field. The mix shift already justified on growth and margin grounds also reduces input cost exposure, because customers in those segments cannot substitute quickly whatever the price movement. Substitution requires regulatory work.

Contract intermediate supply across the listing lifecycle

A food contact listing represents around 38 months of investment and then supports commercial supply for many years, which is an unusually long horizon to take to an intermediate supplier. Multi-year contracting matched to that horizon stabilises the largest cost line and secures availability, which matters more than price when substitution requires regulatory work.

Portfolio Architecture for Margin Defence

The portfolio separates on whether the customer has an alternative. Standard antioxidants, slip and antiblock agents are well-understood chemistry available from many producers, and Chinese and Indian suppliers compete hard on price. Listed food contact chemistry cannot be substituted without a 38 month approval wait. Recyclate restoration systems solve a problem the converter cannot solve any other way, and pricing reflects that absence of options. Substitutability draws the whole ladder here.
The tension is that standard chemistry carries the volume and the compounder relationships from which specialty work follows. A supplier that abandons commodity stabilisers loses the account when a converter wants a complete package rather than a single specialty component. Most successful participants supply both and hold quite different margin expectations, treating the commodity tier as relationship access. Access and margin are separate objectives.

High-value pools concentrate where regulation restricts the field or where recyclate creates a problem virgin polymer never presented. Listed food contact additives, restoration systems and clarifiers for mono-material conversion all qualify, and none is bought on cost per kilogram. Cost per kilogram decides none of them.

Volume / Commodity-Adjacent Tier

Standard antioxidants, slip and antiblock agents, and conventional process stabilisers for virgin polymer conversion. Widely available chemistry where Chinese and Indian producers compete effectively on price, particularly in their own home converting markets.
Gross Margin: 22-31%

Premium / Certified Tier

Food contact listed additive packages across multiple polymers and applications, where an unlisted alternative cannot be used at any price and amendment takes years. Listing holdings rather than manufacturing capability determine who can supply.
Gross Margin: 38-50%

Sustainability / Regulatory / Next-Generation Tier

Recyclate stabilisation and restoration systems plus clarifiers and oxygen scavengers enabling mono-material conversion. The wide margin range reflects the gap between established restoration packages and newer chemistry still being proven on variable recyclate streams.
Gross Margin: 42-66%
packaging-additives-market-portfolio-architecture-1787307963791

High-value Sub-segments and Strategic Watch-out

Recyclate Restoration Systems

Compounding at 10.8% by solving a problem virgin polymer never presented, recovering roughly 71% of lost processability and suppressing the yellowing and odour that confine recyclate to dark applications. Demand scales with mandated content rather than with packaging tonnage. Mandated content drives it, not packaging volume.
Gross Margin: 48-66%

Listed Food Contact Packages

Growing at 8.0% and protected by positive lists that take around 38 months to amend, covering roughly 68% of packaging additive volume. An unlisted alternative cannot be used at any price, which makes listing holdings a durable rather than temporary commercial asset. Amendment is slow and expensive.
Gross Margin: 40-52%

Standard Stabilisers and Slip Agents

The volume core at 5.2%, contested by Chinese and Indian producers with lower energy and intermediate costs. Run to hold compounder relationships and complete package supply, since a supplier offering only specialties loses the account when a full formulation is required. Relationships depend on it.
Gross Margin: 22-31%

Chemical Recycling Substitution

The watch-out. Depolymerisation returns polymer close to virgin quality, and undegraded material needs no restoration chemistry whatsoever. Deployment is limited today but announced capacity is substantial enough to make the risk to the fastest segment genuinely real. Undegraded polymer simply needs no restoration chemistry at all.
Gross Margin: 26-58%

Formulated In and Rarely Changed

Additive positions are unusually durable because the customer bears every cost of changing them. A formulation qualified into a converter's process is specified in the recipe, validated against food contact requirements and often written into the brand owner's own specification, and changing it requires 16 weeks of requalification plus regulatory confirmation. At 0.6% of pack mass, no plausible price saving justifies that work, which is why supply relationships here outlast most commercial relat
Depth varies by regulatory exposure. Food contact converters buy deepest, treating listing status as a gating requirement and involving suppliers in formulation development. Recyclate compounders buy deeply because restoration chemistry solves a problem they cannot otherwise solve. Industrial and non-food packaging converters buy on price with genuine substitution freedom. Masterbatch producers sit between, formulating for their own customers' requirements.

The specifying population has moved. Additive selection once sat with a compounding technologist balancing performance and cost. Increasingly a sustainability function holds recycled content targets and a regulatory function holds food contact compliance, and neither participant evaluates cost per kilogram in the way procurement historically did. That is a different conversation entirely.
packaging-additives-market-end-use-penetration-index-1787307964296

Where Additive Suppliers Win

These are among the four positions where our research anticipates prominent divergence between winners and laggards over the coming forecast period. Each is grounded in the demand model, the regulatory perimeter, and the announced capacity pipeline.
01 / RECYCLATE PROBLEM OWNERSHIP

Recycled polymer created a problem virgin resin never presented

Material arriving for a second life has lost molecular weight through heat and shear, carries oxidation products, and contains an entirely undocumented legacy additive package. Standard stabilisation was never designed for that starting point, and recyclate consequently needs roughly 2.4 times the additive dose that virgin resin requires. Restoration systems that recover about 71% of lost processability compound at 10.8% and carry margins 15 to 23 points above conventional stabilisation, with demand scaling on mandated content rather than on packaging tonnage.
02 / POSITIVE LIST TIMING

Thirty-eight months of approval work blocks every competitor

Food contact regulation operates on positive lists, so an additive not listed for that polymer and application cannot be used at all regardless of how well it performs. Amendment takes around 38 months of toxicological and migration work, and roughly 68% of all packaging additive volume falls inside that constraint. Listing chemistry ahead of demand, selected deliberately for breadth of polymer and application coverage rather than for a single customer request, converts compliance spending into a genuinely durable competitive barrier.
03 / FUNCTION MIGRATION CAPTURE

Mono-material packaging moved performance from structure into formulation

Recyclable single-polymer packaging strips out all the specialised layers that previously delivered clarity, barrier and surface behaviour, and every one of those functions has to reappear in the additive package instead. Clarifiers make polypropylene clear enough to replace polyester, oxygen scavengers substitute partially for barrier layers, and additive intensity per converted tonne consequently rises by roughly 34%. Selling into a recyclability programme reaches a sustainability budget holder working to a deadline, rather than a procurement function comparing cost per kilogram.
04 / PROCESSING CONSEQUENCE QUANTIFICATION

Never defend a price per kilogram nobody can put in context

An additive package is 0.6% of pack mass, which makes it periodically invisible to procurement and then suddenly an obvious saving to somebody who has never seen the consequences. Under-dosing produces degradation, haze or line stoppages weeks later, by which time nobody connects them to the formulation change, and requalification alone costs 16 weeks. Suppliers arriving with measured line yield, scrap rate and cycle time data reframe that discussion onto ground the converter's own operations function already understands perfectly well.

Engagement Snapshot From the Field

A live engagement with an industry participant carrying material or product regulatory and market exposure ahead of a defining policy shift, showing how our research translates into a defensible multi-year portfolio strategy.
MARKET MINDS ADVISORY · CLIENT ENGAGEMENT SUMMARY
Packaging Additives Producer Strategic Portfolio Review and Transition Roadmap 2026·Investment Scenario on Packaging Additives Exposure Evaluation 2025-26
CLIENT PROFILE
A compounder supplying packaging converters across six European markets with roughly EUR 540 million in revenue (client-reported, unverified by MMA), producing both virgin and recycled content compounds for film, rigid container and closure applications. Recycled content compounds represented about 29% of volume (client-reported, unverified by MMA) and were consistently loss-making despite premium pricing over virgin grades.
STRATEGIC CHALLENGE
Recycled compounds suffered variable processability, yellowing complaints and higher scrap at customer sites, and the client had responded by raising antioxidant dosing across all recycled grades uniformly. Management proposed exiting recycled content work entirely. The technical team argued that uniform dosing against variable input quality was the actual problem rather than the recyclate itself.
MMA APPROACH
MMA characterised incoming recyclate by source stream across nine months, measuring melt flow, colour and oxidation markers, then correlated those against customer scrap and complaint data. Restoration additive packages from four suppliers were tested against the client's actual input variation rather than against standardised test material. Deposit scheme timetables were mapped against supply markets.
KEY FINDINGS
  1. Incoming recyclate quality varied more than threefold in measured oxidation markers between source streams, and uniform additive dosing therefore overdosed good material while under-dosing poor material simultaneously.
  2. Two of the four restoration packages tested substantially outperformed the client's incumbent on degraded streams specifically, and both were already food contact listed for the relevant polymers and applications.
  3. Customer scrap correlated with input oxidation rather than with recycled content percentage, which meant the client had been pricing its premium against the wrong variable across the whole recycled portfolio.
  4. Deposit return schemes launching in two of the client's supply markets would materially improve recyclate quality within three years, reducing restoration requirements and the associated cost.
CLIENT PROFILE
A compounder supplying packaging converters across six European markets with roughly EUR 540 million in revenue (client-reported, unverified by MMA), producing both virgin and recycled content compounds for film, rigid container and closure applications. Recycled content compounds represented about 29% of volume (client-reported, unverified by MMA) and were consistently loss-making despite premium pricing over virgin grades.
STRATEGIC CHALLENGE
Recycled compounds suffered variable processability, yellowing complaints and higher scrap at customer sites, and the client had responded by raising antioxidant dosing across all recycled grades uniformly. Management proposed exiting recycled content work entirely. The technical team argued that uniform dosing against variable input quality was the actual problem rather than the recyclate itself.
MMA APPROACH
MMA characterised incoming recyclate by source stream across nine months, measuring melt flow, colour and oxidation markers, then correlated those against customer scrap and complaint data. Restoration additive packages from four suppliers were tested against the client's actual input variation rather than against standardised test material. Deposit scheme timetables were mapped against supply markets.
KEY FINDINGS
  1. Incoming recyclate quality varied more than threefold in measured oxidation markers between source streams, and uniform additive dosing therefore overdosed good material while under-dosing poor material simultaneously.
  2. Two of the four restoration packages tested substantially outperformed the client's incumbent on degraded streams specifically, and both were already food contact listed for the relevant polymers and applications.
  3. Customer scrap correlated with input oxidation rather than with recycled content percentage, which meant the client had been pricing its premium against the wrong variable across the whole recycled portfolio.
  4. Deposit return schemes launching in two of the client's supply markets would materially improve recyclate quality within three years, reducing restoration requirements and the associated cost.
RECOMMENDED STRATEGY
Phase 1: Phase 1 (months 1 to 6): Introduce incoming recyclate characterisation and dose restoration additives against measured input quality rather than uniformly. Phase 2: Phase 2 (months 6 to 15): Qualify the two better-performing restoration packages and reprice recycled compounds against input oxidation rather than recycled content share. Phase 3: Phase 3 (months 15 to 26): Plan capacity and formulation for improving recyclate quality as deposit return schemes reach operation.
OUTCOME
Recycled content compounds moved from loss-making to positive contribution within ten months (client-reported, unverified by MMA). Customer scrap on recycled grades fell by roughly 41% and yellowing complaints ceased entirely. Additive spend rose by approximately EUR 1.4 million while recovered margin exceeded EUR 6 million annually (client-reported, unverified by MMA).

Frequently Asked Questions

Foundational context covering the market sizes, CAGR, scope, country, region and competition that inform every finding below. This section is provided to cover basics and most often pre-purchase conversations, answered from the MMA Primary Research Dataset.

What is the current size of the Packaging Additives Market?

The global market was worth USD 6.4 billion in 2025, reaching USD 6.86 billion in 2026. East Asia holds the largest regional share at 31% of demand.

How large will the Packaging Additives Market be by 2036?

MMA forecasts USD 13.7 billion by 2036, an expansion multiple of 2.00 times the 2026 base. That represents roughly USD 6.84 billion of incremental value.

What is the CAGR for the Packaging Additives Market 2026 to 2036?

The base case compounds at 7.2% annually, with a bull case of 8.4% and a bear case of 6.0%. Historical growth from 2020 to 2025 ran at 5.8%.

Which segment is growing fastest?

Recyclate stabilisation and restoration additives compound at 10.8%, exactly 1.50 times the market rate. Recycled polymer needs roughly 2.4 times the additive dose that virgin resin requires.

Who are the major companies in the Packaging Additives Market?

BASF, SI Group, Clariant, Songwon Industrial and Avient hold a combined 44% of the market. Food contact listing holdings rather than manufacturing scale sustain that concentration.

Which country is growing fastest?

India compounds at 10.4%, ahead of every other national market. Packaging conversion growth and Extended Producer Responsibility rules are lifting tonnage and additive intensity together.

Report Segmentation Architecture

The full report scope spans multiple orthogonal segmentation dimensions, with cross-tabulated demand data provided for each dimension pair. Coverage extends further to regional breakdowns, trend trajectories, and the competitive detail needed to support segment-level decision-making.

By Additive Function

  • Stabilisers and Antioxidants
  • Recyclate Stabilisation and Restoration Additives
  • Slip and Antiblock Agents
  • Clarifiers and Nucleating Agents
  • Antimicrobial and Oxygen Scavenging Additives
  • Antistatic and Antifog Agents

By End-Use Industry

  • Food and Beverage Packaging
  • Pharmaceutical and Healthcare Packaging
  • Personal Care and Household Products
  • Industrial and Transit Packaging
  • Agricultural Films and Products

By Commercial Dimension

  • Direct Supply to Compounders
  • Masterbatch Producer Supply
  • Converter Direct Formulation Supply
  • Distributor and Specialty Chemical Channel

By Region

  • North America
  • Western Europe
  • East Asia
  • South Asia and Pacific
  • Latin America
  • Middle East and Africa
  • Eastern Europe

Scope, Methodology, and Coverage

Every figure in this report is reproducible from documented input assumptions. The scope below maps the historical period, the forecast horizon, the segmentation dimensions, and the countries covered, alongside the underlying primary and qualitative methodology.
Historical Period
2020 to 2025
Forecast Period
2026 to 2036
Base Year
2025 (USD billions; MMA Primary Research Dataset, August 2026)
Market Definition
The market covers functional chemical additives incorporated into polymer packaging materials during compounding or conversion, spanning stabilisers and antioxidants, recyclate stabilisation and restoration systems, slip and antiblock agents, clarifiers and nucleating agents, antimicrobial and oxygen scavenging additives, and antistatic and antifog agents. Colourants, pigments and colour masterbatch, additives for non-packaging polymer applications, coatings, adhesives, and the packaging materials and polymers themselves are excluded. Sizing is measured at additive supplier revenue in current prices.
Quantitative Units
USD billions (current prices); tonnes of additive and dosing rate per tonne of polymer where applicable
Segmentation Dimensions
By Additive Function; By End-Use Industry; By Commercial Dimension; By Region
Regions Covered
North America, Western Europe, East Asia, South Asia and Pacific, Latin America, Middle East and Africa, Eastern Europe
Countries Covered
USA, China, Germany, France, UK, Japan, South Korea, India, Australia, Canada, Brazil, Mexico, Indonesia, Vietnam, Thailand, Malaysia, UAE, Saudi Arabia, South Africa, Nigeria, Turkey, Poland, Netherlands, Italy, Spain, Sweden, Switzerland, Argentina, Colombia, Singapore, and additional markets relevant to this sector
Key Companies Profiled
BASF, SI Group, Clariant, Songwon Industrial, Avient, Dow, Evonik Industries, Milliken and Company, Adeka Corporation, Kaneka Corporation, Croda International, Solvay, Baerlocher, PolyOne Distribution, Ampacet Corporation, Cabot Corporation, Fine Organics, Sabo, Everlight Chemical, Rianlon Corporation
Quantitative Methodology
Primary survey, n=3,800 respondents, Q4 2025, six countries; demand-side model with trade association cross-validation
Qualitative Methodology
47 expert interviews, Q4 2025; applied to validate demand model assumptions, identify emerging dynamics, and assess competitive positioning
Report Format
PDF and XLSX data workbook (Word format preview document)
Publisher
Market Minds Advisory
Report Code
MMA-2026-CHM-717
Published
August 2026
Contact
sales@marketmindsadvisory.com | www.marketmindsadvisory.com

Purchase the full Packaging Additives Market Report (2026 to 2036).

The full report sizes packaging additives across six functional classes, three commercial dimensions and seven regions, with annual forecasts to 2036 under base, bull and bear scenarios. Additive intensity per tonne is modelled against recycled content mandates market by market, which is what actually drives demand growth ahead of packaging tonnage. Food contact listing holdings are compared supplier by supplier across polymers and applications, showing where substitution is genuinely impossible. Chemical recycling substitution risk to restoration chemistry is quantified by announced capacity and stream. Twenty suppliers are profiled on a consistent additive revenue basis.
Additive intensity modelled against recycled content mandates by market
Food contact listing holdings compared across polymers and applications
Chemical recycling substitution risk quantified by announced capacity
Recyclate quality variation assessed by source stream and region
Mono-material function migration mapped to additive class
Regional intermediate and energy cost positions benchmarked by producer

Built For The People Who Decide

From boardroom strategy to bench-side execution, this report is read cover-to-cover by leaders shaping the next decade of their industry, turning demand scenarios, market dynamics and valuation benchmarks into decisions.
CXOs/ Presidents/ VPs/ Managers
M&A and Corporate Development
Strategy Teams and R&D Heads
Procurement and Product Directors
Regulatory and Compliance Leaders
Investor Relations and Equity Analysts