Market Minds Advisory
Packaged Bread Market

Packaged Bread Market: Distribution Radius Economics, Mix Migration and Private Label Pressure, 2026 to 2036

Bread goes stale in nine days, which caps how far a bakery can ship and means national scale buys procurement leverage and advertising rather than any advantage in the actual baking.

Lead Analyst

Lisa Gevelber

Published

September 2026

Make Smarter Decisions with Customized Research Insights

Request a free sample report and evaluate market opportunities, growth trends, and competitive dynamics relevant to your business needs.

2025 MARKET VALUE$195.0BMarket Size 2025
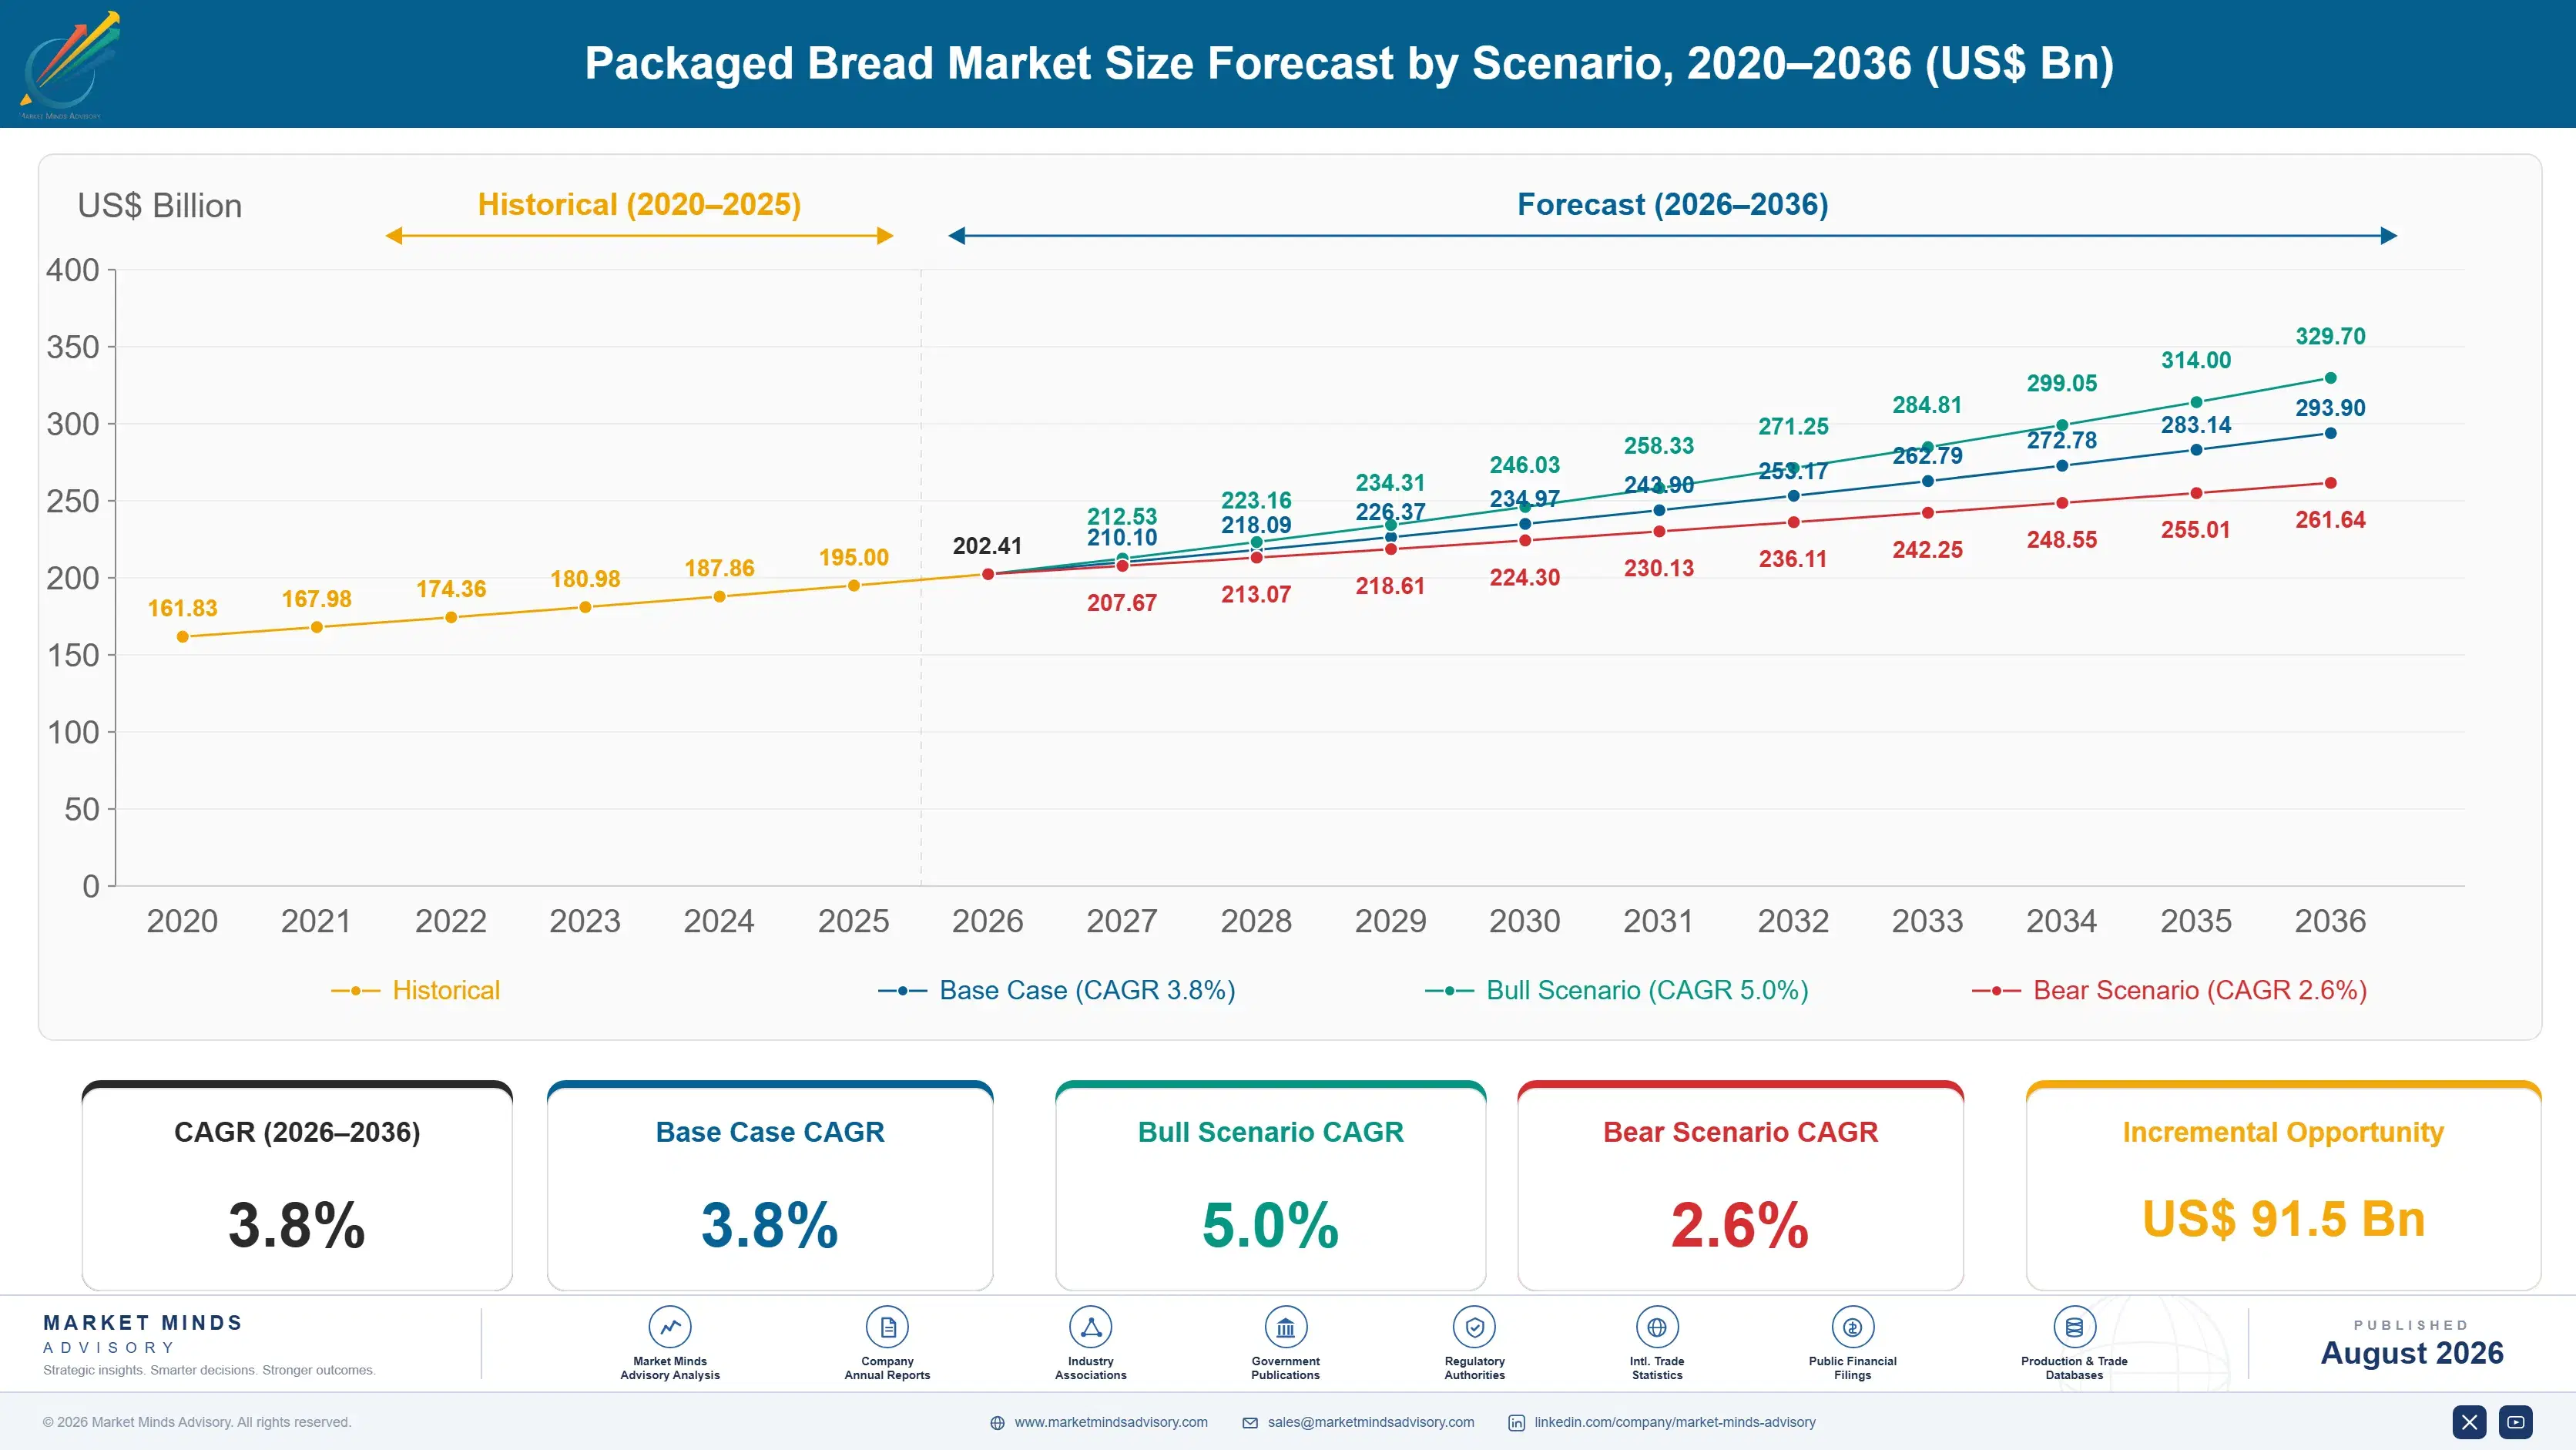
2036 FORECAST VALUE$293.9BBase Case , 2026 to 2036
CAGR 2026 TO 20363.8 %Bull 5.0% / Bear 2.6%
INCREMENTAL OPPORTUNITY$91.5BNet 10- year value creation
EXPANSION MULTIPLE1.45x2036 value over 2026 base
Strategic Levers
M&A Pipeline
Regional Outlook
Country Rankings
Competitive Intelligence
Segmental Deep-dive
Call-Us : 91 93563 13602

Executive Snapshot and Market Trajectory

Volume is flat everywhere and the entire growth story here is mix. Standard white loaf consumption declines across every developed market while protein-enriched, gluten-free, wholegrain and flatbread formats grow, and those formats carry two to three times the shelf price of the loaf they displace.
High-protein and functional bread grows at 5.7%, a full 1.50 times the market rate, carried by consumers reading nutrition panels rather than by any change at all in underlying bread consumption. East Asia holds 27% of global value, which is the largest single regional share, on Japanese and Korean packaged penetration that exceeds Western levels combined with Chinese demand growing quickly from a much lower base than either of them.
Concentration is low at 21% for the top five, and it stays low because a nine-day shelf life caps economic delivery at roughly 320 kilometres from the bakery door. National scale buys flour procurement terms and advertising weight, not any baking cost advantage. Private label now takes 38% of volume, which compresses branded pricing permanently in every mature market, and it is why most bakers moved upmarket rather than trying to defend the loaf itself.
Market Definition
The market covers industrially produced pre-packaged bread sold through retail and foodservice channels, spanning standard white and wholegrain loaves, buns, rolls and sandwich carriers, flatbreads, wraps and pita, gluten-free formats and high-protein or functional breads. It excludes in-store bakery and scratch-baked product sold unwrapped, frozen unbaked dough and par-baked bread sold for finishing, sweet bakery including cakes, pastries and doughnuts, crispbread and crackers, and breakfast cereals.
Base Year Value
$195.0B in 2025 (MMA Primary Research Dataset, August 2026)
Forecast Period
2026 to 2036, eleven discrete annual values
CAGR
3.8% base case. Bull 5.0%. Bear 2.6%.
Fastest Growth Segment
High-Protein and Functional Bread: 5.7% CAGR
Fastest Growth Country
India: 7.2% CAGR
Fastest Growth Region
South Asia and Pacific: 6.1% CAGR
Largest Region
East Asia: 27% of 2025 global value
Market Leaders
Grupo Bimbo, Yamazaki Baking, Flowers Foods, Aryzta, Warburtons. Source: MMA Primary Research Dataset, July 2026.
Primary Survey
n=3,800 procurement and R&D decision-makers, Q4 2025, six countries
Methodology
Demand-side build-up, cross-validated against public data, 47 expert interviews

Packaged Bread Market Forecast Scenarios

packaged-bread-market-trends-size-forecast-scenario-1787312525125
The market compounded at 3.1% between 2020 and 2025, and almost all of that was price rather than volume. Wheat and energy costs surged through 2022, and bakers passed most of it through because bread is a weekly purchase where retailers accept increases they resist elsewhere. Unit volumes fell modestly across developed markets throughout the period, exactly as they had before.
The 3.8% base case rests on three mechanisms. First, mix migration continues as consumers trade out of standard white loaves and into protein, wholegrain, gluten-free and flatbread formats carrying substantially higher shelf prices. Second, packaged penetration keeps rising across India, Southeast Asia and Latin America as organised retail and cold chain both expand. Third, foodservice bun and carrier demand grows steadily with quick-service restaurant expansion across exactly those same markets.
The bull case at 5.0% assumes protein and functional formats keep taking share while emerging market packaged penetration accelerates. The bear case at 2.6% turns on private label: if retailers push own-brand share beyond 45% in mature markets while wheat costs stay low enough to remove the pass-through argument, branded pricing compresses further and the mix improvement that currently drives value growth stops offsetting flat volumes.

Why Shelf Life Decides Industry Structure

Bread is the clearest example in food manufacturing of a product whose commercial structure is set by physics rather than by strategy. A loaf goes stale within days, so it must be baked close to where it is eaten, and no amount of capital changes that arithmetic.
TOP FIVE CONCENTRATION21%Combined position of the five largest packaged bread manufacturers
AVERAGE RETAIL PRICE$3.20 per loafTypical shelf price for a standard packaged bread loaf
PRIVATE LABEL SHARE38%Portion of packaged bread sold under retailer own brands
FLOUR COST SHARE27% of COGSMilled wheat flour share of delivered manufacturing cost
ECONOMIC DELIVERY RADIUS320 kilometresTypical viable delivery range from a single bakery site
AMBIENT SHELF LIFE9 daysTypical achieved shelf life for standard packaged bread loaves
The consequence is an industry that has resisted consolidation far longer than comparable categories. The five largest manufacturers hold 21% of global value, against figures two or three times higher in confectionery or soft drinks. A national baker cannot bake more cheaply than a regional one; it simply buys flour better, advertises harder and negotiates shelf space more effectively. Where consolidation has happened, it has produced networks of regional plants under one owner rather than the concentrated production that scale usually delivers.
That structure explains why the industry chased mix rather than volume. With flat consumption, private label at 38% and no route to lower baking cost, the only available growth was persuading shoppers to buy something more expensive than a white loaf. Protein, wholegrain, seeded, sourdough-style and gluten-free formats all serve that purpose, and they now generate a disproportionate share of category value on a modest share of the volume.
"Every few years someone announces they will consolidate the bread industry and finally capture the scale economies. Then they discover that the scale economies live in the flour contract and the television budget, not in the oven, and that a plant three hundred kilometres from the shelf is worth nothing at all. The category resists exactly the strategy that works everywhere else in food."
Principal Analyst, Bakery and Staple Foods Practice · MMA Agriculture Practice <

Market Trends

Protein Claims Reshape What Sits On The Shelf

Consumers reading nutrition panels have made protein content a purchase driver in a category that competed on freshness and price for a century. Bakers have responded with formats carrying ten to fifteen grams of protein per serving through added wheat gluten, pulse flours and seeds. Those loaves sell at roughly 2.4 times standard white loaf shelf price and now account for a meaningful share of category growth. The commercial attraction is obvious: the same production line, modestly higher ingredient cost, and a shelf price that behaves like a different category entirely.
Market Impact: Adds 9 points of packaged share

Preservative Removal Shortens Shelf Life And Raises Waste

Clean label reformulation has removed calcium propionate and similar preservatives from a growing share of packaged bread, and the direct consequence is shorter ambient shelf life. Bakers report unsold returns rising from roughly 4% toward 7% of production on reformulated lines. That waste is a genuine cost which the clean label price premium must cover in full before any margin appears at all. Participants are managing it with fermentation-based cultured wheat, tighter forecasting and modified atmosphere packaging, though none of those approaches fully restores the shelf life that removal took away.
Market Impact: Earns 6 points above retail margin

Market Opportunities and Growth Drivers

Packaged Penetration Rises Across Emerging Retail Markets

Bread consumption in India, Indonesia, Vietnam and much of Latin America still runs heavily through unpackaged local bakeries, and organised retail expansion is steadily converting all of that volume across. Packaged share of bread consumption across South and Southeast Asia has risen roughly nine percentage points since 2019 as modern trade and cold chain both expanded. The conversion adds genuine volume rather than mix improvement, which distinguishes it entirely from anything happening across developed markets. It also strongly favours local manufacturers holding existing distribution over international brands entering these markets cold.
Market Impact: Holds 38% of packaged volume

Quick-Service Restaurant Growth Pulls Bun And Carrier Demand

Burger buns, sandwich carriers and wraps supplied into quick-service and fast-casual restaurants have grown faster than retail bread for a decade, and that gap widens further as those chains keep expanding across Asia and Latin America. Foodservice bread demand is also less price-transparent than retail, because the buyer is a chain procurement team rather than a shopper comparing shelf tags. Bakers holding significant foodservice contracts report gross margins around six points above their retail equivalents, and the volumes involved are contracted rather than promotional, which improves plant loading predictability considerably.
Market Impact: Delays recovery by 3 quarters

Market Restraints and Challenges

Private Label Compresses Branded Pricing Permanently

Retailer own-brand bread now takes 38% of packaged volume across mature markets, and in several European countries it exceeds half. The root cause is that bread is a known-value item where shoppers remember the price and retailers use it to signal overall value. Commercially this caps what a branded loaf can charge and leaves manufacturers supplying both their own brands and their competitors' own label from the same ovens. Participants respond by moving upmarket into formats where private label follows slowly, and by taking own-label contracts themselves in order to fill capacity.
Market Impact: Sells at 2.4 times loaf price

Wheat Cost Movement Outpaces Retail Price Negotiation

Milled flour is 27% of cost of goods and moves with global wheat markets, while retail price changes require negotiation cycles that run months in most grocery chains. The root cause is retailer process rather than any market failure. Commercially this means a wheat spike compresses margin for two to three quarters before pricing catches up, as 2022 demonstrated across every major market. Participants manage it through forward flour purchasing matched to negotiated price periods and through indexation clauses that a small number of large retailers have begun to accept.
Market Impact: Raises unsold returns toward 7%
3 additional market trends, 2 additional growth drivers, and 4 additional restraints and challenges are covered in the full report. Contact sales@marketmindsadvisory.com to access the complete intelligence.

Segment CAGR and Growth Architecture

Segmentation here follows bread product type, meaning the format and formulation exactly as a shopper encounters it on shelf. That single dimension determines the shelf price, the production line requirements, the shelf life achievable, and how quickly retailer own-label follows into the space, which together govern very nearly the whole margin difference visible across this market.
packaged-bread-market-trends-market-share-analysis-1787312525692

High-Protein and Functional Bread

The fastest segment at 5.7%, a full 1.50 times the market rate, covering loaves and rolls formulated for elevated protein content or specific functional claims, typically through added vital wheat gluten, pulse flours, seeds and grains. Demand comes from consumers reading nutrition panels rather than from any change in overall bread consumption, which makes it a mix migration story rather than a volume one. Shelf prices run roughly 2.4 times standard white loaf levels on only modestly higher ingredient cost, using exactly the same production lines. Retailer own-label has followed into this segment more slowly than it did into wholegrain, which preserves branded margin for the time being at least.
CAGR 5.7%

Gluten-Free Packaged Bread

Growing at 5.0% on packaged bread formulated without wheat, rye or barley, produced either on dedicated lines or under strict changeover protocols designed to avoid any cross-contamination. Coeliac diagnosis accounts for only a modest part of total demand here; the far larger share comes from households avoiding gluten simply by preference, which makes the segment far bigger than clinical prevalence would suggest. Shelf prices run three to four times standard bread levels on genuinely higher ingredient and production cost, since dedicated capacity cannot be shared with anything else. Product quality has improved sharply across the segment, removing the texture objection that limited repeat purchase for years and held category growth back.
CAGR 5.0%
Full segment breakdown across 6 segments available in the complete report.

Regional Architecture and Country Demand Map

East Asia leads on Japanese and Korean packaged penetration combined with Chinese growth from a lower base. South Asia and Pacific grows fastest of all as organised retail steadily converts unpackaged volume. Western Europe holds high consumption alongside the most severe private label pressure found anywhere.

East Asia

Twenty-seven percent of global value, the largest single regional share, and it rests on two quite different things. Japanese and Korean packaged bread penetration exceeds Western European levels, with Yamazaki and SPC operating national networks selling formats from standard shokupan loaves through elaborate filled breads that carry confectionery-like pricing. Chinese demand is growing from a far lower base as urban consumption shifts toward Western-style breakfast formats and organised retail expands inland. Growth of 5.0% reflects Chinese volume conversion rather than Japanese or Korean expansion. Convenience store distribution is the dominant channel across the region and it favours daily delivery models. Filled and confectionery-adjacent formats blur the category boundary here considerably.
Share: 27% | CAGR: 5.0% (2026 to 2036)

Western Europe

Twenty-six percent of value on 2.2% growth, the slowest of any region and a fair reflection of the most mature bread market in the world. Per-capita consumption is high but declining, and retailer own-brand share exceeds half in several countries, which makes this the most severe private label environment anywhere. What the region holds is format sophistication: seeded, sourdough-style, rye and speciality loaves command real premiums that shoppers pay routinely. In-store bakery competes directly with packaged bread here in a way it does not elsewhere, and that competition caps how far packaged premiumisation can go. Discount chains have expanded fastest in this region and they stock own-label almost exclusively. Premiumisation has a real ceiling here.
Share: 26% | CAGR: 2.2% (2026 to 2036)
Regional intelligence for 5 additional markets available in the complete report: North America, South Asia and Pacific, Latin America, Middle East and Africa, Eastern Europe. Contact sales@marketmindsadvisory.com.
packaged-bread-market-trends-country-cagr-analysis-1787312526219

Where Bakery Margin Actually Accumulates

Four commercial moves separate the bakers earning genuine brand margins from those merely baking own-label at contract economics. Each depends on holding something a retailer cannot replicate through a tender: format innovation ahead of own-label, foodservice contract depth, waste discipline across the return chain, or a plant network geography properly matched to economic delivery radius.

Move Upmarket Faster Than Own-Label Can Follow

Retailer own-brand takes 38% of packaged volume and follows any successful format within eighteen to thirty months, so branded margin lives entirely in the gap before that copy arrives. Bakers launching protein, seeded and speciality formats ahead of that curve realise shelf prices roughly 2.4 times standard loaf levels on only modestly higher ingredient cost. The discipline required here is a continuous innovation pipeline rather than occasional opportunistic launches, because a single successful format buys barely two years of margin before the retailer's own version appears on the shelf beside it.
Market Impact: Holds margin for 30 months ahead of

Build Foodservice Contract Volume Quite Deliberately

Burger buns, sandwich carriers and wraps supplied to quick-service and fast-casual chains earn gross margins around six points above retail equivalents, because the buyer is a procurement team negotiating specification rather than a shopper comparing shelf tags. Volumes are contracted rather than promotional, which improves plant loading predictability considerably. Foodservice bun and carrier volume has grown roughly 5% annually for a decade while retail bread volume fell. Winning that work requires specification consistency and delivery reliability rather than brand strength, which suits bakers unable to outspend national brands on retail marketing anyway.
Market Impact: Earns 6 points above retail gross m

Attack Unsold Returns Across The Delivery Chain

Unsold bread returned from retail runs between 4% and 7% of production and is charged wholly to the manufacturer under most supply arrangements, which makes it comfortably one of the largest controllable costs in the whole business. Bakers deploying store-level demand forecasting alongside dynamic delivery quantities cut returns by roughly a third, worth two to three margin points outright. The investment required is forecasting capability and delivery system change rather than any plant capital, and the prize improves further as clean label reformulation continues shortening shelf life across core ranges.
Market Impact: Recovers up to 3 margin points from

Match Plant Network Geography To Delivery Radius

Economic delivery runs to roughly 320 kilometres before freight and shelf life together destroy the economics, so a plant network either covers a market properly or leaves gaps competitors fill. Bakers with correctly spaced networks serve 90% or more of their addressable retail within radius, against roughly 60% for those whose sites reflect historical acquisition activity rather than any considered geography. Rationalising toward the right map usually means closing plants in overlapping territory and building where nothing sits, which boards consistently find harder to approve than the underlying arithmetic warrants.
Market Impact: Serves over 90% of addressable reta

Who Controls the Margin Pool

Concentration is low at 21% for the five largest manufacturers, measured on packaged bread revenue across all participants, and shelf life keeps it that way. Grupo Bimbo leads on the reach of its regional plant networks across the Americas and Europe, and the gap to the second tier is widest in distribution density rather than in production capacity or brand strength.
Competition runs on three dimensions. Shelf presence decides retail outcomes, and in North America direct store delivery gives brands control that warehouse-delivered competitors cannot match at all. Format innovation decides who holds margin, since own-label follows any success within roughly thirty months. Price competition is fiercest in standard loaves, where the shopper knows the price, the retailer uses it as a value signal, and no manufacturer holds any defensible position whatsoever.

Two pressures are building. Discount retail chains continue expanding across Europe and increasingly North America, and their own-label-only models remove branded shelf space entirely rather than merely competing for it. Meanwhile local manufacturers across India and Southeast Asia are consolidating fast enough to hold their markets before international brands establish distribution. Rankings shift where plant network geography meets format innovation capability, since neither alone holds a market.
packaged-bread-market-trends-company-positioning-matrix-1787312526739

Competitive Moat and Risk Dimensions

GRUPO BIMBO

Moat: Unmatched direct distribution density

Direct store delivery networks reaching small independent retailers across Mexico and much of the Americas give the company shelf access at a density no competitor has replicated in any market. That network took decades to build, costs enormously to operate, and cannot be assembled by a competitor buying plants, because the value sits in the routes rather than the ovens.
GRUPO BIMBO

Risk: Exposure to discount retail expansion

The distribution advantage matters least in discount chains that stock own-label only and take delivery through their own warehouses. As those formats expand across Europe and North America, the routes that constitute the company's principal asset serve a shrinking share of total grocery volume. Defending shelf space is not possible where none is offered.
YAMAZAKI BAKING

Moat: Convenience channel format mastery

Daily delivery into Japanese convenience store networks, combined with a format range extending from plain loaves into filled and confectionery-adjacent breads, gives the company category positions that behave more like snacking than staple bakery. Convenience retailers reward suppliers who can refresh range continuously, and few bakers anywhere operate at that innovation cadence.
YAMAZAKI BAKING

Risk: Domestic demographic contraction

The core market is a shrinking and ageing population where bread consumption per head is already high, so domestic volume growth is simply unavailable. International expansion has proceeded cautiously and meets entrenched local distribution in every target market. The convenience channel model that works so well domestically transfers poorly to Western grocery formats.

Players Tracked

Prominent Players

Grupo Bimbo
Yamazaki Baking
Flowers Foods
Aryzta
Warburtons

Other Key Players

Hovis
Associated British Foods
Lantmannen Unibake
Barilla
SPC Samlip
Britannia Industries
Harry-Brot
Premier Foods
Campbell Soup Company
Grupo Nutresa
Vandemoortele
Toly Bread
Mankattan Food
Fazer
La Lorraine Bakery Group

Recent Developments

FEBRUARY 2025

Grupo Bimbo expands high-protein bread range across the Americas

An extended protein-positioned bread range was rolled out across several of the company's American markets, targeting the nutrition panel shoppers who now drive almost all category value growth even while standard white loaf volumes continue their long-running decline across every developed market the company serves.
Signal: Category value growth is now being pursued
JUNE 2025

Britannia commissions additional Indian bread capacity

New packaged bread production capacity entered commercial service in India during the period, aimed squarely at the packaged conversion now happening as organised retail, cold chain and quick commerce delivery all expand together and together steadily displace neighbourhood bakery volume across the larger urban markets.
Signal: Emerging market growth is genuine volume c
OCTOBER 2025

Warburtons extends preservative-free reformulation across core range

Preservative removal was completed across a substantially wider portion of the core loaf range, accepting both the shorter ambient shelf life and the higher unsold return rates that clean label reformulation brings in exchange for the clean label positioning that shoppers increasingly demand on core ranges.
Signal: Bakers are trading shelf life and waste co

What Drives Delivered Bread Cost

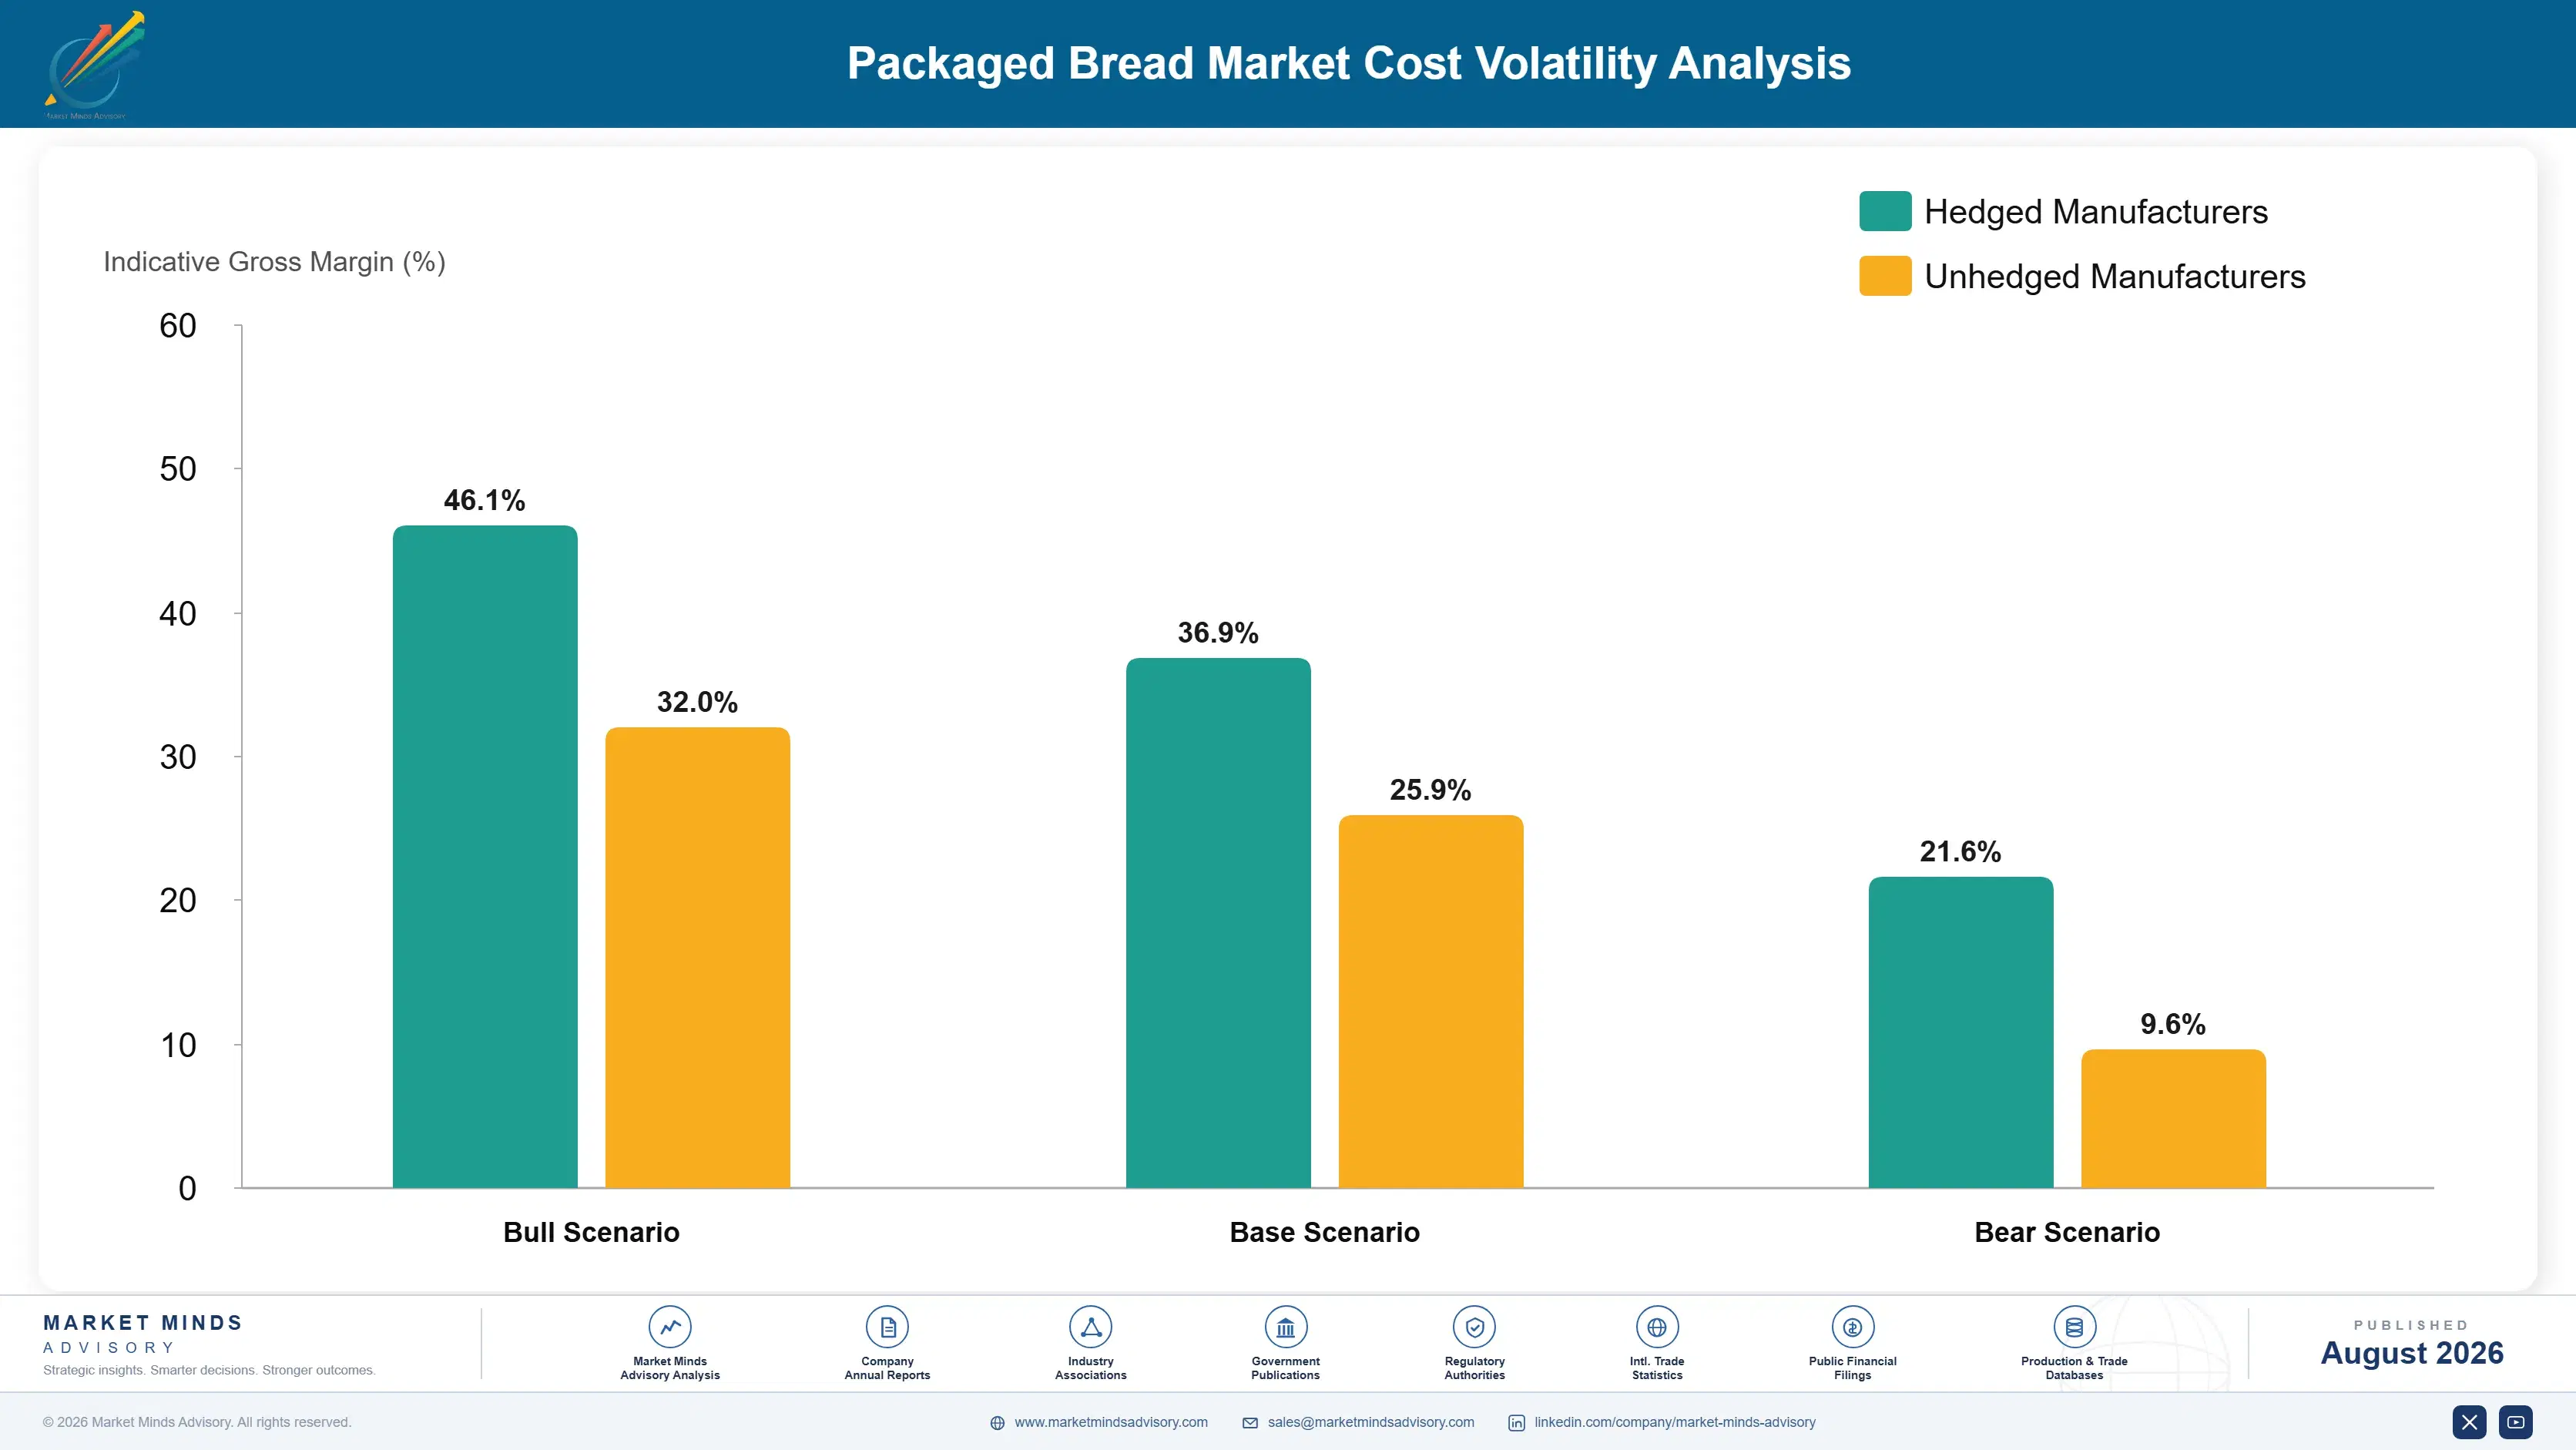
Milled wheat flour accounts for roughly 27% of cost of goods and moves with global wheat markets on a weekly basis. Packaging film and bags contribute 11%, energy for ovens and proving 9%, and labour a substantial 21% because bread production remains less automated at the finishing and packing stages than most food manufacturing. Distribution adds a further 16%.
The 2022 wheat episode compressed margins across every major market. Black Sea disruption pushed milling wheat to multi-year highs within months, and retail price negotiation cycles running two to three quarters meant bakers absorbed the movement before recovering it. Associated British Foods reporting for the period documented substantial input cost pressure across its bakery operations. Energy costs compounded it, since ovens are among the more gas-intensive assets in food manufacturing anywhere.

The competitive disadvantage mechanism runs through retail negotiation position rather than through purchasing. A baker supplying a few powerful grocery chains recovers cost movement slowly and only after formal negotiation, while one with foodservice and independent retail exposure moves faster. Own-label suppliers sit worst of all, since their contracts frequently fix pricing for a full year with no adjustment mechanism. That difference decides who survives a wheat spike.
packaged-bread-market-trends-cost-volatility-analysis-1787312526935

Match forward flour cover to price negotiation periods

Buying flour on a horizon disconnected from retail price agreement periods creates exposure that no view on wheat resolves. Bakers now align forward cover with negotiated pricing windows rather than with a market opinion, which removes the mismatch entirely at the cost of surrendering upside whenever wheat happens to fall through the covered period.

Automate finishing and packing lines further

Labour is 21% of cost of goods, well above most food categories, because slicing, bagging and tray loading remain partly manual across much of the industry. Automation at those stages costs roughly $6 million per line and removes four to six percentage points of labour cost, with payback inside four years in most developed market wage environments.

Recover oven exhaust heat into proving and water

Baking ovens run continuously and reject most of their exhaust heat to atmosphere while the same plant heats proving chambers and process water separately. Heat recovery costs around $1.5 million per oven line and cuts energy cost of goods by roughly three percentage points, with payback under four years at current European and North American gas pricing.

Portfolio Architecture for Margin Defence

Margin architecture tracks how quickly retailer own-label can copy a format. Standard white and wholemeal loaves run at gross margins in the mid teens, because the shopper knows the price, the retailer uses it as a value signal, and own-label matches it exactly. Protein and speciality formats earn roughly double.
The volume-versus-premium tension is unavoidable because ovens must run. Standard loaf volume is what loads a plant and justifies the delivery route, and a baker declining that work finds both plant and network underutilised. Premium formats cannot fill an oven on their own anywhere. Most bakers therefore run own-label alongside their own brands from identical lines, competing with themselves quite deliberately because the alternative is idle capacity and half-empty delivery vehicles.

Value concentrates where own-label has not yet arrived and where the shopper is not comparing prices. Newly launched protein and functional formats sit at the top for as long as that gap holds, typically thirty months. Gluten-free sits alongside on dedicated capacity logic that own-label finds expensive to replicate. Standard loaves sit at the other extreme, where the price is memorised, the product is identical and margin compresses toward flour cost plus conversion.

Volume / Commodity-Adjacent

Standard white and wholemeal loaves plus basic rolls sold on shelf price against identical retailer own-label alternatives. Shoppers know the price and retailers use it as a value signal. This volume exists to load ovens and justify the delivery routes that make everything else viable.
Gross Margin: 13-19%

Premium / Certified

Seeded, wholegrain, sourdough-style and flatbread formats alongside contracted foodservice buns and carriers. Formulation complexity and specification consistency support pricing until own-label follows. Range reflects the spread between retail speciality and contracted foodservice work.
Gross Margin: 20-30%

Sustainability / Regulatory / Next-Generation

High-protein and functional formats, gluten-free lines and clean label reformulated ranges. Innovation lead time before own-label arrives, and the dedicated capacity gluten-free requires, rather than any ingredient advantage, justify the pricing achieved here.
Gross Margin: 30-42%
packaged-bread-market-trends-portfolio-architecture-1787312527432

High-value Sub-segments and Strategic Watch-out

High-Protein And Functional

High value on genuinely high growth at 5.7%, and the clearest example anywhere of format innovation outrunning own-label copying. The margin window runs roughly thirty months before retailer versions appear, which makes a continuous innovation pipeline considerably more valuable than any single successful product launch.
Gross Margin: 32-42%

Gluten-Free Packaged Bread

Strong margins on solid underlying growth at 5.0% annually, protected by the dedicated production capacity that retailers find genuinely expensive to replicate under own-label economics. Demand runs far beyond clinical prevalence, because households avoiding gluten by preference rather than diagnosis dominate the buying population entirely.
Gross Margin: 30-40%

Standard Loaf Volume

The oven and route loading that makes everything else viable, earning gross margins in the mid teens against identical own-label product. Shoppers memorise the price and retailers signal value with it, so no commercial action available to a baker meaningfully improves that position at all.
Gross Margin: 13-19%

Clean Label Core Ranges

The strategic watch-out sitting squarely in this portfolio. Preservative removal does win the label positioning shoppers increasingly want, but it shortens shelf life and pushes unsold returns from around four percent toward seven, and the price premium available does not always cover that additional waste cost.
Gross Margin: 18-28%

How This Demand Actually Repeats

Bread is bought more often than almost anything else in a grocery basket, which makes demand recurring in a way few categories match. A household purchases weekly or more, the decision is habitual rather than considered, and a brand that holds the habit holds a genuinely predictable revenue stream against it.
Stickiness varies sharply by channel and format. Foodservice contracts are the tightest, running one to three years with specification and delivery reliability requirements that make switching a real project for the chain. Gluten-free households are close behind, since a format that works is not casually changed. Branded retail loyalty is moderate, holding through small price gaps and breaking at larger ones. Standard loaf purchasing is barely sticky at all, with shoppers switching on promotional price without noticing they have done so.

Buyer profiles have changed noticeably. Shelf decisions once sat with grocery category managers optimising space against rate of sale. They now frequently involve health, sustainability and own-label development functions asking about nutrition profiling, ingredient declarations and whether the format can be replicated under retailer brand. Bakers whose commercial approach still leads with rate of sale data find themselves briefing the people who will copy them within two years.
packaged-bread-market-trends-end-use-penetration-index-1787312527923

Where To Place Capital

These are among the four positions where our research anticipates prominent divergence between winners and laggards over the coming forecast period. Each is grounded in the demand model, the regulatory perimeter, and the announced capacity pipeline.
01 / INNOVATION PIPELINE CADENCE

Own-label copies you within thirty months

Retailer own-brand takes 38% of packaged volume and follows any successful format within eighteen to thirty months, so branded margin exists only in the gap before it arrives. A single successful protein or speciality launch buys roughly two years at shelf prices around 2.4 times standard loaf levels, then normalises. The capability genuinely worth funding is a continuous launch pipeline rather than occasional products, because the margin here comes from launch cadence rather than from any individual product ever does.
02 / PLANT NETWORK GEOGRAPHY

Delivery radius, not capacity, decides coverage

A nine-day shelf life caps economic delivery at roughly 320 kilometres from the plant, which means a plant network either covers a market properly or leaves gaps that competitors will fill permanently. Bakers with correctly spaced networks serve over 90% of addressable retail within radius, against around 60% for those whose sites reflect historical acquisitions. Fixing that map usually means closing plants sitting in overlapping territory and building where nothing currently sits, which is considerably harder politically than the underlying arithmetic would suggest.
03 / UNSOLD RETURN CONTROL

Waste is the largest controllable cost here

Unsold bread returned from retail runs between 4% and 7% of production, and it is charged almost entirely to the manufacturer under prevailing supply arrangements. Store-level demand forecasting combined with dynamic delivery quantities cuts that by roughly a third, worth two to three margin points outright and requiring no plant capital at all. The prize grows as clean label reformulation shortens shelf life, which makes this the one cost lever in the category that improves rather than erodes over time.
04 / FOODSERVICE CHANNEL WEIGHTING

Contracted buns beat promotional retail volume

Quick-service and fast-casual bun and carrier supply earns gross margins around six points above the retail equivalents, and the volumes are contracted rather than promotional, which improves plant loading predictability very considerably against promotional retail work. Winning that work requires specification consistency and delivery reliability rather than brand investment, which suits any baker unable to outspend the national brands on retail marketing. It also grows considerably faster than retail bread does across every single emerging market covered in this report.

Engagement Snapshot From the Field

A live engagement with an industry participant carrying material or product regulatory and market exposure ahead of a defining policy shift, showing how our research translates into a defensible multi-year portfolio strategy.
MARKET MINDS ADVISORY · CLIENT ENGAGEMENT SUMMARY
Packaged Bread Producer Strategic Portfolio Review and Transition Roadmap 2026·Investment Scenario on Packaged Bread Exposure Evaluation 2025-26
CLIENT PROFILE
A European packaged bread manufacturer with annual revenue near $640 million (client-reported, unverified by MMA), operating seven bakeries assembled through acquisition across three countries. Roughly 61% of volume was standard loaves and basic rolls, own-label accounted for 44% of production, and the plant network had never been reviewed against delivery radius since the acquisitions that created it.
STRATEGIC CHALLENGE
Gross margin had fallen four points across three years as discount retail expanded and own-label share rose, while unsold returns had drifted above six percent following preservative removal on several ranges. The board wanted to know whether to invest in premium format capability, rationalise the plant network, or attack waste, and had no basis for ranking the three.
MMA APPROACH
MMA mapped every bakery against its addressable retail within a 320 kilometre radius, quantified overlap and coverage gaps, modelled returns reduction from store-level forecasting, and sized the premium format opportunity against likely own-label response timing. Findings were tested against 47 expert interviews covering retailer own-label development practice, discount channel expansion and bakery distribution economics.
KEY FINDINGS
  1. Three bakeries served heavily overlapping territory while two significant retail regions sat outside any plant's economic radius entirely, having never been reviewed since acquisition.
  2. Unsold returns at 6.4% were roughly two points above achievable levels, worth an estimated $11 million annually (client-reported, unverified by MMA) with no plant capital required at all.
  3. Premium format investment would return well, but own-label response timing across the client's main retail customers averaged twenty-two months rather than the thirty assumed internally.
  4. Own-label contracts at 44% of production were loading the ovens the branded business depended upon, and reducing them would have worsened fixed cost recovery rather than improving mix.
CLIENT PROFILE
A European packaged bread manufacturer with annual revenue near $640 million (client-reported, unverified by MMA), operating seven bakeries assembled through acquisition across three countries. Roughly 61% of volume was standard loaves and basic rolls, own-label accounted for 44% of production, and the plant network had never been reviewed against delivery radius since the acquisitions that created it.
STRATEGIC CHALLENGE
Gross margin had fallen four points across three years as discount retail expanded and own-label share rose, while unsold returns had drifted above six percent following preservative removal on several ranges. The board wanted to know whether to invest in premium format capability, rationalise the plant network, or attack waste, and had no basis for ranking the three.
MMA APPROACH
MMA mapped every bakery against its addressable retail within a 320 kilometre radius, quantified overlap and coverage gaps, modelled returns reduction from store-level forecasting, and sized the premium format opportunity against likely own-label response timing. Findings were tested against 47 expert interviews covering retailer own-label development practice, discount channel expansion and bakery distribution economics.
KEY FINDINGS
  1. Three bakeries served heavily overlapping territory while two significant retail regions sat outside any plant's economic radius entirely, having never been reviewed since acquisition.
  2. Unsold returns at 6.4% were roughly two points above achievable levels, worth an estimated $11 million annually (client-reported, unverified by MMA) with no plant capital required at all.
  3. Premium format investment would return well, but own-label response timing across the client's main retail customers averaged twenty-two months rather than the thirty assumed internally.
  4. Own-label contracts at 44% of production were loading the ovens the branded business depended upon, and reducing them would have worsened fixed cost recovery rather than improving mix.
RECOMMENDED STRATEGY
Phase 1: Phase one: deploy store-level forecasting and dynamic delivery quantities across the whole network, since waste reduction requires no capital and returns immediately. Phase 2: Phase two: close one overlapping bakery and build in the largest uncovered retail region, correcting a network map that acquisition history rather than geography had created. Phase 3: Phase three: fund premium format development on a continuous cadence, planning around twenty-two months of margin rather than the thirty previously assumed.
OUTCOME
The client cut unsold returns to 4.3% within eleven months and approved the network change the following quarter, reporting margin recovery of roughly three points (client-reported, unverified by MMA). Own-label volume was deliberately retained for oven loading, and premium format launches moved onto a rolling rather than an occasional schedule.

Frequently Asked Questions

Foundational context covering the market sizes, CAGR, scope, country, region and competition that inform every finding below. This section is provided to cover basics and most often pre-purchase conversations, answered from the MMA Primary Research Dataset.

What is the current size of the Packaged Bread Market?

The market was worth $195.0 billion in 2025 and is forecast to reach $202.41 billion in 2026. This covers industrially produced pre-packaged bread rather than in-store or scratch bakery.

How large will the Packaged Bread Market be by 2036?

MMA forecasts $293.92 billion by 2036, an expansion multiple of 1.45 times the 2026 base. That represents $91.51 billion of incremental value across the forecast period.

What is the CAGR for the Packaged Bread Market 2026 to 2036?

The base case compound annual growth rate is 3.8%, with a bull case of 5.0% and a bear case of 2.6%. Historical growth from 2020 to 2025 ran at 3.1%.

Which segment is growing fastest?

High-protein and functional bread at 5.7%, a full 1.50 times the market rate. Nutrition panel shoppers rather than any change in bread consumption drive that growth.

Who are the major companies in the Packaged Bread Market?

Grupo Bimbo, Yamazaki Baking, Flowers Foods, Aryzta and Warburtons lead, holding 21% of revenue between them. Fifteen further manufacturers hold meaningful regional or format positions.

Which country is growing fastest?

India at 7.2%, as organised retail, cold chain and quick commerce convert volume from neighbourhood bakeries. That conversion adds genuine volume rather than mix improvement.

Report Segmentation Architecture

The full report scope spans multiple orthogonal segmentation dimensions, with cross-tabulated demand data provided for each dimension pair. Coverage extends further to regional breakdowns, trend trajectories, and the competitive detail needed to support segment-level decision-making.

By Bread Product Type

  • High-Protein and Functional Bread
  • Gluten-Free Packaged Bread
  • Flatbreads, Wraps and Pita
  • Wholegrain and Multigrain Loaves
  • Buns, Rolls and Sandwich Carriers
  • Standard White Loaves

By End-Use Industry

  • Grocery and Supermarket Retail
  • Discount and Hard Discount Retail
  • Convenience and Forecourt Retail
  • Quick-Service and Fast-Casual Restaurants
  • Contract Catering and Institutional Foodservice
  • Online Grocery and Quick Commerce

By Commercial Dimension

  • Branded Manufacturer Supply
  • Retailer Own-Label Contract Manufacture
  • Direct Store Delivery Distribution
  • Warehouse-Delivered Grocery Supply
  • Foodservice Contract Supply

By Region

  • North America
  • Western Europe
  • East Asia
  • South Asia and Pacific
  • Latin America
  • Middle East and Africa
  • Eastern Europe

Scope, Methodology, and Coverage

Every figure in this report is reproducible from documented input assumptions. The scope below maps the historical period, the forecast horizon, the segmentation dimensions, and the countries covered, alongside the underlying primary and qualitative methodology.
Historical Period
2020 to 2025
Forecast Period
2026 to 2036
Base Year
2025 (USD billions; MMA Primary Research Dataset, August 2026)
Market Definition
This report covers industrially produced pre-packaged bread sold through retail and foodservice channels, spanning standard white and wholegrain loaves, buns, rolls and sandwich carriers, flatbreads, wraps and pita, gluten-free formats and high-protein or functional breads. Coverage includes both branded manufacturer supply and retailer own-label contract manufacture. In-store bakery and scratch-baked product sold unwrapped, frozen unbaked dough and par-baked bread sold for finishing, sweet bakery including cakes, pastries and doughnuts, crispbread and crackers, and breakfast cereals are excluded from scope.
Quantitative Units
USD billions at retail and foodservice value; volume in million tonnes and unit counts; gross margin percentages by portfolio tier.
Segmentation Dimensions
Bread product type, end-use channel, commercial dimension, region.
Regions Covered
North America, Western Europe, East Asia, South Asia and Pacific, Latin America, Middle East and Africa, Eastern Europe
Countries Covered
Japan, China, South Korea, India, Indonesia, Vietnam, Australia, United States, Canada, Mexico, United Kingdom, Germany, France, Spain, Italy, Brazil, Poland, Turkey, Egypt, South Africa.
Key Companies Profiled
Grupo Bimbo, Yamazaki Baking, Flowers Foods, Aryzta, Warburtons, Associated British Foods, Britannia Industries, SPC Samlip, Lantmannen Unibake, Grupo Nutresa, and ten further manufacturers.
Quantitative Methodology
Primary survey, n=3,800 respondents, Q4 2025, six countries; demand-side model with trade association cross-validation
Qualitative Methodology
47 expert interviews, Q4 2025; applied to validate demand model assumptions, identify emerging dynamics, and assess competitive positioning
Report Format
PDF and XLSX data workbook (Word format preview document)
Publisher
Market Minds Advisory
Report Code
MMA-2026-AGR-788
Published
August 2026
Contact
sales@marketmindsadvisory.com | www.marketmindsadvisory.com

Purchase the full Packaged Bread Market Report (2026 to 2036).

The full report sets out ten-year forecasts for packaged bread by product type, retail and foodservice channel and commercial model across seven regions. It quantifies own-label response timing by format and market, showing how long branded innovation margin actually lasts. Competitive assessment covers twenty manufacturers on a consistent revenue basis, mapping plant network geography against addressable retail within delivery radius. Unsold return rates are benchmarked by channel and format, isolating the largest controllable cost in the category. Findings draw on a quantitative survey of 3,800 respondents across six countries and 47 expert interviews conducted during the fourth quarter of 2025.
Ten-year forecasts by bread product type and region
Own-label response timing quantified by format and market
Plant networks mapped against addressable retail radius
Twenty-manufacturer assessment on consistent revenue basis
Unsold return rates benchmarked by channel and format
Margin architecture across three commercial portfolio tiers

Built For The People Who Decide

From boardroom strategy to bench-side execution, this report is read cover-to-cover by leaders shaping the next decade of their industry, turning demand scenarios, market dynamics and valuation benchmarks into decisions.
CXOs/ Presidents/ VPs/ Managers
M&A and Corporate Development
Strategy Teams and R&D Heads
Procurement and Product Directors
Regulatory and Compliance Leaders
Investor Relations and Equity Analysts