Market Minds Advisory
Pack Conveyors Market

Pack Conveyors Market: Sold by the Metre, Bought for Uptime Nobody Quotes

The conveyor is never the bottleneck and always decides whether the line runs. Buffering designed properly holds a line above ninety percent; without it every downstream stoppage reaches the filler.

Lead Analyst

Bilal Shaikh

Published

September 2026

Make Smarter Decisions with Customized Research Insights

Request a free sample report and evaluate market opportunities, growth trends, and competitive dynamics relevant to your business needs.

2025 MARKET VALUE$3.2BMarket Size 2025
2036 FORECAST VALUE$6.0BBase Case , 2026 to 2036
CAGR 2026 TO 20365.8 %Bull 7.0% / Bear 4.6%
INCREMENTAL OPPORTUNITY$2.6BNet 10- year value creation
EXPANSION MULTIPLE1.76x2036 value over 2026 base
Strategic Levers
M&A Pipeline
Regional Outlook
Country Rankings
Competitive Intelligence
Segmental Deep-dive
Call-Us : 91 93563 13602

Executive Snapshot and Market Trajectory

Nobody buys a conveyor to move product from one machine to the next. They buy the difference between a line running at 91% and the same line running at 67%, and that difference is buffering, which appears nowhere on a quotation priced by the metre.
Growth comes from line efficiency and hygiene rather than from more packaging lines. Zero-pressure accumulation systems grow fastest at 8.7%, exactly 1.50 times the market rate, because buffering is the only part of the transport system that changes what the filler achieves. Spiral and vertical transfer follows at 7.5% as halls run out of floor. East Asia holds the largest share on the strength of Chinese beverage, dairy, and prepared food line investment.
Concentration reaches only 26% across the top five measured on annual conveyor and belting revenue into packaging, split between belting specialists and regional system integrators who rarely overlap. Air conveying for empty containers consumes 23% of packaging hall electricity, the largest single energy line in most plants and one nobody examines. Blowers typically run flat out whether the line is full, and almost nobody has metered them.
Market Definition
This market covers conveying systems used within packaging halls to transport containers, packs, and cases between filling, labelling, and end-of-line equipment, spanning modular plastic belt, tabletop chain, air conveying, zero-pressure accumulation, spiral and vertical transfer, and laning and combining systems. Scope includes belting, chain, and wear component aftermarket. Bulk material handling conveyors, warehouse and distribution centre conveying, filling and packaging machinery, palletisers, and robotics are excluded.
Base Year Value
$3.2B in 2025 (MMA Primary Research Dataset, August 2026)
Forecast Period
2026 to 2036, eleven discrete annual values
CAGR
5.8% base case. Bull 7.0%. Bear 4.6%.
Fastest Growth Segment
Zero-Pressure Accumulation Systems: 8.7% CAGR
Fastest Growth Country
India: 9.6% CAGR
Fastest Growth Region
South Asia and Pacific: 7.9% CAGR
Largest Region
East Asia: 28% of 2025 global value
Market Leaders
Intralox. Regal Rexnord. Ammeraal Beltech. FlexLink. Habasit. Source: MMA Analysis based on company annual reports.
Primary Survey
n=3,800 procurement and R&D decision-makers, Q4 2025, six countries
Methodology
Demand-side build-up, cross-validated against public data, 47 expert interviews

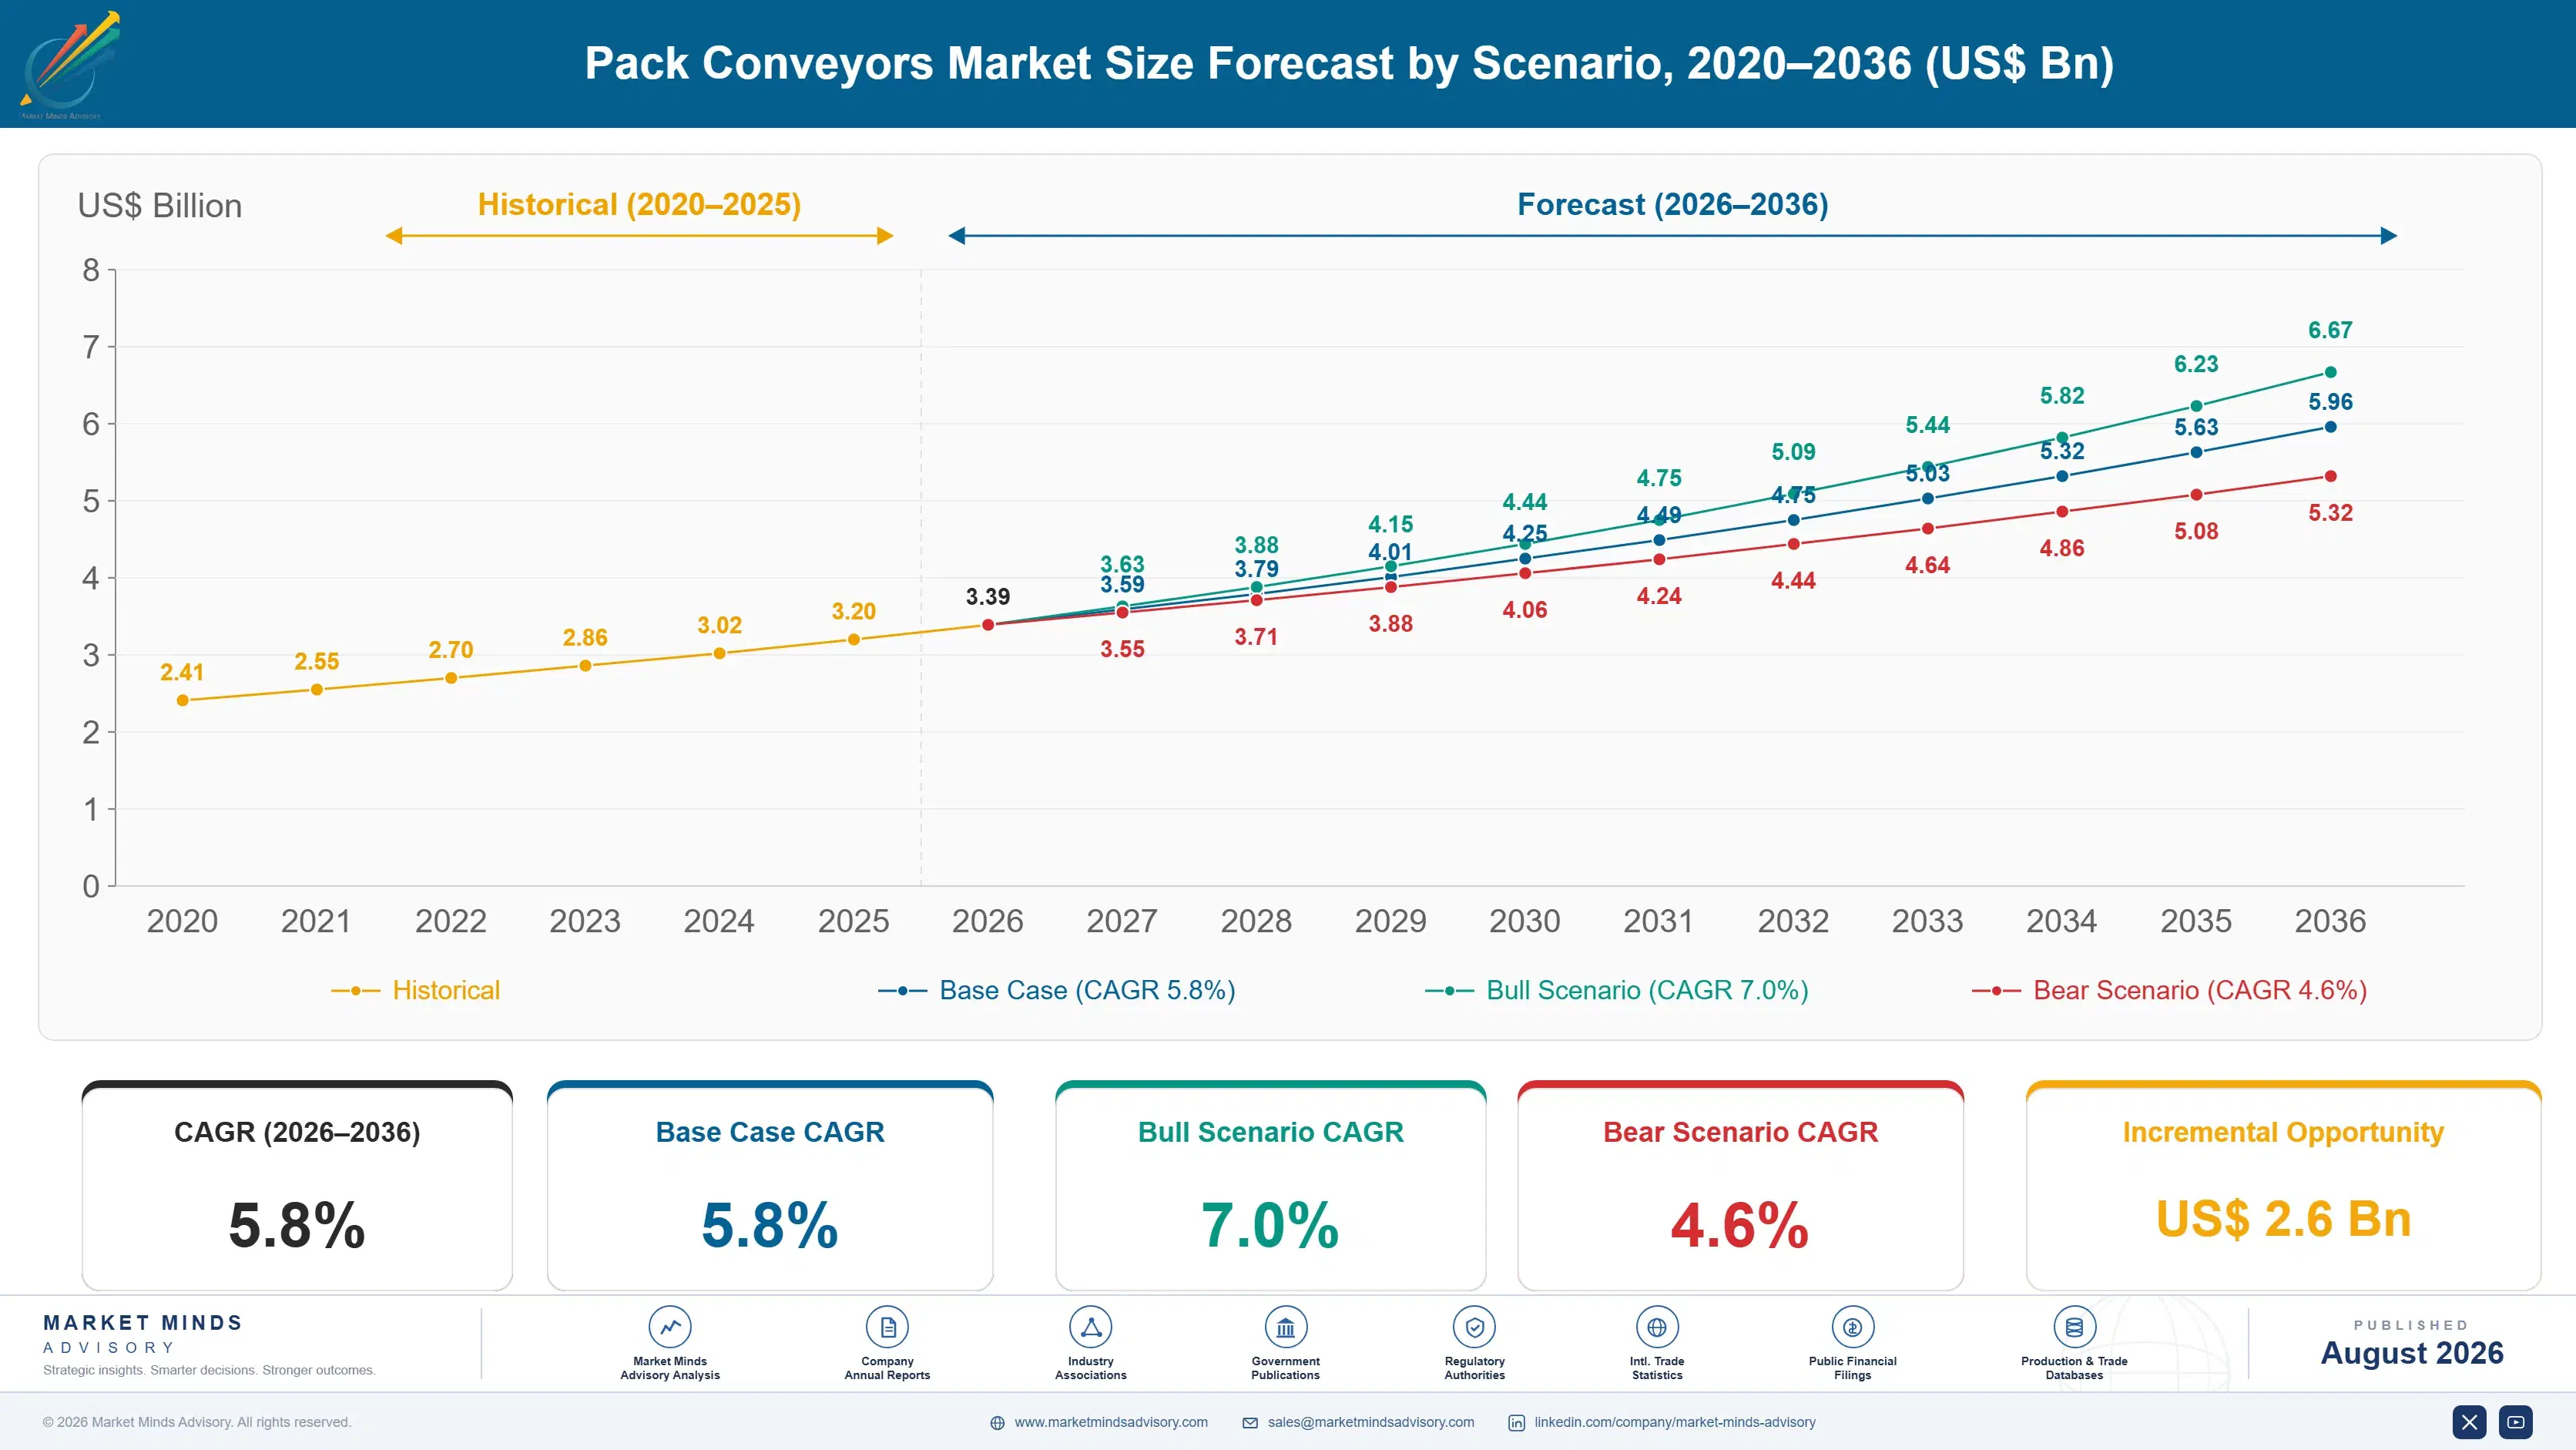
Pack Conveyors Market Forecast Scenarios

pack-conveyors-market-size-forecast-scenario-1787299416572
The 2020 to 2025 period followed food and beverage capital spending rather than anything specific to conveying. Line investment paused through 2020 and 2021, then accelerated hard from 2022 as producers added capacity and reshored some production. Labour scarcity across packaging halls pushed automation harder than any technology argument had managed. A 4.6% historical rate averages a frozen capital cycle against a catch-up that has now largely worked through.
Three mechanisms carry the 5.8% base case. Line efficiency investment is the largest, as producers running near capacity find that buffering delivers more output than new machinery does. Hygienic conversion is the second, moving meat, dairy, and prepared food lines away from lubricated chain toward cleanable open-frame construction. And Asian and Indian consumer goods capacity is the third, where complete new lines are being commissioned rather than existing ones upgraded.
The 7.0% bull case rests on energy cost pressure forcing systematic review of air conveying, which consumes 23% of packaging hall electricity and has almost never been optimised. The 4.6% bear case is food and beverage capital spending tightening across mature markets, since conveyor demand tracks line commissioning and no efficiency argument creates an unfunded project.

Where Line Uptime Actually Comes From

A packaging line is a chain of machines whose speeds never match, and the conveyor between them either absorbs that mismatch or transmits it. With designed accumulation, a downstream case packer stopping for forty seconds costs nothing because the buffer holds product and the filler keeps running. Without it, the filler stops too, and the filler is the machine worth millions. That single difference separates 91% line efficiency from 67%.
TOP FIVE CONCENTRATION26%Fragmented between belting suppliers and regional system integrators
EFFICIENCY WITH ACCUMULATION91%Overall equipment effectiveness where buffering is designed properly
EFFICIENCY WITHOUT ACCUMULATION67%Achieved where every downstream stoppage reaches the filler
AIR CONVEYOR ENERGY SHARE23%Blower power as a proportion of packaging hall electricity
WET LUBRICATION WATER USE4.1 litresConsumed per hundred metres of chain conveyor each hour
TYPICAL SYSTEM LIFE22 yearsBefore replacement rather than refurbishment of the transport system
The problem is that buffering is invisible on a quotation. Procurement compares two proposals in metres of conveyor at a price per metre, picks the cheaper one, and loses twenty-four points of efficiency on equipment that cost twenty times the saving. Conveyor suppliers rarely present it any other way, which makes them complicit in a comparison that damages them as much as the customer.
Two forces shape the next decade. Air conveying for empty containers consumes 23% of packaging hall electricity because light containers cannot be pushed on a belt and must be floated on air. And wet chain lubrication is being removed on water, hygiene, and slip safety grounds simultaneously. Neither force appears anywhere on a conveyor quotation, which is precisely the problem.
"We have walked plants where the packaging hall's biggest electrical load is a bank of blowers pushing empty bottles down a duct, running flat out whether the line is full or empty. Nobody metered it. Nobody had ever metered it. The energy manager was busy replacing light fittings in the car park."
Director. Packaging Line Systems and Automation Practice · MMA Industrial Equipm

Market Trends

Accumulation Design Becomes The Argument Rather Than Belt Price

Producers running near capacity have worked out that they can buy output two ways: another machine, or buffering that lets existing machines run more of the time. The second is far cheaper. A line with properly designed zero-pressure accumulation holds around 91% overall equipment effectiveness against roughly 67% where every stoppage propagates back to the filler. That gap is worth more annually than the entire conveyor system costs. Suppliers who quantify it in proposals win work that competitors quoting metres of conveyor at lower prices continue to lose. Buying output through buffering is far cheaper than machinery.
Market Impact: Payback shortens to 18 months
Wet Chain Lubrication Is Being Removed Across Three Arguments

Lubricated steel chain consumes around 4.1 litres of water per hundred metres each hour, creates a permanently wet floor that is the leading slip hazard in packaging halls, and sustains a microbial load in drains that hygiene auditors increasingly refuse to accept. Dry lubrication and lube-free modular belt remove all three at once. Water reduction targets, occupational safety rules, and food hygiene audits are pushing the same conversion from different directions, which is unusual and makes the business case straightforward to assemble. Three separate functions want the same conversion for different reasons.
Market Impact: India grows at 9.6% annually

Market Opportunities and Growth Drivers

Labour Scarcity Forces Automation Of Manual Transfer Points

Packaging halls have struggled to staff manual transfer, laning, and case handling positions across most developed markets, and wage inflation in those roles has run well ahead of general inflation. Conveying and automated laning remove those positions permanently rather than making them more efficient. That argument reaches operations directors far more directly than any efficiency calculation does, because they are the people who cannot fill the shifts. Payback is being calculated against unfilled vacancies rather than against wage cost, which shortens it considerably. Wage inflation in those roles outran general inflation badly.
Market Impact: Costs 24 points of line efficiency

Indian Consumer Goods Capacity Is Commissioned Rather Than Upgraded

Indian food, beverage, personal care, and pharmaceutical producers are building new packaging lines rather than debottlenecking existing ones, which means complete conveying systems specified from scratch rather than incremental additions. India contributes the fastest national growth rate in this forecast at 9.6%. New lines also specify hygienic and lube-free construction from the outset, since there is no installed base to retrofit. Domestic and Chinese conveyor suppliers take most of this work on price, though multinational producers building in India specify European systems. Multinational producers building locally still specify European systems, which splits the supply base sharply.
Market Impact: Consumes 23% of hall electricity

Market Restraints and Challenges

Buffering Value Is Invisible In A Metre-Based Comparison

Conveyor proposals are compared on length and price per metre, which describes neither accumulation capacity nor the line efficiency it produces. The root cause is that procurement needs a comparable unit and metres are the only one both quotations share. Commercial impact runs both ways: customers lose twenty-four points of efficiency and suppliers lose work they should have won. Suppliers are responding with line simulation modelling, efficiency guarantees written into contracts, and proposals structured around output rather than around installed length. Suppliers are as harmed by this comparison as customers, and few of them contest it.
Market Impact: Lifts efficiency from 67% to 91%

Air Conveying Energy Is Large And Almost Never Measured

Empty containers below a certain weight cannot be pushed along a belt without toppling, so they hang by the neck ring and travel on air from banks of blowers. Those blowers consume around 23% of packaging hall electricity and typically run at constant output whether the line is full or idle. The root cause is that air conveyors were designed before variable speed drives were cheap and have rarely been revisited. Mitigation runs through demand-controlled blowers, zoned air delivery, duct sealing, and pressure optimisation against actual container weight. Variable speed drives were expensive when these were designed.
Market Impact: Removes 4.1 litres hourly
2 additional market trends, 4 additional growth drivers, and 3 additional restraints and challenges are covered in the full report. Contact sales@marketmindsadvisory.com to access the complete intelligence.

Segment CAGR and Growth Architecture

Segmentation here follows the conveying system type, because each type handles different container weights and geometries, carries entirely different energy and hygiene characteristics, and is specified by a different part of the line design altogether. End-use industry and container format both cut across every type rather than separating them out, so neither works here.
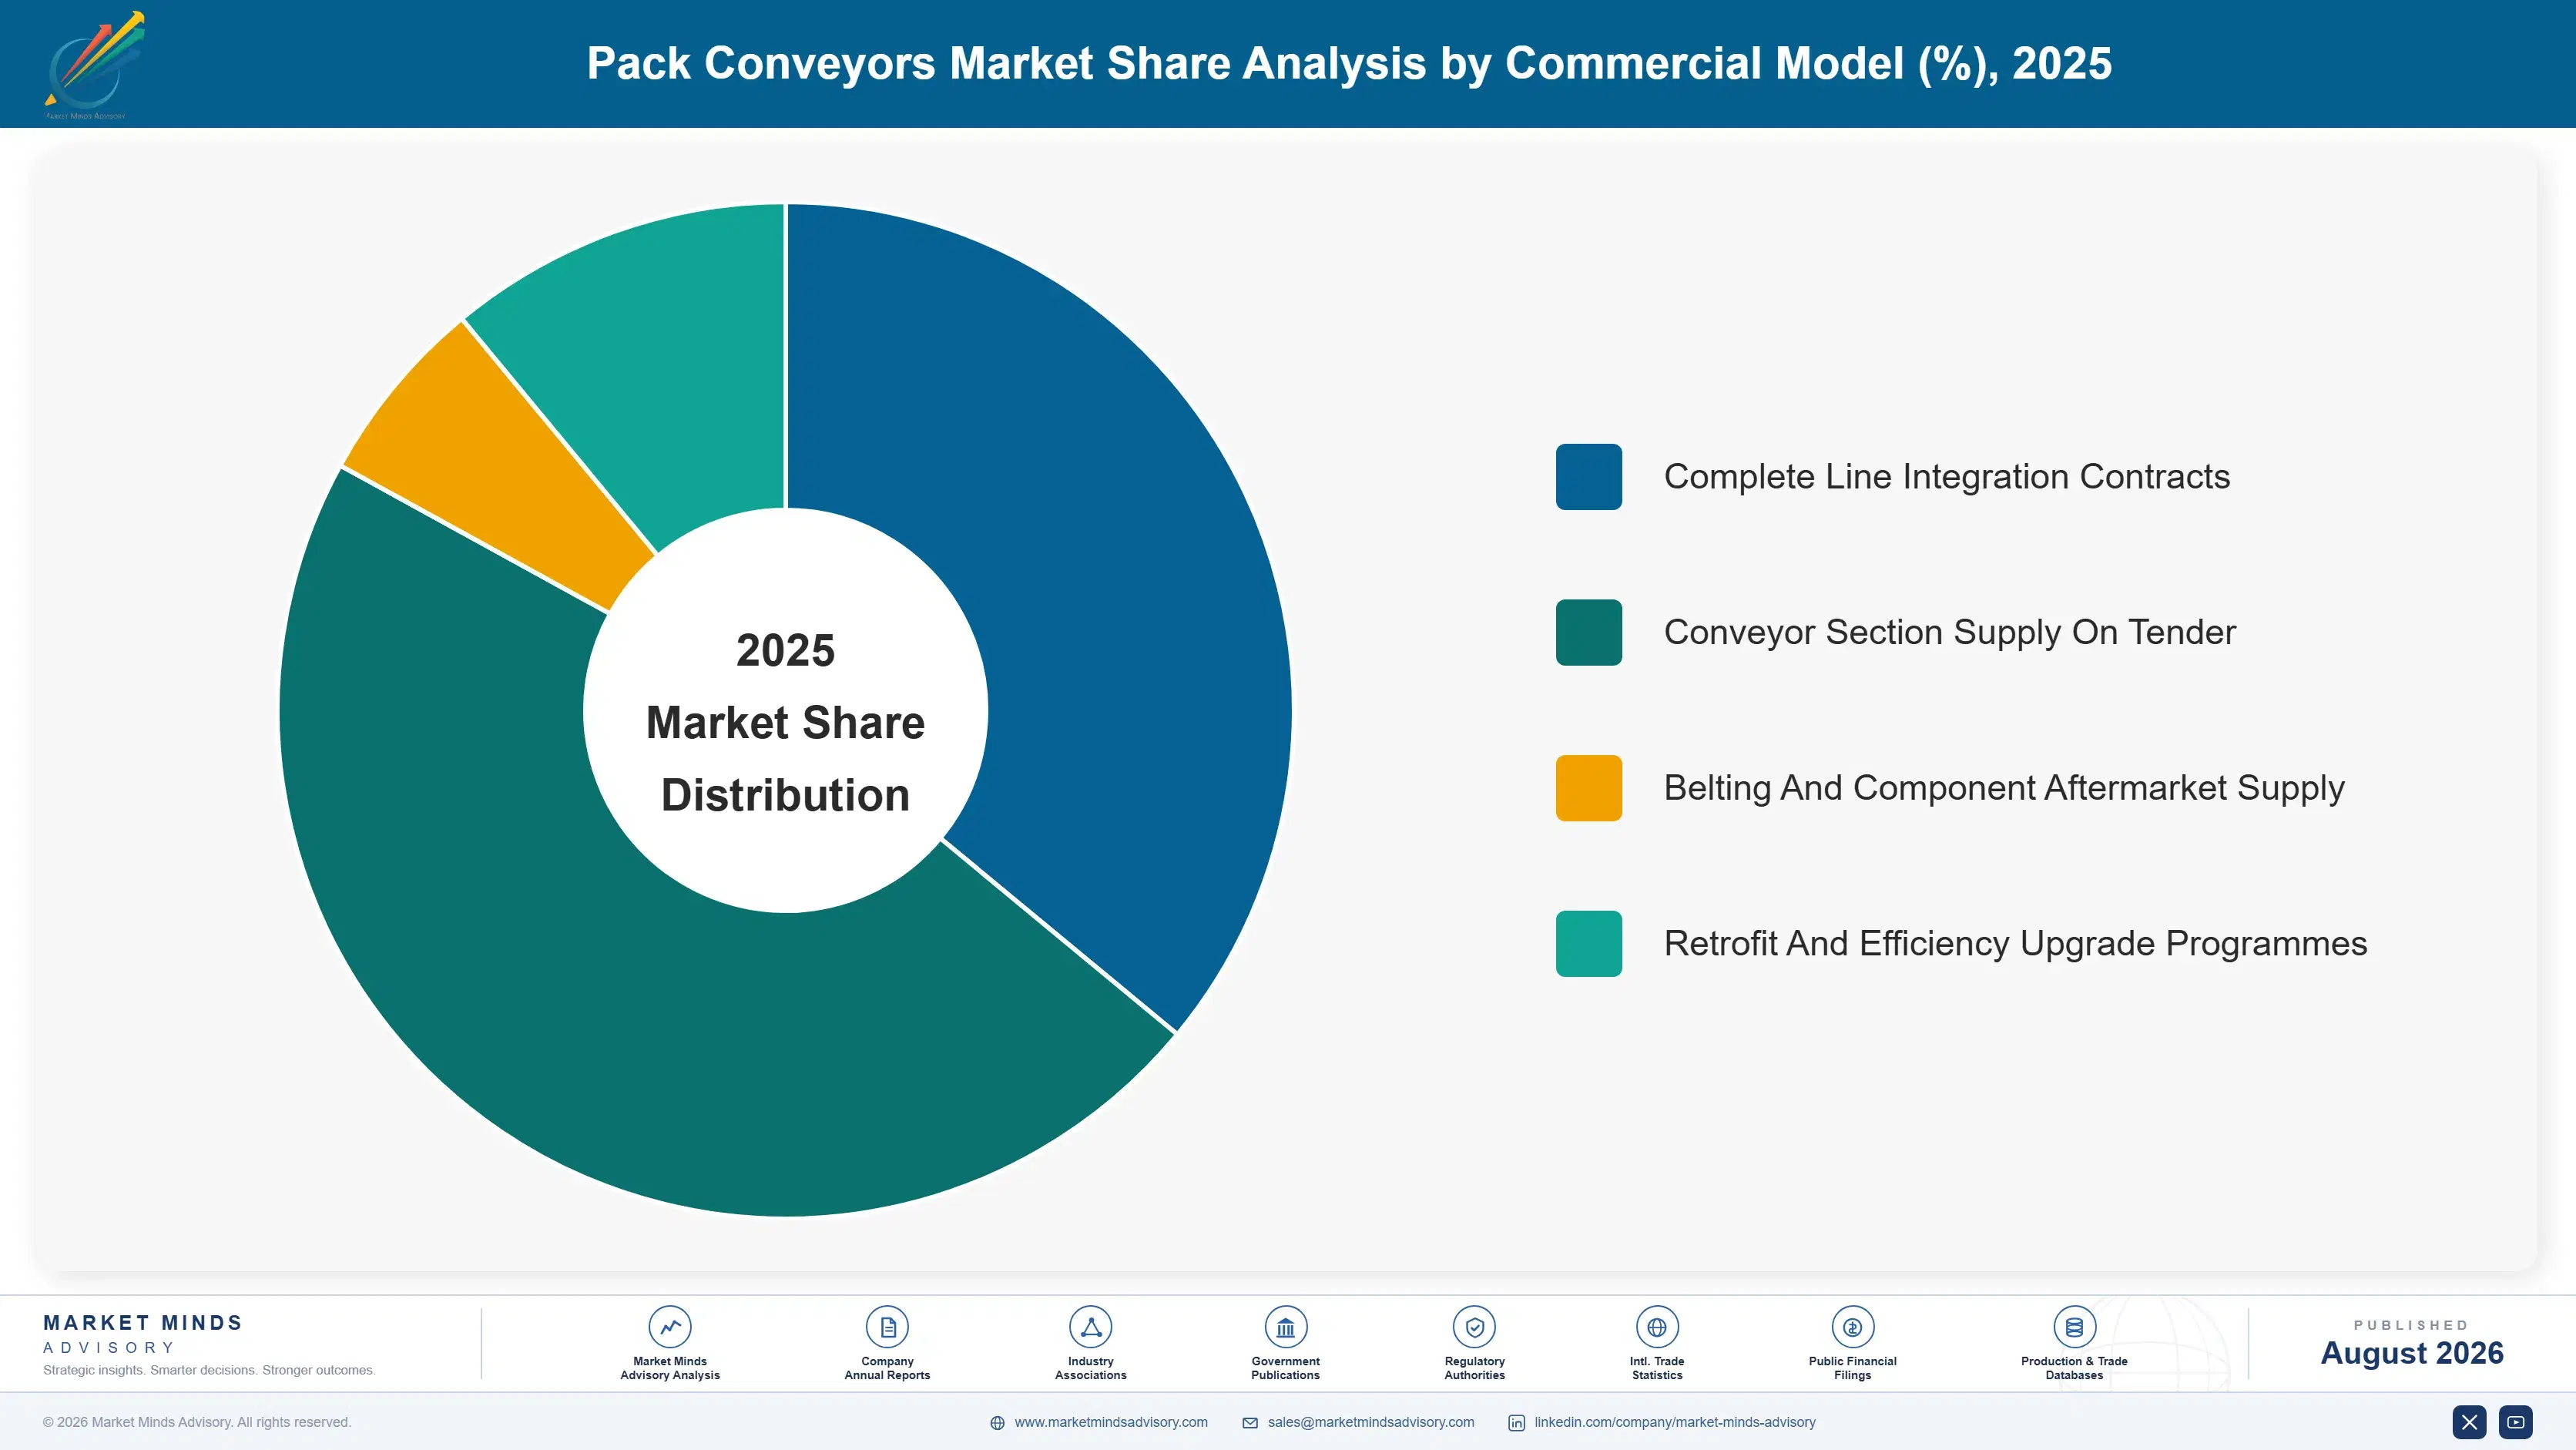
pack-conveyors-market-market-share-analysis-1787299417101

Zero-Pressure Accumulation Systems

The fastest system type at 8.7%, exactly 1.50 times the market rate, and the only part of a conveying installation that changes what the rest of the line achieves. Zero-pressure accumulation holds product in discrete zones without back pressure, so containers do not crush, jam, or mark against each other while waiting, and the upstream machine keeps running through a downstream stoppage. That is worth roughly twenty-four points of line efficiency on a typical installation. Controls complexity is higher than plain transport and commissioning takes longer. The commercial obstacle is not technical at all: buyers comparing quotations by the metre cannot see what they are declining to purchase. Commissioning takes longer than plain transport sections do.
CAGR 8.7%

Spiral And Vertical Transfer Conveyors

Second fastest at 7.5%, growing because packaging halls are running out of floor rather than because vertical transport got better. Spiral conveyors move product between levels in a fixed footprint, which lets a producer add capacity or route around existing equipment without extending the building. They also serve as accumulation in their own right, since a spiral holds substantial product volume in transit. Hygiene is the technical challenge, as the curved geometry and support structure are harder to clean than straight runs. Retrofit into existing halls is where most demand sits, and that work is considerably more difficult to engineer than a new line. Packaging halls are running out of floor rather than ceiling.
CAGR 7.5%
Full segment breakdown across 6 segments available in the complete report.

Regional Architecture and Country Demand Map

Demand tracks packaging line commissioning rather than consumption of packaged goods, which puts it wherever capacity is being added. All seven regions fall inside their framework bands here, though growth rates diverge sharply between new build and retrofit markets. New build and retrofit markets behave completely differently.

East Asia

Twenty-eight percent, the largest pool, and Chinese beverage, dairy, and prepared food line investment carries most of it. Chinese producers commission complete lines rather than upgrading, and domestic conveyor builders supply the majority at prices European suppliers cannot approach on straightforward transport sections. Accumulation and controls work still goes to international suppliers more often, since that capability took longer to develop locally. Japanese and Korean demand is smaller and unusually exacting on hygiene and on noise. Growth at 6.8% runs above the global rate on continuing capacity addition across food and beverage categories. Complete lines get commissioned rather than incrementally upgraded, which favours suppliers who can deliver everything, Accumulation and controls work still goes to international suppliers.
Share: 28% | CAGR: 6.8% (2026 to 2036)

South Asia and Pacific

Twelve percent, at the top of its band, and India contributes the fastest national growth rate in this forecast at 9.6%. Indian food, beverage, personal care, and pharmaceutical producers are building new packaging lines rather than debottlenecking existing ones, which means complete conveying systems specified from scratch. New lines specify hygienic and lube-free construction from the outset because there is no installed base to retrofit. Southeast Asian food processing adds steadily. Growth at 7.9% is the highest of any region, driven by line commissioning rather than by any efficiency retrofit activity. Southeast Asian food processing capacity adds steadily alongside, across Vietnam. Thailand, and Indonesia, There is no installed base pulling specifications backwards here.
Share: 12% | CAGR: 7.9% (2026 to 2036)
Regional intelligence for 5 additional markets available in the complete report: North America, Western Europe, Latin America, Eastern Europe, Middle East and Africa. Contact sales@marketmindsadvisory.com.
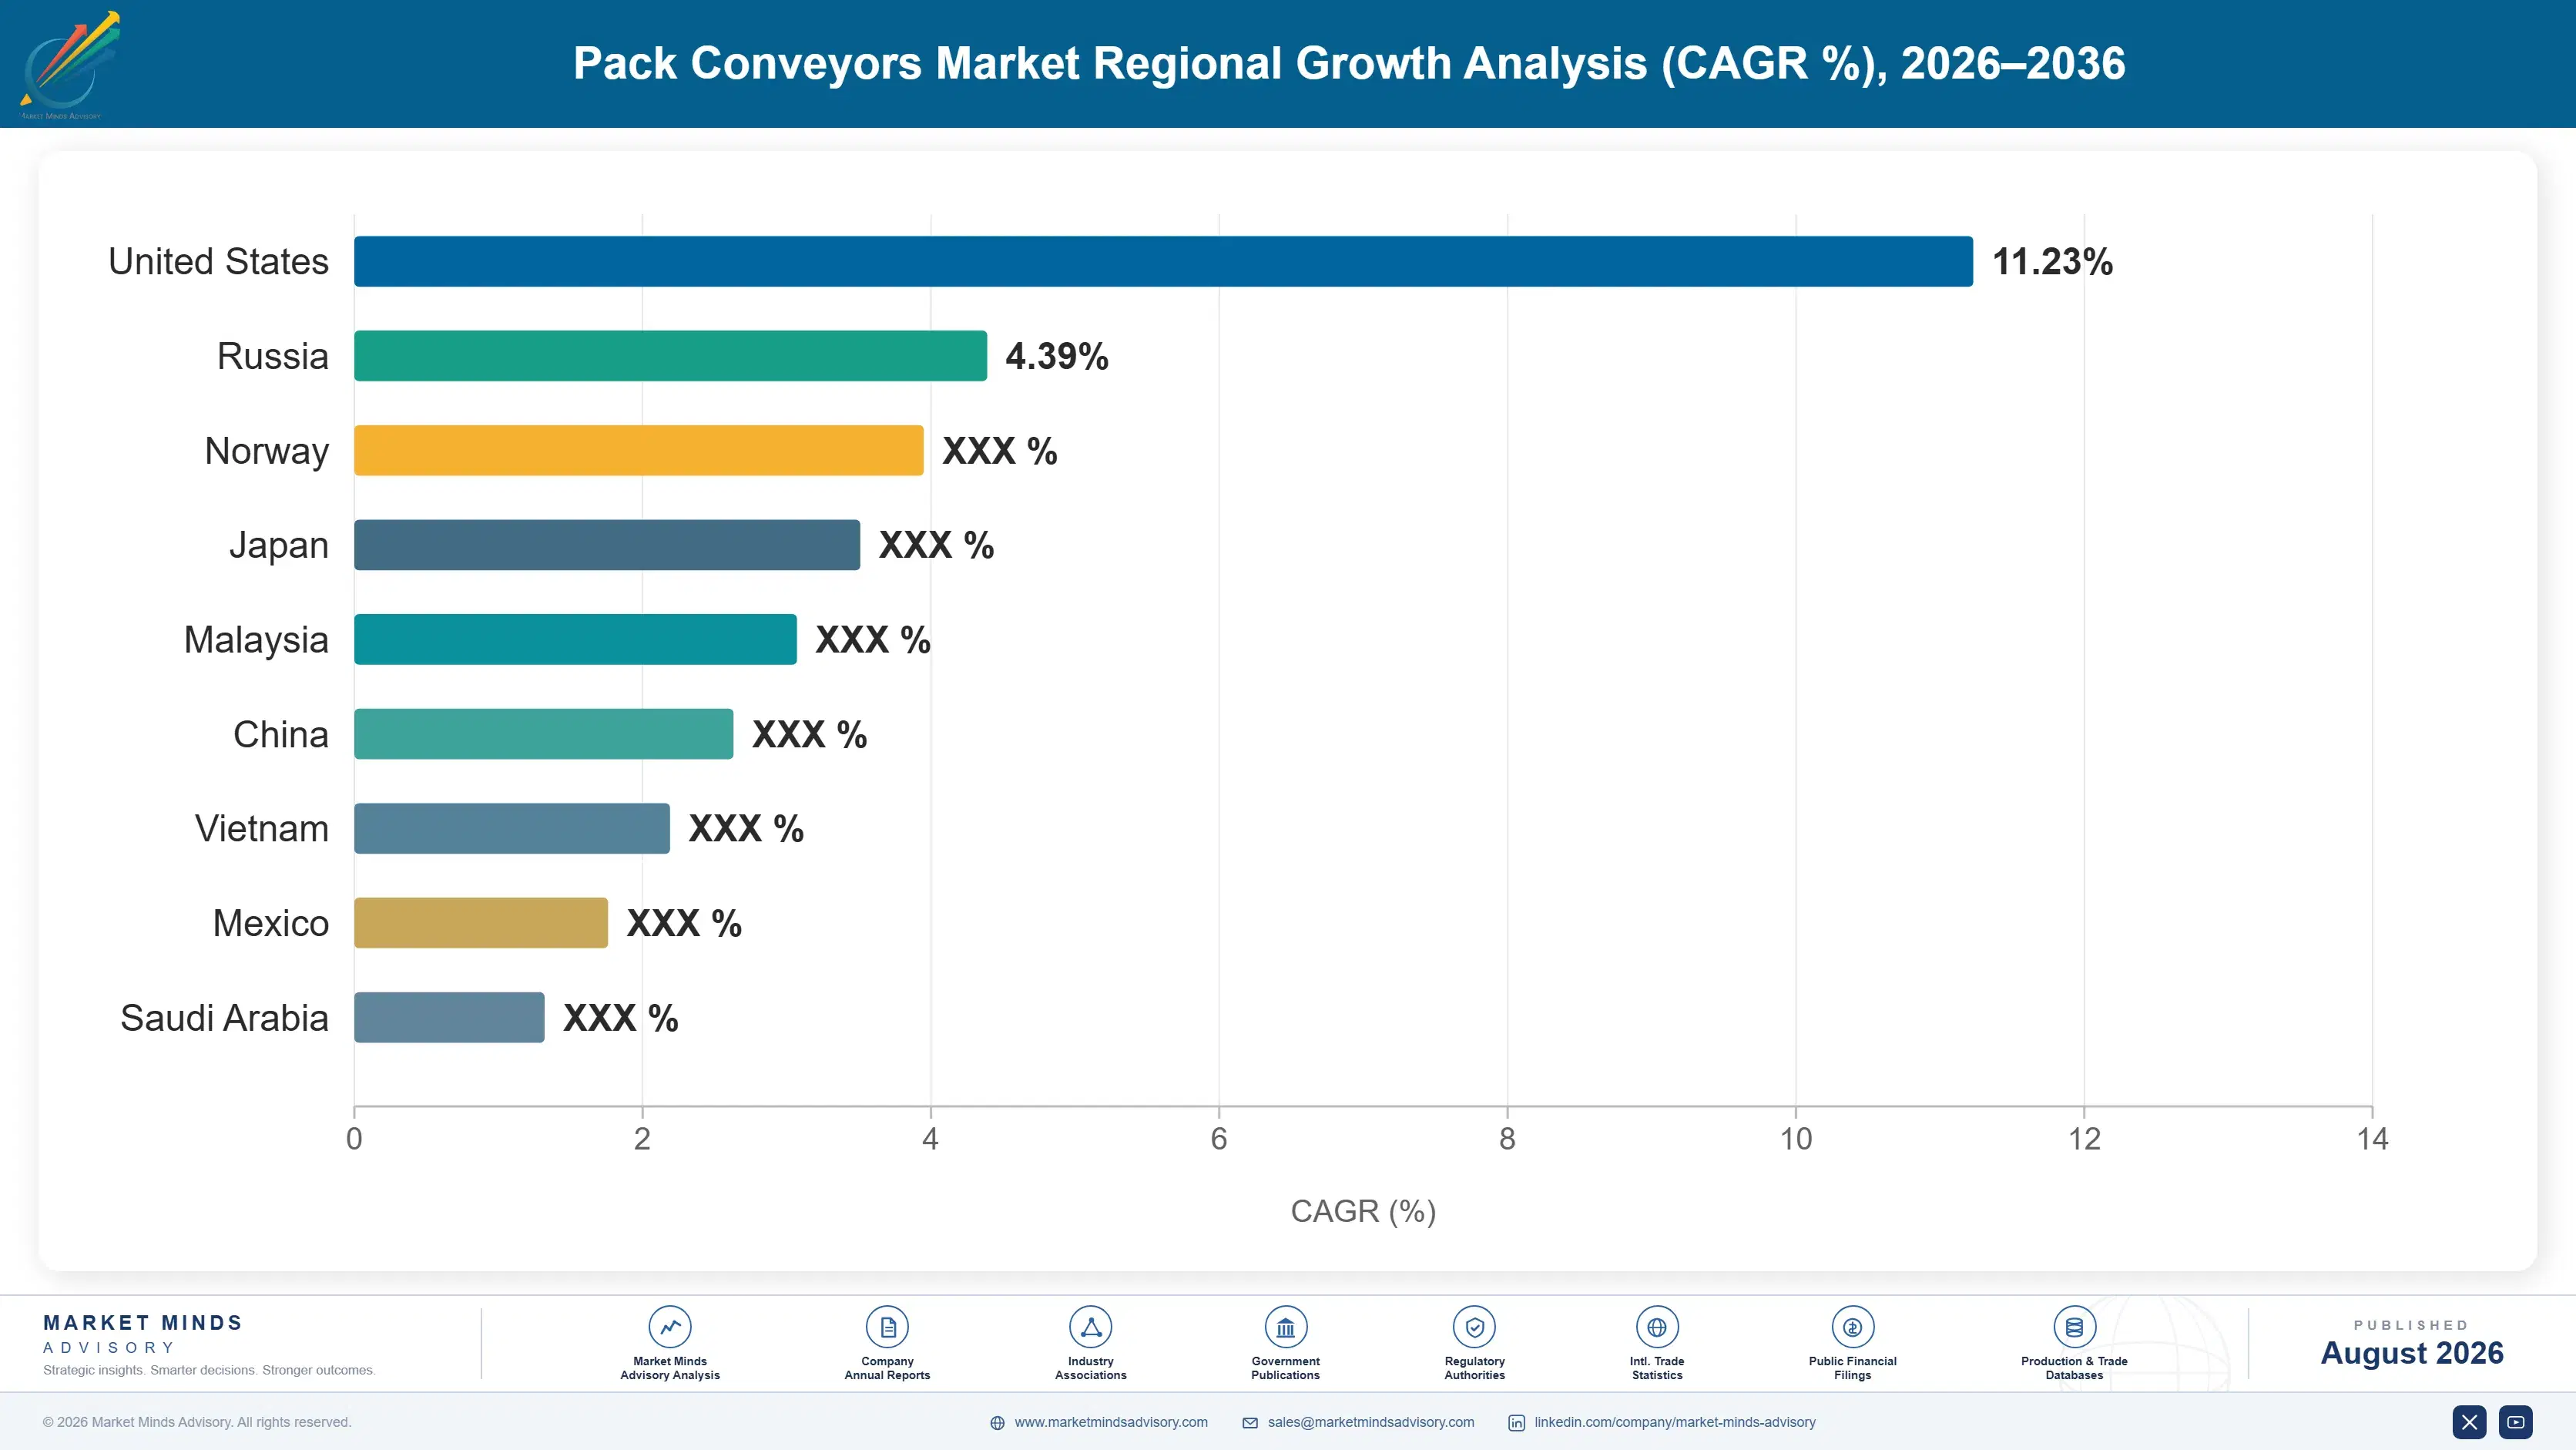
pack-conveyors-market-country-cagr-analysis-1787299417611

Four Ways to Sell More Than Metres

Belting and chain are commodity components available from several suppliers at similar prices, so nobody wins on material. Value comes from quantifying accumulation, converting wet lubrication, metering air conveying energy, and holding the belting aftermarket across a twenty-two year system life. Four levers follow, and the first is about what you present, rather than about what you build.

Quantify Accumulation Value In Every Proposal Submitted

A line with designed buffering runs at around 91% efficiency against 67% without it, and on a filler worth several million dollars those twenty-four points are worth more annually than the whole conveying system costs. Line simulation modelling costs roughly 400,000 dollars to establish as a capability and converts a metre-price comparison into an output discussion. Suppliers who present it consistently win against lower-priced competitors, and those who do not are participating in a comparison that harms them as much as it harms the customer. The comparison harms supplier and customer equally.
Market Impact: Recovers up to 24 points of line efficiency

Convert Lubricated Chain Across Water. Safety. And Hygiene

Wet chain lubrication uses about 4.1 litres per hundred metres every hour, keeps the floor permanently wet, and sustains microbial load in drains that hygiene auditors dislike intensely. Three separate functions therefore want it removed, and a supplier who assembles all three arguments together finds the decision made far above packaging procurement. Conversion to dry lubrication or lube-free modular belt typically pays back inside two years on water and cleaning cost alone, before counting a single avoided slip incident or audit finding. The decision gets made well above packaging procurement.
Market Impact: Payback runs under 2 years on water alone

Meter Air Conveying Before Selling Anything Else

Blowers moving empty containers consume around 23% of packaging hall electricity and almost always run flat out regardless of line demand. Metering that load costs almost nothing and produces a number most energy managers have never seen, since their attention goes to lighting and compressed air. Demand-controlled blowers, zoned delivery, and pressure optimisation against actual container weight typically cut that consumption by 30 to 40%. Arriving with the measurement rather than the proposal changes who in the customer organisation takes the meeting. Energy managers have been busy with lighting instead.
Market Impact: Cuts blower energy by 30 to 40% overall

Hold The Belting Aftermarket Across Twenty-Two Years

A conveying system runs about twenty-two years and consumes belting, chain, wear strips, and sprockets throughout, at a lifetime value several times the original installation. That revenue only stays with the original supplier if the components are proprietary or the service relationship is genuinely maintained, since compatible belting is widely available at lower prices. Structuring a service agreement at installation rather than chasing spares afterwards typically retains 60 to 70% of aftermarket value that otherwise migrates to third-party suppliers within five years. Compatible belting is widely available at lower prices.
Market Impact: Retains 60 to 70% of the aftermarket revenue

Who Controls the Margin Pool

Concentration reaches only 26% across the top five measured on annual conveyor and belting revenue into packaging, and the field splits along an unusual line. Belting specialists sell components into systems built by others, while integrators build systems using components they mostly buy. A few companies do both and they hold the strongest positions, because controlling the modular belt specification and the accumulation controls together is what actually differentiates. Very few companies genu
Competition runs on three fronts. Accumulation controls capability is the first, and it separates suppliers who sell line performance from those who sell transport. Hygienic construction is the second, decisive in meat, dairy, and prepared food. Aftermarket retention is the third, and most suppliers are considerably worse at it than they believe. Aftermarket retention is where most suppliers overestimate themselves.

Pressure builds from two directions. Chinese and Indian integrators supply transport sections at prices Western suppliers cannot match on straightforward work. And compatible belting from third-party manufacturers keeps attacking the aftermarket annuity that funds most supplier profitability. Both pressures attack the profitable part of the business, rather than the visible part of it.
pack-conveyors-market-company-positioning-matrix-1787299418128

Competitive Moat and Risk Dimensions

INTRALOX

Moat: Proprietary modular belt architecture

Owning the modular belt design and the sprocket geometry driving it means an installed system consumes that supplier's belting for its working life, since compatible alternatives fit imperfectly and fail sooner. The belt also determines hygiene, lubrication, and product handling behaviour. That converts installation into a decades-long consumable relationship.
INTRALOX

Risk: Component focus limits line control

Strength in belting does not automatically confer control over accumulation logic, line simulation, or the controls architecture where line performance is actually decided. Integrators specifying whole lines can choose a different belt if the accumulation argument belongs to them. Component excellence is defensible, and it can still be designed around by whoever owns the customer relationship at line level.
REGAL REXNORD

Moat: Breadth across chain and components

Supplying chain, bearings, drives, and conveying components across an unusually wide range lets a single supplier serve every part of a packaging hall's transport requirement, which matters to maintenance functions holding spares. That breadth also spreads engineering and distribution cost across many product lines. Plant engineers standardising on one supplier reduce their own inventory complexity substantially.
REGAL REXNORD

Risk: Commodity exposure across the range

Much of the component range is functionally comparable to alternatives available from several manufacturers, which means price competition is constant and differentiation must be earned repeatedly rather than held. Regional suppliers in Asia produce acceptable chain and components at considerably lower cost. Breadth protects the relationship and does relatively little to protect the margin on any individual item within it.

Players Tracked

Prominent Players

Intralox
Regal Rexnord
Ammeraal Beltech
FlexLink
Habasit

Other Key Players

Dorner
Nercon Engineering
Garvey Corporation
Span Tech
mk Technology Group
Krones
Sidel
KHS
Arrowhead Systems
Multi-Conveyor
Shuttleworth
Bosch Rexroth
Interroll
Forbo Movement Systems
Esbelt

Recent Developments

FEBRUARY 2025

European supplier launches line simulation service alongside conveyor proposals

A packaging conveyor supplier introduced a line simulation service quantifying overall equipment effectiveness under different accumulation configurations, offered alongside conventional quotations. The launch was internal capability development rather than any acquisition, and it targets customers comparing proposals purely on installed length and price. Modelling covers common filling line configurations.
Signal: Somebody has finally attacked the metre-price comparison that has damaged suppliers and customers equally for decades
MAY 2025

Dairy processor converts lubricated chain across multiple plants

A European dairy processor converted lubricated steel chain conveying to dry lubrication and lube-free modular belt across several sites, citing water consumption, floor safety, and hygiene audit findings together. The conversion was an internal operational decision rather than any arrangement with a conveyor supplier. Site numbers were not disclosed publicly.
Signal: Three separate functions wanted wet lubrication removed, which is why this conversion is moving faster than expected
SEPTEMBER 2025

Indian beverage producer commissions complete lines with lube-free specification

An Indian beverage manufacturer commissioned several new packaging lines specifying lube-free modular belt and zero-pressure accumulation throughout, rather than the lubricated chain common in older regional installations. The investment was organic capacity expansion funded internally rather than any partnership with an equipment supplier. Line speeds were not published in detail.
Signal: New build markets specify current best practice from the outset because there is no installed base pulling them backwards

Steel. Polymer, and Motors

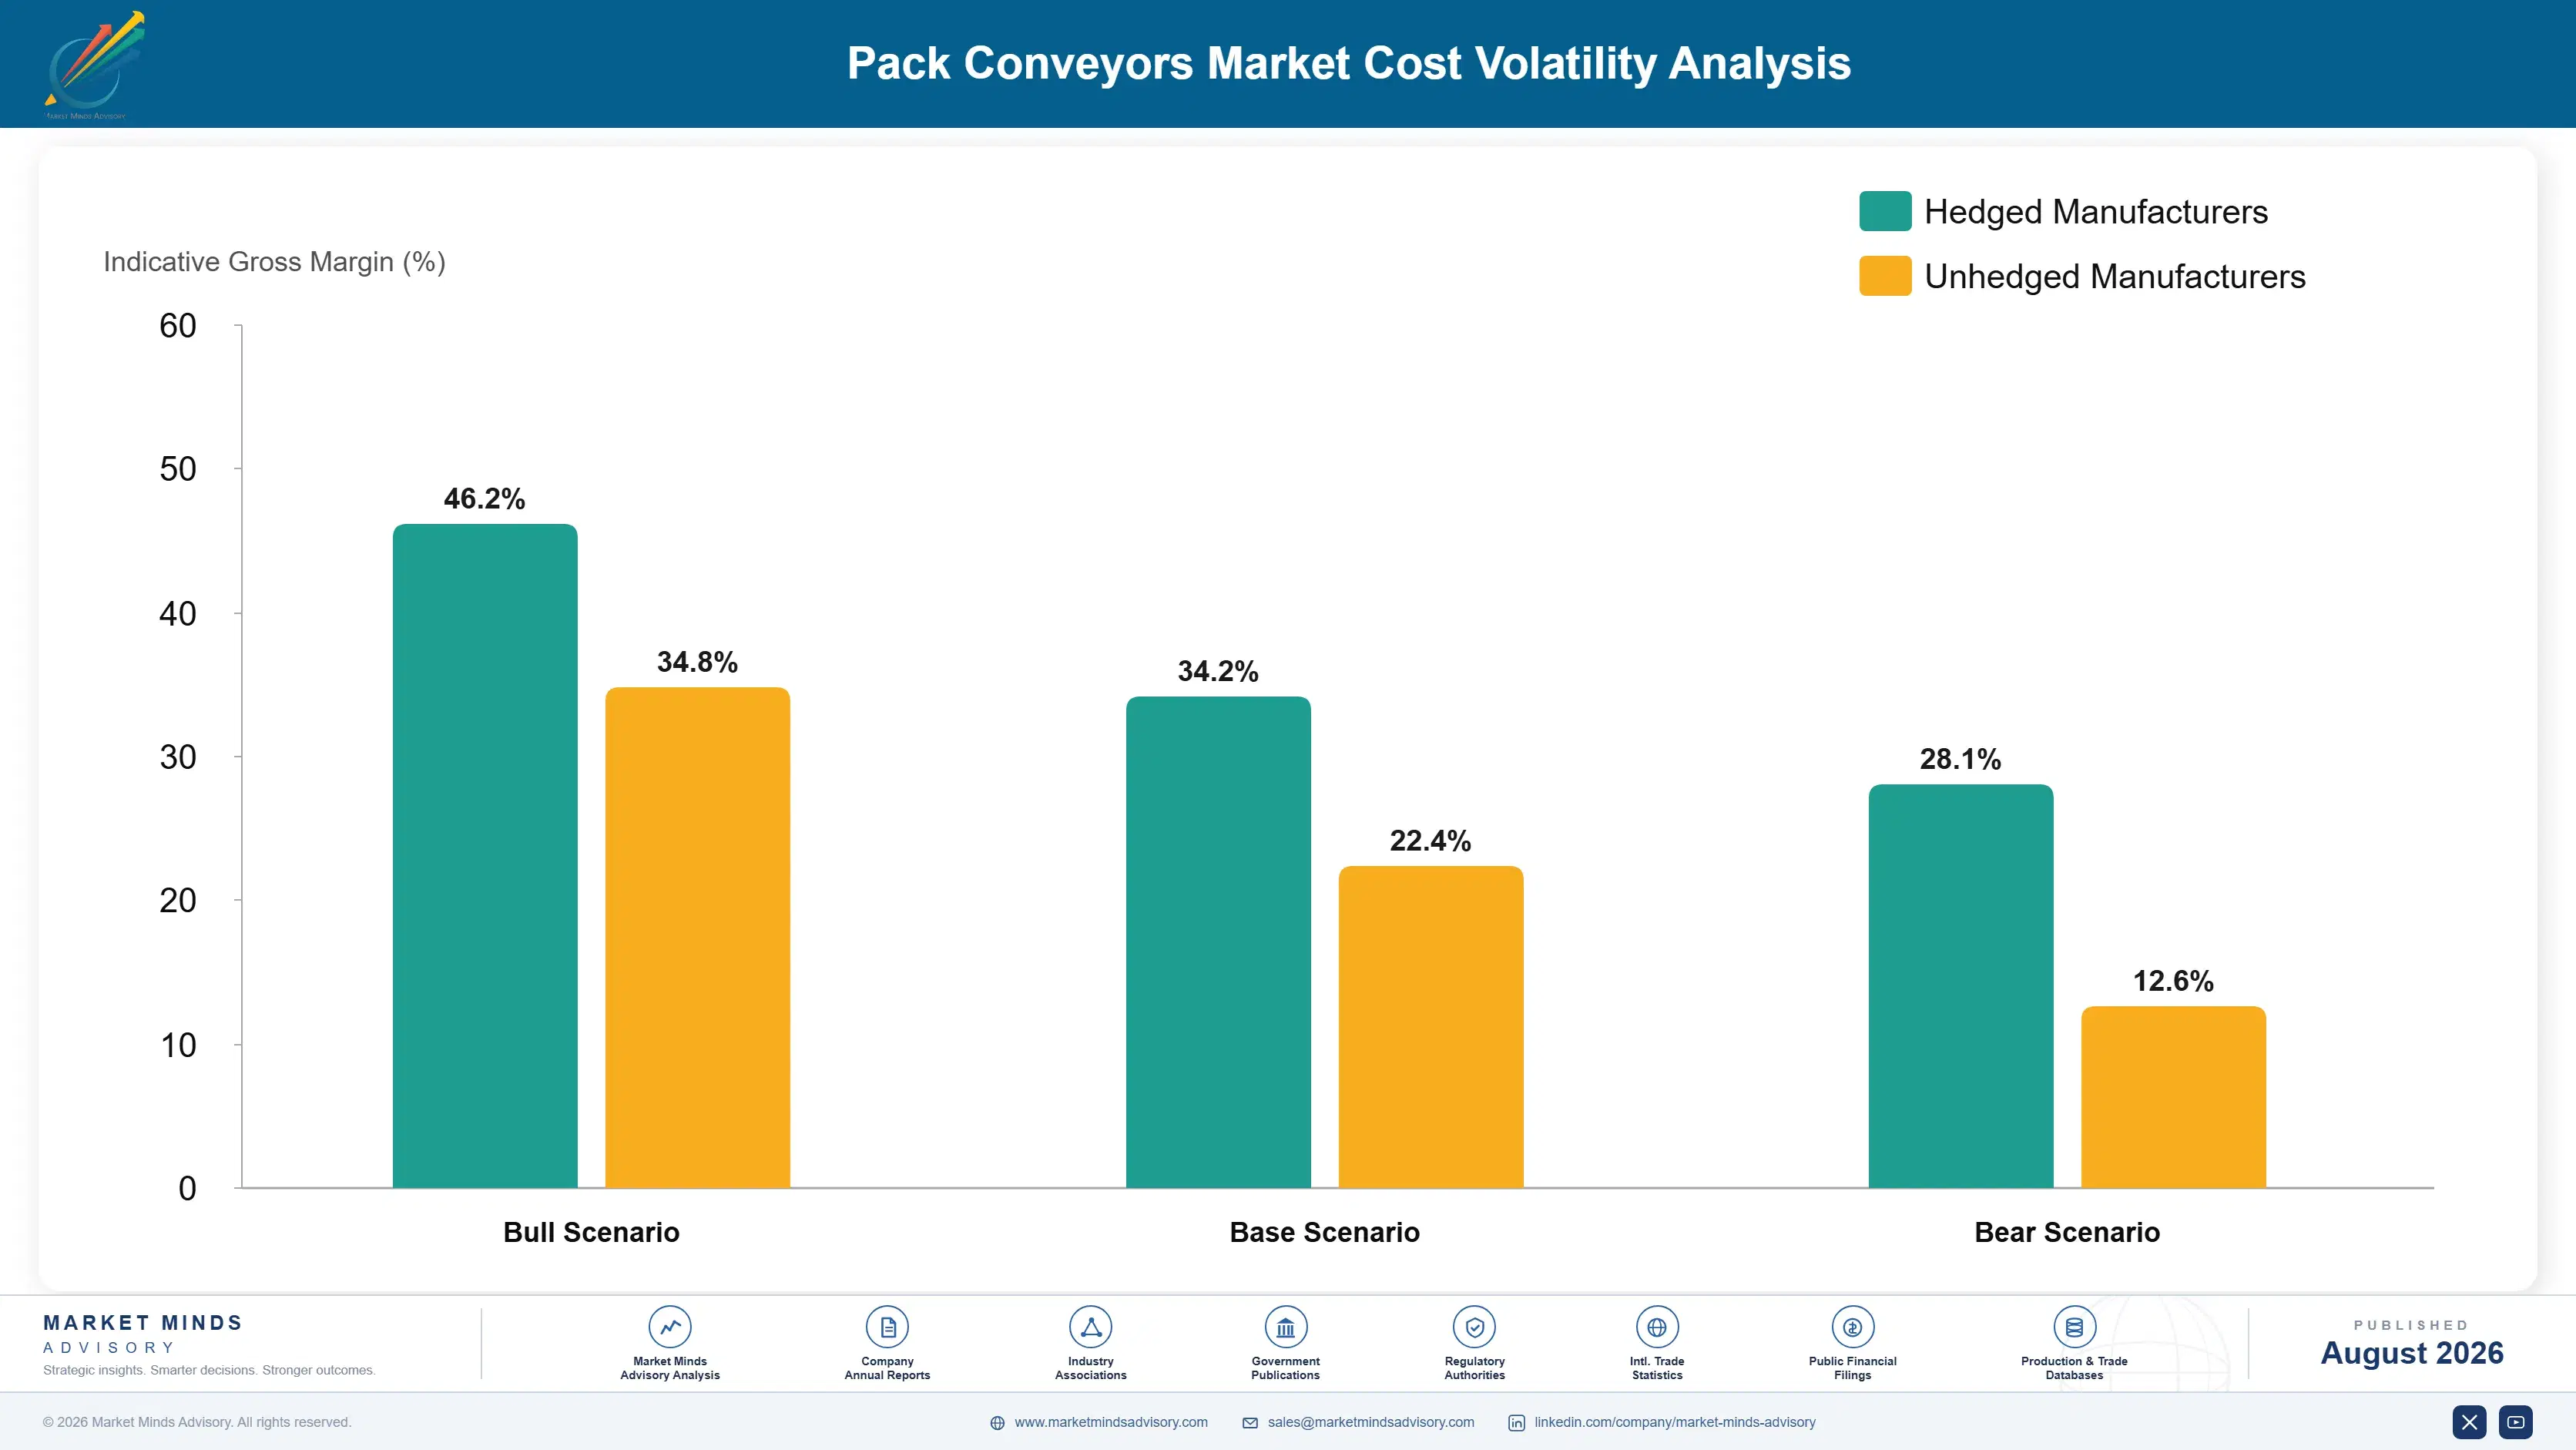
Three input groups carry the cost. Stainless steel framework, guides, and structure run about 31% of system cost, priced off metal markets plus fabrication. Engineering polymers for modular belt, chain, and wear strips add roughly 24%, dominated by acetal, polypropylene, and specialty grades. Motors, gearboxes, drives, and controls account for around 27%, sourced from a small group of automation suppliers.
Stainless steel and drive electronics were the exposures that mattered. Stainless surcharges moved sharply on nickel pricing through the recent period, and because hygienic packaging construction requires stainless rather than mild steel there is no substitution available. Semiconductor and drive availability tightened separately, which delayed commissioning on projects where the mechanical work was complete. Company annual reports across industrial equipment describe both effects in consistent terms.

The competitive disadvantage mechanism runs through drive supply commitments rather than steel purchasing. A supplier holding multi-year agreements with automation manufacturers commissioned on schedule while one buying drives project by project waited, and in equipment sold on delivery commitments that difference cost contracts directly. Steel exposure is broadly shared across the industry. Small integrators without standing drive commitments carried the worst position throughout.
pack-conveyors-market-cost-volatility-analysis-1787299418324

Hold standing drive and control commitments with automation suppliers

Motors, drives, and controllers were allocated rather than simply priced during the last shortage, and integrators without standing commitments waited while competitors commissioned on time. Multi-year agreements specifying volume in both directions secure scheduling position. On equipment sold against delivery dates with penalty clauses, that certainty is worth considerably more than the commitment costs.

Standardise framework designs to reduce stainless fabrication cost

Bespoke frame design on every single project multiplies fabrication cost on the input carrying 31% of total system value, and most applications differ far less than the engineering team assumes they do. Standard frame families with configurable lengths cut fabrication hours substantially and shorten lead times at the same time, which customers notice immediately.

Qualify a second engineering polymer grade for belt components

Modular belt performance depends on specific acetal and polypropylene grades whose availability tightened very considerably during the recent polymer supply disruption. Qualifying an alternative grade within the same performance envelope takes testing time that simply cannot be found during a shortage. It is inexpensive well in advance and quite impossible to compress later on.

Portfolio Architecture for Margin Defence

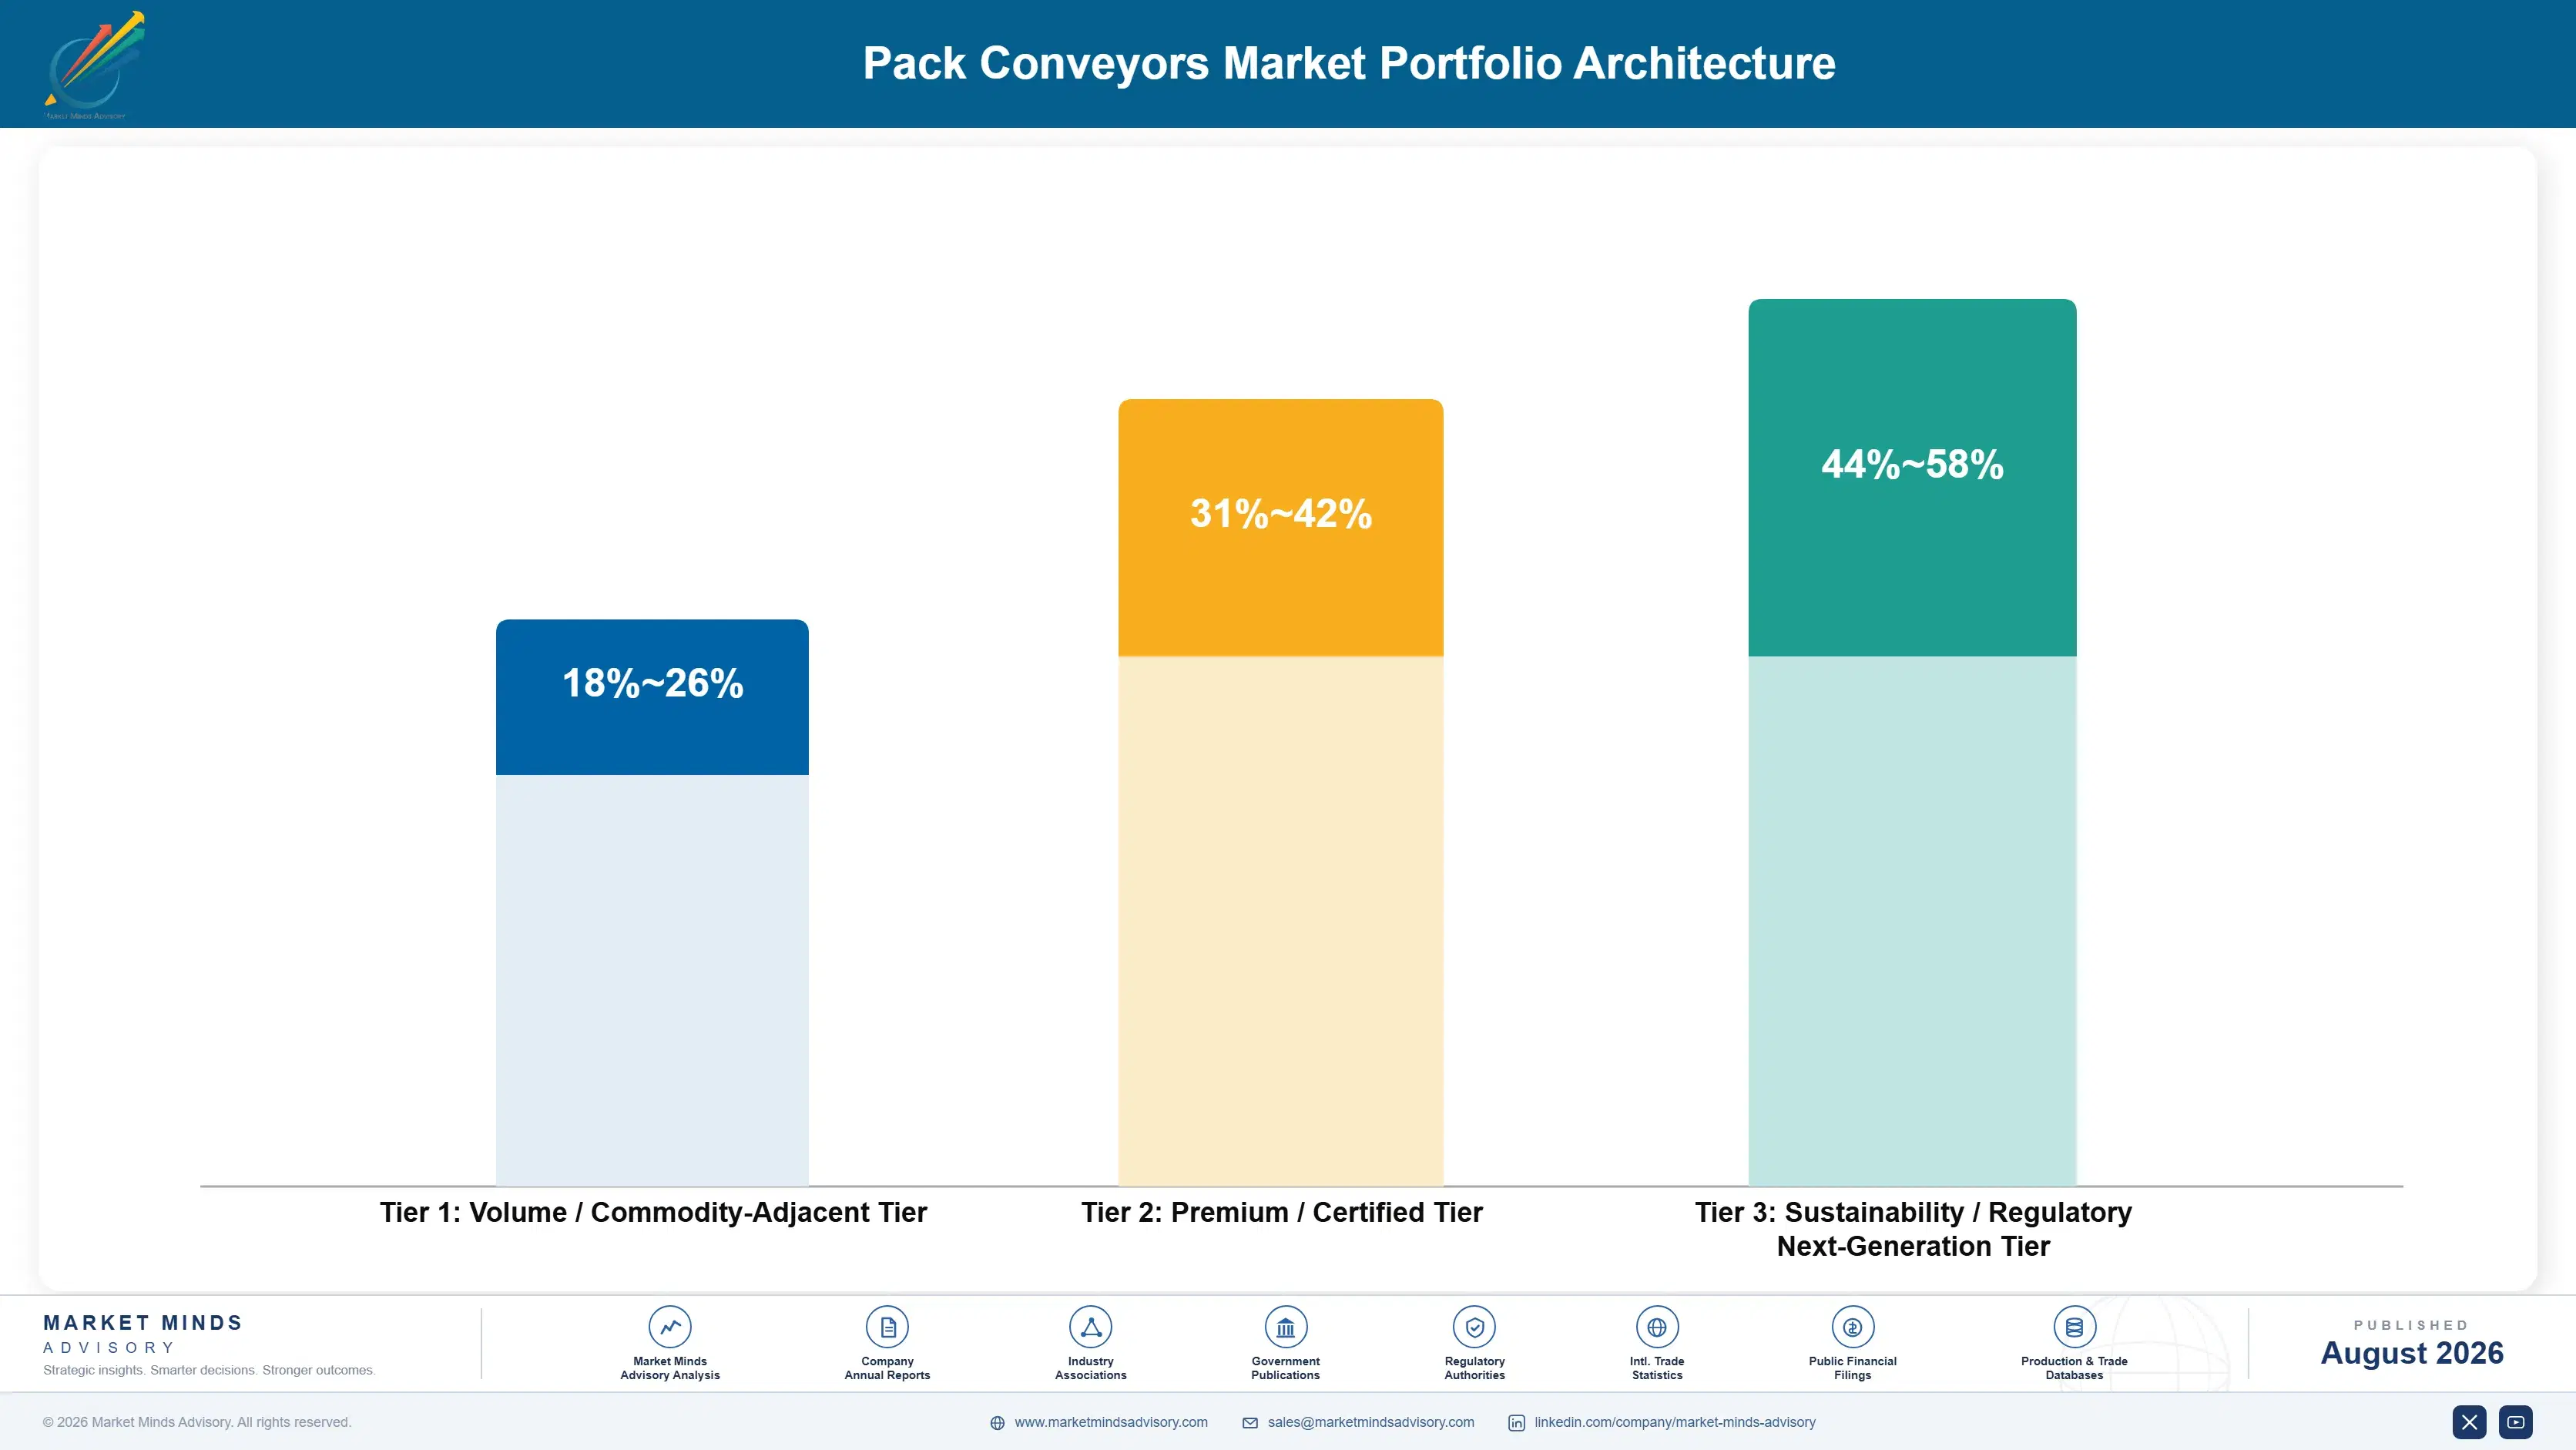
Three tiers describe this business and the margin spread reflects engineering content rather than material. Straight transport sections sit at the bottom, competing on price per metre against every regional integrator and increasingly against Asian suppliers. Engineered accumulation and hygienic systems sit considerably higher, protected by controls capability and food industry validation. And belting, chain, and wear component aftermarket occupies a third tier at the best margin across a twenty
The tension is that transport sections carry the belting into the plant. A supplier who cedes straight runs to a cheaper competitor loses the installed base that generates aftermarket revenue for two decades afterwards, and aftermarket is where most of the profit in this industry actually sits. Several suppliers premiumised toward engineered systems and watched component revenue decline as the installed base aged out. The twenty-year lag is what makes the mistake invisible.

High-value pools concentrate where the supplier owns a proprietary interface. Modular belt and sprocket geometry and accumulation control logic both create positions that compatible components cannot easily attack. Compatible components cannot easily attack either position, which is what makes them worth holding.

Volume / Commodity-Adjacent Tier

Straight transport conveyor sections, standard frames, and basic drives sold on price per metre. Thin margin against regional integrators and Asian suppliers, and the installed base that carries proprietary belting into the plant for decades afterwards.
Gross Margin: 18-26%

Premium / Certified Tier

Zero-pressure accumulation, spiral transfer, and hygienic open-frame systems with controls integration and food industry validation. Margin reflects engineering and controls capability rather than any difference in the steel or polymer used.
Gross Margin: 31-42%

Sustainability / Regulatory / Next-Generation Tier

Belting, chain, wear component aftermarket, lube-free conversion programmes, and air conveying energy retrofit. Best margin in the business and recurring across a twenty-two year system life rather than arriving once at installation.
Gross Margin: 44-58%
pack-conveyors-market-portfolio-architecture-1787299418822

High-value Sub-segments and Strategic Watch-out

Belting And Wear Component Aftermarket

Best margin in the business and recurring across a twenty-two year system life, worth several times the original installation. Compatible belting from third parties attacks it constantly, and service agreements signed at installation retain 60 to 70%. Most suppliers overestimate how much they actually keep.
Gross Margin: 44-58%

Zero-Pressure Accumulation Systems

Strong margin on controls capability and the fastest growth at 8.7%, since buffering is the only element that changes what the rest of the line achieves. The obstacle is commercial rather than technical, because metre-based comparison hides the value entirely. Line simulation is what converts that argument reliably.
Gross Margin: 31-42%

Straight Transport Conveyor Sections

The volume core at thin margin under constant regional and Asian competition, and the installed base that carries proprietary belting into a plant. Suppliers who ceded it found component revenue declining as installations aged out two decades later. Nobody connects the two decisions when it happens.
Gross Margin: 18-26%

Air Conveying Systems And Retrofit

The strategic watch-out and opportunity together, consuming 23% of packaging hall electricity while almost never being metered by anybody. Demand control and zoning cut that by 30 to 40%, and arriving with the measurement changes who takes the meeting. Light containers cannot be pushed along a belt at all.
Gross Margin: 27-39%

How Conveyor Revenue Actually Repeats

The system sells once every twenty-two years and the belting sells continuously, which makes installed base rather than order intake the number that predicts future revenue. Belting, chain, wear strips, and sprockets accumulate to several times the original installation value across a system life. That annuity is only secure where components are proprietary or a service agreement was written at installation, because compatible belting is widely available and plant engineers will test whether it
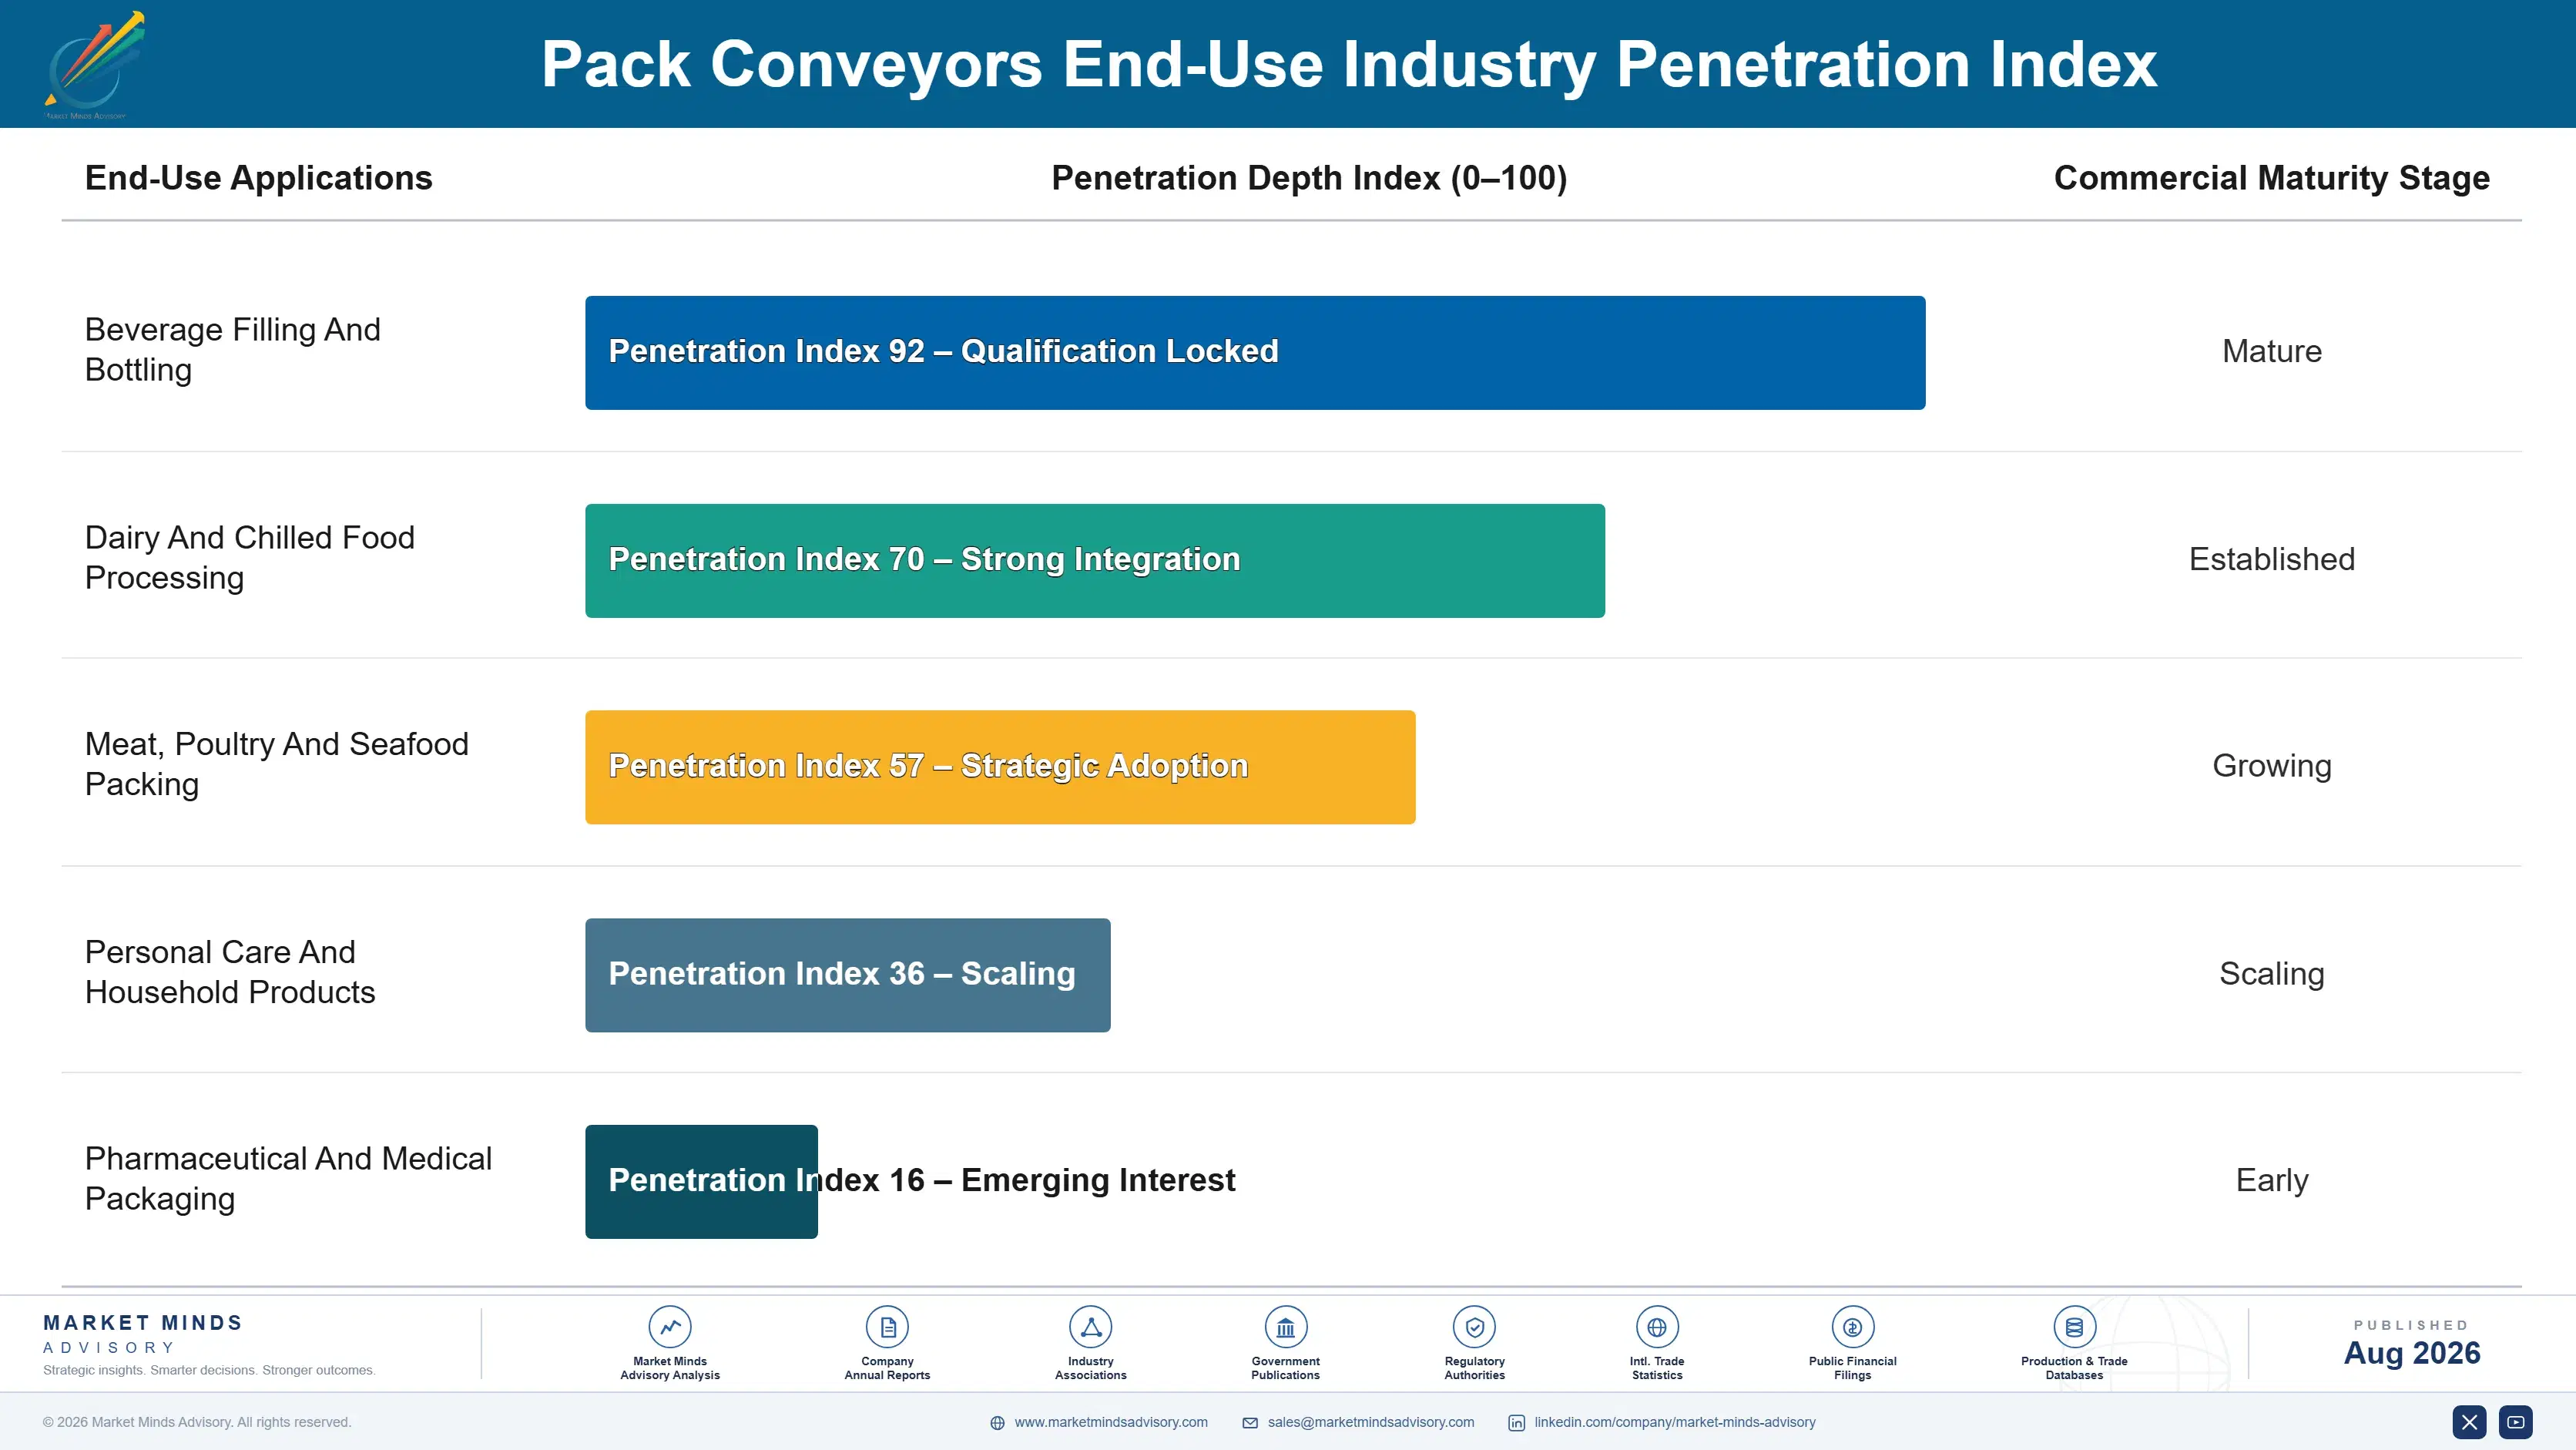
Depth of relationship varies sharply by customer type. Large beverage producers standardise conveying across networks and hold suppliers for decades through specification rather than contract. Meat and dairy processors care about hygienic construction above everything and audit it repeatedly. Contract packers change product mix constantly and value flexibility over efficiency. Pharmaceutical packaging halls run low volume at high value and specify validation depth that other sectors never require.

Buyer profiles are shifting as energy and sustainability functions gain influence over decisions engineering used to own. Water consumption and blower electricity now appear in evaluations that once covered only throughput and price. Engineering no longer decides these projects alone anywhere, and suppliers are slow to notice who does.
pack-conveyors-market-end-use-penetration-index-1787299419310

What We Would Tell a Board

These are among the four positions where our research anticipates prominent divergence between winners and laggards over the coming forecast period. Each is grounded in the demand model, the regulatory perimeter, and the announced capacity pipeline.
01 / PROPOSAL FRAMING DISCIPLINE

Stop quoting metres; quote the efficiency difference

A line with designed accumulation runs at around 91% overall equipment effectiveness against 67% without it, and on a filler worth several million dollars those twenty-four points exceed the entire conveying system cost every single year. Line simulation capability costs roughly 400,000 dollars to establish and converts a price-per-metre comparison into an output conversation. Suppliers who keep quoting installed length are participating in a comparison that damages them precisely as much as it damages the customer they are quoting to.
02 / LUBRICATION CONVERSION SELLING

Three functions want the water gone; assemble all three

Wet chain lubrication consumes around 4.1 litres per hundred metres every hour, keeps packaging hall floors permanently wet, and sustains microbial load in drains that hygiene auditors increasingly refuse to accept. Water reduction, occupational safety, and food hygiene functions therefore all want exactly the same conversion, each for entirely different reasons. A supplier who assembles all three arguments together finds the decision made well above packaging procurement, and payback typically lands inside two years on water and cleaning cost alone.
03 / ENERGY MEASUREMENT ENTRY

Bring the meter reading, not the proposal

Air conveying blowers consume around 23% of packaging hall electricity and typically run flat out regardless of whether the line is full, and almost no plant has ever metered the load because energy managers focus on lighting and compressed air instead. Demand control, zoning, and pressure optimisation against actual container weight cut that consumption by 30 to 40%. Arriving with the measurement rather than with a quotation changes which function inside the customer organisation agrees to take the meeting at all.
04 / INSTALLED BASE DEFENCE

Ceding transport sections costs the belting for two decades

Straight conveyor runs carry thin margin and attract every regional integrator in the market, which tempts suppliers to concede them and concentrate on engineered systems instead. That concession surrenders the installed base that would have consumed proprietary belting for the following twenty-two years, and aftermarket is where most of the profit in this industry genuinely sits. Several suppliers made exactly this choice and then watched component revenue decline a decade later, long after anybody was still connecting the two decisions together.

Engagement Snapshot From the Field

A live engagement with an industry participant carrying material or product regulatory and market exposure ahead of a defining policy shift, showing how our research translates into a defensible multi-year portfolio strategy.
MARKET MINDS ADVISORY · CLIENT ENGAGEMENT SUMMARY
Pack Conveyors Producer Strategic Portfolio Review and Transition Roadmap 2026·Investment Scenario on Pack Conveyors Exposure Evaluation 2025-26
CLIENT PROFILE
A European packaging conveyor supplier with approximately 210 million dollars in annual revenue (client-reported, unverified by MMA), building complete conveying systems for food, beverage, and personal care producers across Europe and North America. The company quoted all work on installed length and price per metre, sold spares reactively rather than under agreement, and had never metered air conveying energy at any customer site.
STRATEGIC CHALLENGE
Order intake had held steady while gross margin declined for three consecutive years, and the company was losing tenders to regional integrators quoting lower prices on comparable installed lengths. Aftermarket revenue per installed system had fallen materially. Management proposed price reductions to defend volume, and the board wanted an independent assessment first.
MMA APPROACH
We modelled overall equipment effectiveness under the client's accumulation designs against competitor configurations on comparable lines, reconstructed aftermarket revenue per installed system by cohort age and service agreement status, and metered air conveying energy at three customer sites. Lost tenders were reviewed against what the winning bidders had actually been asked to quote.
KEY FINDINGS
  1. Eleven of fourteen lost tenders had been decided purely on price per metre, and no proposal from any bidder had quantified line efficiency or accumulation performance at all.
  2. Aftermarket revenue on systems older than five years ran roughly 44% below suppliers operating installation-linked service agreements, with third-party belting fitted at most sites.
  3. Metered air conveying at three sites exceeded customer internal estimates by a wide margin, and none of the three energy managers had ever seen the load measured.
  4. The client's accumulation designs actually outperformed the winning competitors' configurations on modelled efficiency, and this advantage had never once been presented in a proposal.
CLIENT PROFILE
A European packaging conveyor supplier with approximately 210 million dollars in annual revenue (client-reported, unverified by MMA), building complete conveying systems for food, beverage, and personal care producers across Europe and North America. The company quoted all work on installed length and price per metre, sold spares reactively rather than under agreement, and had never metered air conveying energy at any customer site.
STRATEGIC CHALLENGE
Order intake had held steady while gross margin declined for three consecutive years, and the company was losing tenders to regional integrators quoting lower prices on comparable installed lengths. Aftermarket revenue per installed system had fallen materially. Management proposed price reductions to defend volume, and the board wanted an independent assessment first.
MMA APPROACH
We modelled overall equipment effectiveness under the client's accumulation designs against competitor configurations on comparable lines, reconstructed aftermarket revenue per installed system by cohort age and service agreement status, and metered air conveying energy at three customer sites. Lost tenders were reviewed against what the winning bidders had actually been asked to quote.
KEY FINDINGS
  1. Eleven of fourteen lost tenders had been decided purely on price per metre, and no proposal from any bidder had quantified line efficiency or accumulation performance at all.
  2. Aftermarket revenue on systems older than five years ran roughly 44% below suppliers operating installation-linked service agreements, with third-party belting fitted at most sites.
  3. Metered air conveying at three sites exceeded customer internal estimates by a wide margin, and none of the three energy managers had ever seen the load measured.
  4. The client's accumulation designs actually outperformed the winning competitors' configurations on modelled efficiency, and this advantage had never once been presented in a proposal.
RECOMMENDED STRATEGY
Phase 1: Phase 1 (months one to six): establish line simulation capability and requote the active pipeline on efficiency rather than on installed length. Phase 2: Phase 2 (months six to eighteen): introduce installation-linked service agreements and offer air conveying energy metering as a free entry service. Phase 3: Phase 3 (months eighteen to thirty): build lube-free conversion programmes targeting dairy and prepared food customers with all three arguments combined.
OUTCOME
The client abandoned the price reduction and rebuilt proposals around modelled line efficiency. Win rate on contested tenders improved substantially within three quarters, service agreement attachment reached most new installations, and two energy metering engagements converted into full retrofit projects (client-reported, unverified by MMA), with no change to list pricing.

Frequently Asked Questions

Foundational context covering the market sizes, CAGR, scope, country, region and competition that inform every finding below. This section is provided to cover basics and most often pre-purchase conversations, answered from the MMA Primary Research Dataset.

What is the current size of the Pack Conveyors Market?

The market is valued at USD 3.2 billion in 2025, rising to USD 3.39 billion in 2026. Belting and wear component aftermarket carries a large share of supplier profit.

How large will the Pack Conveyors Market be by 2036?

MMA forecasts USD 5.95 billion by 2036, an increase of USD 2.56 billion over the 2026 base. That represents an expansion multiple of 1.76 times.

What is the CAGR for the Pack Conveyors Market 2026 to 2036?

The base case CAGR is 5.8%, with a bull case of 7.0% and a bear case of 4.6%. The historical rate from 2020 to 2025 was also 4.6%.

Which segment is growing fastest?

Zero-pressure accumulation systems at 8.7%, exactly 1.50 times the market rate. Buffering is the only part of a conveying installation that changes what the rest of the line achieves.

Who are the major companies in the Pack Conveyors Market?

Intralox, Regal Rexnord, Ammeraal Beltech, FlexLink, and Habasit lead on annual conveyor and belting revenue into packaging. The top five hold only 26% of a fragmented market.

Which country is growing fastest?

India at 9.6%, driven by food, beverage, and personal care producers commissioning complete new packaging lines rather than debottlenecking existing ones. New lines specify lube-free construction from the outset.

Report Segmentation Architecture

The full report scope spans multiple orthogonal segmentation dimensions, with cross-tabulated demand data provided for each dimension pair. Coverage extends further to regional breakdowns, trend trajectories, and the competitive detail needed to support segment-level decision-making.

By Conveying System Type

  • Modular Plastic Belt Conveyors
  • Steel And Plastic Tabletop Chain Conveyors
  • Air Conveying Systems For Light Containers
  • Zero-Pressure Accumulation Systems
  • Spiral And Vertical Transfer Conveyors
  • Laning, Combining And Diverting Systems

By End-Use Industry

  • Beverage Filling And Bottling
  • Dairy And Chilled Food Processing
  • Meat, Poultry And Seafood Packing
  • Personal Care And Household Products
  • Pharmaceutical And Medical Packaging

By Commercial Model

  • Complete Line Integration Contracts
  • Conveyor Section Supply On Tender
  • Belting And Component Aftermarket Supply
  • Retrofit And Efficiency Upgrade Programmes

By Region

  • East Asia
  • South Asia and Pacific
  • North America
  • Western Europe
  • Latin America
  • Eastern Europe
  • Middle East and Africa

Scope, Methodology, and Coverage

Every figure in this report is reproducible from documented input assumptions. The scope below maps the historical period, the forecast horizon, the segmentation dimensions, and the countries covered, alongside the underlying primary and qualitative methodology.
Historical Period
2020 to 2025
Forecast Period
2026 to 2036
Base Year
2025 (USD billions; MMA Primary Research Dataset, August 2026)
Market Definition
This market comprises conveying systems installed inside packaging halls to transport containers, packs, cases, and bundles between filling, closing, labelling, inspection, and end-of-line equipment, measured at supplier realised prices across new systems, retrofit work, and component aftermarket. System coverage spans modular plastic belt, steel and plastic tabletop chain, air conveying for light containers, zero-pressure accumulation, spiral and vertical transfer, and laning, combining and diverting systems. Bulk material handling conveyors, warehouse and distribution centre conveying, automated storage systems, filling and packaging machinery, palletisers, and industrial robotics fall outside scope.
Quantitative Units
USD billions (current prices); metres of conveyor installed annually; aftermarket revenue per installed system
Segmentation Dimensions
By Conveying System Type; By End-Use Industry; By Commercial Model; By Region
Regions Covered
East Asia, South Asia and Pacific, North America, Western Europe, Latin America, Eastern Europe, Middle East and Africa
Countries Covered
China, Japan, South Korea, Taiwan, India, Vietnam, Thailand, Indonesia, Australia, USA, Canada, Mexico, Brazil, Argentina, Colombia, Germany, Italy, Switzerland, Sweden, France, Spain, Netherlands, UK, Poland, Czechia, Romania, Turkey, Saudi Arabia, South Africa, and additional markets relevant to this sector
Key Companies Profiled
Intralox, Regal Rexnord, Ammeraal Beltech, FlexLink, Habasit, Dorner, Nercon Engineering, Garvey Corporation, Span Tech, mk Technology Group, Krones, Sidel, KHS, Arrowhead Systems, Multi-Conveyor, Shuttleworth, Bosch Rexroth, Interroll, Forbo Movement Systems, Esbelt
Quantitative Methodology
Primary survey, n=3,800 respondents, Q4 2025, six countries; demand-side model with trade association cross-validation
Qualitative Methodology
47 expert interviews, Q4 2025; applied to validate demand model assumptions, identify emerging dynamics, and assess competitive positioning
Report Format
PDF and XLSX data workbook (Word format preview document)
Publisher
Market Minds Advisory
Report Code
MMA-2026-CON-322
Published
August 2026
Contact
sales@marketmindsadvisory.com | www.marketmindsadvisory.com

Purchase the full Pack Conveyors Market Report (2026 to 2036).

The full report sizes pack conveyors across six system types, five end-use industries, four commercial models, and seven regions, with country detail for the twenty largest national markets. New system, retrofit, and aftermarket revenue are sized separately throughout, since aftermarket carries most supplier profit and behaves nothing like project intake. Line efficiency is modelled under different accumulation configurations across representative filling line speeds. Competitive profiling covers twenty suppliers on conveyor and belting revenue into packaging. Air conveying energy consumption is benchmarked by container weight and system design.
New system, retrofit, and aftermarket revenue sized separately
Line efficiency modelled by accumulation configuration and line speed
Air conveying energy benchmarked by container weight and design
Wet lubrication water consumption and conversion payback by application
Aftermarket retention rates compared by service agreement structure
Installed base age profile modelled by region and industry

Built For The People Who Decide

From boardroom strategy to bench-side execution, this report is read cover-to-cover by leaders shaping the next decade of their industry, turning demand scenarios, market dynamics and valuation benchmarks into decisions.
CXOs/ Presidents/ VPs/ Managers
M&A and Corporate Development
Strategy Teams and R&D Heads
Procurement and Product Directors
Regulatory and Compliance Leaders
Investor Relations and Equity Analysts