Market Minds Advisory
Oxalic Acid Market

Oxalic Acid Market: A critical minerals reagent, concentrated supply and route economics to 2036

A reagent needed to build rare earth supply independence is itself made overwhelmingly in the country that independence is meant to reduce reliance upon, and very few people have noticed.

Lead Analyst

Bilal Shaikh

Published

September 2026

Make Smarter Decisions with Customized Research Insights

Request a free sample report and evaluate market opportunities, growth trends, and competitive dynamics relevant to your business needs.

2025 MARKET VALUE$1.1BMarket Size 2025
2036 FORECAST VALUE$2.1BBase Case , 2026 to 2036
CAGR 2026 TO 20366.4 %Bull 7.6% / Bear 5.2%
INCREMENTAL OPPORTUNITY$1.0BNet 10- year value creation
EXPANSION MULTIPLE1.86x2036 value over 2026 base
Strategic Levers
M&A Pipeline
Regional Outlook
Country Rankings
Competitive Intelligence
Segmental Deep-dive
Call-Us : 91 93563 13602

Executive Snapshot and Market Trajectory

Rare earth separation precipitates oxalates from leach solution and consumes roughly 2.4 tonnes of oxalic acid for every tonne of separated oxide produced. Around 34% of world separation capacity is currently being built outside the country that has long dominated it. That is a considerable reagent requirement arriving somewhere new.
Those new refineries will need this reagent in places that have never purchased it at industrial scale, and about 63% of world oxalic acid capacity sits in China. A chemical required to reduce dependence is itself sourced from the very place the dependence runs to, which is an awkward position nobody planned for. Few companies announcing separation projects have addressed this publicly at all.
Rare earth and metal processing grows at 9.6%, half again the market rate of 6.4%, and American growth at 9.8% leads every country for the same reason. East Asia holds 46% of value on production and refining capacity together, well beyond its usual regional band. Restarting Western capacity is hard too, since 71% of production uses a route whose emissions Western plants closed rather than abate. Rebuilding elsewhere costs more than the acid price supports.
Market Definition
This report covers oxalic acid and its principal salts supplied for industrial and specialty use, spanning rare earth and metal processing, metal surface treatment and cleaning, textile processing and bleaching, pharmaceutical and fine chemical intermediates, stone wood and surface restoration, and agricultural and beekeeping applications. Value is measured at producer level on tonnage supplied on a dihydrate basis. Excluded are oxalate salts sold as separate speciality chemicals, oxalic acid generated in situ within a process, formic and other organic acids, and rare earth oxides or metals produced downstream of the reagent.
Base Year Value
$1.1B in 2025 (MMA Primary Research Dataset, August 2026)
Forecast Period
2026 to 2036, eleven discrete annual values
CAGR
6.4% base case. Bull 7.6%. Bear 5.2%.
Fastest Growth Segment
Rare Earth and Metal Processing: 9.6% CAGR
Fastest Growth Country
United States: 9.8% CAGR
Fastest Growth Region
South Asia and Pacific: 8.4% CAGR
Largest Region
East Asia: 46% of 2025 global value
Market Leaders
UBE Corporation, Indian Oxalate, Star Oxochem, Shandong Fengyuan Chemical and Oxaquim lead the market. Source: MMA Primary Research Dataset, July 2026.
Primary Survey
n=3,800 procurement and R&D decision-makers, Q4 2025, six countries
Methodology
Demand-side build-up, cross-validated against public data, 47 expert interviews

Oxalic Acid Market Forecast Scenarios

oxalic-acid-market-trends-size-forecast-scenario-1787559577143
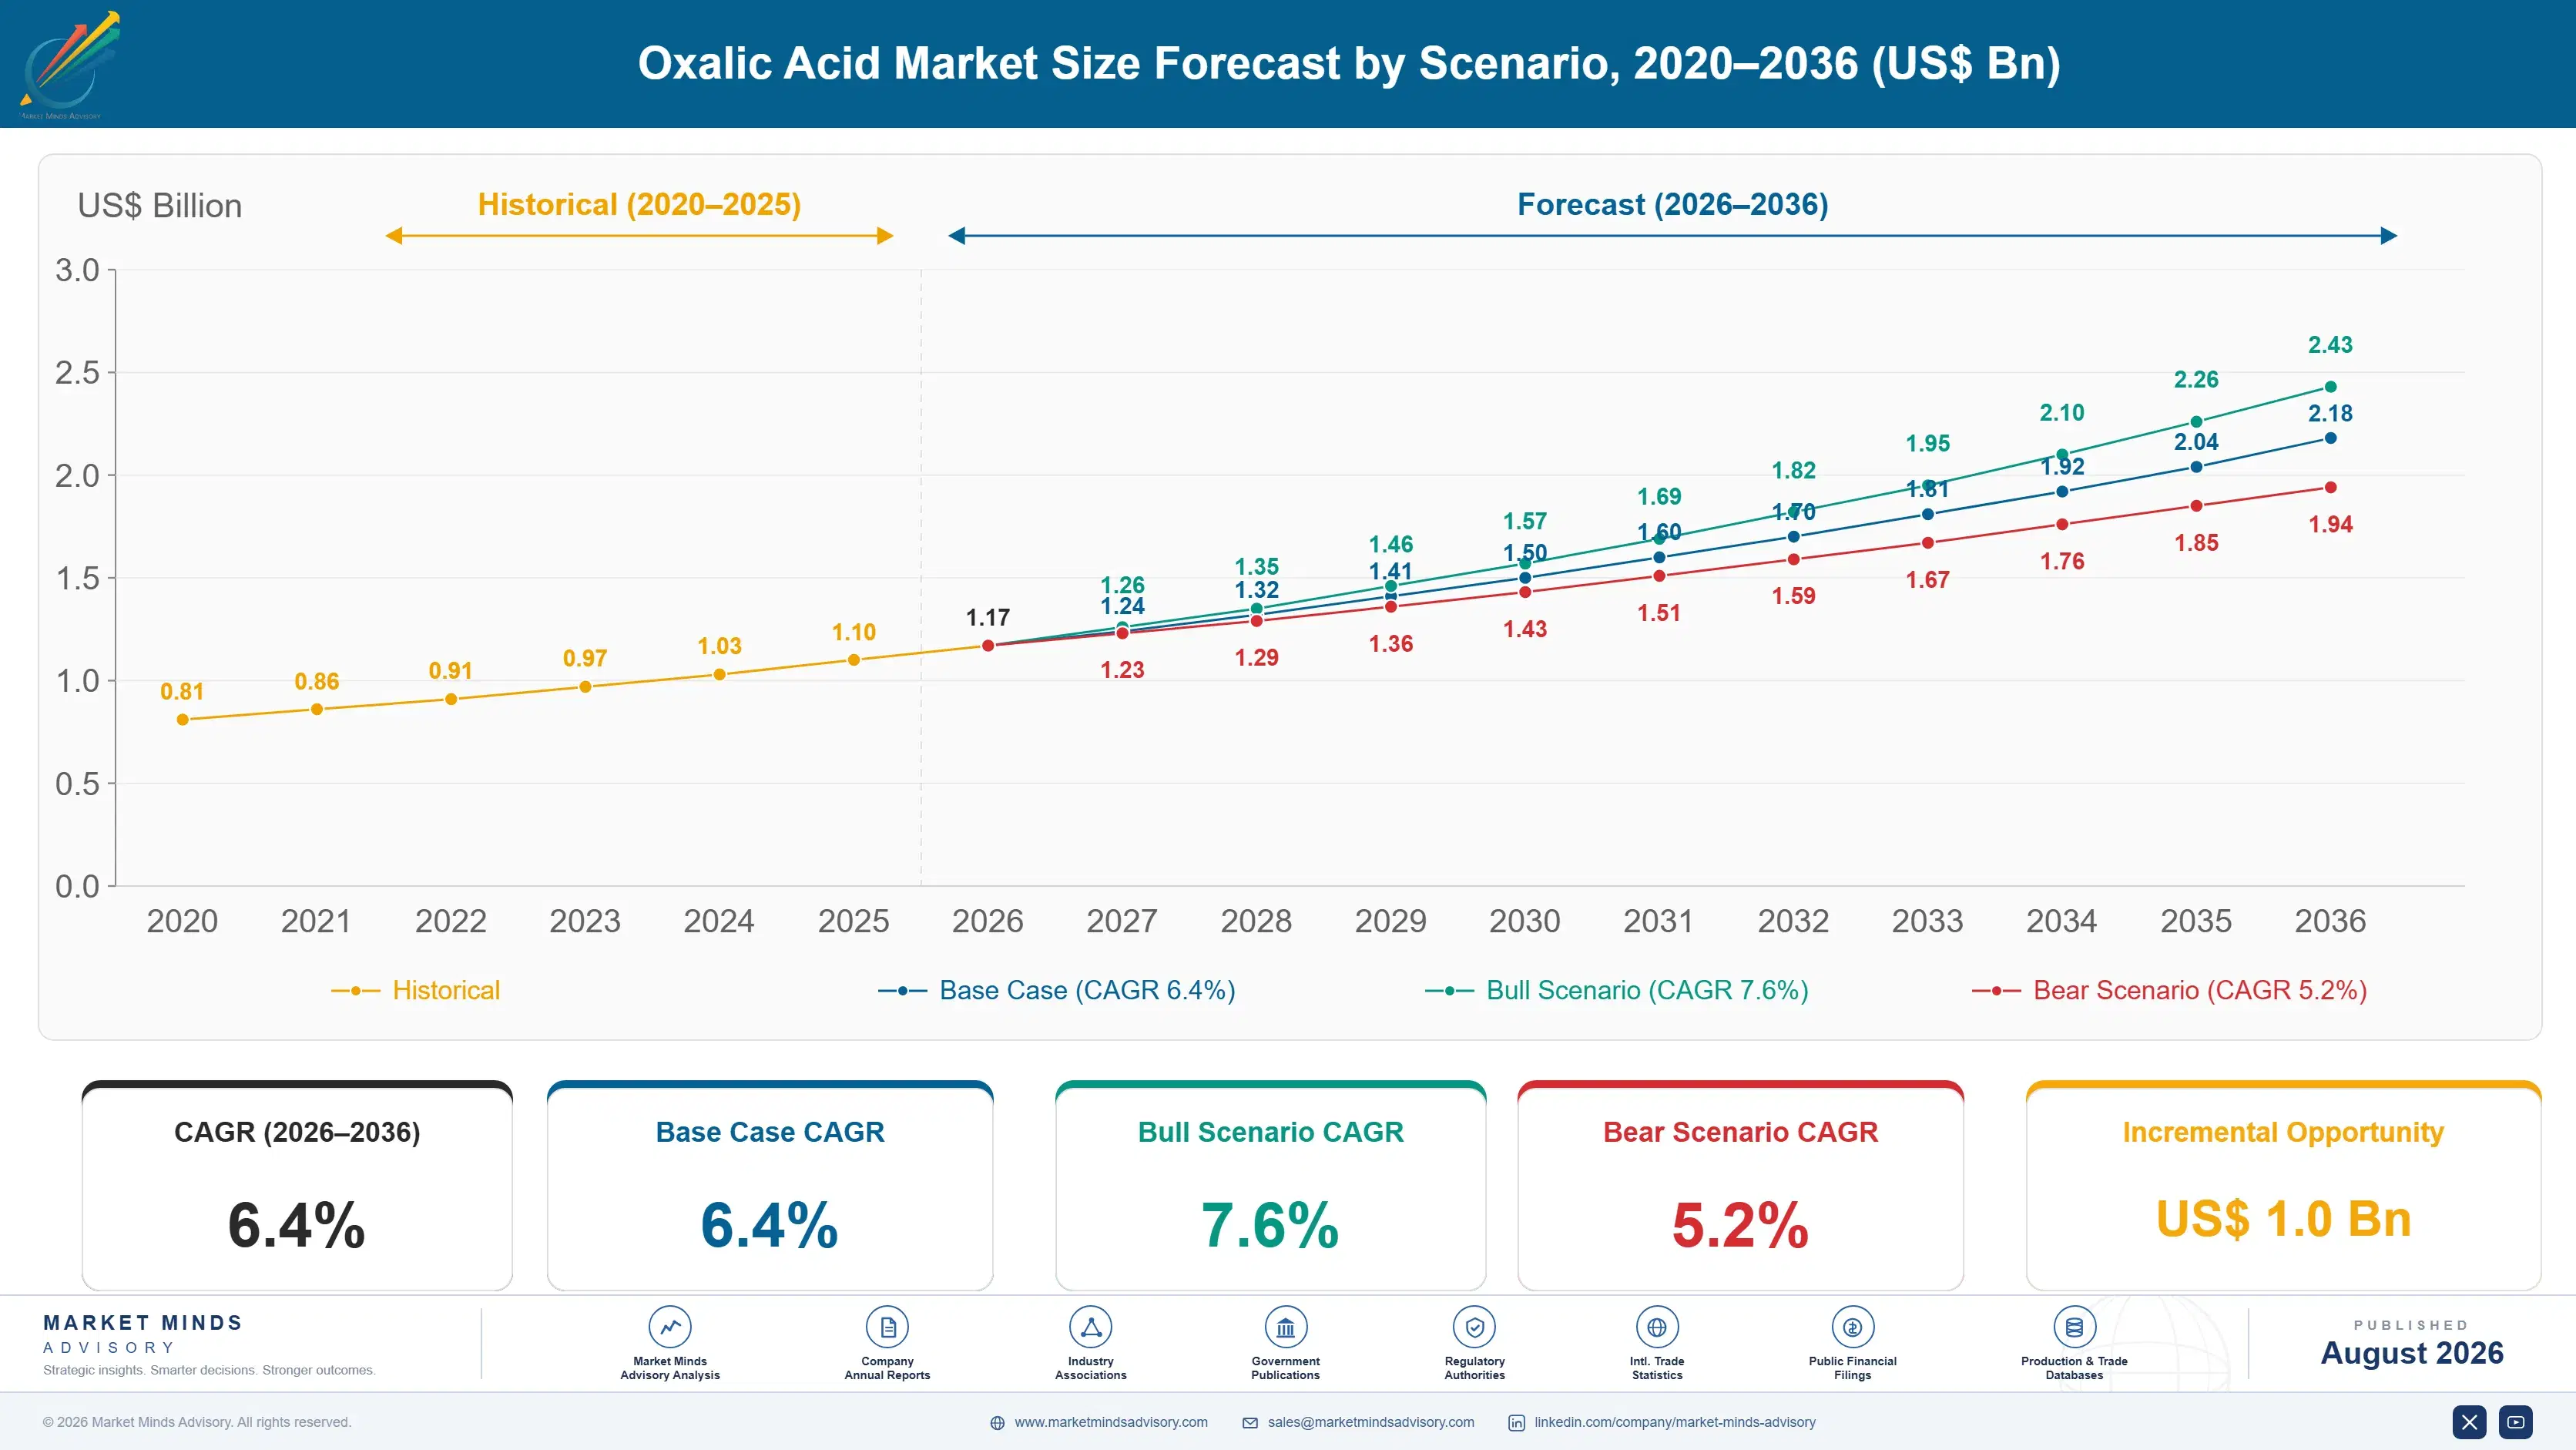
Growth ran at 4.8% between 2020 and 2025 and it looked like an ordinary mature industrial acid throughout most of that period. Metal cleaning and textile applications grew slowly or not at all, and pharmaceutical intermediate demand was steady. What changed toward the end was rare earth separation capacity being announced outside China at a scale that had not been attempted in decades.
The 6.4% base case rests on three mechanisms. Rare earth and metal processing at 9.6% as separation refineries commission outside the dominant producing country. Agricultural and beekeeping applications at 8.2% on varroa mite control where synthetic acaricides have failed. And American growth at 9.8%, the fastest of any country, on domestic rare earth refining being built for reasons that have nothing to do with chemistry. Only the first of those three depends on anybody else's construction schedule.
The 7.6% bull case is separation capacity commissioning on announced schedules, which would create reagent demand in markets with no local supply at all. The 5.2% bear case is those projects slipping, since rare earth refining has a long history of announced capacity arriving late, arriving smaller, or not arriving in any recognisable form whatsoever.

The Reagent Nobody Counted

Oxalic acid spent decades as an unremarkable industrial acid used for cleaning metal, bleaching textiles and polishing stone, and it has quietly become something rather more consequential. Rare earth separation works by precipitating rare earth oxalates out of a leach solution, and doing that consumes roughly 2.4 tonnes of oxalic acid for every tonne of separated oxide that emerges. Around 34% of world separation capacity is presently under construction outside the country that has dominated refining for a generation, and every one of those plants will need this reagent.
TOP-FIVE CONCENTRATION38%Combined position across supply held by the leading acid producers
CHINESE PRODUCTION SHARE63%Portion of world capacity located within a single country
RARE EARTH REAGENT CONSUMPTION2.4 tAcid required per tonne of separated oxide produced
NITRIC OXIDATION ROUTE SHARE71%Capacity using carbohydrate oxidation that requires emission abatement
REFINING CAPACITY UNDER CONSTRUCTION34%Separation capacity being built outside the dominant producing country
VARROA TREATMENT ADOPTION58%Share of managed colonies treated with the organic acid method
The difficulty is where it comes from. Roughly 63% of world oxalic acid capacity sits in China, which means a chemical required to build rare earth supply independence is itself sourced overwhelmingly from precisely the place that independence is intended to reduce reliance upon. Very few of the companies announcing separation projects have addressed this in any public document, and several appear not to have considered it, which will become apparent at commissioning rather than at the planning stage.
Restarting Western capacity is not straightforward either. About 71% of production uses carbohydrate oxidation with nitric acid, which generates nitrogen oxides that require abatement Western plants closed rather than fund.
"Everybody building a rare earth refinery outside China has a plan for the ore, a plan for the solvent extraction and no plan at all for the oxalic acid. It is two and a half tonnes of reagent per tonne of product and most of the world's supply is in exactly the place they are trying to route around."
Director, Industrial Chemicals and Critical Minerals Practice · MMA Chemicals and Materials Practice · August 2026

Market Trends

Rare earth refining converts a commodity into a reagent

Separating rare earths means precipitating oxalates from leach solution, consuming roughly 2.4 tonnes of oxalic acid per tonne of separated oxide, and around 34% of world separation capacity is being built outside the dominant producing country for reasons of supply security. Those refineries will need reagent in markets with no meaningful local supply. Commercially this reclassifies an ordinary industrial acid as a critical minerals input, and the producers positioned to serve new refineries hold something considerably more valuable than a mature commodity position. That reclassification has happened faster than pricing has adjusted.
Market Impact: American demand compounds at 9.8%

Organic varroa control expands as synthetic acaricides fail

Varroa mites have developed resistance to the synthetic acaricides beekeepers relied on for decades, and oxalic acid applied by dribble or vaporisation has become the principal organic alternative, now used on roughly 58% of managed colonies. Growth at 8.2% follows resistance rather than any preference for organic treatment. Commercially the volumes are small and the visibility is high, and this demand is completely uncorrelated with industrial applications, which makes it a genuinely useful diversification for a producer weighted toward cyclical metal processing. Packaging and distribution differ entirely from industrial supply.
Market Impact: Segment compounds at 6.8% annually

Market Opportunities and Growth Drivers

American refining construction creates demand with no local supply

American growth at 9.8% leads every country in this market and the reason has nothing to do with chemistry. Domestic rare earth separation capacity is being built for strategic reasons, and each plant consumes roughly 2.4 tonnes of oxalic acid per tonne of oxide produced. There is very little domestic production to serve it, and the obvious import source is the country whose position these projects exist to counterbalance. Commercially this is the clearest supply gap in the entire market and it arrives on a known construction schedule. It arrives on a construction schedule anybody can read.
Market Impact: Route covers 71% of capacity

Pharmaceutical intermediates demand consistent high purity supply

Fine chemical and pharmaceutical synthesis uses oxalic acid and oxalate salts as reagents and resolving agents where impurity profile matters considerably more than price, since a trace metal carried into an active ingredient becomes a regulatory problem rather than a quality one. Growth at 6.8% follows pharmaceutical manufacturing rather than any development in the acid itself. Commercially these customers qualify a supplier thoroughly and change reluctantly, which produces relationships far more durable than industrial cleaning or textile applications ever generate. Impurity profile rather than price governs the purchase. Relationships here outlast industrial cleaning business entirely.
Market Impact: Covers 34% of capacity being built

Market Restraints and Challenges

Emission abatement cost closed Western capacity and blocks restart

Around 71% of world capacity uses carbohydrate oxidation with nitric acid, a route generating nitrogen oxides that require abatement equipment Western producers largely chose to close rather than fund when the economics were marginal. The root cause is that the cheapest production route is also the dirtiest one. Commercially this is why capacity concentrated in China and why rebuilding it elsewhere costs considerably more than the acid price supports. Producers are examining formate-based routes which avoid the emissions and carry different feedstock economics entirely. Feedstock economics differ completely on that alternative route.
Market Impact: Consumes 2.4 tonnes per tonne oxide

Announced refining capacity has a poor record of arriving

Rare earth separation projects outside the dominant producing country have been announced repeatedly over two decades and have arrived late, smaller than planned, or not at all with considerable regularity. The root cause is that separation is technically demanding, capital intensive and competes against an incumbent with decades of process refinement. Commercially this makes reagent demand forecasts dependent on somebody else's construction discipline. Producers are contracting conditionally against commissioning milestones rather than building capacity against announcements alone. Separation is technically demanding and competes against an incumbent with decades of process refinement behind it.
Market Impact: Treats 58% of managed colonies
4 additional market trends, 3 additional growth drivers, and 2 additional restraints and challenges are covered in the full report. Contact sales@marketmindsadvisory.com to access the complete intelligence.

Segment CAGR and Growth Architecture

Volume is classified here by end application, since purity requirement, price tolerance and demand growth all differ enormously between a rare earth refinery and a textile bleaching operation. Production route, product form and supply arrangement are each handled separately in the framework below, because a single grade frequently serves several different applications after purification.
oxalic-acid-market-trends-market-share-analysis-1787559577671

Rare Earth and Metal Processing

Growing at 9.6%, half again the market rate, this segment exists because rare earth separation precipitates oxalates from leach solution and consumes roughly 2.4 tonnes of acid for every tonne of separated oxide produced. Around 34% of world separation capacity is being built outside the dominant producing country, which creates reagent demand in markets holding almost no local supply of it. Purity matters here because trace contamination carries through into the separated oxide, and refiners qualify suppliers accordingly. Demand arrives on construction schedules rather than on any market cycle, which makes it unusually forecastable provided the projects actually commission. Whether those projects commission is the whole question here. Announcements are not commissioning schedules.
CAGR 9.6%

Agricultural and Beekeeping Applications

Varroa mites developed resistance to the synthetic acaricides that beekeepers depended on for decades, and oxalic acid applied by dribble or vaporisation became the principal organic control, now used on roughly 58% of managed colonies worldwide. Growth at 8.2% follows treatment failure elsewhere rather than any preference for organic methods among beekeepers. Volumes are modest and packaging is entirely different from industrial supply, running through agricultural distribution in small quantities. The demand is genuinely uncorrelated with metal processing or textile cycles, which makes it useful diversification for a producer otherwise exposed to industrial activity. Distribution runs through agricultural channels in small quantities rather than through industrial chemical supply. It is a different commercial operation entirely.
CAGR 8.2%
Full segment breakdown across 6 segments available in the complete report.

Regional Architecture and Country Demand Map

East Asia holds 46% of value, far above the standard band, because roughly 63% of world production capacity and the majority of rare earth refining both sit there. North America and Western Europe follow at 16% and 14%, well below their usual bands after decades of capacity closure.

East Asia

At 46% this region sits far above the standard band, holding roughly 63% of world production capacity alongside the majority of rare earth separation refining, which makes it simultaneously the largest supplier and the largest consumer. Chinese producers built that position partly on feedstock cost and partly because emission abatement obligations were lighter during the period when Western capacity closed. Japanese demand is technically demanding and UBE holds a significant high purity position serving electronics and pharmaceutical customers. Korean and Taiwanese electronics cleaning applications add steady volume. Growth at 7.4% reflects refining expansion alongside industrial demand. Emission obligations were lighter during the period when Western capacity closed. Domestic refining consumes much of it.
Share: 46% | CAGR: 7.4% (2026 to 2036)

North America

At 16% this region sits below the standard band after decades in which domestic capacity closed rather than fund the emission abatement that carbohydrate oxidation requires. American growth at 9.8% nonetheless leads every country here, driven entirely by rare earth separation capacity being constructed for strategic reasons and consuming roughly 2.4 tonnes of reagent per tonne of oxide. That demand is arriving into a market with almost no local supply and an obvious import source that the projects exist to route around. Metal cleaning and restoration applications are mature and stable. The obvious import source is precisely the country these separation projects exist to route around, which is a difficulty nobody has publicly resolved.
Share: 16% | CAGR: 7.2% (2026 to 2036)
Regional intelligence for 5 additional markets available in the complete report: Western Europe, South Asia and Pacific, Latin America, Middle East and Africa, Eastern Europe. Contact sales@marketmindsadvisory.com.
oxalic-acid-market-trends-country-cagr-analysis-1787559578235

Where Oxalic Acid Value Is Moving

Four quite separate moves matter here, in a mature industrial acid that has unexpectedly become a critical minerals reagent while most of its capacity sits inside a single country. Two concern serving refining demand arriving on construction schedules, and two concern the production and application positions holding value regardless of what any refinery does.

Contract refinery reagent supply against commissioning milestones

Rare earth separation consumes roughly 2.4 tonnes of oxalic acid per tonne of separated oxide, and around 34% of world separation capacity is under construction outside the dominant producing country with almost no local reagent supply behind it. Announced projects have a poor record of arriving on schedule, so contracting conditionally against commissioning milestones captures the demand without building capacity against announcements. Refiners discovering the reagent question at commissioning will accept terms they would not have accepted earlier. It also reveals which projects are genuinely proceeding. That intelligence is worth having on its own.
Market Impact: Serves 34% of the separation capacity under construction

Build supply positions outside the concentrated producing base

Roughly 63% of world capacity sits in one country, and the refineries being built specifically to reduce dependence on that country will need reagent from somewhere. A producer with capacity anywhere else holds a position that has strategic value beyond its chemistry, which is unusual for a commodity acid. Indian, European and any new North American capacity all qualify. Customers building supply chain independence will pay a premium for reagent that does not undermine the entire purpose of their project. Undermining their own rationale is not a trade they will make.
Market Impact: Counters a 63% share held by one country

Develop formate routes that avoid abatement obligations

About 71% of capacity uses carbohydrate oxidation with nitric acid, generating nitrogen oxides requiring abatement that Western producers closed plants rather than fund. Formate-based routes avoid those emissions entirely and carry different feedstock economics, which changes where capacity can viably be built. In a market where geography is becoming strategically important, a production route that permits Western or Indian construction without prohibitive abatement cost is worth considerably more than its efficiency alone suggests. Abatement capital lands at construction rather than across the plant's operating life, which is exactly why the burden proved decisive when Western producers faced it.
Market Impact: Avoids abatement across 71% of all production routes

Hold pharmaceutical purity positions through industrial cycles

Fine chemical and pharmaceutical customers qualify suppliers on impurity profile rather than price, since trace metal carried into an active ingredient becomes a regulatory problem, and they change suppliers reluctantly once qualified. That segment grows at 6.8% and its relationships outlast industrial cleaning and textile business entirely. For a producer exposed to metal processing cycles and refinery construction timing, qualified pharmaceutical volume provides the steadiest revenue available anywhere in this market. Requalification means analytical work and regulatory documentation nobody wants to repeat for a reagent, which is precisely what makes the position durable.
Market Impact: Holds a segment now growing at 6.8% yearly

Who Controls the Margin Pool

Five producers hold 38% of this market, measured on tonnage supplied on a dihydrate basis, the basis used throughout this section. Concentration is moderate at company level and severe at country level, since roughly 63% of capacity sits in one place regardless of how many separate producers operate there. That distinction matters far more to a customer building supply chain independence than any company market share does. Country concentration is the number that matters.
Competition runs on four dimensions. Production geography, which has become strategically consequential rather than merely a freight consideration for anybody buying. Purity capability for pharmaceutical and rare earth applications where trace contamination carries through. Production route and the abatement obligations attached to it. And qualification depth with refiners and pharmaceutical manufacturers, both of whom change suppliers extremely reluctantly once satisfied.

Rankings shift toward producers sited outside the concentrated production base and toward those qualified with refining projects before commissioning arrives. Indian producers hold genuine scale alongside competitive cost positions. Japanese and European producers hold the purity capability that demanding applications require. Chinese producers hold the volume and increasingly face customers who would frankly rather buy elsewhere.
oxalic-acid-market-trends-company-positioning-matrix-1787559578750

Competitive Moat and Risk Dimensions

UBE CORPORATION

Moat: High purity and Japanese position

The company holds purity capability serving electronics and pharmaceutical customers where impurity profile rather than price governs qualification, and those customers change suppliers reluctantly once qualified. Production outside the concentrated Chinese base also carries strategic value for customers building supply chains deliberately routed around that concentration, which is a consideration that barely existed a decade ago.
UBE CORPORATION

Risk: Limited scale against Asian volume

Rare earth refining consumes reagent in bulk quantities where purity requirements are real but scale matters more, and Chinese and Indian producers hold cost positions that high purity capability does not offset. Refinery demand arriving at 9.6% growth favours producers who can supply tonnage. A purity position serves the steadiest revenue rather than the fastest growing volume.
INDIAN OXALATE

Moat: Scale outside the dominant base

The company operates meaningful capacity in a country with domestic feedstock, competitive cost and abatement obligations lighter than Western producers face, which places it outside the concentrated production base without carrying the cost penalty that Western capacity would. That combination is genuinely scarce and becomes more valuable as customers deliberately seek reagent supply away from the dominant producing country.
INDIAN OXALATE

Risk: Purity depth for demanding applications

Pharmaceutical and high purity rare earth applications qualify suppliers on impurity profile, and reaching those specifications requires purification capability that industrial grade production does not develop naturally. Japanese and European producers hold those qualifications. Volume positions serve the growth while purity positions serve the margin, and holding only one of them limits which customers are reachable.

Players Tracked

Prominent Players

UBE Corporation
Indian Oxalate
Star Oxochem
Shandong Fengyuan Chemical
Oxaquim

Other Key Players

Merck KGaA
Clariant
GEO Specialty Chemicals
Radiant Indus Chem
Ashok Alco-Chem
Yuanli Chemical
Hebei Huaxu
Jiangxi Jiangnan
Punjab Chemicals
Thermo Fisher Scientific
Wuxi Yangshan
Sichuan Yinhe
Tanfac Industries
Vishnu Chemicals
Shanxi Ruicheng

Recent Developments

FEBRUARY 2025

A rare earth developer secured reagent supply outside China

A rare earth separation developer contracted oxalic acid supply from a producer outside the dominant producing country, having identified reagent sourcing as a gap in a supply chain otherwise designed to reduce that dependence. This was a supply agreement rather than any equity transaction. Volumes were tied to commissioning.
Signal: Reagent sourcing is emerging as an unexamined dependency inside supply chains built to avoid exactly that
JUNE 2025

A producer evaluated formate route capacity in Europe

A chemical producer began evaluating oxalic acid capacity using a formate-based route that avoids the nitrogen oxide emissions requiring abatement, assessing whether European construction becomes viable without prohibitive environmental capital cost. This was a feasibility study rather than any committed investment. Capital cost comparison drove the study.
Signal: Production route determines where capacity can viably be built, which now carries strategic weight beyond efficiency
OCTOBER 2025

A beekeeping association standardised organic varroa protocols

A national beekeeping association standardised oxalic acid dribble and vaporisation protocols across its membership, following continued synthetic acaricide resistance that had made previous treatment regimes progressively less effective. This was a technical guidance decision rather than any commercial arrangement. Vaporisation protocols were included. Membership guidance followed.
Signal: Acaricide resistance rather than any organic preference drives adoption here, which makes the demand genuinely durable

What Governs Production Cost

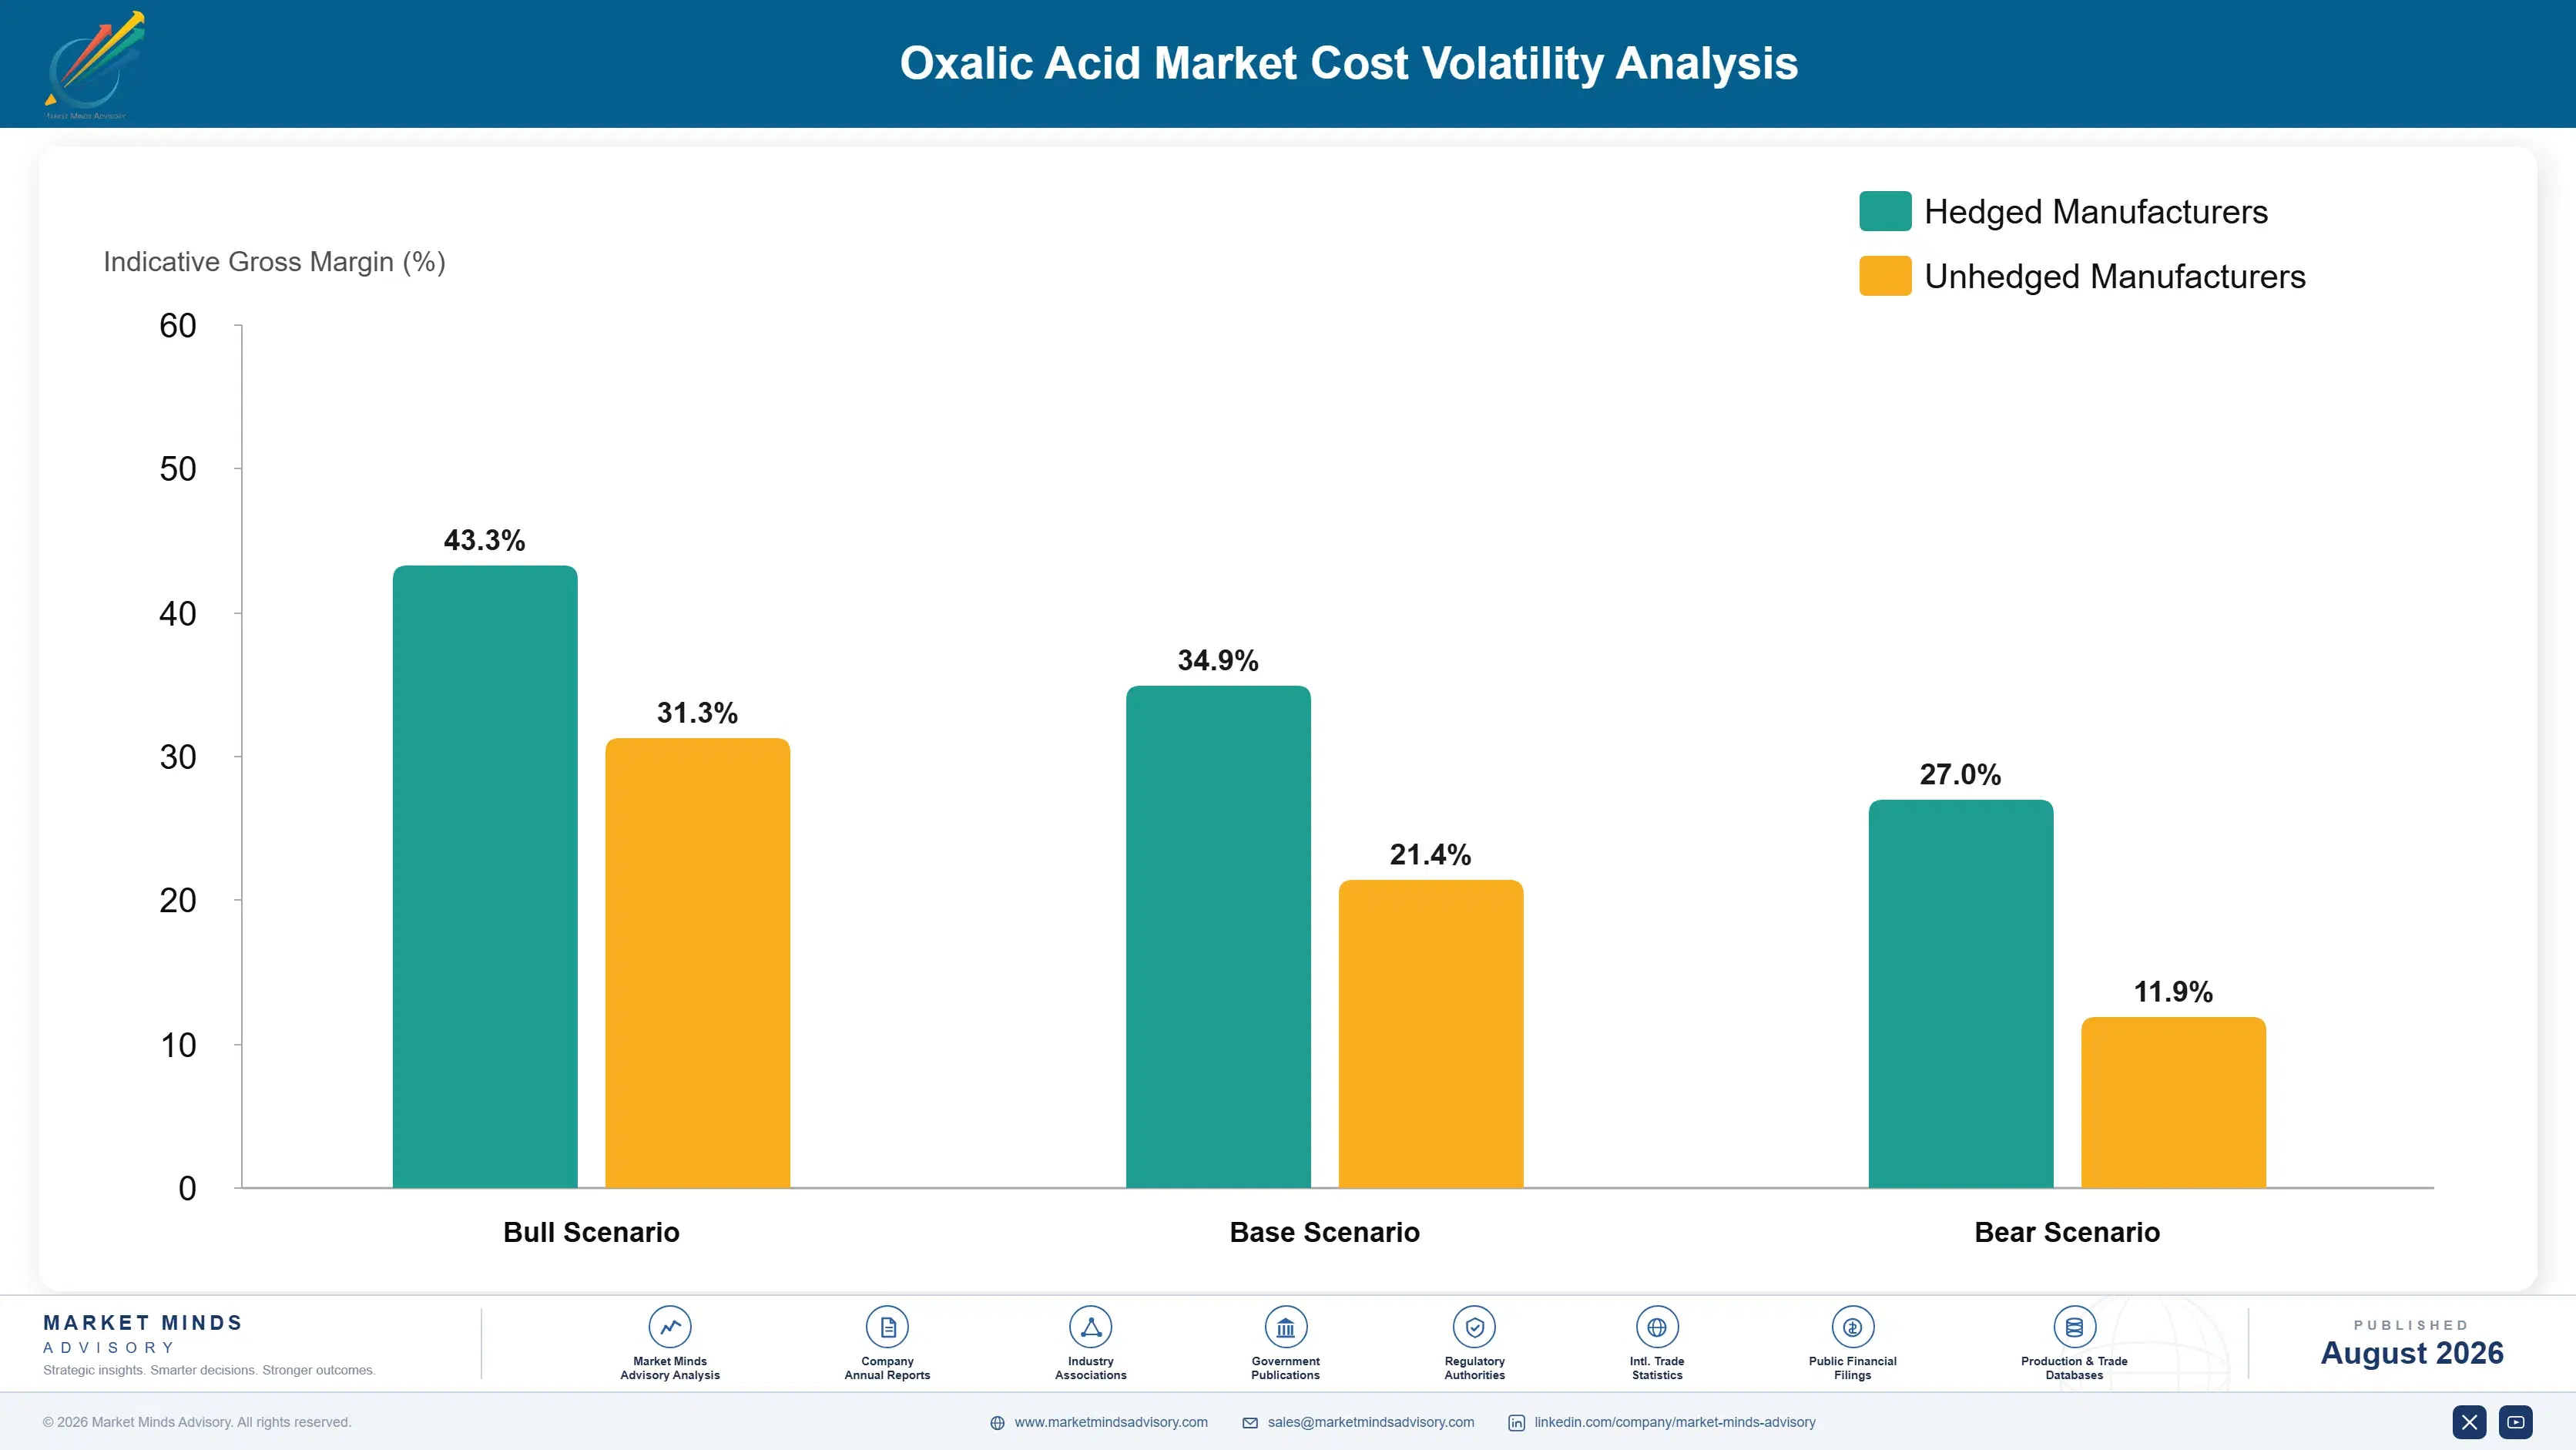
Carbohydrate feedstock, whether corn starch, sugar or cassava depending on the plant, accounts for roughly 34% of production cost on the dominant route. Nitric acid adds around 21% and drives the emission profile as well as the cost. Emission abatement equipment and its operation take about 12% where properly installed, which is precisely the cost Western producers declined to carry when they closed capacity two decades ago.
Feedstock and nitric acid costs rose sharply through 2022 as agricultural commodity and ammonia prices climbed together, and European energy costs made nitric acid particularly expensive there, with IEA data showing industrial gas far above Asian levels. Oxaquim noted energy and raw material cost pressure across its operations in its Annual Report 2022. Producers on annual industrial contracts absorbed most of it during a period when substitution was not available.

The disadvantage falls on producers carrying full abatement obligations, and it appears as capital cost rather than as operating expense. Nitrogen oxide abatement is expensive to install and modest to run, which means the burden lands at construction rather than through the plant's life. That timing is why capacity concentrated where obligations were lighter, and why rebuilding elsewhere needs a different route.
oxalic-acid-market-trends-cost-volatility-analysis-1787559578946

Contract refinery demand conditionally against commissioning dates

Rare earth separation projects have a long history of arriving late, smaller than announced, or not at all, which makes building capacity against announcements genuinely dangerous. Conditional contracts tied to commissioning milestones capture the demand without committing capital against a schedule somebody else controls. Refiners accept those terms because their alternative supply position is worse.

Evaluate formate routes where abatement capital is prohibitive

Carbohydrate oxidation with nitric acid generates nitrogen oxides requiring abatement equipment that is expensive to install and modest to operate, which loads the cost at construction. Formate routes avoid the emissions entirely and change where capacity can viably be built. In a market where production geography now carries strategic weight, that flexibility is worth more than route efficiency alone.

Qualify with refiners before their commissioning schedule tightens

Refiners qualify reagent suppliers on purity because trace contamination carries into the separated oxide, and qualification takes time nobody has once a plant is commissioning. Approaching projects during construction rather than at start-up secures a position competitors cannot displace afterwards. It also reveals which projects are genuinely proceeding, which is useful intelligence in itself.

Portfolio Architecture for Margin Defence

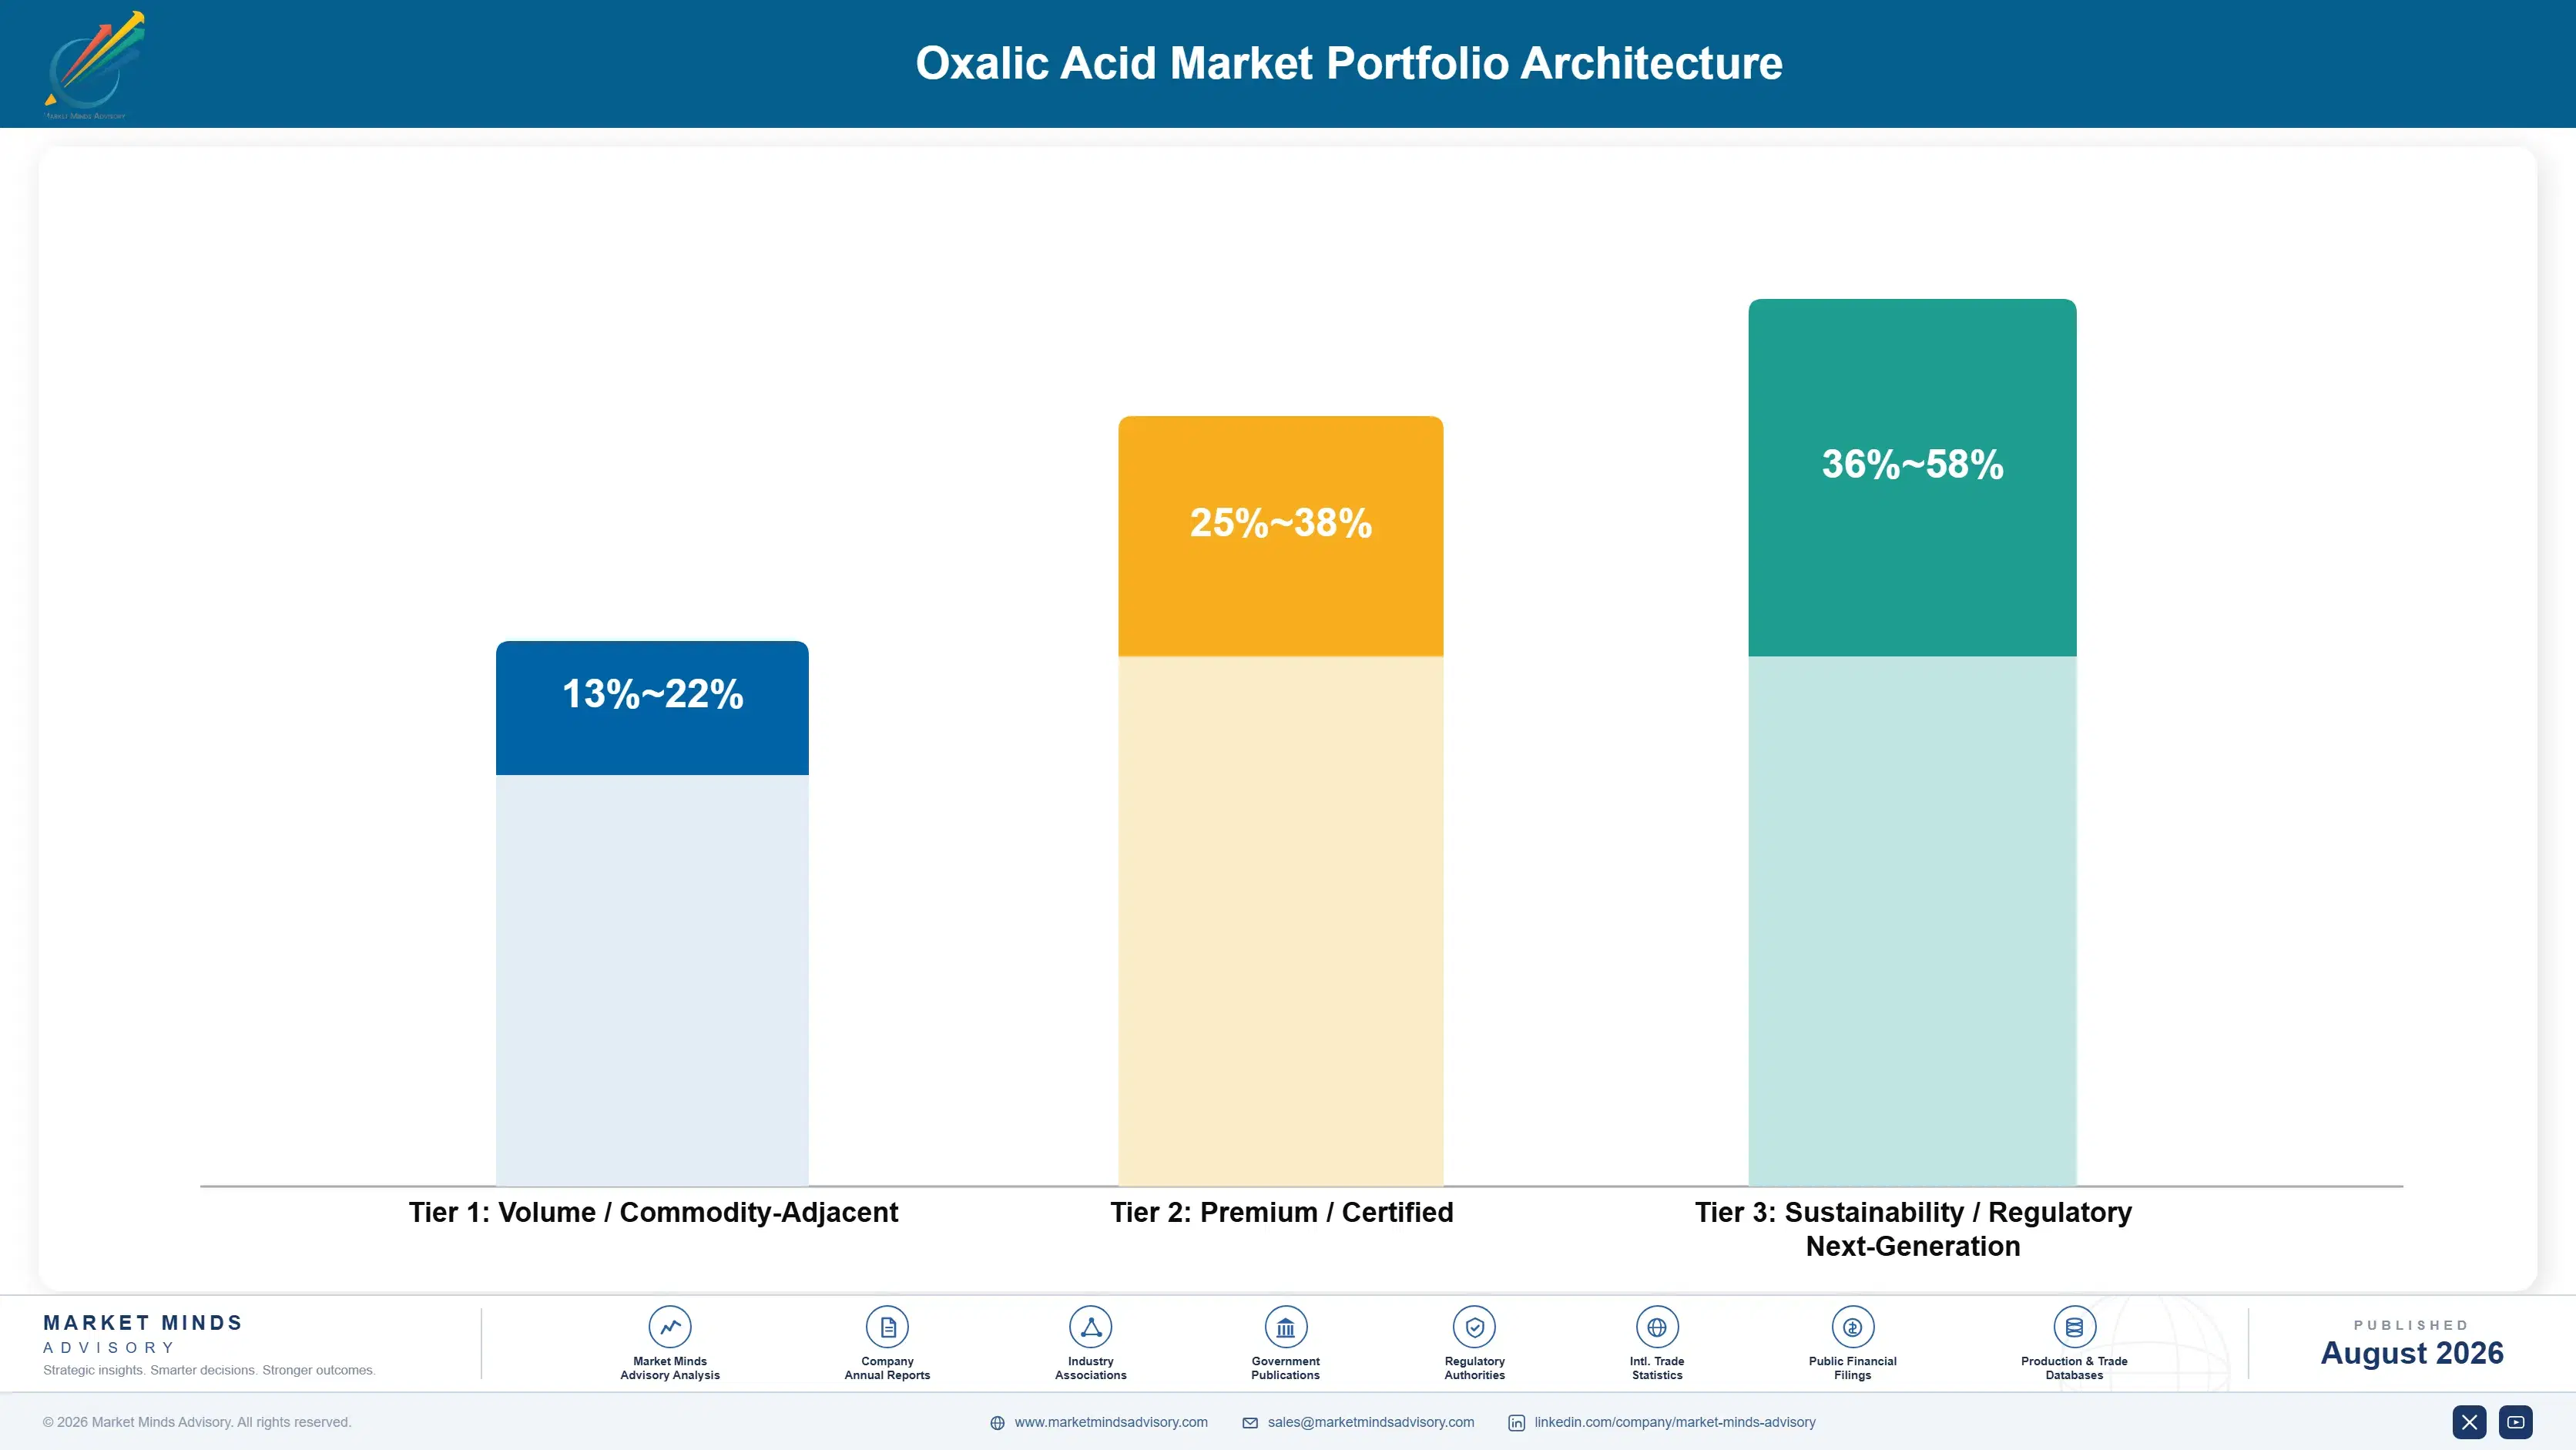
Margin separates on purity and production geography rather than on manufacturing scale, which is a recent development in what was long an ordinary commodity acid. Technical grade material for metal cleaning and textile processing runs at gross margins in the mid teens against Chinese and Indian supply on delivered cost. Stone and restoration grades run similarly. Rare earth reagent grades run considerably higher on purity and qualification. Pharmaceutical grades run highest of all, because impurity profile rather than price governs the purchase entirely.
The tension is that technical grade fills the plant while purity grades and refinery supply earn the return, and moving toward them requires purification capability and customer qualification rather than any capacity investment. Producers weighted toward industrial grades face delivered cost competition from regions with lower feedstock and abatement costs, and no operational improvement closes that gap. Several have concluded that purification investment is unaffordable, which is defensible and leaves the growth elsewhere.

High-value pools sit in rare earth reagent supply outside the concentrated base, pharmaceutical purity grades and beekeeping distribution. Technical grade industrial supply is where geography and feedstock cost have already settled who wins.

Volume / Commodity-Adjacent

Technical grade material for metal cleaning, textile processing and stone restoration sold on delivered cost. The nine-point range separates producers with domestic feedstock and lighter abatement obligations from those carrying full environmental capital cost.
Gross Margin: 13%-22%

Premium / Certified

Rare earth reagent grades and specified industrial purities where trace contamination carries through into a customer's product. The thirteen-point spread reflects purification capability and refiner qualification rather than any production route advantage.
Gross Margin: 25%-38%

Sustainability / Regulatory / Next-Generation

Pharmaceutical purity grades and supply positioned outside the concentrated producing base for strategic customers. The twenty-two-point range is wide because qualification depth and geographic positioning vary enormously between producers and customer programmes.
Gross Margin: 36%-58%
oxalic-acid-market-trends-portfolio-architecture-1787559579441

High-value Sub-segments and Strategic Watch-out

Refinery Reagent Supply

Consuming 2.4 tonnes per tonne of separated oxide across 34% of capacity being built outside the dominant base. Demand arrives on construction schedules, which makes it forecastable provided the projects actually commission. Qualification during construction secures it. Purity requirements are genuinely real. Commissioning decides everything.
Gross Margin: 30%-46%

Pharmaceutical Purity Grades

Growing at 6.8% where impurity profile rather than price governs qualification, since trace metal reaching an active ingredient becomes a regulatory matter. Customers change suppliers extremely reluctantly once qualified. Requalification means analytical and regulatory work nobody repeats willingly for a reagent. Price barely enters the decision.
Gross Margin: 40%-58%

Non-Chinese Production Position

Roughly 63% of capacity sits in one country and refineries built to reduce that dependence need reagent elsewhere. Geographic position now carries strategic value beyond freight and chemistry. Customers will pay rather than undermine their own project rationale entirely. Geography now carries genuine strategic weight.
Gross Margin: 28%-44%

Technical Grade Industrial

The plant volume, competing on delivered cost against regions with cheaper feedstock and lighter abatement obligations. Manage this for feedstock position rather than for margin that geography has already decided. No operational improvement closes a feedstock and abatement gap of that kind. Feedstock position is the only lever.
Gross Margin: 13%-22%

How Reagent Demand Renews

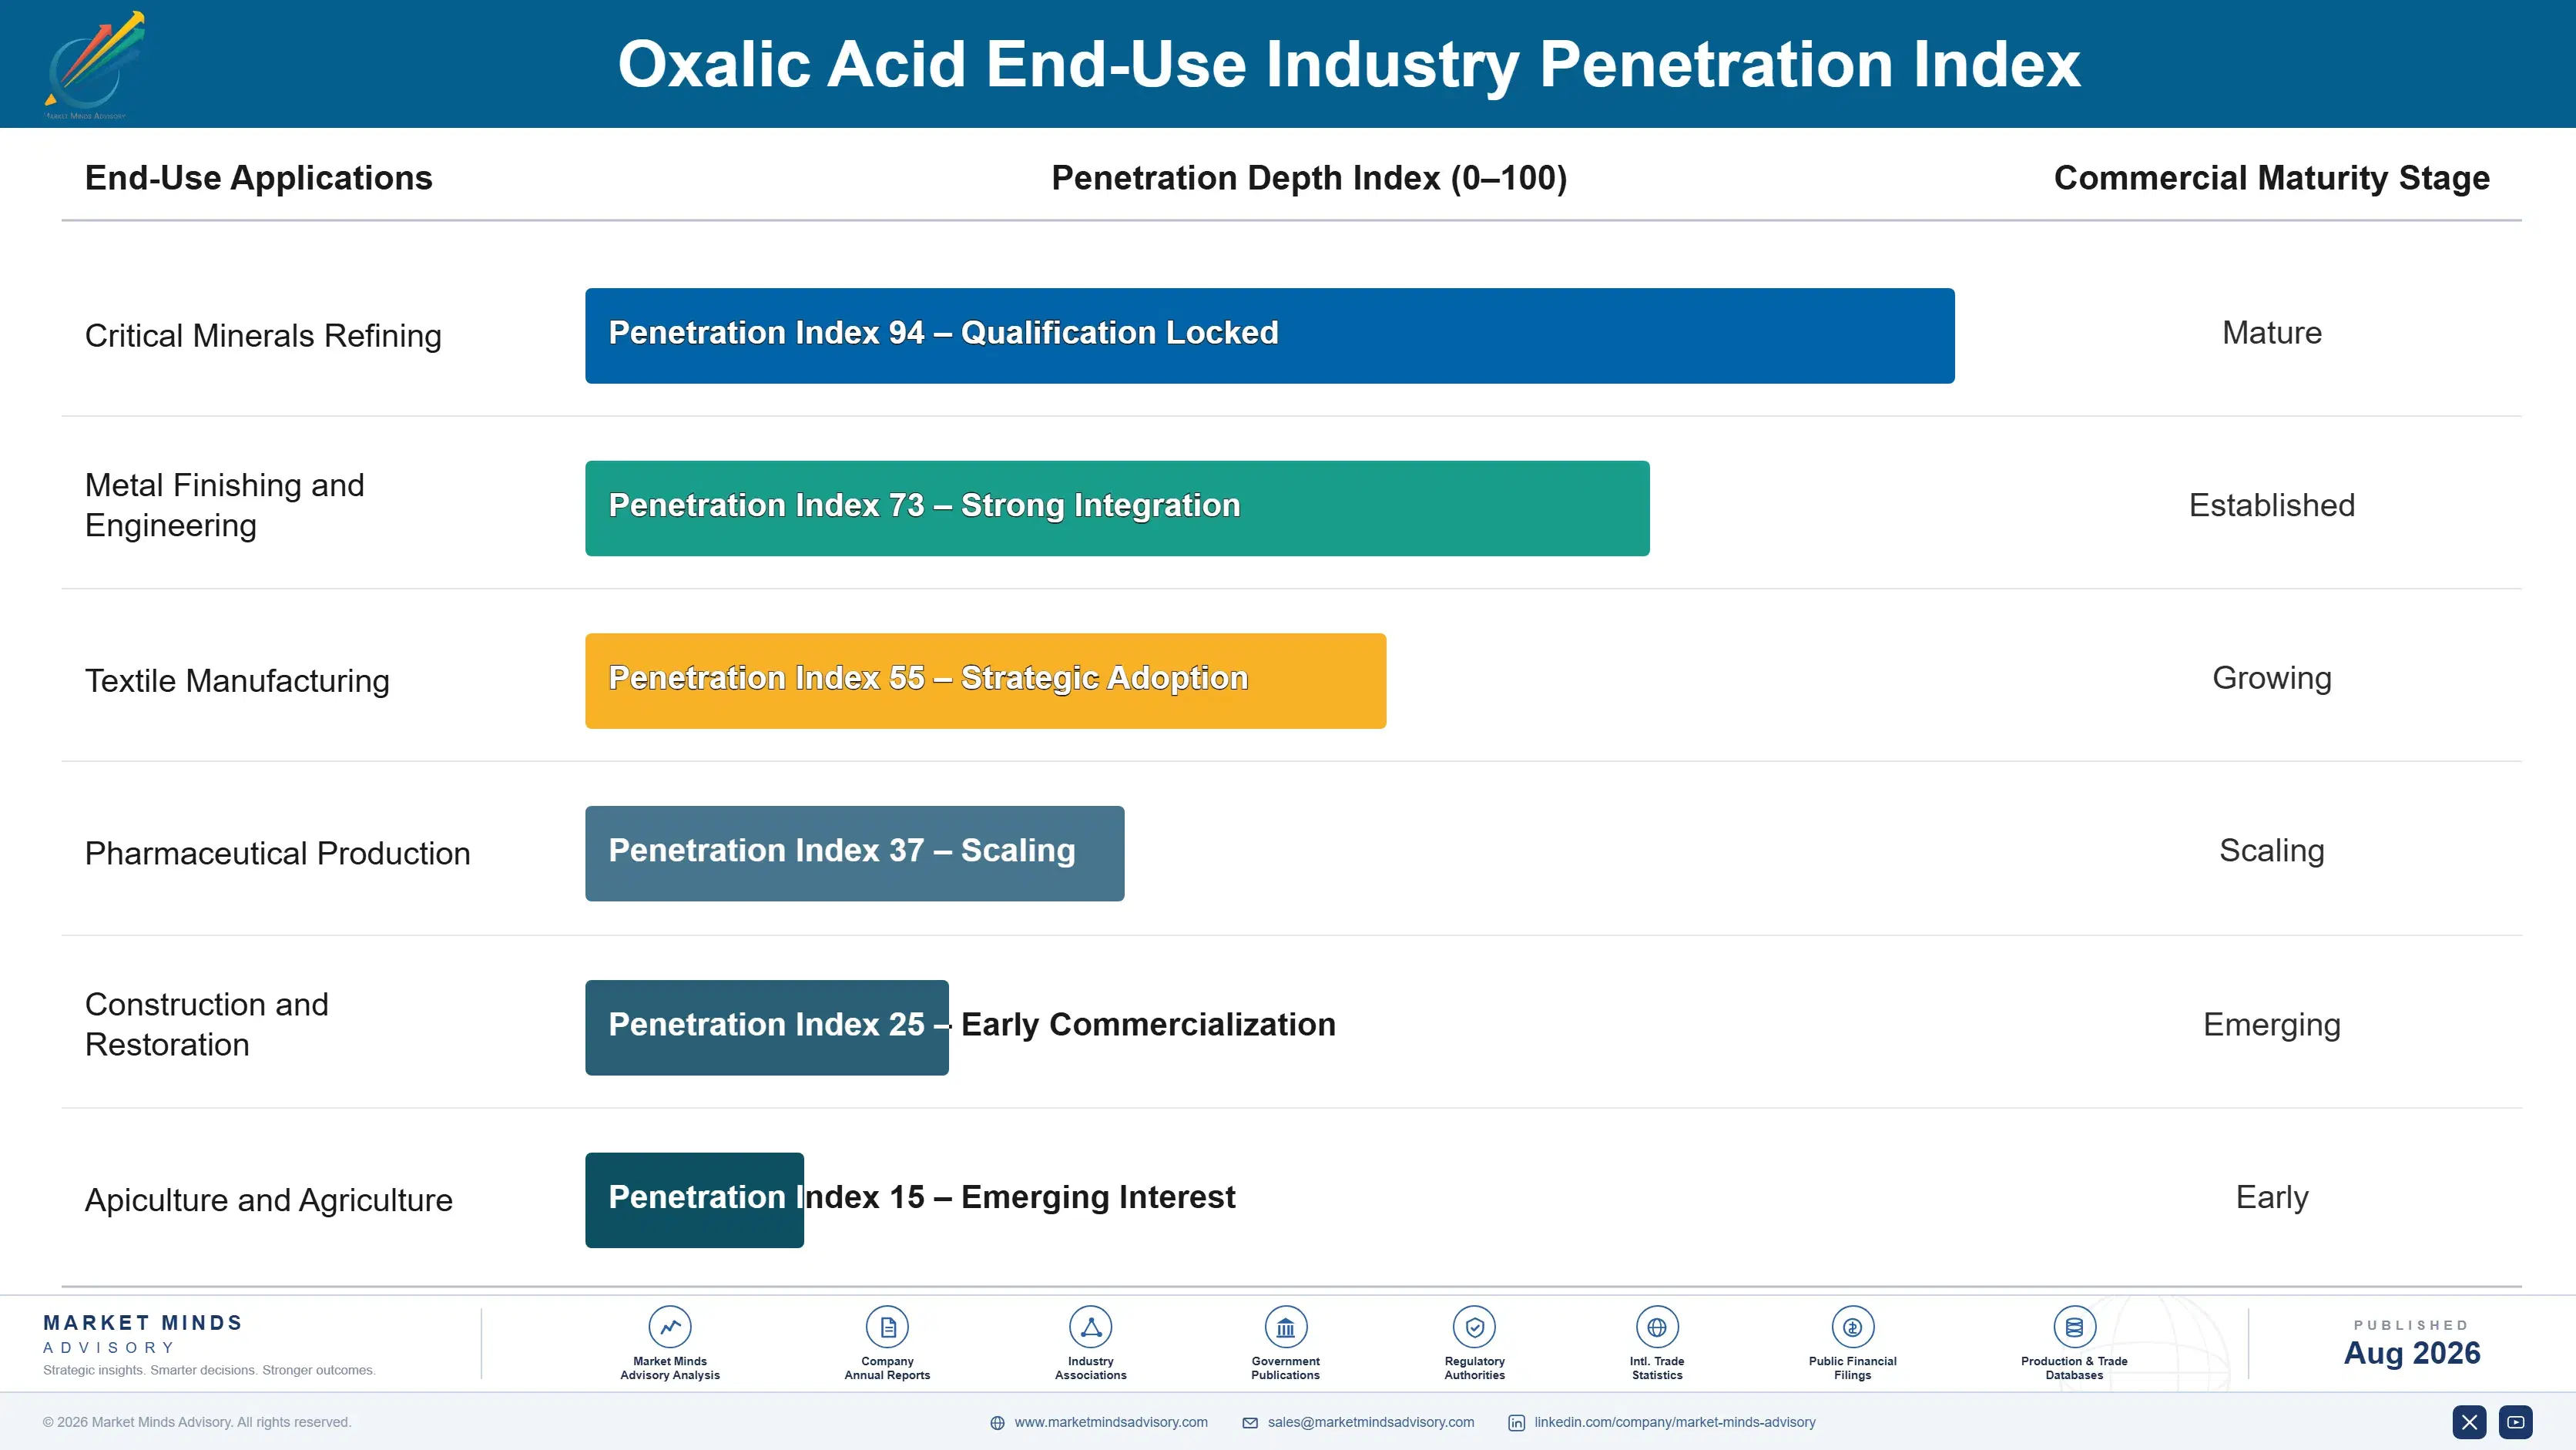
Demand renews per tonne of customer output across most of this market, which produces a steady annuity attached to somebody else's production. Rare earth refining behaves differently and more usefully, since consumption is fixed by process chemistry at roughly 2.4 tonnes of reagent per tonne of oxide rather than varying with operator preference. That makes refinery demand unusually predictable once a plant runs, and entirely dependent on whether it ever does.
Stickiness varies sharply by purity requirement. A pharmaceutical customer that has qualified a supplier on impurity profile changes reluctantly, because requalification means analytical work and regulatory documentation nobody wants to repeat for a reagent. Refiners behave similarly once qualified. Industrial cleaning and textile customers switch on delivered price at every contract, since technical grade material from any competent producer performs identically.

The buyer has changed most at the refining end, and it is a change producers have been slow to notice. Oxalic acid was bought by industrial purchasing on price per tonne. A rare earth project buys it as a critical process input with supply chain security implications, evaluated by people who care where it was made and whether the source undermines the project's entire rationale.
oxalic-acid-market-trends-end-use-penetration-index-1787559579927

Where To Place The Bet

These are among the four positions where our research anticipates prominent divergence between winners and laggards over the coming forecast period. Each is grounded in the demand model, the regulatory perimeter, and the announced capacity pipeline.
01 / REFINERY QUALIFICATION TIMING

Qualify during construction, not at commissioning

Rare earth separation consumes roughly 2.4 tonnes of oxalic acid for every tonne of separated oxide produced, and around 34% of world separation capacity is currently being built outside the dominant producing country with almost no local reagent supply behind any of it. Refiners qualify suppliers on purity because trace contamination carries through into their product, and qualification takes time nobody has available once a plant is commissioning. Approaching projects during construction secures positions competitors cannot displace afterwards and reveals which projects are genuinely proceeding.
02 / GEOGRAPHIC POSITION VALUE

Capacity outside China is now worth a premium

Roughly 63% of world oxalic acid capacity sits in a single country, and the rare earth refineries being constructed specifically to reduce dependence on that country will require this reagent from somewhere other than there. A producer holding capacity anywhere else therefore has a position carrying strategic value well beyond its chemistry or its cost, which is genuinely unusual for a mature commodity acid. Customers building supply chain independence will pay a premium rather than undermine the entire rationale of their own project.
03 / PRODUCTION ROUTE CHOICE

Formate routes decide where you can build

About 71% of world capacity uses carbohydrate oxidation with nitric acid, which generates nitrogen oxides requiring abatement equipment that is expensive to install and modest to operate, loading the cost squarely at construction rather than across the plant's operating life. That timing is precisely why capacity concentrated where obligations were lighter and why Western producers closed rather than reinvested. Formate-based routes avoid the emissions entirely, which changes where capacity can viably be built in a market where geography now carries strategic weight.
04 / PURITY REVENUE STABILITY

Pharmaceutical qualification outlasts every industrial cycle

Fine chemical and pharmaceutical customers qualify oxalic acid suppliers on impurity profile rather than on price, because a trace metal carried into an active pharmaceutical ingredient becomes a regulatory problem rather than merely a quality complaint to be managed. Those customers change suppliers extremely reluctantly once qualification is complete, and the segment compounds at 6.8% regardless of industrial conditions. For a producer exposed to metal processing cycles and to refinery construction timing, that qualified volume is the steadiest revenue available.

Engagement Snapshot From the Field

A live engagement with an industry participant carrying material or product regulatory and market exposure ahead of a defining policy shift, showing how our research translates into a defensible multi-year portfolio strategy.
MARKET MINDS ADVISORY · CLIENT ENGAGEMENT SUMMARY
Oxalic Acid Producer Strategic Portfolio Review and Transition Roadmap 2026·Investment Scenario on Oxalic Acid Exposure Evaluation 2025-26
CLIENT PROFILE
A European chemical producer with organic acid capacity around 28,000 tonnes annually (client-reported, unverified by MMA), examining entry into oxalic acid after exiting the product two decades earlier on abatement cost grounds. No current oxalic capacity existed. Rare earth customers had made informal enquiries about supply. Abatement cost closed the original plant. Enquiries had arrived informally.
STRATEGIC CHALLENGE
Management assumed the abatement economics that closed the original plant still applied and had deferred the question repeatedly. Nobody had assessed whether rare earth refining demand or alternative production routes changed the calculation that had made European production uneconomic before. The assumption had gone untested for two decades. Nobody had revisited it.
MMA APPROACH
MMA sized rare earth reagent demand against announced separation capacity and commissioning schedules rather than against total project announcements. Formate route economics were compared against carbohydrate oxidation including abatement capital. Enquiring customers were assessed for whether supply geography genuinely mattered to their programme. Commissioning records were reviewed. Customer motivations were tested.
KEY FINDINGS
  1. Reagent demand from separation capacity under construction within European reach exceeded the client's proposed plant scale considerably, provided those projects commissioned on anything close to schedule.
  2. Enquiring customers valued non-Chinese supply explicitly rather than incidentally, and several indicated willingness to pay a premium that industrial pricing benchmarks would not have suggested.
  3. Formate route economics changed the calculation materially, since avoiding nitrogen oxide abatement removed the capital burden that had made the original plant uneconomic in the first place.
  4. Announced separation capacity substantially exceeded what commissioning records suggested would actually arrive, so plant scale needed sizing against a discounted schedule rather than the announcements.
CLIENT PROFILE
A European chemical producer with organic acid capacity around 28,000 tonnes annually (client-reported, unverified by MMA), examining entry into oxalic acid after exiting the product two decades earlier on abatement cost grounds. No current oxalic capacity existed. Rare earth customers had made informal enquiries about supply. Abatement cost closed the original plant. Enquiries had arrived informally.
STRATEGIC CHALLENGE
Management assumed the abatement economics that closed the original plant still applied and had deferred the question repeatedly. Nobody had assessed whether rare earth refining demand or alternative production routes changed the calculation that had made European production uneconomic before. The assumption had gone untested for two decades. Nobody had revisited it.
MMA APPROACH
MMA sized rare earth reagent demand against announced separation capacity and commissioning schedules rather than against total project announcements. Formate route economics were compared against carbohydrate oxidation including abatement capital. Enquiring customers were assessed for whether supply geography genuinely mattered to their programme. Commissioning records were reviewed. Customer motivations were tested.
KEY FINDINGS
  1. Reagent demand from separation capacity under construction within European reach exceeded the client's proposed plant scale considerably, provided those projects commissioned on anything close to schedule.
  2. Enquiring customers valued non-Chinese supply explicitly rather than incidentally, and several indicated willingness to pay a premium that industrial pricing benchmarks would not have suggested.
  3. Formate route economics changed the calculation materially, since avoiding nitrogen oxide abatement removed the capital burden that had made the original plant uneconomic in the first place.
  4. Announced separation capacity substantially exceeded what commissioning records suggested would actually arrive, so plant scale needed sizing against a discounted schedule rather than the announcements.
RECOMMENDED STRATEGY
Phase 1: Phase one: size the plant against discounted commissioning schedules rather than announced capacity, since separation projects have a long record of arriving late or not at all. Phase 2: Phase two: commit to the formate production route, which removes the abatement capital that made European production uneconomic when the original plant closed. Phase 3: Phase three: qualify with separation projects during construction rather than waiting for commissioning, securing positions that competitors will not be able to displace later.
OUTCOME
The project proceeded at a scale sized against discounted schedules rather than announcements. Formate route engineering is complete and abatement capital is avoided entirely. Two separation projects have begun qualification during construction, and the client reports committed offtake ahead of plant completion (client-reported, unverified by MMA).

Frequently Asked Questions

Foundational context covering the market sizes, CAGR, scope, country, region and competition that inform every finding below. This section is provided to cover basics and most often pre-purchase conversations, answered from the MMA Primary Research Dataset.

What is the current size of the Oxalic Acid Market?

The market was valued at USD 1.08 billion in 2025, rising to an estimated USD 1.15 billion in 2026. East Asia holds the largest regional share at 46% of value.

How large will the Oxalic Acid Market be by 2036?

MMA forecasts USD 2.14 billion by 2036 under the base case, an expansion multiple of 1.86 times the 2026 value. That represents USD 0.99 billion of incremental value.

What is the CAGR for the Oxalic Acid Market 2026 to 2036?

The base case runs at 6.4% compound annual growth between 2026 and 2036, with a bull case at 7.6% and a bear case at 5.2%. Historical growth from 2020 to 2025 was 4.8%.

Which segment is growing fastest?

Rare earth and metal processing leads at 9.6%, half again the market rate, consuming 2.4 tonnes of acid per tonne of separated oxide. Beekeeping applications follow at 8.2%.

Who are the major companies in the Oxalic Acid Market?

UBE Corporation, Indian Oxalate, Star Oxochem, Shandong Fengyuan and Oxaquim hold 38% of supply. Country concentration matters far more here than any company share does.

Which country is growing fastest?

The United States leads at 9.8%, driven entirely by domestic rare earth separation capacity being built for strategic reasons rather than by any chemical market development.

Report Segmentation Architecture

The full report scope spans multiple orthogonal segmentation dimensions, with cross-tabulated demand data provided for each dimension pair. Coverage extends further to regional breakdowns, trend trajectories, and the competitive detail needed to support segment-level decision-making.

By Application

  • Rare Earth and Metal Processing
  • Metal Surface Treatment and Cleaning
  • Textile Processing and Bleaching
  • Pharmaceutical and Fine Chemical Intermediates
  • Stone, Wood and Surface Restoration
  • Agricultural and Beekeeping Applications

By End-Use Industry

  • Critical Minerals Refining
  • Metal Finishing and Engineering
  • Textile Manufacturing
  • Pharmaceutical Production
  • Construction and Restoration
  • Apiculture and Agriculture

By Production Route and Grade

  • Carbohydrate Oxidation Route
  • Formate Based Route
  • Technical Industrial Grade
  • High Purity Reagent Grade
  • Pharmaceutical Specification Grade

By Region

  • North America
  • Western Europe
  • East Asia
  • South Asia and Pacific
  • Latin America
  • Middle East and Africa
  • Eastern Europe

Scope, Methodology, and Coverage

Every figure in this report is reproducible from documented input assumptions. The scope below maps the historical period, the forecast horizon, the segmentation dimensions, and the countries covered, alongside the underlying primary and qualitative methodology.
Historical Period
2020 to 2025
Forecast Period
2026 to 2036
Base Year
2025 (USD billions; MMA Primary Research Dataset, August 2026)
Market Definition
The market comprises oxalic acid and its principal salts supplied for industrial and specialty use, produced by carbohydrate oxidation or formate-based routes in technical, high purity reagent and pharmaceutical specification grades, across rare earth and metal processing, metal surface treatment and cleaning, textile processing and bleaching, pharmaceutical and fine chemical intermediates, stone wood and surface restoration, and agricultural and beekeeping applications. Value is measured at producer level on tonnage supplied on a dihydrate basis. Oxalate salts sold as separate speciality chemicals, acid generated in situ within a process, other organic acids, and rare earth oxides produced downstream fall outside scope.
Quantitative Units
USD billions (current prices); thousand tonnes dihydrate basis; USD per tonne by grade and application
Segmentation Dimensions
By Application; By End-Use Industry; By Production Route and Grade; By Region
Regions Covered
North America, Western Europe, East Asia, South Asia and Pacific, Latin America, Middle East and Africa, Eastern Europe
Countries Covered
China, Japan, South Korea, Taiwan, India, Thailand, Vietnam, Indonesia, Australia, United States, Canada, Mexico, Brazil, Argentina, Chile, Germany, Spain, France, Italy, Netherlands, United Kingdom, Poland, Czechia, Romania, Turkey, Egypt, Saudi Arabia, United Arab Emirates, South Africa, Malaysia
Key Companies Profiled
UBE Corporation, Indian Oxalate, Star Oxochem, Shandong Fengyuan Chemical, Oxaquim, Merck KGaA, Clariant, GEO Specialty Chemicals, Radiant Indus Chem, Ashok Alco-Chem, Yuanli Chemical, Hebei Huaxu, Jiangxi Jiangnan, Punjab Chemicals, Thermo Fisher Scientific, Wuxi Yangshan, Sichuan Yinhe, Tanfac Industries, Vishnu Chemicals, Shanxi Ruicheng
Quantitative Methodology
Primary survey, n=3,800 respondents, Q4 2025, six countries; demand-side model with trade association cross-validation
Qualitative Methodology
47 expert interviews, Q4 2025; applied to validate demand model assumptions, identify emerging dynamics, and assess competitive positioning
Report Format
PDF and XLSX data workbook (Word format preview document)
Publisher
Market Minds Advisory
Report Code
MMA-2026-CHM-789
Published
August 2026
Contact
sales@marketmindsadvisory.com | www.marketmindsadvisory.com

Purchase the full Oxalic Acid Market Report (2026 to 2036).

The full report sizes the global oxalic acid market to 2036 across six applications and seven regions, measured on dihydrate tonnage at producer level. It treats the acid as a critical minerals reagent rather than a mature industrial commodity, sizing rare earth refining demand against announced separation capacity and realistic commissioning schedules. Competitive analysis covers 20 producers on one consistent tonnage basis, with moat and risk assessment for the two leaders. Production route economics are compared including abatement capital by region. Four quantified revenue levers close the analysis.
Six-application segment sizing with individual growth rates
Rare earth reagent demand modelled against separation commissioning schedules
Production route economics compared including emission abatement capital
Supply geography assessed as a strategic rather than freight consideration
Twenty-producer competitive map on one dihydrate tonnage basis
Four quantified revenue levers with commercial impact ranges

Built For The People Who Decide

From boardroom strategy to bench-side execution, this report is read cover-to-cover by leaders shaping the next decade of their industry, turning demand scenarios, market dynamics and valuation benchmarks into decisions.
CXOs/ Presidents/ VPs/ Managers
M&A and Corporate Development
Strategy Teams and R&D Heads
Procurement and Product Directors
Regulatory and Compliance Leaders
Investor Relations and Equity Analysts