Market Minds Advisory
Over the Top (OTT) Services Market

Over the Top (OTT) Services Market: Over the Top Services Market. Video Streaming, Live Sports, and Audio Platforms, 2026 to 2036

Streaming platforms burning through subscriber growth are pivoting hard toward ad-supported tiers and live sports rights, forcing the entire category to prove sustainable unit economics rather than pure subscriber count growth.

Lead Analyst

Published

September 2026

Make Smarter Decisions with Customized Research Insights

Request a free sample report and evaluate market opportunities, growth trends, and competitive dynamics relevant to your business needs.

2025 MARKET VALUE$58.0BMarket Size 2025
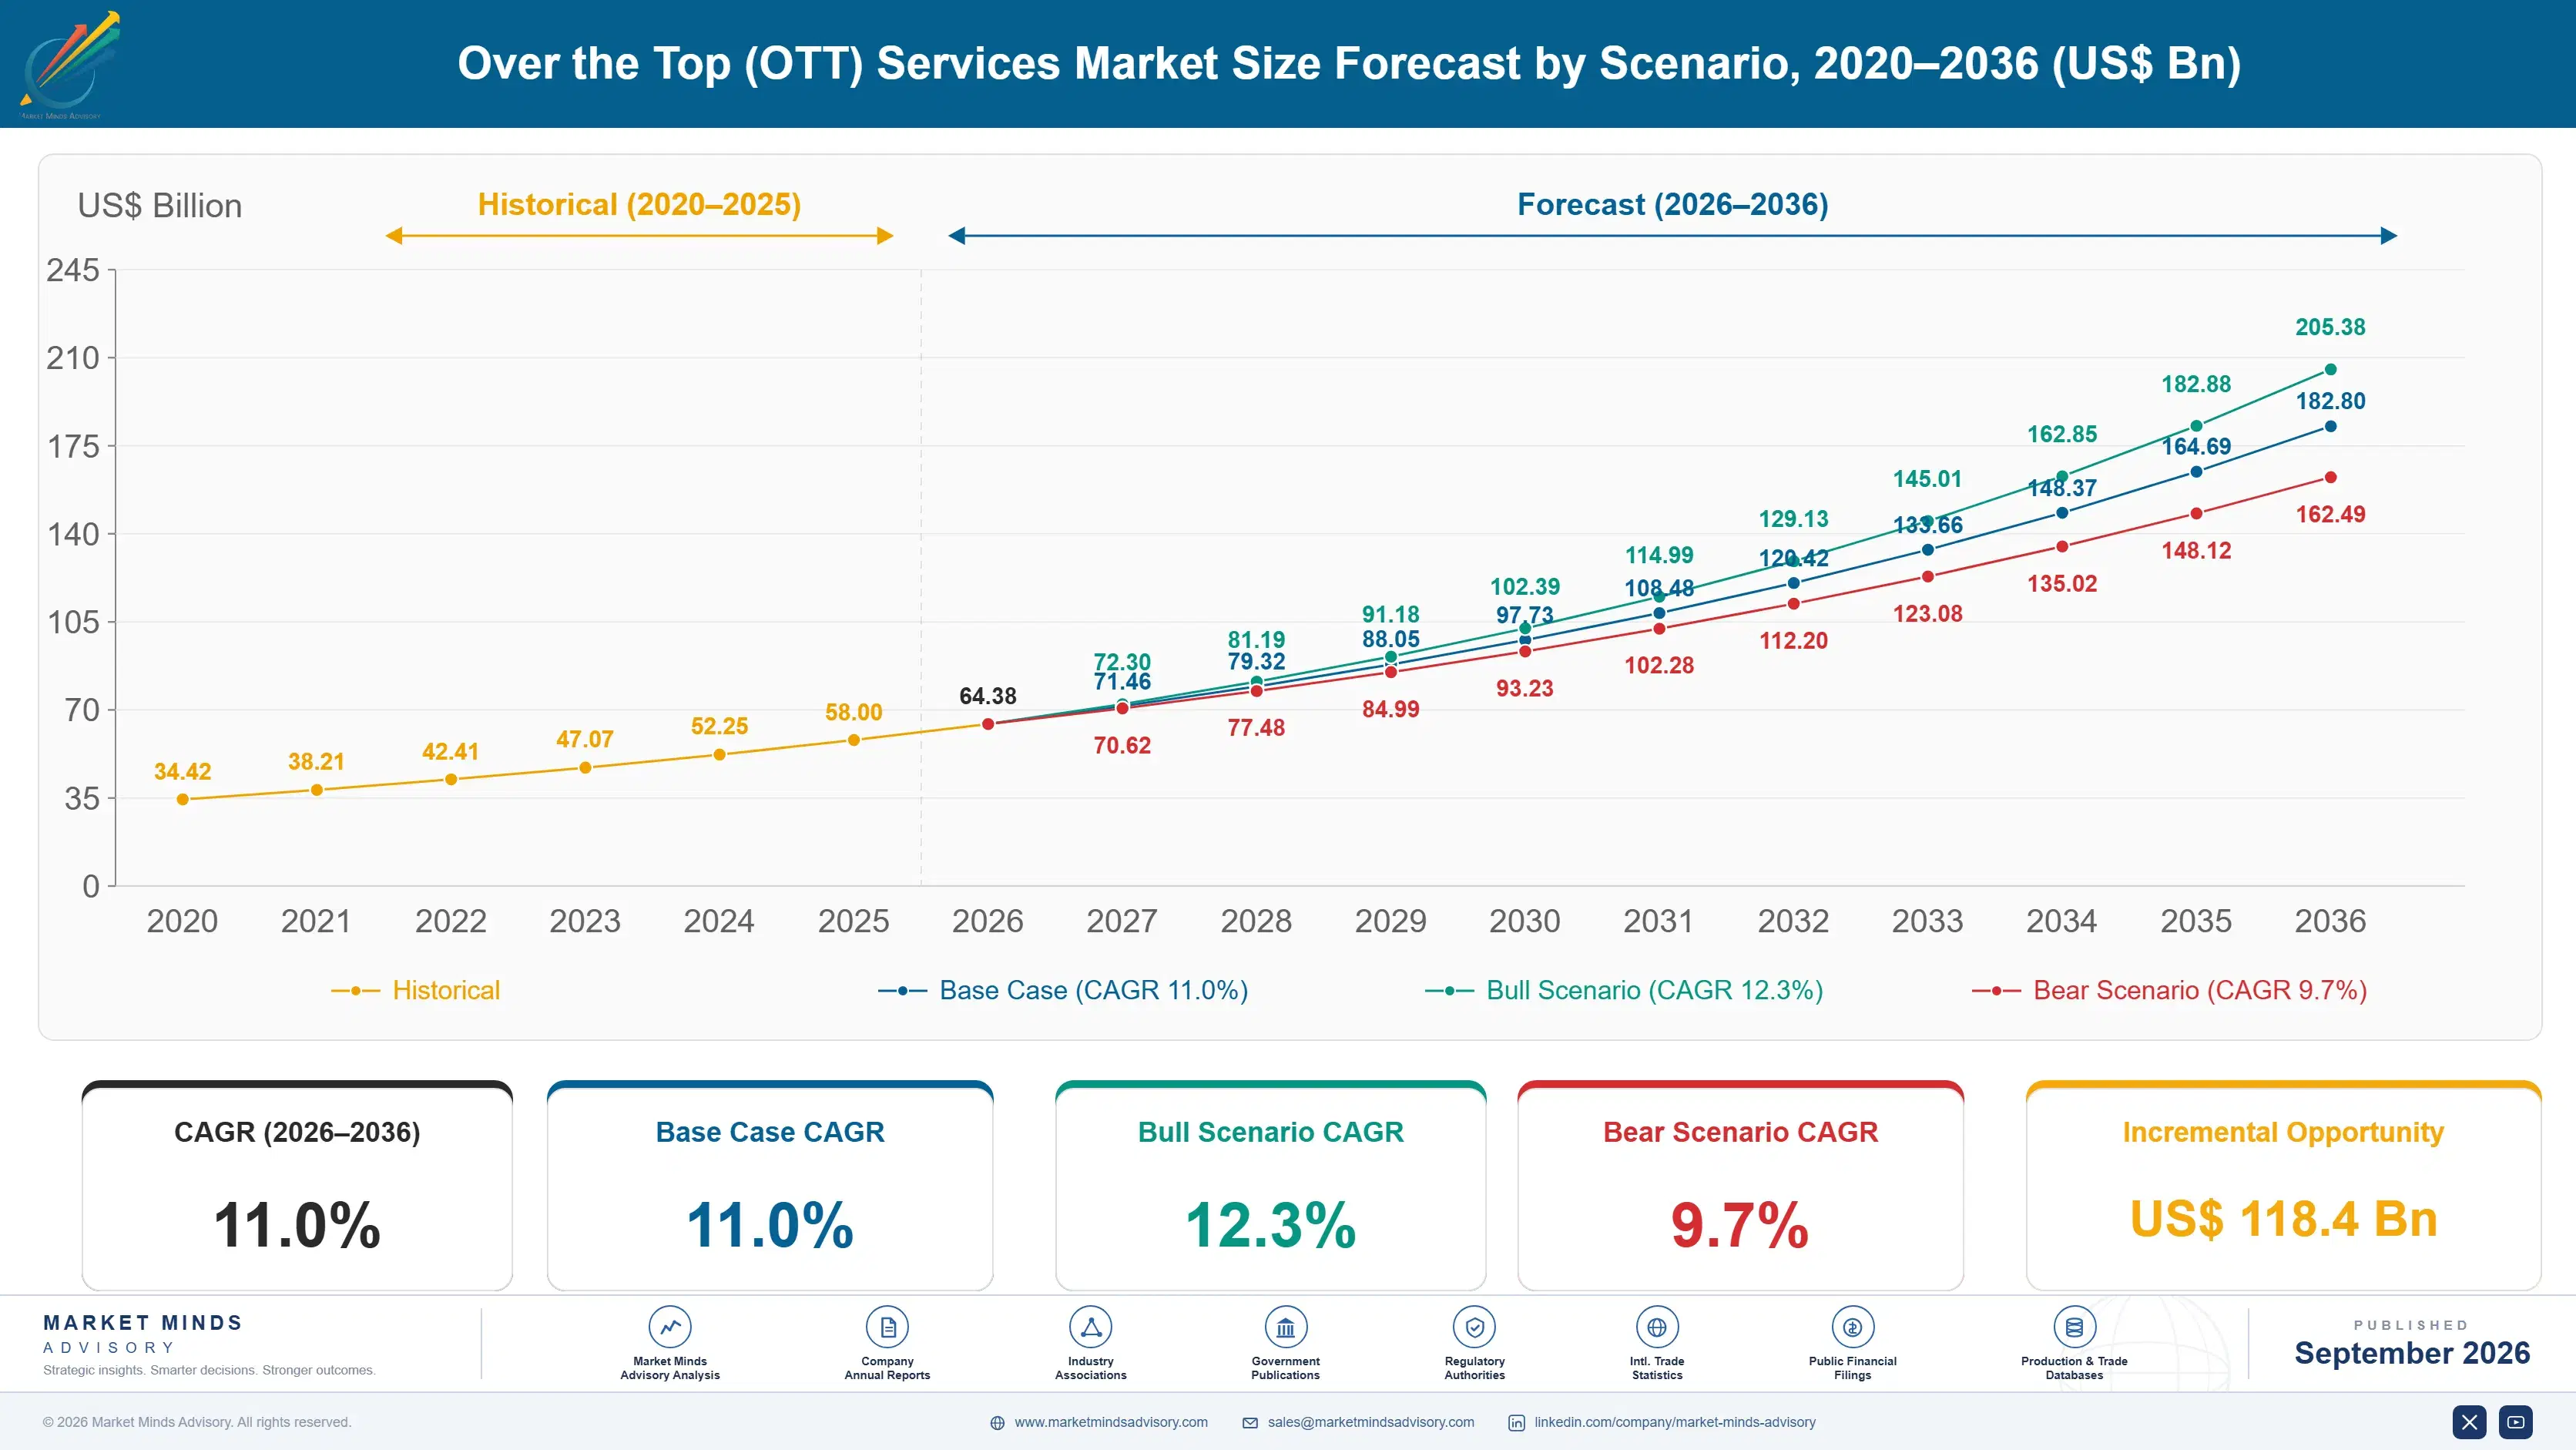
2036 FORECAST VALUE$182.8BBase Case , 2026 to 2036
CAGR 2026 TO 203611.0 %Bull 12.3% / Bear 9.7%
INCREMENTAL OPPORTUNITY$118.4BNet 10- year value creation
EXPANSION MULTIPLE2.84x2036 value over 2026 base
Strategic Levers
M&A Pipeline
Regional Outlook
Country Rankings
Competitive Intelligence
Segmental Deep-dive
Call-Us : 91 93563 13602

Executive Snapshot and Market Trajectory.

Over the top services have matured from a subscriber-growth land grab into a genuine profitability contest, forcing platforms to prove positive unit economics rather than simply accumulating new sign-ups every single quarter across every geographic market they serve worldwide today and well into the future.
Ad-supported video streaming is growing fastest as platforms discover that a meaningful share of price-sensitive households will tolerate advertising in exchange for a lower monthly bill, reaching a customer segment premium-only pricing never reached before across the entire industry. Asia Pacific leads regional demand given its enormous mobile-first population base and rapidly expanding affordable broadband and mobile data infrastructure across densely populated urban and suburban markets nationwide and across the broader region.
Competitive character increasingly centers on live sports rights and exclusive content windows rather than raw content library size, since churn-resistant subscriber bases increasingly form around must-watch live events unavailable anywhere else on a competing platform or service. Platforms bundling live sports, ad-supported tiers, and password-sharing crackdown enforcement win disproportionate share of new subscriber growth and retention across nearly every major national streaming market tracked in this entire study.
Market Definition
The Over the Top Services Market covers internet-delivered video streaming, live sports and event streaming, audio streaming, and OTT messaging platforms distributed directly to consumers without traditional cable, satellite, or telecom carrier distribution. It excludes traditional linear broadcast and cable television, telecom carrier voice and data services, and physical media distribution.
Base Year Value
$58.0B in 2025 (MMA Primary Research Dataset, September 2026)
Forecast Period
2026 to 2036, eleven discrete annual values
CAGR
11.0% base case. Bull 12.3%. Bear 9.7%.
Fastest Growth Segment
Ad-Supported Video Streaming Services: 15.0% CAGR
Fastest Growth Country
Indonesia: 14.0% CAGR
Fastest Growth Region
South Asia and Pacific: 13.0% CAGR
Largest Region
North America: 30% of 2025 global value
Market Leaders
Leading vendors: Netflix, Disney, Amazon, YouTube, Comcast. Source: MMA Primary Research Dataset, July 2026.
Primary Survey
n=3,800 procurement and R&D decision-makers, Q4 2025, six countries
Methodology
Demand-side build-up, cross-validated against public data, 47 expert interviews

Over the Top (OTT) Services Market Forecast Scenarios

over-the-top-ott-services-market-size-forecast-scenario-1789998142691
Growth through 2020 to 2025 was strong as pandemic-era stay-at-home viewing accelerated subscriber acquisition across nearly every major platform operating worldwide, a surge that proved partially temporary as growth normalized once households returned to pre-pandemic entertainment habits and discretionary spending patterns seen across most developed streaming markets over the following several years and well beyond.
Base case growth through 2036 rests on three commercial mechanisms: continued migration of live sports rights from traditional broadcast to streaming platforms as media rights contracts renew on multi-year cycles across every major sport, expanding ad-supported tier adoption capturing price-sensitive households that premium-only subscriptions never reached before, and growing emerging market broadband penetration bringing hundreds of millions of new households within reach of affordable streaming services for the first time in their lives.
A bull scenario turns on faster advertising technology maturation that lets ad-supported tiers command premium advertising rates comparable to traditional television, meaningfully improving overall platform profitability across the sector. The bear risk is that subscription fatigue and password-sharing crackdown backlash push consumers to consolidate spending onto fewer platforms, compressing the addressable market for smaller and mid-tier streaming services specifically.

The Retention Economics Behind Every Streaming Subscription

Platforms no longer compete primarily on raw content library size or subscriber count growth alone, since streaming has matured past the land-grab phase into a genuine retention contest across nearly every major market, but rather on how effectively a platform keeps a subscriber engaged month after month without churning to a competing service entirely.
MARKET CONCENTRATIONCR5: 42%Top five platforms hold well under half of all spending
AVERAGE MONTHLY SUBSCRIPTION PRICE$9.80Typical blended price across ad-free and ad-supported tiers
TOP CONSUMING COUNTRY SHAREUSA: 27%Reflects concentration of premium content spending and subscribers
MONTHLY SUBSCRIBER CHURN RATE4.2%Typical benchmark platforms cite for voluntary cancellation activity
AD-SUPPORTED TIER ADOPTION38%Share of new subscriptions choosing the ad-supported pricing option
CONTENT SPEND SHARE42%Reflects programming investment as share of total platform expense
Pricing has fragmented from a single flat monthly fee into multi-tier structures spanning ad-supported, ad-free, and bundled premium options, since platforms increasingly recognize that different households have genuinely different willingness to pay for the identical underlying content library across the same market. Platforms offering flexible tier structures and password-sharing enforcement report meaningfully better revenue per subscriber than those clinging to a single pricing option year after year.
Live sports rights have become the single largest differentiator behind subscriber acquisition and retention, since must-watch live events create a churn-resistant subscription anchor that on-demand content libraries alone rarely achieve on their own across a full calendar year. Platforms securing exclusive sports rights report noticeably lower churn rates during the contracted season than platforms relying entirely on scripted and unscripted on-demand programming alone to retain subscribers.
"Nobody wins by adding a million subscribers who cancel after the free trial. The platforms winning this decade are the ones engineering their content calendar around retention, not acquisition."
Practice Lead, Media Streaming and Digital Entertainment Research · MMA Technology Practice · September 2026

Market Trends

Password-Sharing Crackdowns Convert Free Riders Into Payers

Major platforms have shifted decisively from tolerating widespread password sharing toward actively enforcing single-household account restrictions, converting millions of previously free viewers into paying subscribers or ad-supported tier signups rather than continuing to absorb the lost revenue indefinitely across every market served worldwide today and going forward. Roughly 38 percent of former password-sharing households in markets where enforcement launched had converted to a paid account within six months, according to platform-disclosed conversion tracking reviewed by MMA analysts across several major streaming services that implemented enforcement programs and monitored the results closely.
Market Impact: 4.8 million households cut the cord
Live Sports Rights Migrate From Broadcast to Streaming

Major sports leagues have increasingly moved marquee game packages away from traditional broadcast and cable television toward exclusive or semi-exclusive streaming distribution deals, reflecting both higher rights fees streaming platforms can afford to pay and younger viewer habits shifting decisively away from traditional pay television subscriptions entirely and permanently across most age groups. Roughly 42 percent of major professional sports league media rights deals signed in 2025 included a streaming-exclusive or streaming-first component, up sharply from under 15 percent just three years earlier as the shift accelerated considerably across the industry.
Market Impact: 210 million connections added in 2025

Market Opportunities and Growth Drivers

Cord-Cutting Continues Shifting Household Entertainment Budgets

Traditional pay television subscriptions continue declining across most developed markets as households increasingly find streaming services deliver comparable or superior content at a fraction of the monthly cable bundle cost, redirecting entertainment spending away from legacy distribution entirely toward direct-to-consumer platforms and services across the entire global media industry. Roughly 4.8 million US households cancelled traditional pay television service during 2025 according to industry subscriber tracking, continuing a sustained multi-year decline that shows no meaningful sign of reversing as streaming alternatives keep improving their content offerings and value proposition considerably.
Market Impact: Up to 30% cycle subscriptions seasonally

Emerging Market Broadband Expansion Reaches New Subscribers

Rapidly expanding affordable broadband and mobile data infrastructure across emerging markets in Asia Pacific, Latin America, and parts of Africa is bringing hundreds of millions of households within reach of streaming services for the first time in their entire lives, creating a genuinely large untapped subscriber base that developed markets no longer offer at meaningful scale today or in the future. Roughly 210 million new broadband connections were added across emerging markets during 2025 according to telecommunications infrastructure tracking, directly expanding the addressable population for affordable, mobile-optimized streaming subscription tiers.
Market Impact: Search now spans 3 platforms

Market Restraints and Challenges

Subscription Fatigue Pushes Consumers to Consolidate Spending

Households increasingly report feeling overwhelmed by the sheer number of streaming subscriptions available, prompting a growing share to cancel one or more services periodically rather than maintaining every subscription simultaneously as new platforms continue launching. The root cause is that the total monthly cost of subscribing to every major platform now approaches or exceeds the traditional cable bundle these services originally promised to replace entirely. Some households now report cycling subscriptions on and off seasonally, subscribing only during a specific show's release window before canceling immediately afterward. Platforms have responded with exclusive content designed to reduce seasonal cancellation.
Market Impact: 38% of accounts converted to paid

Content Licensing Fragmentation Frustrates Subscriber Search Experience

Content that once lived on a single platform has scattered across numerous competing services as media companies pulled licensed titles back to launch their own direct-to-consumer platforms, forcing consumers to subscribe to multiple services just to access content previously available in one place. The underlying cause is that media companies discovered greater long-term value in controlling their own content distribution than in licensing revenue from competitors. This fragmentation routinely frustrates subscribers who cannot find a specific title without checking several different platforms first. Some third-party aggregator apps now attempt to solve this discovery problem across multiple subscriptions simultaneously.
Market Impact: 42% of deals now streaming-first
4 additional market trends, 3 additional growth drivers, and 3 additional restraints and challenges are covered in the full report. Contact sales@marketmindsadvisory.com to access the complete intelligence.

Segment CAGR and Growth Architecture

The market splits by content and service type rather than by delivery device or subscription model, since content acquisition costs, pricing structures, and competitive dynamics vary sharply across each specific category and use case. Six categories cover the field: video streaming, live sports and event streaming, audio streaming, OTT messaging, cloud gaming, and advertising technology.
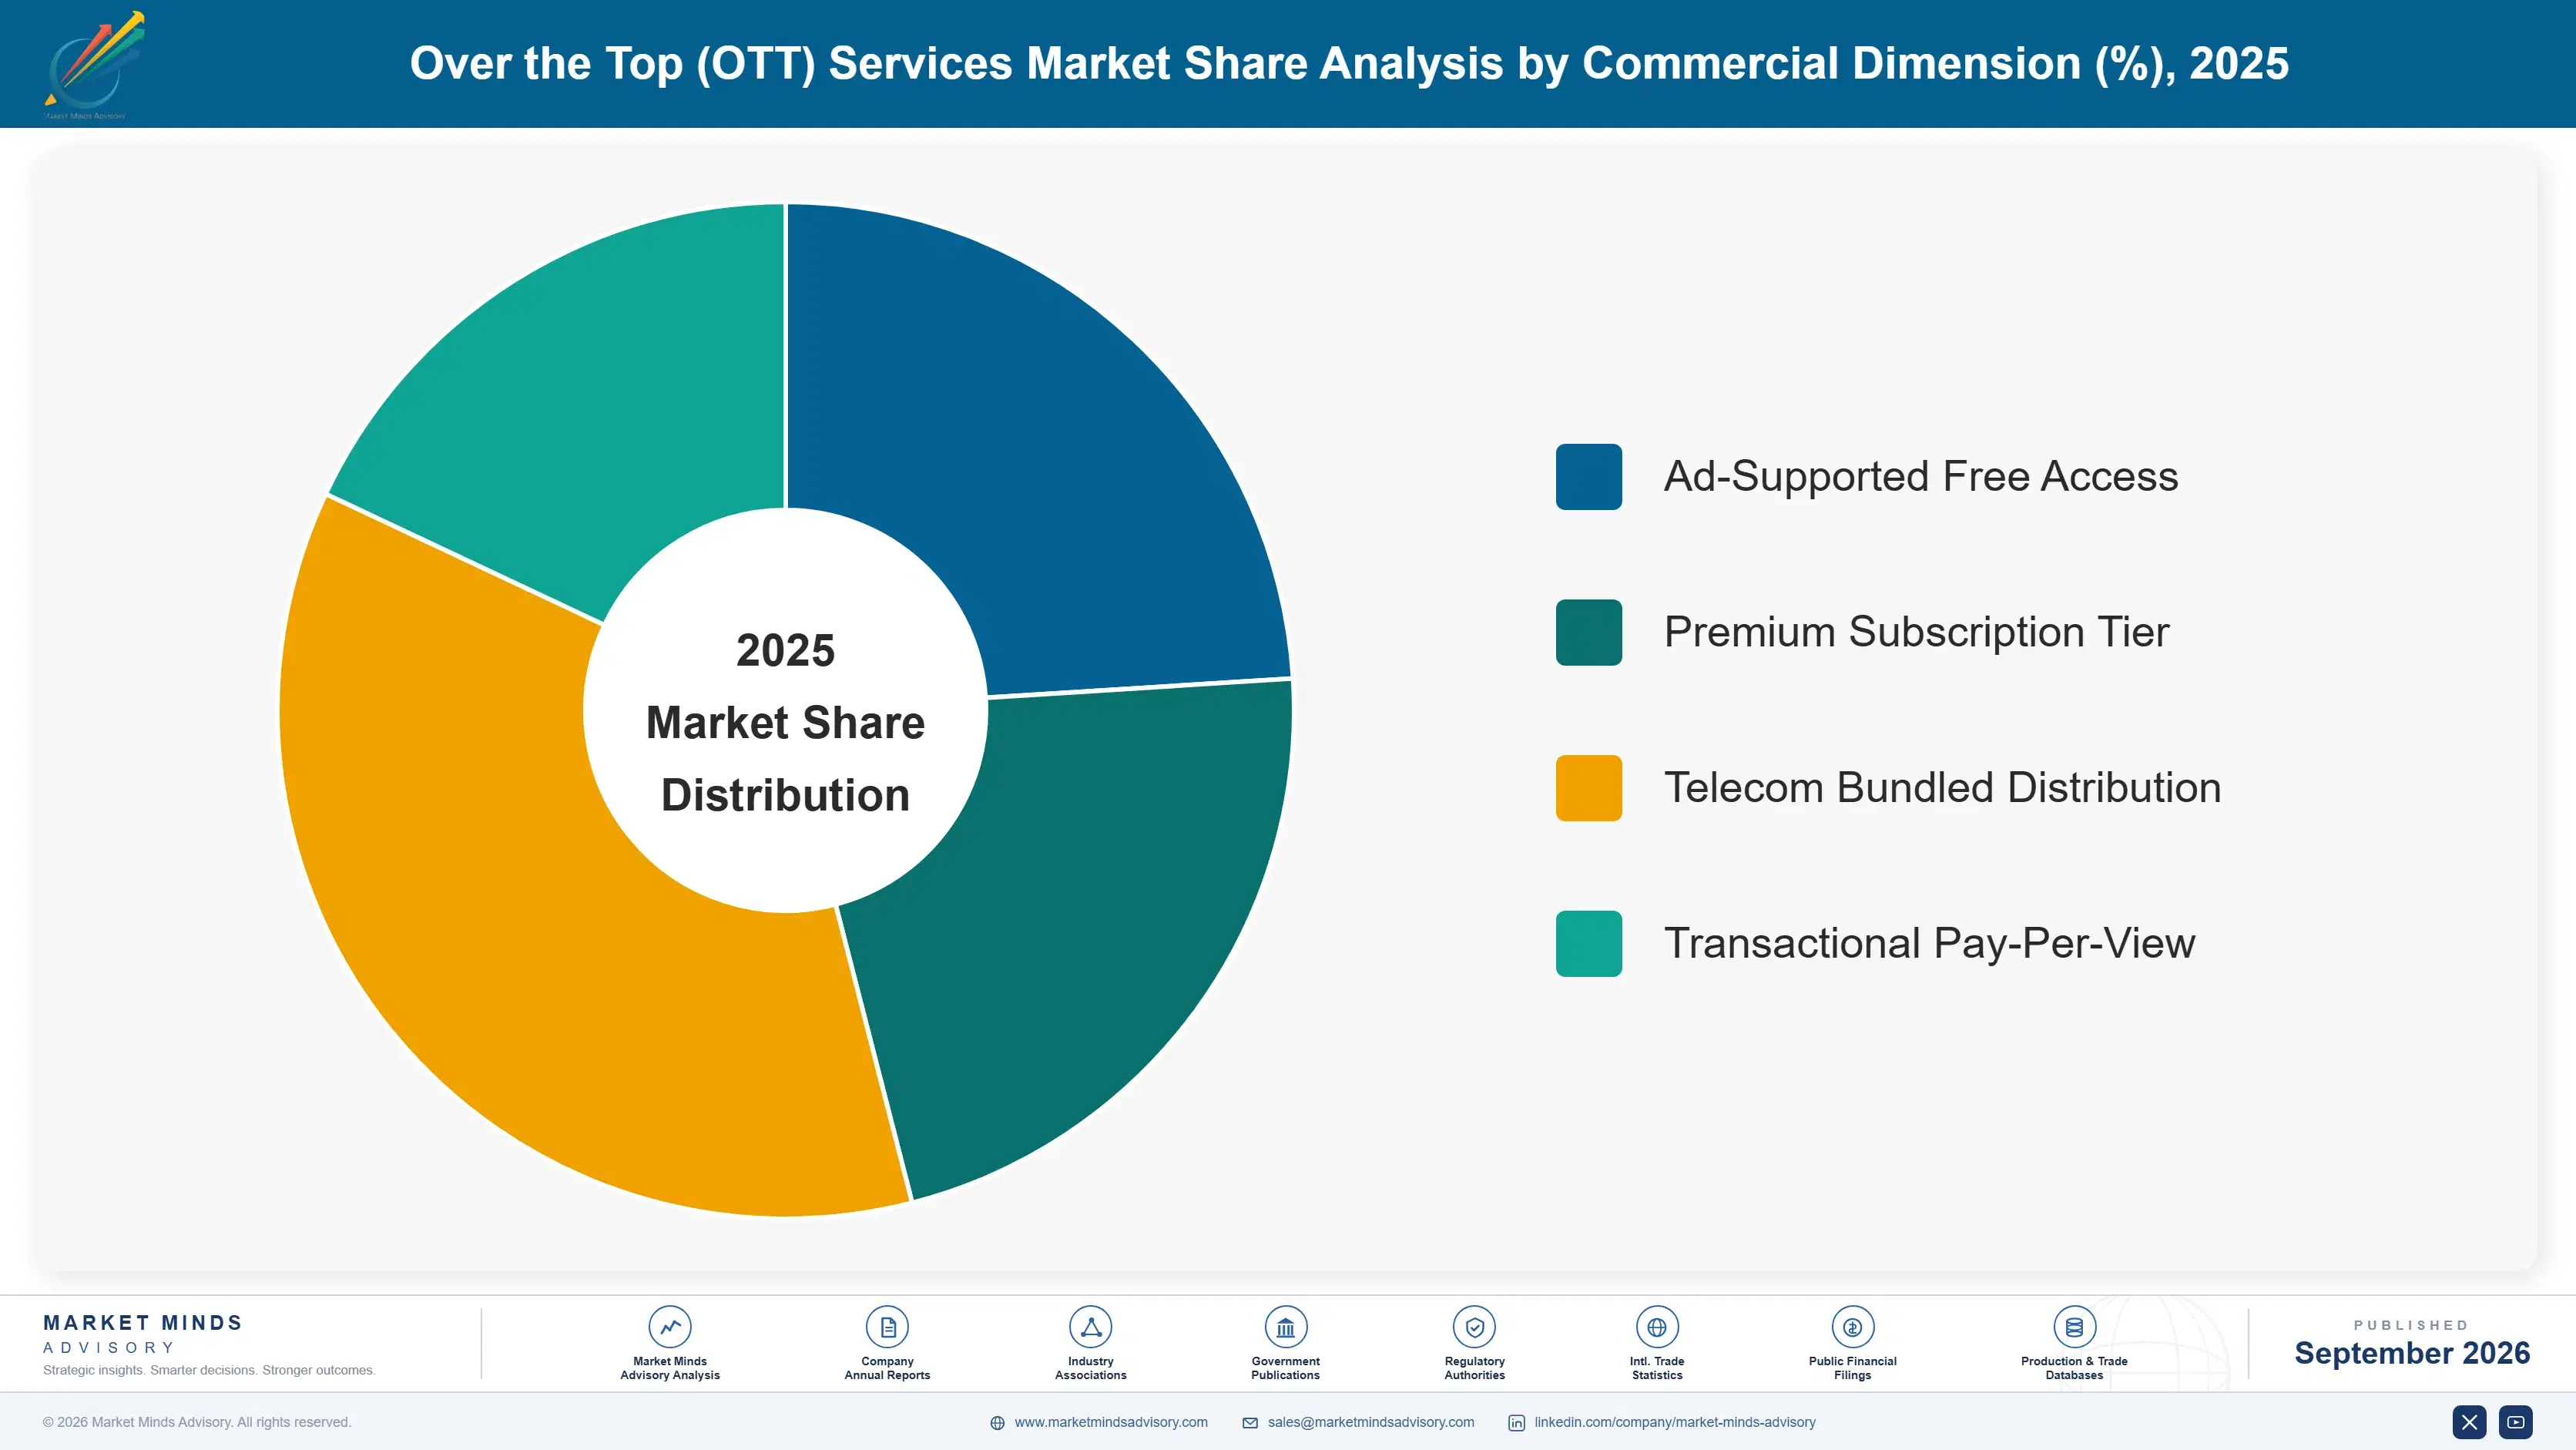
over-the-top-ott-services-market-market-share-analysis-1789998143255

Ad-Supported Video Streaming Services

Ad-supported video streaming is the fastest-growing category by a wide margin, driven by platforms discovering that a meaningful share of price-sensitive households will tolerate advertising in exchange for a lower monthly bill, reaching a customer segment premium-only pricing structures never reached at all. Adoption started among budget-conscious younger households but has spread rapidly into broader demographic segments as ad load and targeting quality both improved considerably over the past several years. Pricing has shifted from a single flat subscription fee toward multi-tier structures, and platforms increasingly bundle ad-supported access with retail loyalty programs and telecom carrier partnerships rather than selling the tier as a standalone subscription product to the same household.
CAGR 15.0%

Live Sports and Event Streaming

Live sports and event streaming addresses a genuinely distinct commercial need, since must-watch live content creates a churn-resistant subscription anchor that on-demand libraries alone rarely achieve, commanding premium advertising rates and subscription pricing that scripted programming simply cannot match consistently across any comparable content window. Adoption has concentrated among platforms securing exclusive or semi-exclusive rights to marquee professional and collegiate sports properties as leagues increasingly favor streaming distribution over traditional broadcast deals. This category commands premium content acquisition costs relative to general entertainment programming given the intense bidding competition among platforms, and vendors report that sports rights increasingly determine subscriber acquisition success more than any other single content category available.
CAGR 14.0%
Full segment breakdown across 6 segments available in the complete report.

Regional Architecture and Country Demand Map

North America leads on premium content spending and subscriber revenue concentration, Indonesia leads on the fastest growth rate through mobile-first broadband expansion, and South Asia and Pacific broadly contributes the largest emerging subscriber base tied to affordable mobile connectivity investment expanding rapidly across every market.

North America

US and Canadian households account for the single largest concentration of premium OTT subscription spending anywhere, reflecting both high average revenue per subscriber and the concentration of leading platforms' domestic content investment and exclusive sports rights portfolios. Live sports streaming has driven especially strong growth as major professional leagues shift marquee game packages toward streaming-exclusive distribution deals valued in the billions of dollars. Canada follows a similar consumption pattern on a smaller population base. The region's premium pricing power reflects genuine willingness to pay for exclusive content rather than any unique distribution advantage held only by domestic platforms specifically. Streaming bundling with wireless carrier plans has separately added a meaningful acquisition channel.
Share: 30% | CAGR: 10.0% (2026 to 2036)

Western Europe

Germany, France, and the United Kingdom lead regional adoption, though local content quotas and language localization requirements have pushed platforms to invest meaningfully in original regional programming rather than relying entirely on imported English-language content. The sports streaming segment across the region has grown steadily as domestic football leagues increasingly favor streaming distribution alongside traditional broadcast partnerships. Growth trails North America and Asia Pacific meaningfully since the region's population growth and broadband penetration ceiling limit additional subscriber acquisition opportunity compared with faster-growing emerging markets elsewhere in the world. Nordic countries have moved fastest within the region on ad-supported tier adoption specifically. Italian and Spanish subscribers show similar football-driven sports streaming demand patterns.
Share: 18% | CAGR: 9.5% (2026 to 2036)
Regional intelligence for 5 additional markets available in the complete report: East Asia, South Asia and Pacific, Latin America, Middle East and Africa, Eastern Europe. Contact sales@marketmindsadvisory.com.
over-the-top-ott-services-market-country-cagr-analysis-1789998143825

Where Streaming Platforms Actually Make Money

Subscription revenue alone increasingly fails to fund the content spending arms race, so the strongest performers capture additional margin through advertising technology, password-sharing enforcement, content licensing, and bundled distribution partnerships layered on top of the base subscription fee rather than through subscriber count growth alone across every market served and content category offered today.

Monetize Ad-Supported Tier Inventory at Premium Rates

Platforms that build sophisticated first-party viewer data and targeting capability into their ad-supported tier capture advertising rates running 25 to 35 percent higher than generic programmatic inventory sold without audience targeting precision available elsewhere. This pricing power stems directly from platforms knowing exactly what each household watches, letting advertisers target audiences with a level of precision traditional television advertising could never match at comparable scale and cost efficiency. Contract renewal conversations with advertisers increasingly start from this targeted baseline directly rather than from a generic, untargeted rate card negotiation process.
Market Impact: Targeted ad rates run 25 to 35% more

Enforce Password Sharing Restrictions to Convert Free Riders

Platforms that actively enforce single-household account restrictions convert a meaningful share of previously free viewers into paying subscribers, adding 8 to 12 percent to total subscriber revenue within the first year of enforcement launch according to platform-disclosed conversion data reviewed by analysts. This revenue capture requires minimal incremental content investment, since the newly converted subscribers were already consuming the platform's existing content library without paying directly for access. Renewal rates among these newly converted accounts run noticeably higher than average across the entire broader subscriber base tracked closely over time.
Market Impact: Enforcement adds 8 to 12% more subscriber revenue

License Content Internationally to Smaller Regional Platforms

Major platforms increasingly license completed original content to smaller regional streaming services and traditional broadcasters in markets where they lack direct distribution presence, capturing incremental revenue worth 10 to 15 percent of a title's original production budget without any additional content investment required at all. This licensing model monetizes content a second time after its exclusive window on the originating platform expires, extending the useful commercial life of expensive original productions considerably. Larger content libraries with proven international appeal routinely generate revenue well above this stated baseline figure each year.
Market Impact: Licensing recovers 10 to 15% more production value

Bundle Distribution Through Telecom Carrier Partnerships

Platforms increasingly bundle subscriptions directly into telecom carrier wireless and broadband plans, capturing new subscribers at a meaningfully lower acquisition cost than direct marketing while carriers use the bundle to reduce their own customer churn and differentiate their service plans from competitors. These bundled subscribers convert to paid, unbundled subscriptions at a rate of roughly 20 to 30 percent once the promotional bundling period ends after twelve months. Larger carrier partnerships covering many millions of subscribers routinely exceed this baseline conversion rate considerably each calendar year across every single partnership.
Market Impact: Bundled subscribers convert at 20 to 30% rate

Who Controls the Margin Pool

CR5 sits at 42 percent, evaluated on annual OTT subscription and advertising revenue across each platform's full service portfolio, leaving this market meaningfully more fragmented than adjacent digital advertising or search categories dominated by fewer players. Netflix holds the clearest lead given its scale and content investment depth, though the gap to Disney has narrowed noticeably as bundled offerings and live sports rights accelerate competition.
Competitive activity today centers on live sports rights acquisition and ad-supported tier monetization rather than pure content library expansion, since most platforms now offer broadly comparable programming depth across major genres. Netflix, Disney, and Amazon have all expanded live sports and event streaming offerings over the past two years, while smaller specialist platforms focus on niche genre content larger competitors deprioritize in their broader programming strategy.

Emerging pressure comes from telecom-bundled and free ad-supported streaming services that undercut traditional subscription platforms on price while monetizing purely through advertising, appealing to price-sensitive households unwilling to pay any subscription fee whatsoever. Rankings are most likely to shift in live sports streaming specifically, where rights renewal cycles create periodic opportunities for challengers to outbid incumbents and capture subscriber attention previously locked into established platforms.
over-the-top-ott-services-market-company-positioning-matrix-1789998144349

Competitive Moat and Risk Dimensions

NETFLIX

Moat: Global Content Investment Scale

Netflix's massive global content budget and subscriber base let it produce and license programming at a scale smaller competitors cannot match, spreading the fixed cost of expensive original productions across a subscriber base far larger than any single-market competitor could ever achieve independently or profitably.
NETFLIX

Risk: Limited Live Sports Portfolio

Netflix's relatively limited live sports rights portfolio compared with Disney and Amazon leaves it more exposed to subscriber churn during periods when new original content releases slow down considerably between major programming seasons, release windows, and yearly content calendars throughout the entire calendar year each cycle.
DISNEY

Moat: Franchise Intellectual Property Depth

Disney's ownership of some of the entertainment industry's most valuable franchise intellectual property gives it a content pipeline that competitors licensing content from third parties simply cannot replicate at scale, supporting sustained subscriber engagement across multiple demographic segments simultaneously and reliably across successive generations of viewers.
DISNEY

Risk: Complex Multi-Brand Bundle Management

Disney's strategy of bundling multiple distinct brand platforms together creates internal complexity in pricing, content windowing, and subscriber experience that a single unified competitor platform simply does not need to manage across separate consumer-facing services, interfaces, and account systems entirely at all and in every market.

Players Tracked

Prominent Players

Netflix
Disney
Amazon
YouTube
Comcast

Other Key Players

Warner Bros. Discovery
Paramount Global
Apple
Spotify
Roku
Tencent Video
iQIYI
Fubo
DAZN
Zee Entertainment
Reliance Jio
ViuTV
Globo
Rakuten
Sling TV

Recent Developments

FEBRUARY 2026

Netflix Expands Live Sports Streaming Rights Portfolio

Netflix signed a multi-year agreement to stream additional live sports properties, expanding beyond its existing exhibition boxing and wrestling content into a broader professional sports rights portfolio targeting younger viewer demographics increasingly favoring streaming distribution over traditional broadcast television arrangements and legacy cable packages entirely.
Signal: Confirms live sports rights acquisition has become essential to subscriber retention across every major streaming platform today.
OCTOBER 2025

Disney Launches Unified Cross-Platform Bundle Pricing

Disney launched a simplified unified bundle pricing structure combining its multiple brand platforms into a single subscription tier, addressing customer confusion and internal complexity that had previously required separate purchasing decisions across each distinct branded service offering available to subscribers everywhere across all served markets.
Signal: Shows multi-brand platform operators simplifying bundle structures to reduce subscriber acquisition friction broadly across all markets.
JUNE 2025

Amazon Expands Ad-Supported Tier Default Across Markets

Amazon expanded its ad-supported tier as the default subscription option across additional international markets, following a similar transition in its largest markets that meaningfully increased advertising revenue while offering subscribers a lower-cost ad-free upgrade path for those preferring uninterrupted viewing experiences overall each single month.
Signal: Signals ad-supported defaults are becoming the standard pricing approach across every major global platform today and tomorrow.

Content Spend Behind Every Subscription

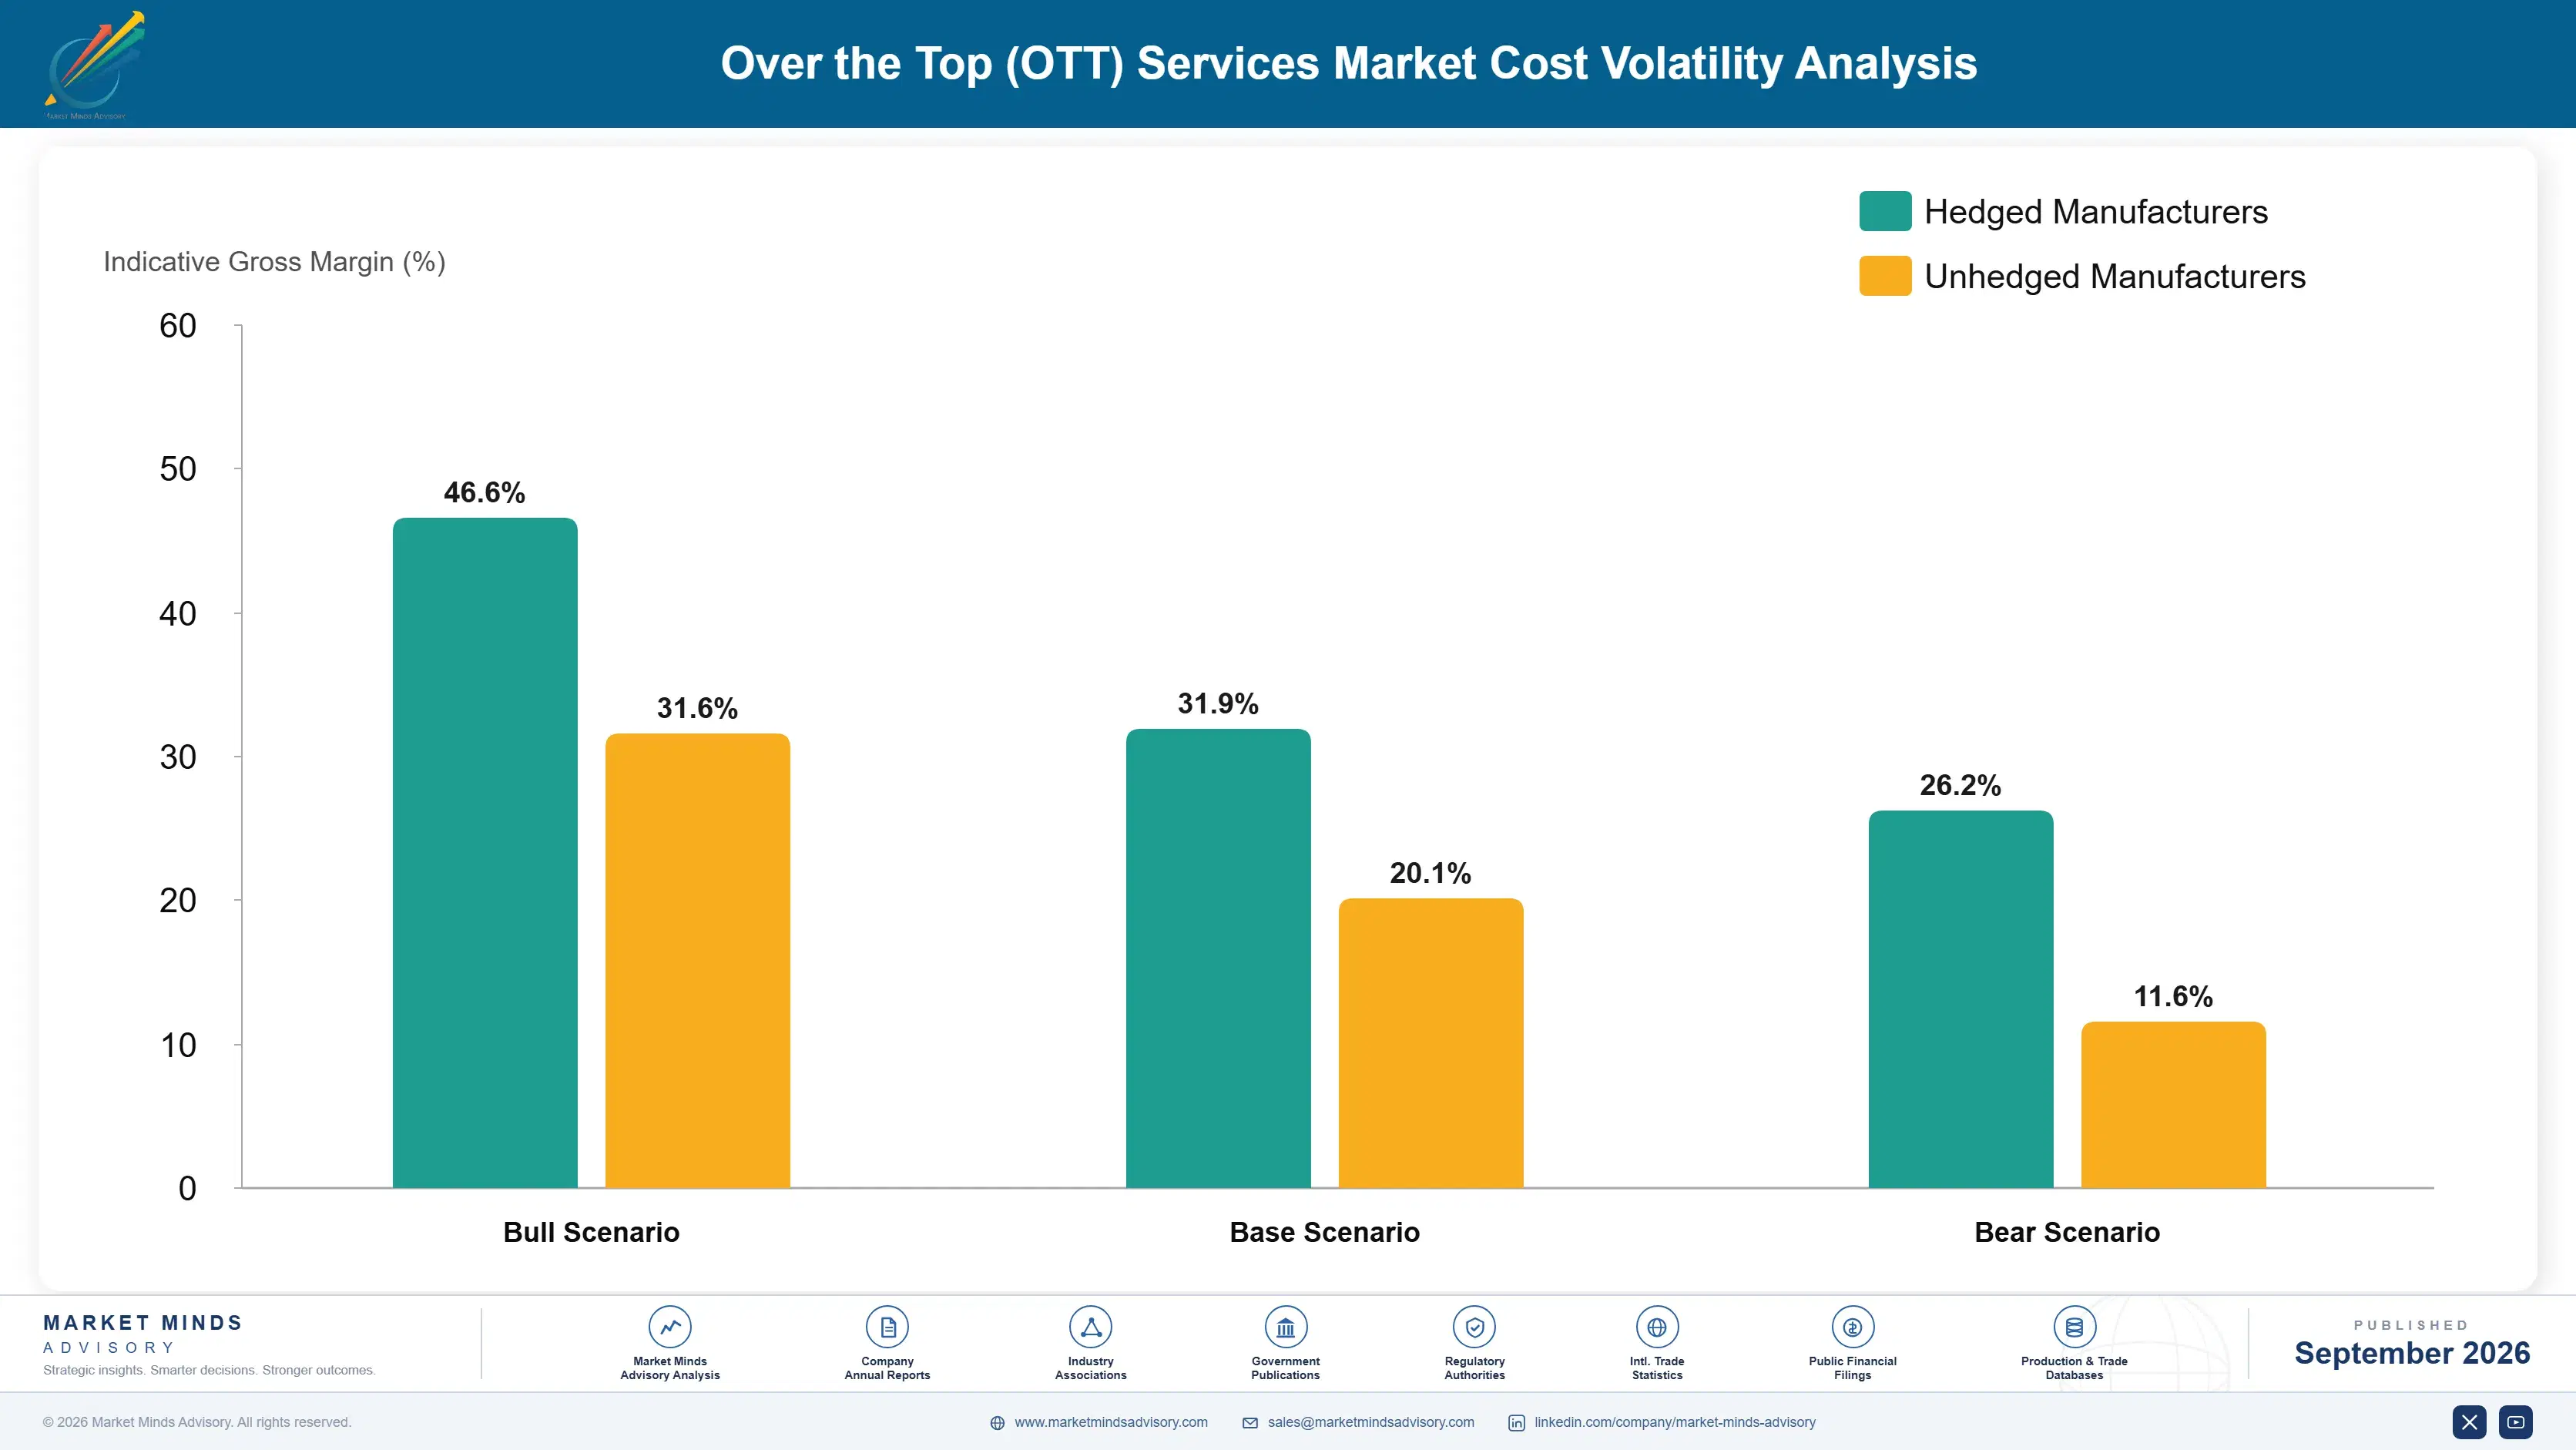
Original and licensed content production accounts for roughly 55 percent of cost of goods sold for a typical major streaming platform, with the remainder split across cloud infrastructure, content delivery network bandwidth, and customer support expenses paid throughout the year. Content production spending concentrates heavily in the United States and increasingly South Korea rather than uniformly across every market a platform ultimately serves.
A 2025 surge in live sports rights bidding, documented in media rights disclosures reviewed by MMA analysts, pushed premium sports content licensing costs up roughly 24 percent industrywide within a single year as competition for marquee league packages intensified sharply across multiple platforms bidding simultaneously for the same properties. Platforms without existing multi-year sports rights agreements faced the full brunt of this pricing escalation directly and immediately.

Smaller and mid-tier platforms relying entirely on licensed content face far more cost exposure than the largest platforms that can amortize massive original content budgets across hundreds of millions of subscribers worldwide. That scale advantage increasingly determines which platforms can sustain competitive subscription pricing during a content cost spike without eroding margin to an unsustainable level relative to larger, better-capitalized competitors operating at far greater subscriber scale.
over-the-top-ott-services-market-cost-volatility-analysis-1789998144544

Co-Produce Content With International Partners

Platforms increasingly co-produce original content with international production partners, sharing upfront production costs while gaining local market distribution rights and cultural authenticity that a purely domestic production would struggle to achieve on its own, reducing net content spend per title meaningfully across the entire content portfolio. Larger platforms extend this model across dozens of titles.

License Rather Than Produce for Niche Genres

Several platforms now license rather than produce content for smaller niche genre audiences, reserving expensive original production budgets for tentpole franchise content most likely to drive broad subscriber acquisition and retention across the largest possible audience segments served across every major market, demographic, and language region. This licensing-versus-production discipline has become nearly standard industry practice broadly.

Negotiate Multi-Year Sports Rights to Lock In Pricing

Platforms increasingly negotiate multi-year sports rights agreements rather than annual renewals, locking in pricing before further bidding competition escalates costs even further still, and providing budget certainty across the entire contract term rather than exposure to unpredictable annual rights renewal negotiations conducted each and every new season. Larger platforms extend this multi-year approach across nearly every major sports property.

Portfolio Architecture for Margin Defence

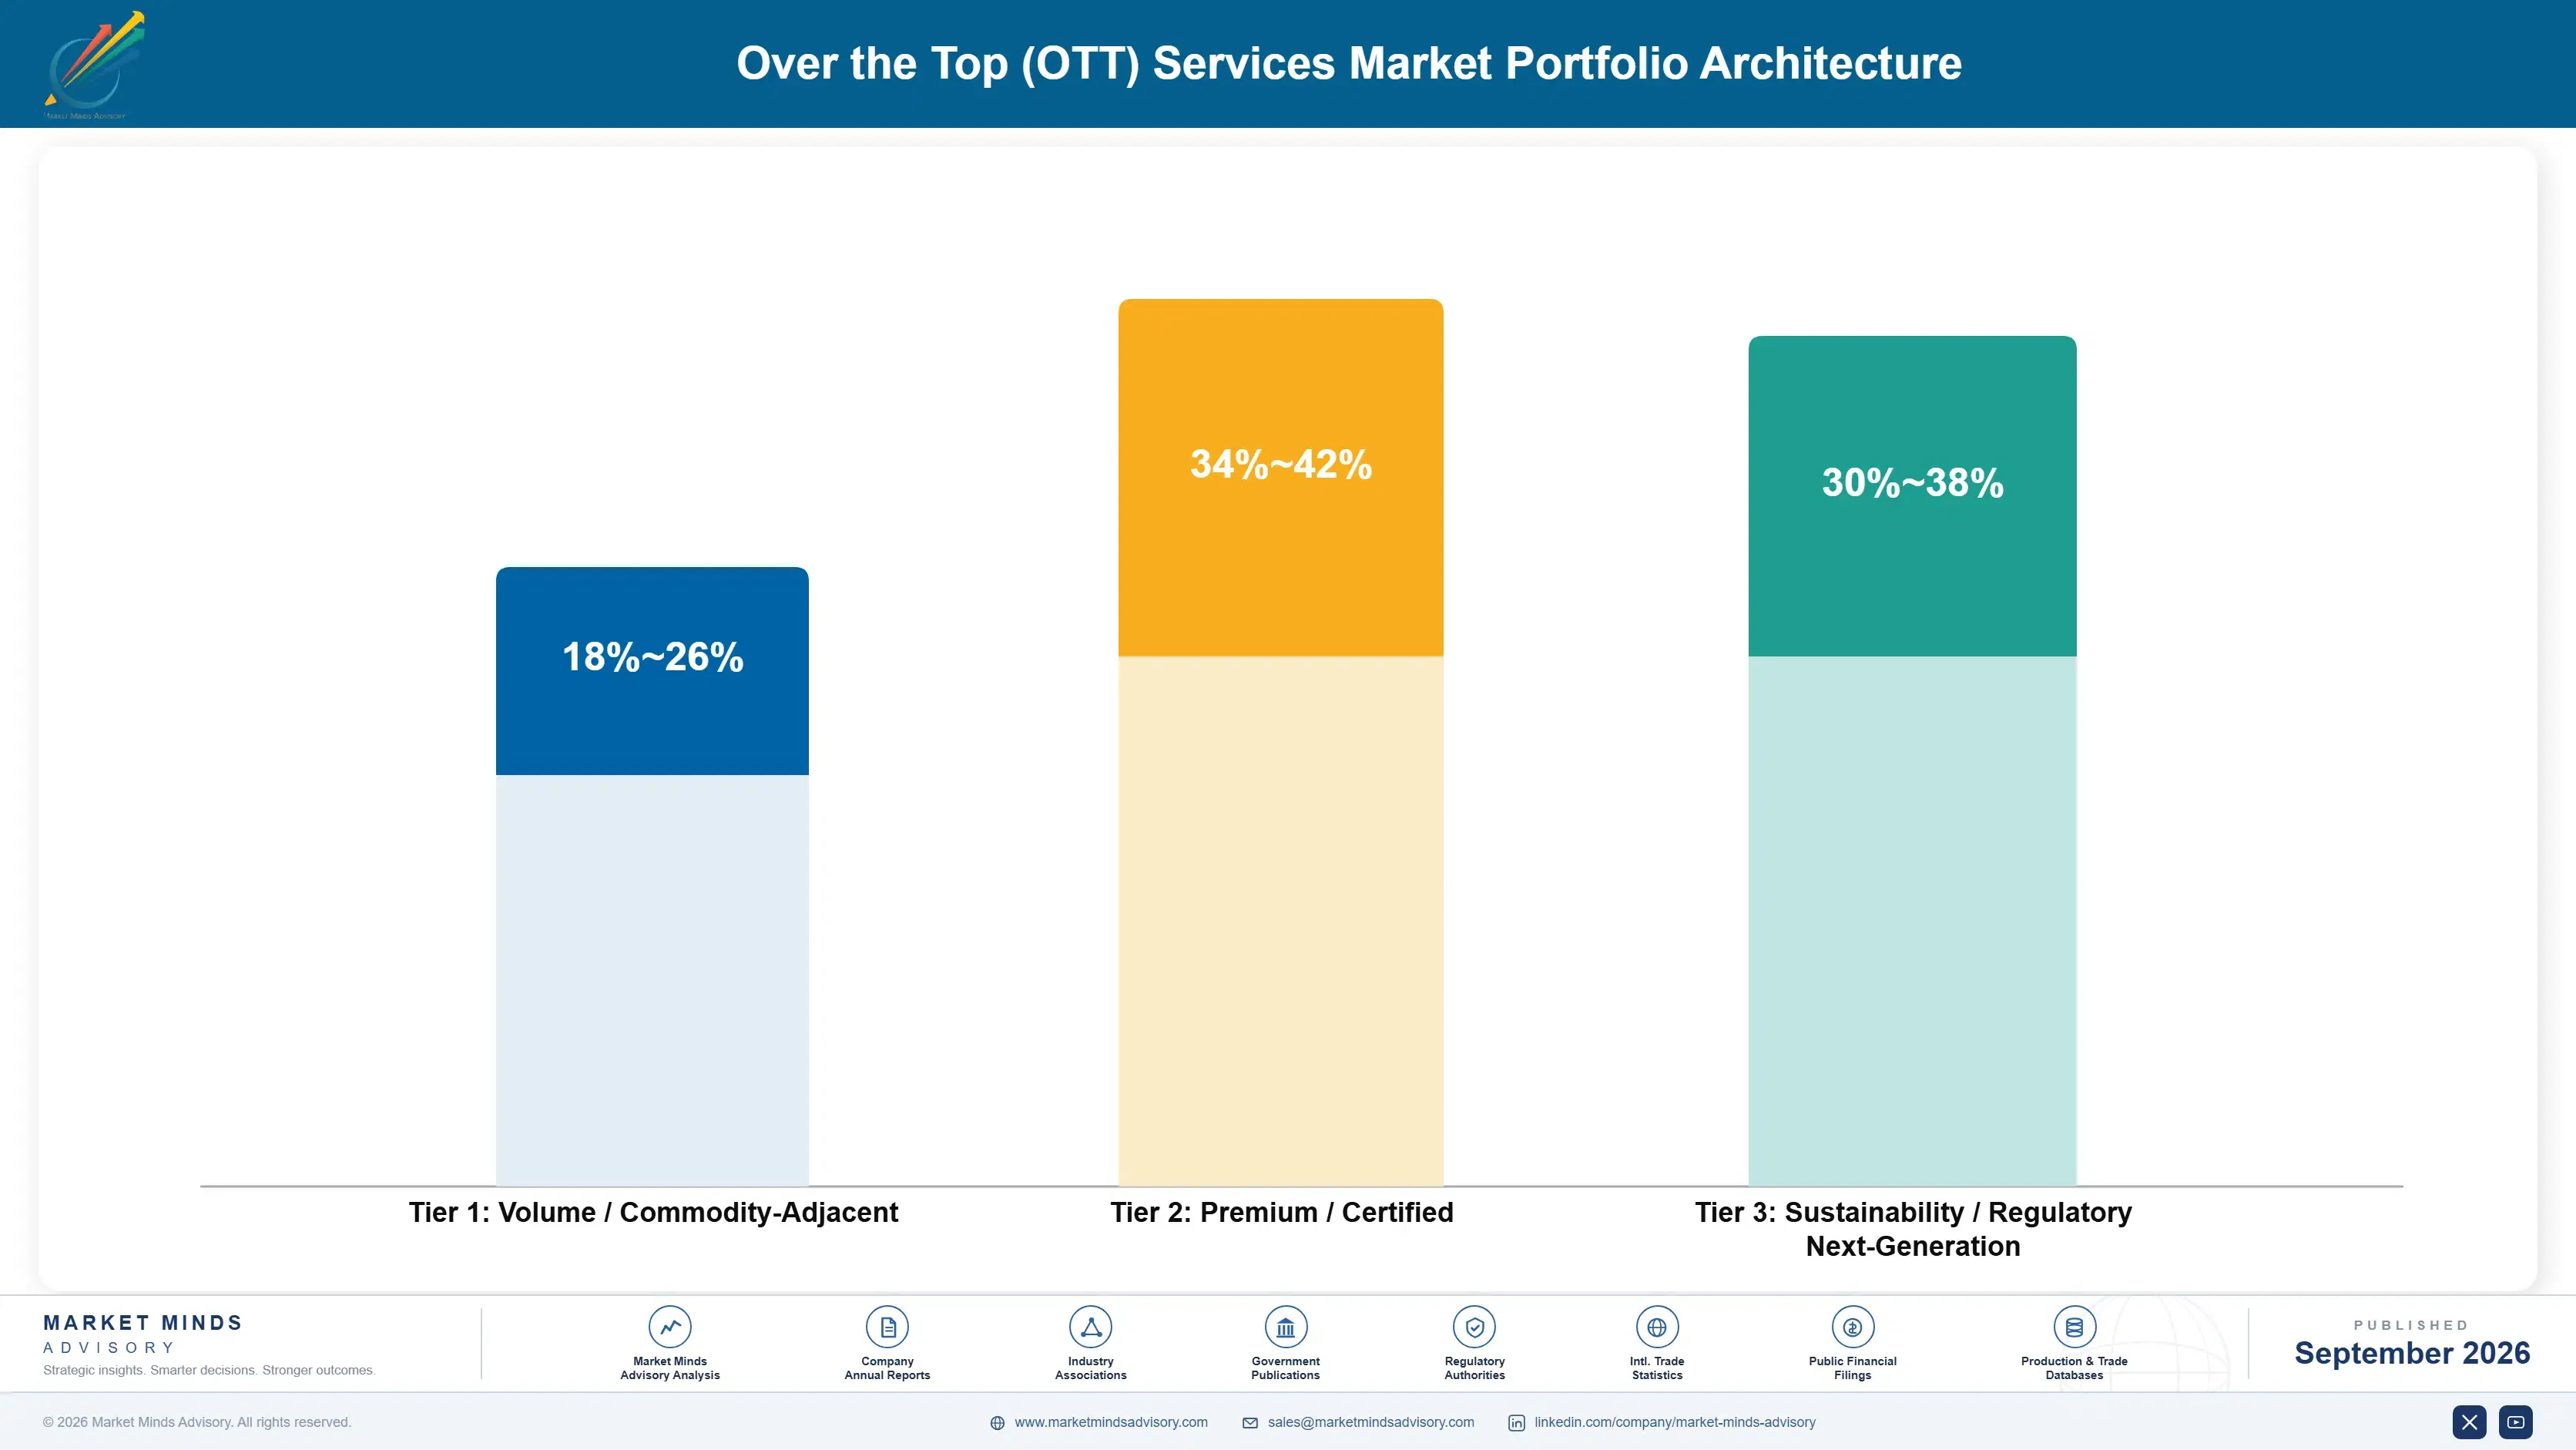
Gross margin in OTT services spreads widely depending on content investment strategy and how much of the revenue comes from advertising versus premium subscription tiers layered on top of the base service. A commodity ad-supported tier sold at competitive pricing clears margin well below what a fully bundled, sports-and-premium content platform commands, since the latter embeds exclusive content that buyers pay a real, sustained premium to access reliably.
Volume and premium tiers pull platforms toward genuinely different customer bases and content investment levels. Volume players compete on low-cost, ad-supported access sold broadly across price-sensitive household segments, while premium players concentrate on subscribers willing to pay substantially more for exclusive live sports, ad-free viewing, and early content access built directly into the offering. Few platforms execute both strategies at once, since content investment and audience targeting diverge sharply.

High-value margin pools concentrate specifically in exclusive live sports rights, targeted advertising technology, and long-term telecom bundling agreements rather than in general on-demand content access, which increasingly functions as a lower-margin, high-volume entry point that funds the content infrastructure supporting the much higher-margin sports and advertising business built on top of that same underlying subscriber platform.

Volume / Commodity-Adjacent

Ad-supported streaming tiers sold at low, competitive pricing into price-sensitive household segments, competing mainly on content breadth, ease of use, and broad device availability across every market and region worldwide.
Gross Margin: 18-26%

Premium / Certified

Ad-free premium tiers bundled with exclusive live sports, early content access, and telecom carrier partnerships sold to subscribers across every major demographic, income segment, and geography worldwide today and going forward.
Gross Margin: 34-42%

Sustainability / Regulatory / Next-Generation

Localized content platforms meeting emerging content quota and data residency regulatory standards demanded by regulated markets across Western Europe, India, and other jurisdictions with strict continuous oversight and compliance requirements.
Gross Margin: 30-38%
over-the-top-ott-services-market-portfolio-architecture-1789998145049

High-value Sub-segments and Strategic Watch-out

Exclusive Live Sports Rights

The highest-margin pool in the category, growing fastest as platforms discover exclusive live sports create churn-resistant subscriber bases that on-demand content libraries alone rarely achieve on their own consistently. Renewal and expansion rates in these accounts run consistently higher than the base tier and product mix.
Gross Margin: 40-48%

Targeted Advertising Technology

High-value, data-driven revenue commanding strong margin as ad-supported tiers command premium rates through first-party viewer targeting precision that traditional television advertising never achieved at any comparable scale or price point. Adoption keeps rising sharply among the largest advertisers seeking measurable, verifiable audience outcomes and reach.
Gross Margin: 36-44%

Commodity On-Demand Libraries

The largest volume core of the market, mature and increasingly low-margin, facing continued commoditization pressure as content libraries across major platforms converge toward broadly comparable overall depth, quality, and genre breadth. Platforms increasingly treat this tier as a lead generation channel for premium upsell opportunities.
Gross Margin: 16-24%

Subscription Fatigue Consolidation

A strategic watch-out segment where households increasingly cancel and consolidate subscriptions periodically, threatening to compress the addressable market for smaller and mid-tier platforms specifically over the coming several years and well beyond. Platforms must differentiate sharply through exclusive content to defend this important segment successfully.
Gross Margin: N/A

Why Streaming Subscriptions Are Not Sticky

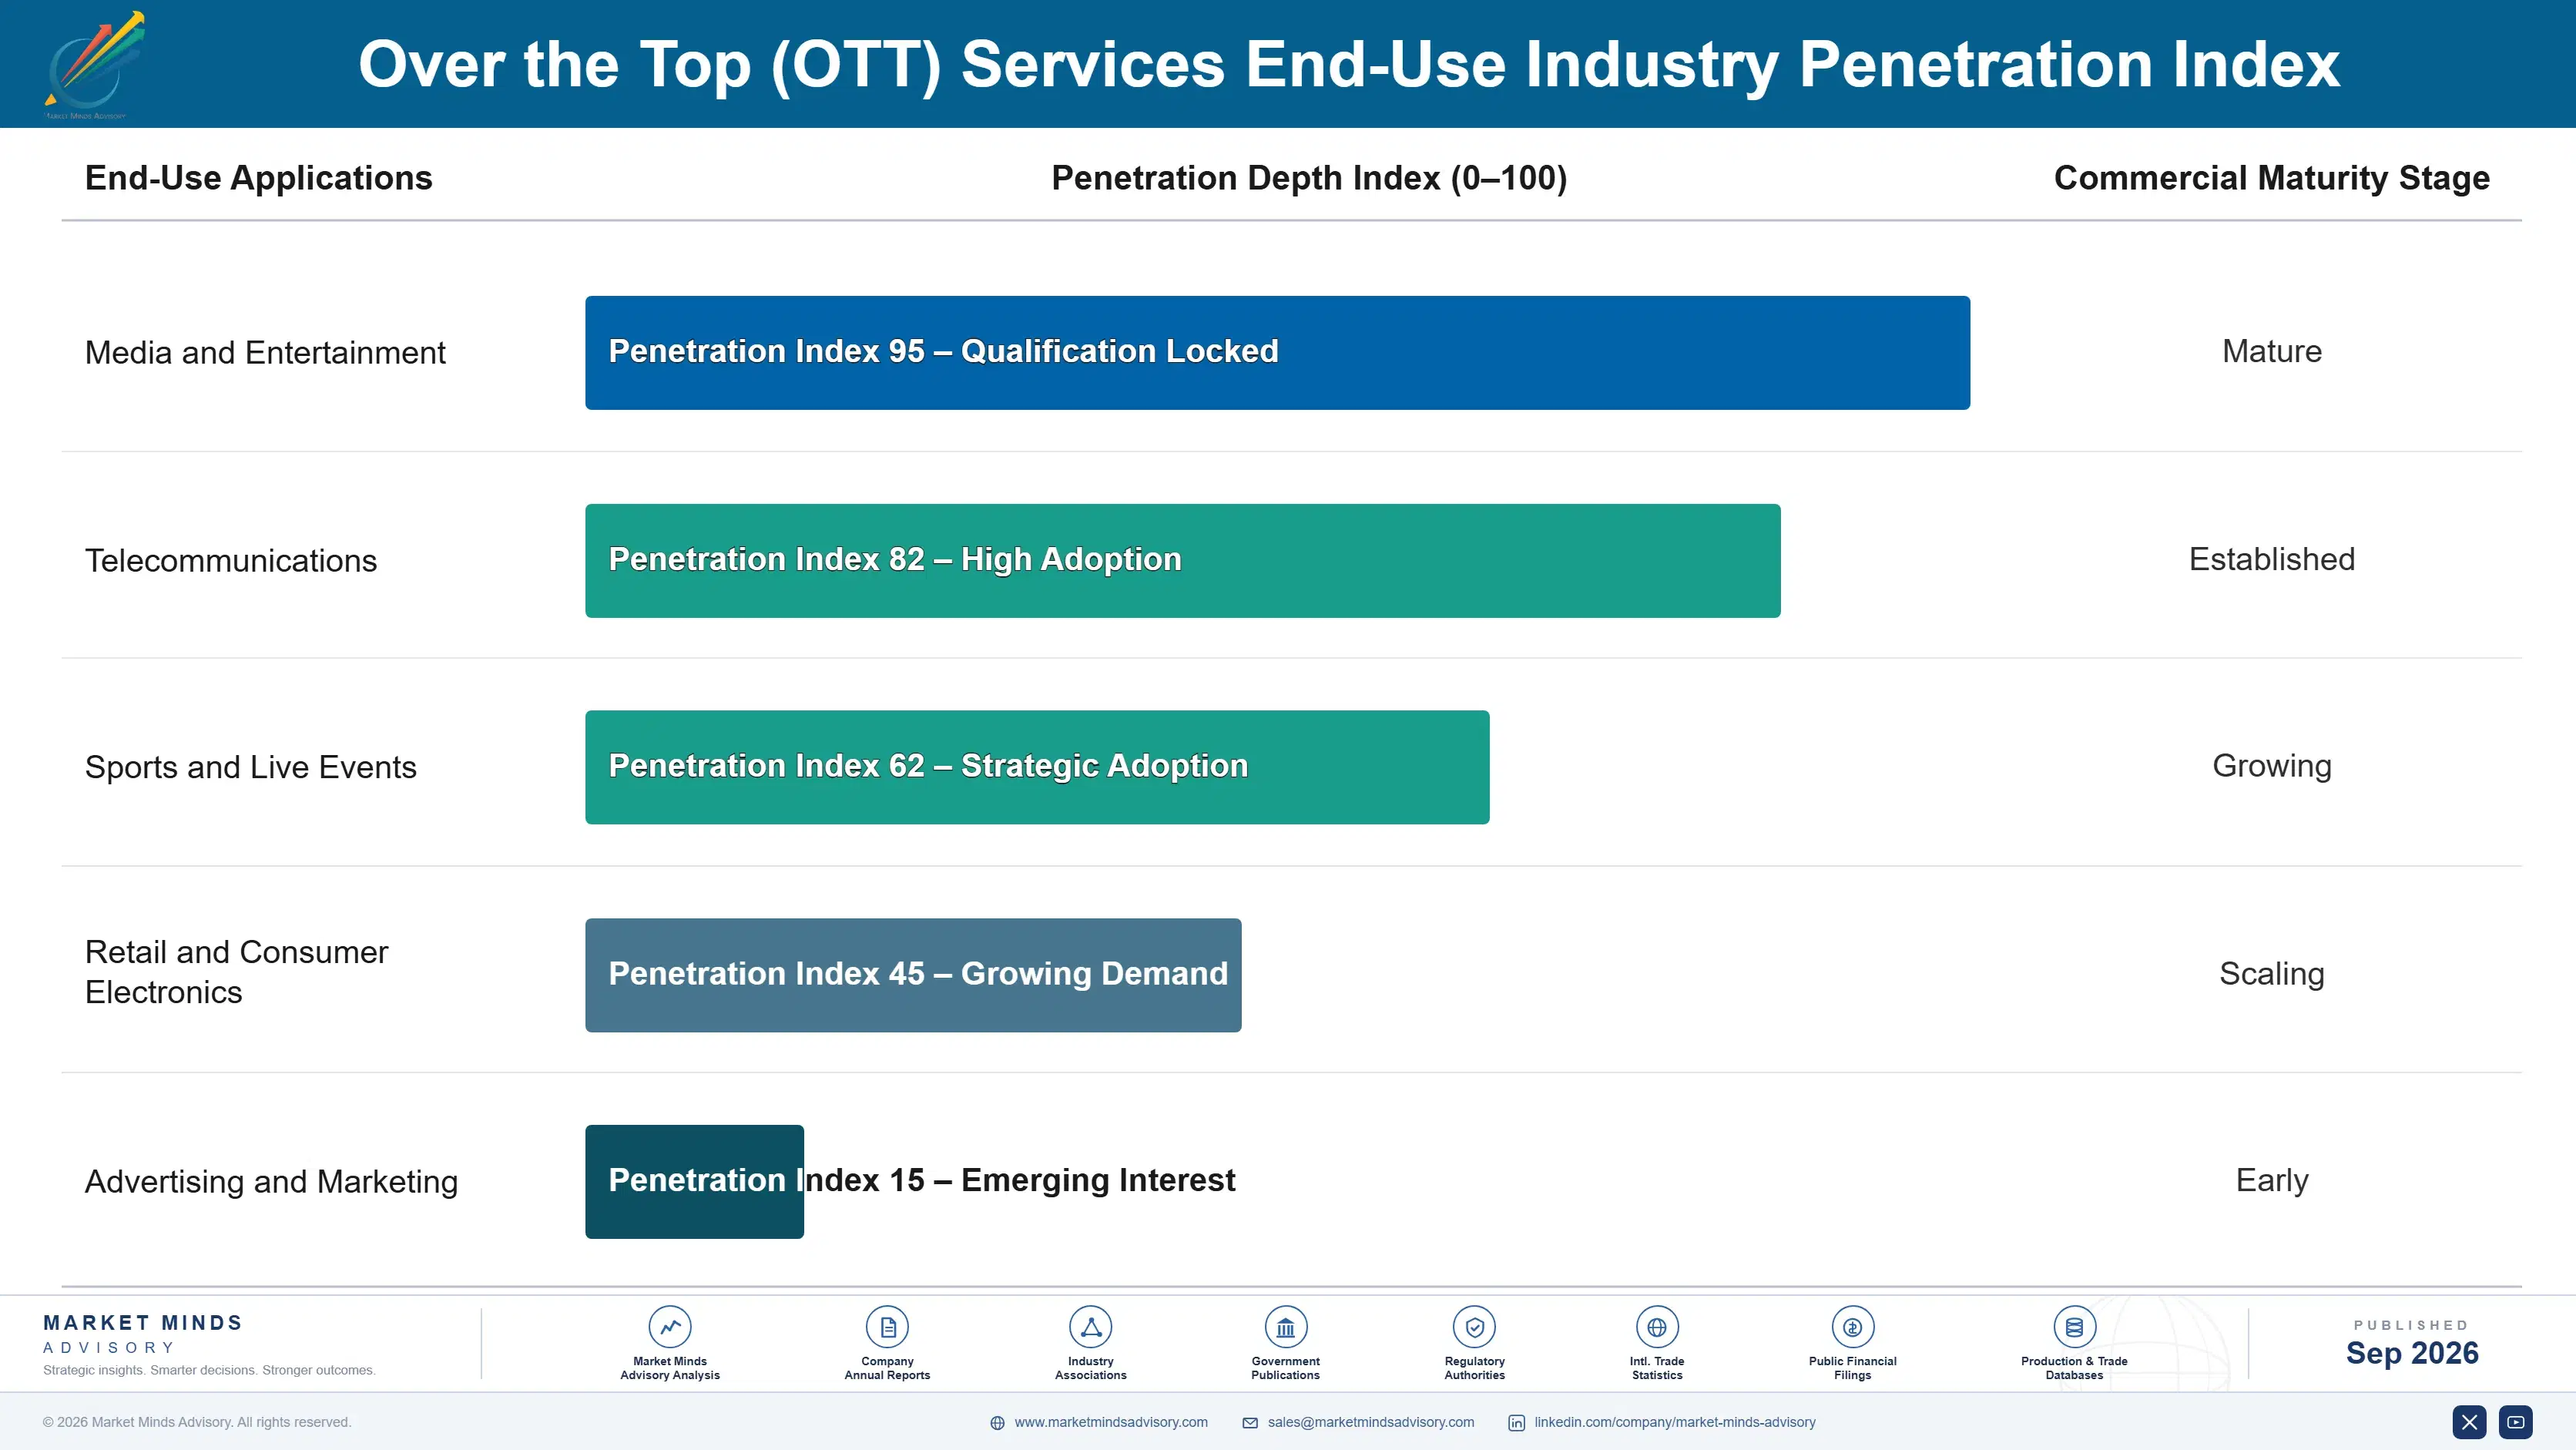
An OTT subscription behaves less like a traditional annuity and more like a genuinely renewable commitment reassessed monthly, since switching costs remain remarkably low compared with most software or hardware categories where integration effort or certification requirements create real lock-in. A subscriber can cancel one platform and sign up for another within minutes, with no data migration, no retraining, and no lost work of any kind standing in the way of that decision at all.
Stickiness varies sharply by content type and household habit formation. Live sports subscribers show the deepest loyalty, since canceling means missing games entirely during an active season with no way to catch up later. General on-demand entertainment subscribers show far weaker stickiness, since comparable content often exists across several competing platforms simultaneously, making price and promotional offers the primary driver of subscription decisions each month.

Buyer profiles are shifting generationally as younger households raised entirely on streaming increasingly treat subscriptions as disposable, rotating monthly rather than maintaining a stable, long-term relationship with any single platform brand. This generational shift favors platforms offering flexible month-to-month commitments and easy re-subscription over platforms relying on long-term contract lock-in or cancellation friction to retain subscribers who would otherwise leave.
over-the-top-ott-services-market-end-use-penetration-index-1789998145539

Where to Compete in Streaming

These are among the four positions where our research anticipates prominent divergence between winners and laggards over the coming forecast period. Each is grounded in the demand model, the regulatory perimeter, and the announced capacity pipeline.
01 / LIVE SPORTS RIGHTS STRATEGY

Secure sports rights before the next bidding cycle escalates

Live sports rights already command genuine churn resistance that on-demand content alone rarely achieves, yet many platforms still underinvest relative to their overall subscriber base size, revenue potential, and long-term retention economics across the entire business today. A challenger securing meaningful sports rights now can lock in churn-resistant subscriber cohorts before the next renewal cycle pushes prices even higher than current already-elevated levels. That window narrows measurably each cycle as bidding competition among platforms intensifies broadly across the entire industry.
02 / AD TECHNOLOGY INVESTMENT

Build first-party targeting depth before ad rates commoditize

Ad-supported tier monetization already commands meaningfully higher rates for platforms with sophisticated first-party targeting capability, yet many smaller platforms still sell generic, untargeted inventory at commodity advertising rates well below their true potential value overall today. A platform investing early in genuine targeting infrastructure can capture premium advertising rates before this becomes table stakes every platform offers as a standard capability across the market. This differentiation window narrows measurably each year as targeting technology matures broadly across the entire sector.
03 / PASSWORD SHARING ENFORCEMENT

Enforce account restrictions before competitors close the conversion gap

Password-sharing enforcement has proven a genuinely reliable revenue lever for platforms that have already implemented it successfully across their entire subscriber base and product line, yet several mid-tier platforms still tolerate widespread account sharing without any enforcement mechanism whatsoever in place today. A platform enforcing restrictions now can convert free riders into paying subscribers before viewer habits shift toward alternative, harder-to-monetize sharing workarounds that emerge over time. This conversion opportunity narrows as consumer awareness of enforcement practices spreads broadly across the market.
04 / EMERGING MARKET LOCALIZATION

Invest in local content before regional competitors establish loyalty

Emerging market subscriber growth increasingly depends on localized content and language support rather than simply making an existing English-language catalog available at a lower price point alone and hoping that works out well enough overall. A platform investing early in genuine regional content production can build subscriber loyalty before local competitors and domestic platforms establish their own entrenched positions in these fast-growing markets and regions. This localization window will not stay open indefinitely as regional platforms scale their own investment.

Engagement Snapshot From the Field

A live engagement with an industry participant carrying material or product regulatory and market exposure ahead of a defining policy shift, showing how our research translates into a defensible multi-year portfolio strategy.
MARKET MINDS ADVISORY · CLIENT ENGAGEMENT SUMMARY
Over the Top (OTT) Services Producer Strategic Portfolio Review and Transition Roadmap 2026·Investment Scenario on Over the Top (OTT) Services Exposure Evaluation 2025-26
CLIENT PROFILE
The client operates a regional sports television network holding broadcast rights to several professional and collegiate teams across a multi-state footprint, reporting client-reported annual revenue of approximately $410 million (client-reported, unverified by MMA). Facing declining traditional cable distribution and cord-cutting among younger viewers, leadership sought an independent evaluation of launching a direct-to-consumer streaming platform before its next media rights renewal cycle.
STRATEGIC CHALLENGE
The client's traditional cable distribution revenue had declined steadily for several consecutive years, yet launching a direct-to-consumer streaming platform required substantial upfront technology investment and carried genuine risk of accelerating cable subscriber losses if not executed carefully alongside its existing distribution relationships and long-term carriage agreements already firmly in place.
MMA APPROACH
MMA analysts modeled subscriber conversion scenarios comparing direct-to-consumer streaming revenue against projected cable distribution revenue decline, benchmarked pricing against comparable regional sports streaming launches in other markets, and assessed technology vendor options for the underlying streaming platform infrastructure required to support a reliable, scalable direct-to-consumer launch across the entire footprint.
KEY FINDINGS
  1. Households already lacking cable access represented the largest immediate addressable audience, with roughly 28 percent of the client's local market already having cut the cord entirely.
  2. Comparable regional sports streaming launches in other markets achieved subscriber conversion rates of 12 to 18 percent of the previous cable viewing audience within the first year.
  3. None of the three technology vendors evaluated offered a complete solution without requiring additional integration work for the client's specific live game production workflow.
  4. The selected streaming platform vendor's pricing structure, once modeled against expected subscriber volume, would generate positive margin within 14 months (client-reported, unverified by MMA) of launch.
CLIENT PROFILE
The client operates a regional sports television network holding broadcast rights to several professional and collegiate teams across a multi-state footprint, reporting client-reported annual revenue of approximately $410 million (client-reported, unverified by MMA). Facing declining traditional cable distribution and cord-cutting among younger viewers, leadership sought an independent evaluation of launching a direct-to-consumer streaming platform before its next media rights renewal cycle.
STRATEGIC CHALLENGE
The client's traditional cable distribution revenue had declined steadily for several consecutive years, yet launching a direct-to-consumer streaming platform required substantial upfront technology investment and carried genuine risk of accelerating cable subscriber losses if not executed carefully alongside its existing distribution relationships and long-term carriage agreements already firmly in place.
MMA APPROACH
MMA analysts modeled subscriber conversion scenarios comparing direct-to-consumer streaming revenue against projected cable distribution revenue decline, benchmarked pricing against comparable regional sports streaming launches in other markets, and assessed technology vendor options for the underlying streaming platform infrastructure required to support a reliable, scalable direct-to-consumer launch across the entire footprint.
KEY FINDINGS
  1. Households already lacking cable access represented the largest immediate addressable audience, with roughly 28 percent of the client's local market already having cut the cord entirely.
  2. Comparable regional sports streaming launches in other markets achieved subscriber conversion rates of 12 to 18 percent of the previous cable viewing audience within the first year.
  3. None of the three technology vendors evaluated offered a complete solution without requiring additional integration work for the client's specific live game production workflow.
  4. The selected streaming platform vendor's pricing structure, once modeled against expected subscriber volume, would generate positive margin within 14 months (client-reported, unverified by MMA) of launch.
RECOMMENDED STRATEGY
Phase 1: Phase 1 (Months 1 to 4): Select the streaming technology vendor and begin integration work with the existing live game production workflow. Phase 2: Phase 2 (Months 5 to 8): Launch a limited beta streaming service to cord-cutting households while maintaining existing cable distribution relationships. Phase 3: Phase 3 (Months 9 to 12): Complete the full commercial launch and begin marketing directly to the broader regional cord-cutting audience.
OUTCOME
The client launched its direct-to-consumer streaming service on schedule and reached its first-year subscriber target roughly two months ahead of projections. Streaming revenue reached approximately $34 million (client-reported, unverified by MMA) in the first twelve months, partially offsetting continued cable distribution revenue decline across the broader network.

Frequently Asked Questions

Foundational context covering the market sizes, CAGR, scope, country, region and competition that inform every finding below. This section is provided to cover basics and most often pre-purchase conversations, answered from the MMA Primary Research Dataset.

What is the current size of the Over the Top (OTT) Services Market?

The Over the Top Services Market reached $58.0 billion in base-year value in 2025, spanning video streaming, live sports, audio streaming, and OTT messaging platforms worldwide.

How large will the Over the Top (OTT) Services Market be by 2036?

The market is projected to reach $182.8 billion by 2036, expanding roughly 2.84 times its 2026 value as ad-supported tiers and live sports rights accelerate.

What is the CAGR for the Over the Top (OTT) Services Market 2026 to 2036?

The market is forecast to grow at a compound annual growth rate of 11.0 percent between 2026 and 2036, driven by cord-cutting and emerging market broadband expansion.

Which segment is growing fastest?

Ad-supported video streaming leads all segments at a 15.0 percent CAGR, roughly 1.36 times the overall market rate, as price-sensitive households adopt lower-cost pricing tiers.

Who are the major companies in the Over the Top (OTT) Services Market?

Netflix, Disney, Amazon, YouTube, and Comcast lead the competitive field, evaluated on annual subscription and advertising revenue across every service portfolio and served market worldwide.

Which country is growing fastest?

Indonesia leads all countries tracked at a 14.0 percent CAGR, fueled by rapid mobile-first broadband expansion converting mobile internet users into paying streaming subscribers nationwide.

Report Segmentation Architecture

The full report scope spans multiple orthogonal segmentation dimensions, with cross-tabulated demand data provided for each dimension pair. Coverage extends further to regional breakdowns, trend trajectories, and the competitive detail needed to support segment-level decision-making.

By Primary Market Dimension

  • Ad-Supported Video Streaming Services
  • Live Sports and Event Streaming
  • Audio Streaming and Podcasting
  • OTT Messaging and Communication Apps
  • Cloud Gaming and Interactive OTT
  • OTT Advertising Technology and Measurement

By End-Use Industry

  • Media and Entertainment
  • Telecommunications
  • Sports and Live Events
  • Retail and Consumer Electronics
  • Advertising and Marketing

By Commercial Dimension

  • Ad-Supported Free Access
  • Premium Subscription Tier
  • Telecom Bundled Distribution
  • Transactional Pay-Per-View

By Region

  • North America
  • Western Europe
  • East Asia
  • South Asia and Pacific
  • Latin America
  • Middle East and Africa
  • Eastern Europe

Scope, Methodology, and Coverage

Every figure in this report is reproducible from documented input assumptions. The scope below maps the historical period, the forecast horizon, the segmentation dimensions, and the countries covered, alongside the underlying primary and qualitative methodology.
Historical Period
2020 to 2025
Forecast Period
2026 to 2036
Base Year
2025 (USD billions; MMA Primary Research Dataset, September 2026)
Market Definition
The Over the Top Services Market covers internet-delivered video streaming, live sports and event streaming, audio streaming, and OTT messaging platforms distributed directly to consumers without traditional cable, satellite, or telecom carrier distribution. It excludes traditional linear broadcast and cable television, telecom carrier voice and data services, and physical media distribution.
Quantitative Units
USD billions (current prices); subscriber count where applicable
Segmentation Dimensions
By Primary Market Dimension; By End-Use Industry; By Commercial Dimension; By Region
Regions Covered
North America, Western Europe, East Asia, South Asia and Pacific, Latin America, Middle East and Africa, Eastern Europe
Countries Covered
USA, China, Germany, France, UK, Japan, South Korea, India, Australia, Canada, Brazil, Mexico, Indonesia, Vietnam, Thailand, Malaysia, UAE, Saudi Arabia, South Africa, Nigeria, Turkey, Poland, Netherlands, Italy, Spain, Sweden, Switzerland, Argentina, Colombia, Singapore, and additional markets relevant to this sector
Key Companies Profiled
Netflix, Disney, Amazon, YouTube, Comcast, Warner Bros. Discovery, Paramount Global, Apple, Spotify, Roku, Tencent Video, iQIYI, Fubo, DAZN, Zee Entertainment, Reliance Jio, ViuTV, Globo, Rakuten, Sling TV
Quantitative Methodology
Primary survey, n=3,800 respondents, Q4 2025, six countries; demand-side model with trade association cross-validation
Qualitative Methodology
47 expert interviews, Q4 2025; applied to validate demand model assumptions, identify emerging dynamics, and assess competitive positioning
Report Format
PDF and XLSX data workbook (Word format preview document)
Publisher
Market Minds Advisory
Report Code
MMA-2026-TEC-215
Published
September 2026
Contact
sales@marketmindsadvisory.com | www.marketmindsadvisory.com

Purchase the full Over the Top (OTT) Services Market Report (2026 to 2036).

This report delivers a comprehensive assessment of the Over the Top Services Market from 2026 through 2036, covering sizing, segmentation, and regional demand patterns across all seven world regions tracked. It profiles twenty companies competing on live sports rights depth, advertising technology sophistication, and content investment scale rather than subscriber count alone. Readers get detailed analysis of revenue levers, content cost exposure, and portfolio margin economics specific to this media category and its buyers. The report closes with a strategic verdict identifying exactly where new capital should concentrate over the coming decade.
Full seven-region market sizing and forecast data
Twenty-company competitive profiling and moat analysis
Segment-level CAGR and market share breakdown
Content cost exposure and mitigation pathway analysis
Revenue lever and portfolio margin economics detail
Anonymized client case study with recommended strategy

Built For The People Who Decide

From boardroom strategy to bench-side execution, this report is read cover-to-cover by leaders shaping the next decade of their industry, turning demand scenarios, market dynamics and valuation benchmarks into decisions.
CXOs/ Presidents/ VPs/ Managers
M&A and Corporate Development
Strategy Teams and R&D Heads
Procurement and Product Directors
Regulatory and Compliance Leaders
Investor Relations and Equity Analysts