Market Minds Advisory
OTT Content Market

OTT Content Market: Live Sports Rights Redraw Streaming Content Investment Priorities

Streaming platforms are redirecting billions toward live sports rights as scripted content subscriber growth plateaus, forcing content budgets to chase the one category still driving measurable new subscriber acquisition today.

Lead Analyst

Published

September 2026

Make Smarter Decisions with Customized Research Insights

Request a free sample report and evaluate market opportunities, growth trends, and competitive dynamics relevant to your business needs.

2025 MARKET VALUE$198.5BMarket Size 2025
2036 FORECAST VALUE$544.1BBase Case , 2026 to 2036
CAGR 2026 TO 20369.6 %Bull 10.8% / Bear 8.4%
INCREMENTAL OPPORTUNITY$326.6BNet 10- year value creation
EXPANSION MULTIPLE2.50x2036 value over 2026 base
Strategic Levers
M&A Pipeline
Regional Outlook
Country Rankings
Competitive Intelligence
Segmental Deep-dive
Call-Us : 91 93563 13602

Executive Snapshot and Market Trajectory.

Streaming platforms are redirecting content budgets toward live sports rights as scripted original programming shows diminishing subscriber acquisition returns, forcing a fundamental reallocation of billions in annual investment across every major service, content category, regional market, platform tier, production budget line, and content genre worldwide today.
Live sports and event rights now anchor content investment decisions, outpacing the scripted original series spending that once defined platform differentiation strategy for most of the streaming era and its first decade. North America generates the largest share of content spend given its concentrated Hollywood production infrastructure and platform headquarters presence, though Indian platforms are expanding regional-language content investment faster than incumbent global platforms initially anticipated just a few years ago.
Competitive character increasingly favors platforms offering exclusive live sports and event rights over standalone scripted content libraries competing purely on catalog breadth alone across every subscriber demographic, price tier, viewing device category, streaming quality level, and full geographic market region worldwide today. Regulatory pressure around content licensing transparency and regional production quota requirements compounds this shift considerably, pushing platforms toward local production partnerships that smaller competitors struggle to fund at comparable scale, speed, and quality.
Market Definition
The OTT Content Market comprises spending on original production, licensing, and distribution rights for film, television, and live content delivered through internet-based streaming platforms. It excludes platform subscription and advertising revenue, hardware devices, and traditional broadcast or cable television content spending entirely.
Base Year Value
$198.5B in 2025 (MMA Primary Research Dataset, September 2026)
Forecast Period
2026 to 2036, eleven discrete annual values
CAGR
9.6% base case. Bull 10.8%. Bear 8.4%.
Fastest Growth Segment
Live Sports and Event Content: 14.5% CAGR
Fastest Growth Country
India: 13.2% CAGR
Fastest Growth Region
South Asia and Pacific: 11.8% CAGR
Largest Region
North America: 36% of 2025 global value
Market Leaders
Netflix, Disney, Warner Bros Discovery, Amazon, and Comcast lead the field. Source: MMA Analysis, July 2026.
Primary Survey
n=3,800 procurement and R&D decision-makers, Q4 2025, six countries
Methodology
Demand-side build-up, cross-validated against public data, 47 expert interviews

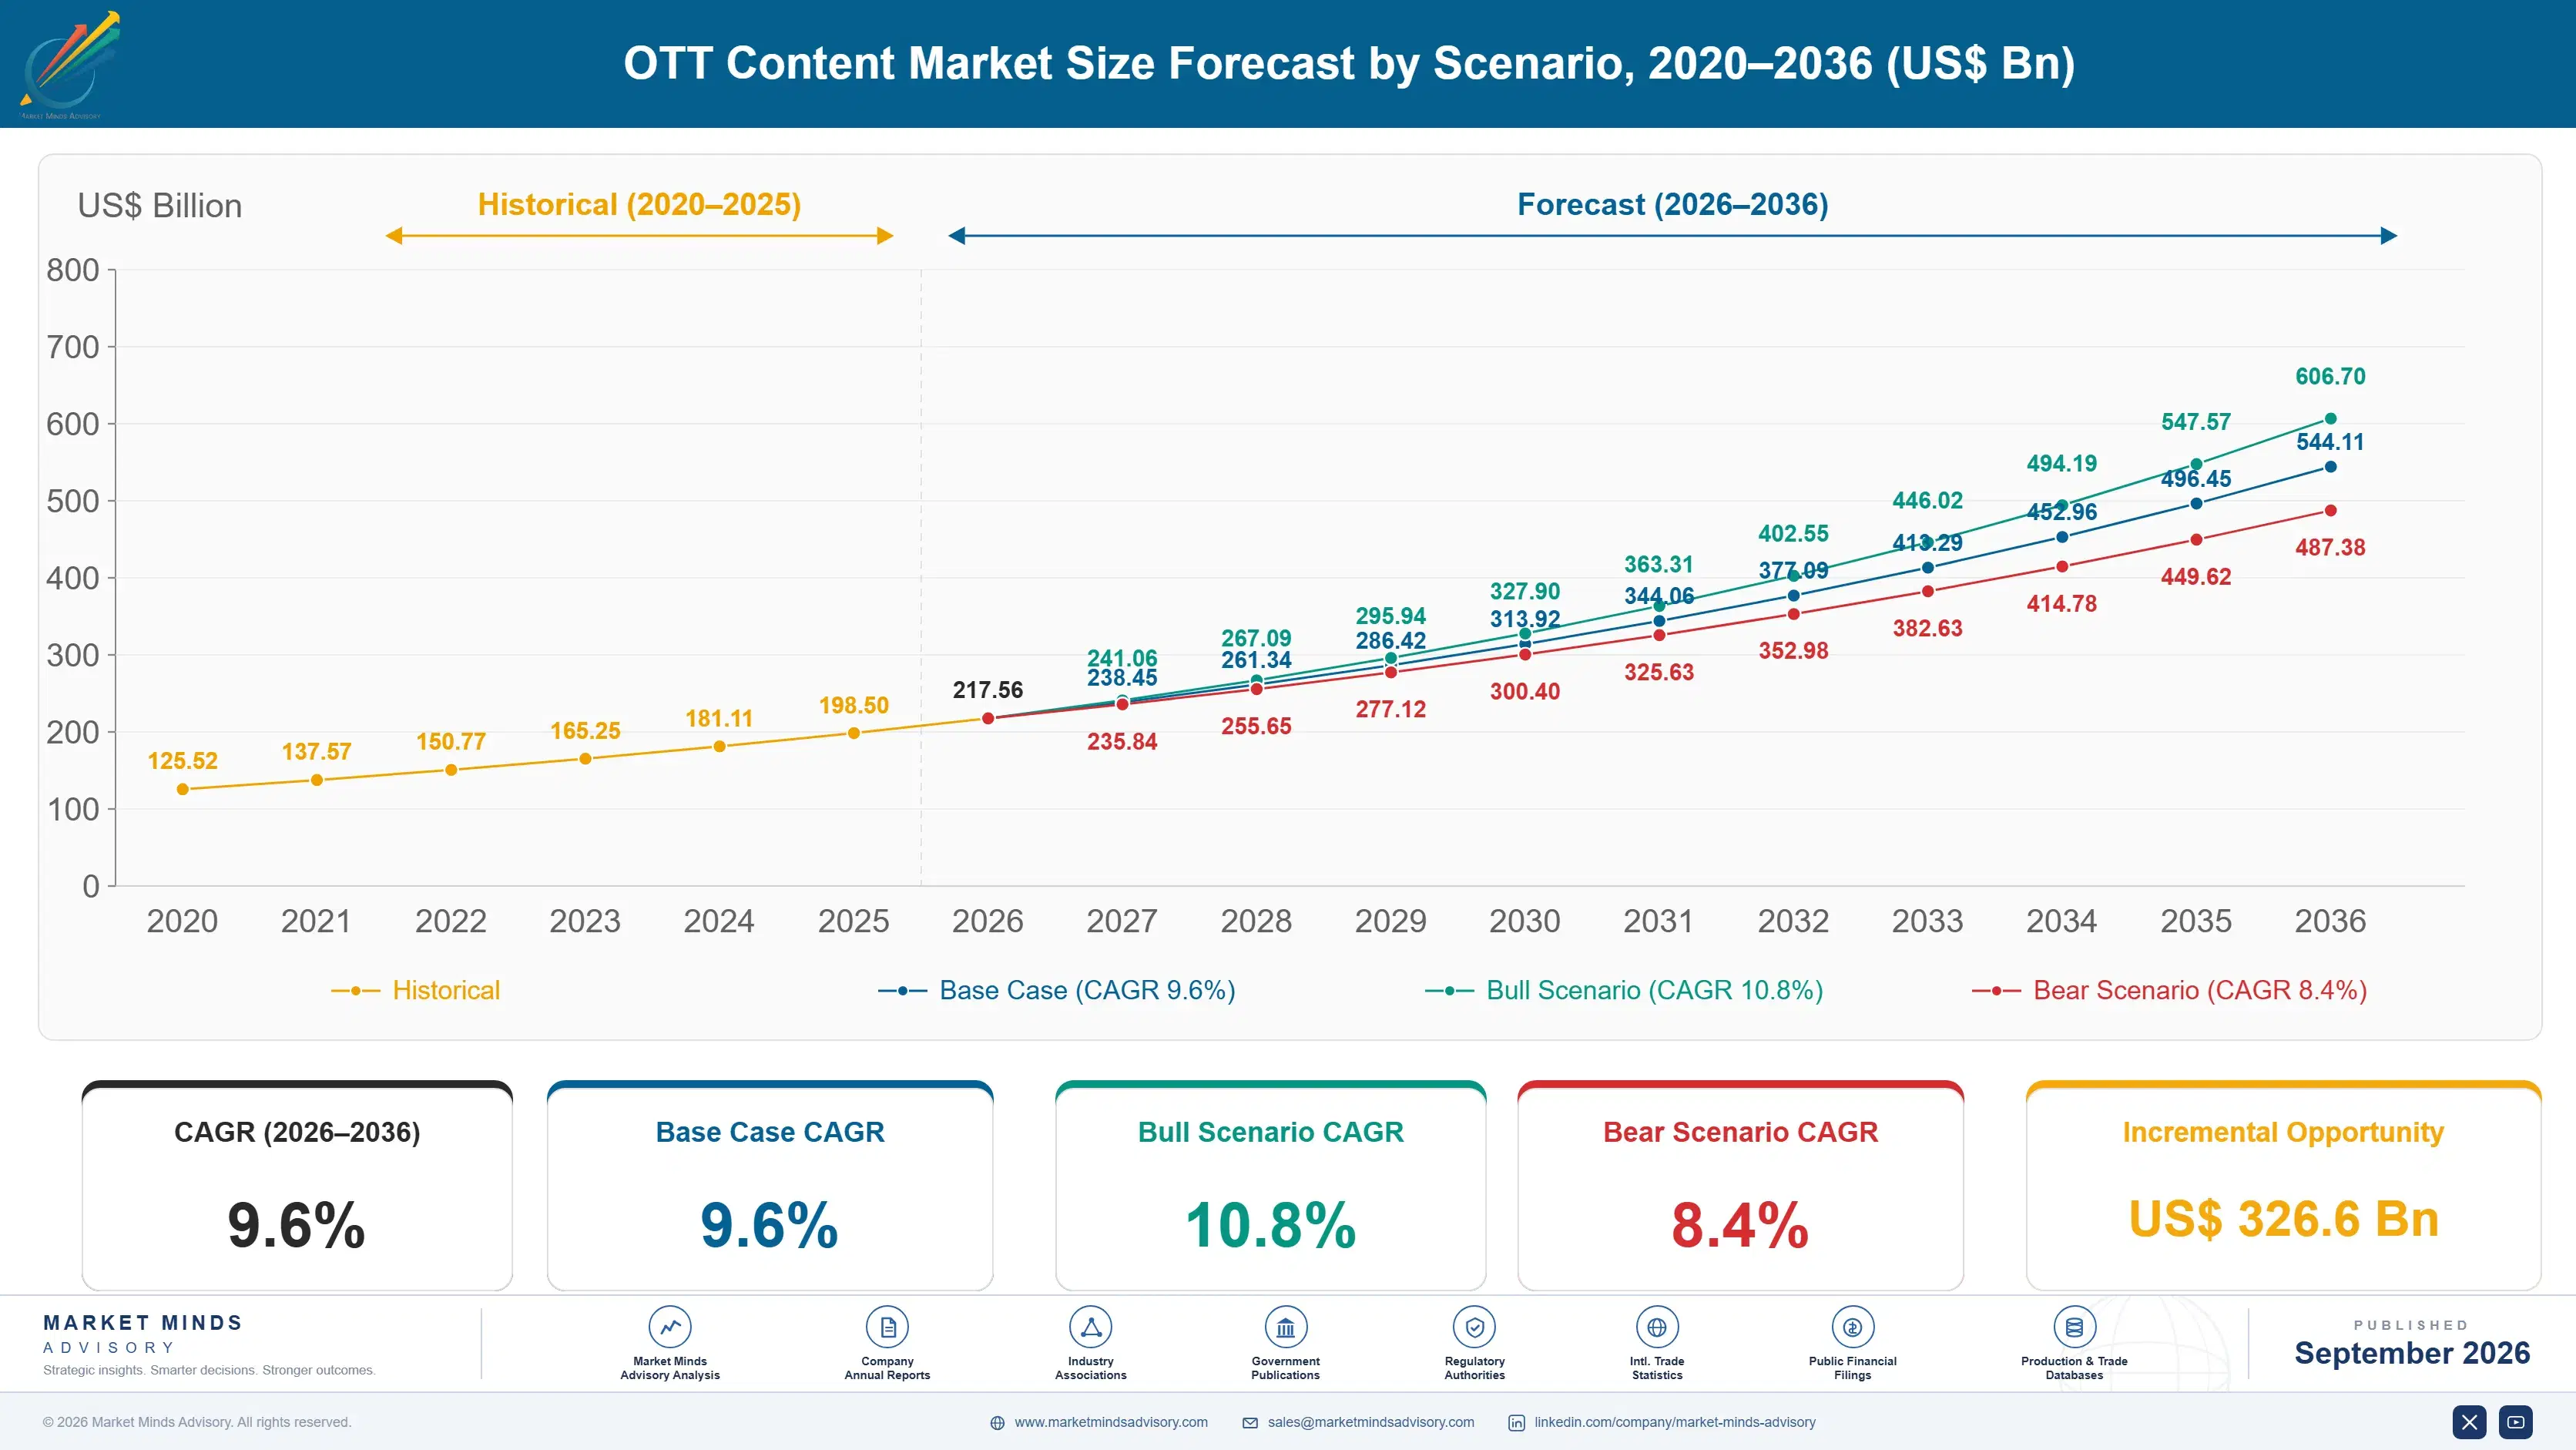
OTT Content Market Forecast Scenarios

over-the-top-ott-content-market-size-forecast-scenario-1788677735745
Between 2020 and 2025, OTT content investment grew steadily as pandemic-era subscriber growth funded aggressive original content spending across nearly every major platform, producing a historical CAGR of 8.6 percent as platforms competed for subscriber acquisition through exclusive original programming, expanding catalog depth, international market entry, and localized production capacity across every major region worldwide.
The base case rests on three commercial mechanisms: expanding live sports rights acquisition as platforms seek differentiated content that traditional broadcast cannot easily replicate, growing international content production reducing per-title cost while expanding regional subscriber appeal, and rising advertising-supported tier expansion creating new monetization pathways for licensed content. Together these mechanisms support a 9.6 percent compound annual growth rate through 2036, with live sports content contributing an increasing share of incremental revenue each year.
The bull case assumes accelerated live sports rights migration from traditional broadcast to streaming platforms, pushing growth toward 10.8 percent as platforms compete aggressively for premium sports licensing deals across every major league. The bear case reflects prolonged subscriber growth saturation across major established markets, slowing growth to 8.4 percent as platforms rationalize content spending toward proven titles.

Live Sports Rights Reshape Content Investment Priorities

Converging forces are reshaping content investment priorities across the sector: expanding live sports rights acquisition, mounting subscriber acquisition cost pressure, and growing platform willingness to pay premium prices for measurable engagement and retention improvement across every content category. Platforms demonstrating documented subscriber retention now command materially stronger content licensing negotiating position than those competing purely on baseline catalog breadth functionality alone.
MARKET CONCENTRATION46% CR5share held by top five content producers and platforms combined
AVERAGE CONTENT SPEND$4.8 billiontypical annual original content investment per major platform
TOP PRODUCING COUNTRY SHAREUSA 38%share of global content production spend concentrated domestically
ORIGINAL CONTENT SHARE58% of spendshare of total budgets allocated toward exclusive original programming
SPORTS RIGHTS GROWTH RATE31% annuallygrowth rate for streaming platform live sports rights acquisition
CONTENT RENEWAL RATE72% of titlesshare of successful original titles renewed for additional seasons
Commercial character in this market increasingly favors platforms offering tight integration between exclusive content and advertising-supported monetization tiers over standalone subscription-only services requiring separate revenue streams and billing infrastructure. Advertisers now evaluate platforms on content engagement metrics and live sports viewership rather than raw catalog size alone, reflecting a genuine shift in procurement criteria driven by shrinking traditional broadcast audiences across nearly every demographic segment and market.
The next decade will be shaped by live sports rights maturing from experimental streaming pilot into standard platform strategy across every major content category and subscriber tier, alongside tightening content licensing transparency regulation forcing platforms to embed documented rights compliance directly into distribution agreements. Platforms slow to adapt risk losing subscriber accounts to challengers offering exclusive premium sports content.
"A platform library full of reruns is a commodity now, subscribers stay for the live game nobody else can show them, and everyone in the industry knows it."
Senior Analyst, Media and Streaming Content Practice · MMA Technology Practice · September 2026

Market Trends

Live Sports Rights Migrate From Broadcast to Streaming

Major sports leagues are increasingly awarding exclusive streaming rights to OTT platforms rather than traditional broadcast networks, moving beyond the simulcast arrangements that historically preserved broadcast television as the primary live sports distribution channel across most markets and leagues. This shift addresses genuine platform subscriber acquisition needs, since sports content demonstrably drives new subscriptions and reduces churn at rates substantially exceeding scripted original programming across most demographic segments. Platforms offering the most comprehensive exclusive sports rights packages increasingly win subscriber growth over competitors relying primarily on scripted content libraries alone.
Market Impact: Lifts ad-supported content spend 26 percent

Regional Original Content Investment Expands Rapidly

Global platforms are increasingly investing in locally produced original content tailored to specific regional markets, moving beyond the dubbed and subtitled international content strategy that historically dominated platform expansion into new territories, language markets, cultural regions, demographic viewer groups, age brackets, and income segments. This capability addresses genuine subscriber growth constraints in mature markets, since international audiences increasingly demonstrate stronger engagement with culturally relevant local productions than imported foreign-language content. Platforms investing in dedicated regional production capacity increasingly win subscriber growth over competitors relying primarily on centrally produced content alone.
Market Impact: Expands paid subscriber conversion 19 percent

Market Opportunities and Growth Drivers

Advertising-Supported Tier Growth Drives Content Demand

Streaming platforms are increasingly launching advertising-supported subscription tiers to capture price-sensitive audiences unwilling to pay premium ad-free pricing, creating new content licensing demand tailored specifically for advertiser-friendly programming categories across every genre, demographic, viewing window, screen format, and household income bracket. This driver is reinforced by advertiser interest in accessing streaming audiences no longer reachable through declining traditional broadcast television viewership, creating a genuine funding source separate from subscriber acquisition alone. Platforms offering content libraries optimized for advertising compatibility increasingly win advertiser partnership deals over platforms lacking equivalent ad-supported content depth.
Market Impact: Raises production costs 15 percent

Password Sharing Crackdowns Expand Subscriber Base

Major platforms are increasingly enforcing account sharing restrictions that convert previously unpaid household viewers into paying subscribers, generating substantial incremental revenue that platforms are reinvesting directly into expanded content production budgets across every major content category and market segment. This driver is reinforced by growing platform confidence that enforcement generates net subscriber growth despite initial subscriber pushback, based on documented results from early enforcement markets. Platforms combining enforcement with compelling exclusive content increasingly convert former password-sharing viewers into loyal paying subscribers at higher rates than platforms lacking equivalent content depth.
Market Impact: Slows smaller platform growth 22 percent

Market Restraints and Challenges

Content Production Cost Inflation Pressures Margins

Streaming platforms face rising talent, production, and post-production costs that vary substantially across major production hubs, squeezing content investment returns well below historical margin expectations in many major markets. The root cause is genuine competitive bidding for scarce top-tier creative talent and production capacity rather than any single platform's inefficiency, making cost reduction difficult without compromising content quality standards. This friction translates into per-episode production costs routinely running 15 to 25 percent higher than budgeted five years ago, compressing expected returns. Platforms are addressing this through co-production partnerships and international production relocation reducing per-title cost exposure.
Market Impact: Lifts sports rights investment 31 percent

Subscriber Fatigue Limits Additional Platform Adoption

Consumers increasingly resist subscribing to additional streaming platforms given already substantial existing subscription spending across multiple services, limiting the addressable market for new platform launches and content differentiation strategies. The underlying cause is genuine household budget constraints on total streaming spending rather than any single platform's content quality shortfall, a constraint that content investment alone cannot resolve. This dynamic has slowed new subscriber growth for smaller platforms by an estimated 22 percent compared to earlier growth rates. Some platforms mitigate this through bundled multi-service offerings reducing effective per-platform subscription cost.
Market Impact: Expands regional content spend 24 percent
3 additional market trends, 4 additional growth drivers, and 2 additional restraints and challenges are covered in the full report. Contact sales@marketmindsadvisory.com to access the complete intelligence.

Segment CAGR and Growth Architecture

Segmentation follows content format and production ownership, the dimension platforms and rights holders use most consistently to evaluate subscriber engagement value and licensing economics across the industry and every subscriber tier. Six segments span the content spectrum from licensed third-party programming through emerging live sports rights, reflecting the market's ongoing engagement-driven transition and evolving platform priorities.
over-the-top-ott-content-market-market-share-analysis-1788677736300

Live Sports and Event Content

This segment covers exclusive streaming rights for professional sports leagues, tournaments, and live events, letting platforms capture the real-time viewership and subscriber acquisition benefits that traditional broadcast networks historically monopolized for decades across nearly every major market, country, demographic group, viewing generation, income bracket, and regional territory worldwide. Adoption is accelerating sharply as sports leagues increasingly favor streaming platforms offering larger rights fees and international distribution reach compared to traditional broadcast partnerships alone and their aging audience base and shrinking reach nationwide. Platforms embedding exclusive sports content natively report meaningfully higher subscriber acquisition and retention rates against competitors still relying primarily on scripted original programming without comparable live event differentiation.
CAGR 14.5%

Original Scripted Series and Films

This segment covers platform-commissioned scripted television series and feature films produced exclusively for streaming distribution, representing the content category that historically defined platform differentiation strategy throughout the first decade of the streaming era and its early rapid growth phase, expansion, global scaling, market consolidation, competitive positioning strategy, and lasting pricing power. Growth is driven by continued international expansion requiring locally relevant original productions and growing platform confidence in data-driven greenlighting decisions reducing costly production failures across every content genre, budget tier, and target audience group. Platforms offering the most consistently successful original content slates increasingly win subscriber retention over competitors relying primarily on licensed third-party programming lacking exclusive differentiation value.
CAGR 11.2%
Full segment breakdown across 6 segments available in the complete report.

Regional Architecture and Country Demand Map

Content investment concentrates wherever Hollywood-style production infrastructure and major platform headquarters cluster most densely, rather than following raw viewership distribution patterns worldwide. North America generates well over a third of global spend given its production base, though Asian markets are expanding local content investment quickly.

North America

Los Angeles and its surrounding production infrastructure host more scripted content production capacity than any other region worldwide, a genuine outcome of decades of studio, talent agency, and technical crew concentration that developed specifically around Hollywood filmmaking. This share sits above the standard regional band because content spend is recognized where production and platform headquarters activity occurs, and Netflix, Disney, and Warner Bros Discovery all maintain primary content development operations domestically, reinforcing revenue concentration that compounds with every renewal cycle. Canadian production incentives add meaningful incremental volume, particularly across tax-credit-driven television and film production. Vendors serving this market increasingly build dedicated regional production teams working closely with domestic talent agencies and studios.
Share: 36% | CAGR: 10.4% (2026 to 2036)

Western Europe

British and German production hubs anchor regional content investment, benefiting from strong domestic broadcasting heritage and government production incentive programs supporting local content development. Nordic countries show growing content export success given internationally popular crime drama and thriller genre productions reaching global platform audiences. Continental European Union content quota requirements increasingly favor local production investment, pushing platforms toward regional production partnerships across France, Germany, and Italy specifically to satisfy regulatory obligations. Vendors succeeding here typically maintain long-standing relationships with national broadcasting associations across multiple countries and regulators. These relationships shorten content approval timelines meaningfully compared to platforms lacking equivalent regulatory familiarity and history. Adoption pace holds broadly steady across most national markets and content categories today.
Share: 19% | CAGR: 8.0% (2026 to 2036)
Regional intelligence for 5 additional markets available in the complete report: East Asia, South Asia and Pacific, Latin America, Middle East and Africa, Eastern Europe. Contact sales@marketmindsadvisory.com.
over-the-top-ott-content-market-country-cagr-analysis-1788677736815

Capturing Value From Sports Rights Investment

Platforms capture incremental revenue through four distinct mechanisms tied to genuine subscriber engagement pain points rather than generic per-title licensing alone or arbitrary tier naming conventions used elsewhere in the industry. Together these levers determine which platforms compound content investment value fastest as live sports and advertising-supported monetization reshape streaming economics across every content category.

Premium Pricing for Exclusive Sports Rights Tiers

Platforms increasingly charge subscription prices roughly 20 to 30 percent higher for tiers bundling exclusive live sports content alongside standard programming libraries, justified by the significant additional rights acquisition cost required to secure exclusive league and tournament broadcasting agreements across every major sporting category and geographic region. This pricing separates commodity catalog subscription revenue from differentiated sports revenue, letting platforms capture value proportional to genuine rights investment rather than charging flat rates regardless of exclusive content depth. Subscribers facing limited alternative access to premium sports content increasingly accept this premium once exclusive rights agreements are finalized.
Market Impact: Adds a 18 to 25 percent sports tier premium

Advertising-Supported Tier Attachment Revenue Growth Model

Platforms increasingly generate incremental advertising revenue by offering discounted, ad-supported subscription tiers that capture price-sensitive audiences unwilling to pay premium ad-free pricing for equivalent content access, viewing quality, streaming experience, and complete content catalog depth. This model appeals particularly to advertisers seeking access to streaming audiences no longer reachable through declining traditional broadcast television viewership across most major demographic segments and age groups. Platforms offering the most sophisticated advertising targeting technology increasingly win larger advertiser commitments, typically 20 to 30 percent above standard rate cards, over competitors offering less refined audience segmentation capability.
Market Impact: Generates 15 to 20 percent of platform revenue

International Content Licensing Distribution Revenue Stream

Platforms increasingly license successfully performing original content to international broadcasters and competing platforms in markets where they lack direct distribution presence, generating incremental revenue, often 10 to 15 percent of a title's production budget, from content that would otherwise sit unused outside its primary distribution territory, market, licensing region, and existing subscriber base entirely. This model appeals particularly to smaller platforms lacking sufficient international infrastructure to distribute content directly across every global market themselves without external partnership support. Platforms with the strongest original content libraries increasingly win these licensing deals over competitors offering less proven programming.
Market Impact: Adds 10 to 14 percent recurring licensing revenue

Co-Production Partnership Cost-Sharing Revenue Model Structure

Platforms increasingly structure co-production partnerships with international studios and rights holders, sharing production costs and distribution revenue in exchange for reduced upfront capital investment risk on expensive original productions across every content category, budget tier, target market, and audience demographic segment. These partnerships often generate margins exceeding 50 million dollars per major international co-production agreement, since shared risk enables platforms to pursue ambitious productions that would otherwise exceed individual platform budget authority. This revenue stream also deepens studio relationships considerably, since successful partnerships typically lead to expanded future co-production commitments and renewed slate agreements.
Market Impact: Generates over 50 million dollars per co-production deal

Who Controls the Margin Pool

Content investment concentration keeps rising, and cr5 sits at 46 percent among the top five global platforms measured by subscriber base. Netflix maintains the widest content spend lead over its closest challenger, Disney, a gap that has narrowed only slightly since 2023 despite aggressive rival spending increases. Below the top five, competitive intensity remains sharp.
Current competitive activity centers on sports rights auctions, ad-tier expansion, and password-sharing crackdowns that convert casual viewers into paying subscribers. Warner Bros Discovery and Comcast have both consolidated streaming assets under single apps this year, cutting duplicate marketing spend while widening content libraries. Amazon continues bundling Prime Video with retail membership, a distribution advantage rivals structured around subscription fees alone cannot easily replicate without their own retail or telecom footprint.

Emerging pressure comes from regional platforms in India and Southeast Asia building localized sports and film libraries that global players cannot match on price or cultural specificity. Rankings could shift meaningfully if a mid-tier player secures marquee sports rights before 2028, since sports content increasingly drives subscriber retention more than scripted programming does across nearly every major national market segment today.
over-the-top-ott-content-market-company-positioning-matrix-1788677737345

Competitive Moat and Risk Dimensions

NETFLIX INC

Moat: Global content scale advantage

Netflix operates the widest simultaneous content release footprint across nearly every national market, letting it amortize marketing and localization spend over a subscriber base larger than any single rival. This scale lets it outbid regional challengers for global rights while still funding a deep local-language original slate that smaller platforms cannot match economically.
NETFLIX INC

Risk: Password sharing revenue erosion

Netflix's paid-sharing crackdown lifted near-term revenue but risks accelerating churn in price-sensitive markets where household account sharing was culturally embedded for years. If regional competitors offer materially cheaper multi-user pricing tiers, Netflix could see disproportionate subscriber losses concentrated specifically in South Asia and Latin America over the coming several quarters.
THE WALT DISNEY COMPANY

Moat: Franchise intellectual property depth

Disney controls franchise properties spanning Marvel, Star Wars, Pixar, and legacy animation that generate durable rewatch value and merchandising revenue no pure streaming competitor owns. This lets Disney cross-subsidize its platform economics through theme park and consumer products revenue streams unavailable to Netflix or Warner Bros Discovery.
THE WALT DISNEY COMPANY

Risk: Linear television decline drag

Disney's traditional cable television networks continue losing subscribers and advertising revenue faster than streaming gains can offset, pressuring overall segment margins throughout this multi-year transition period. Continued linear erosion could force further restructuring charges that distract management attention and capital away from streaming platform investment priorities going forward.

Players Tracked

Prominent Players

Netflix Inc
The Walt Disney Company
Warner Bros Discovery Inc
Amazon.com Inc
Comcast Corporation

Other Key Players

Paramount Global
Sony Pictures Entertainment Inc
Apple Inc
Lionsgate Studios Corp
A24 Films LLC
Legendary Entertainment
Skydance Media
Banijay Group SAS
Fremantle Ltd
ITV plc
All3Media
Zee Entertainment Enterprises Ltd
Reliance Industries Limited
CJ ENM Co Ltd
Toei Animation Co Ltd

Recent Developments

MARCH 2026

Warner Bros Discovery completed its planned merger of Max and Discovery+ subscriber bases into a single unified application, consolidating billing systems and content recommendation engines. The combined platform reported reduced customer acquisition costs within the first full quarter following integration, alongside modestly improved average revenue per subscriber.
Signal: Signals continued platform consolidation pressure on smaller standalone streaming services lacking scale to compete effectively alone.
JANUARY 2026

Amazon renewed its global streaming rights agreement for a major international football competition, expanding live sports programming available exclusively through Prime Video across several previously uncovered national markets and language regions. The agreement extends multi-year exclusivity and includes expanded local-language commentary production commitments across every covered territory.
Signal: Confirms sports rights remain the primary subscriber acquisition and retention lever across nearly every major streaming platform.
JUNE 2025

Comcast completed the planned spin-off of most cable networks into a separately traded entity, retaining Peacock and core streaming assets under NBCUniversal's continuing corporate structure. The transaction let Comcast focus capital allocation on streaming platform investment rather than continuing to fund declining linear network operations indefinitely.
Signal: Reflects broader industry recognition that streaming and linear television economics increasingly diverge going forward across most markets.

Content Production Cost Exposure

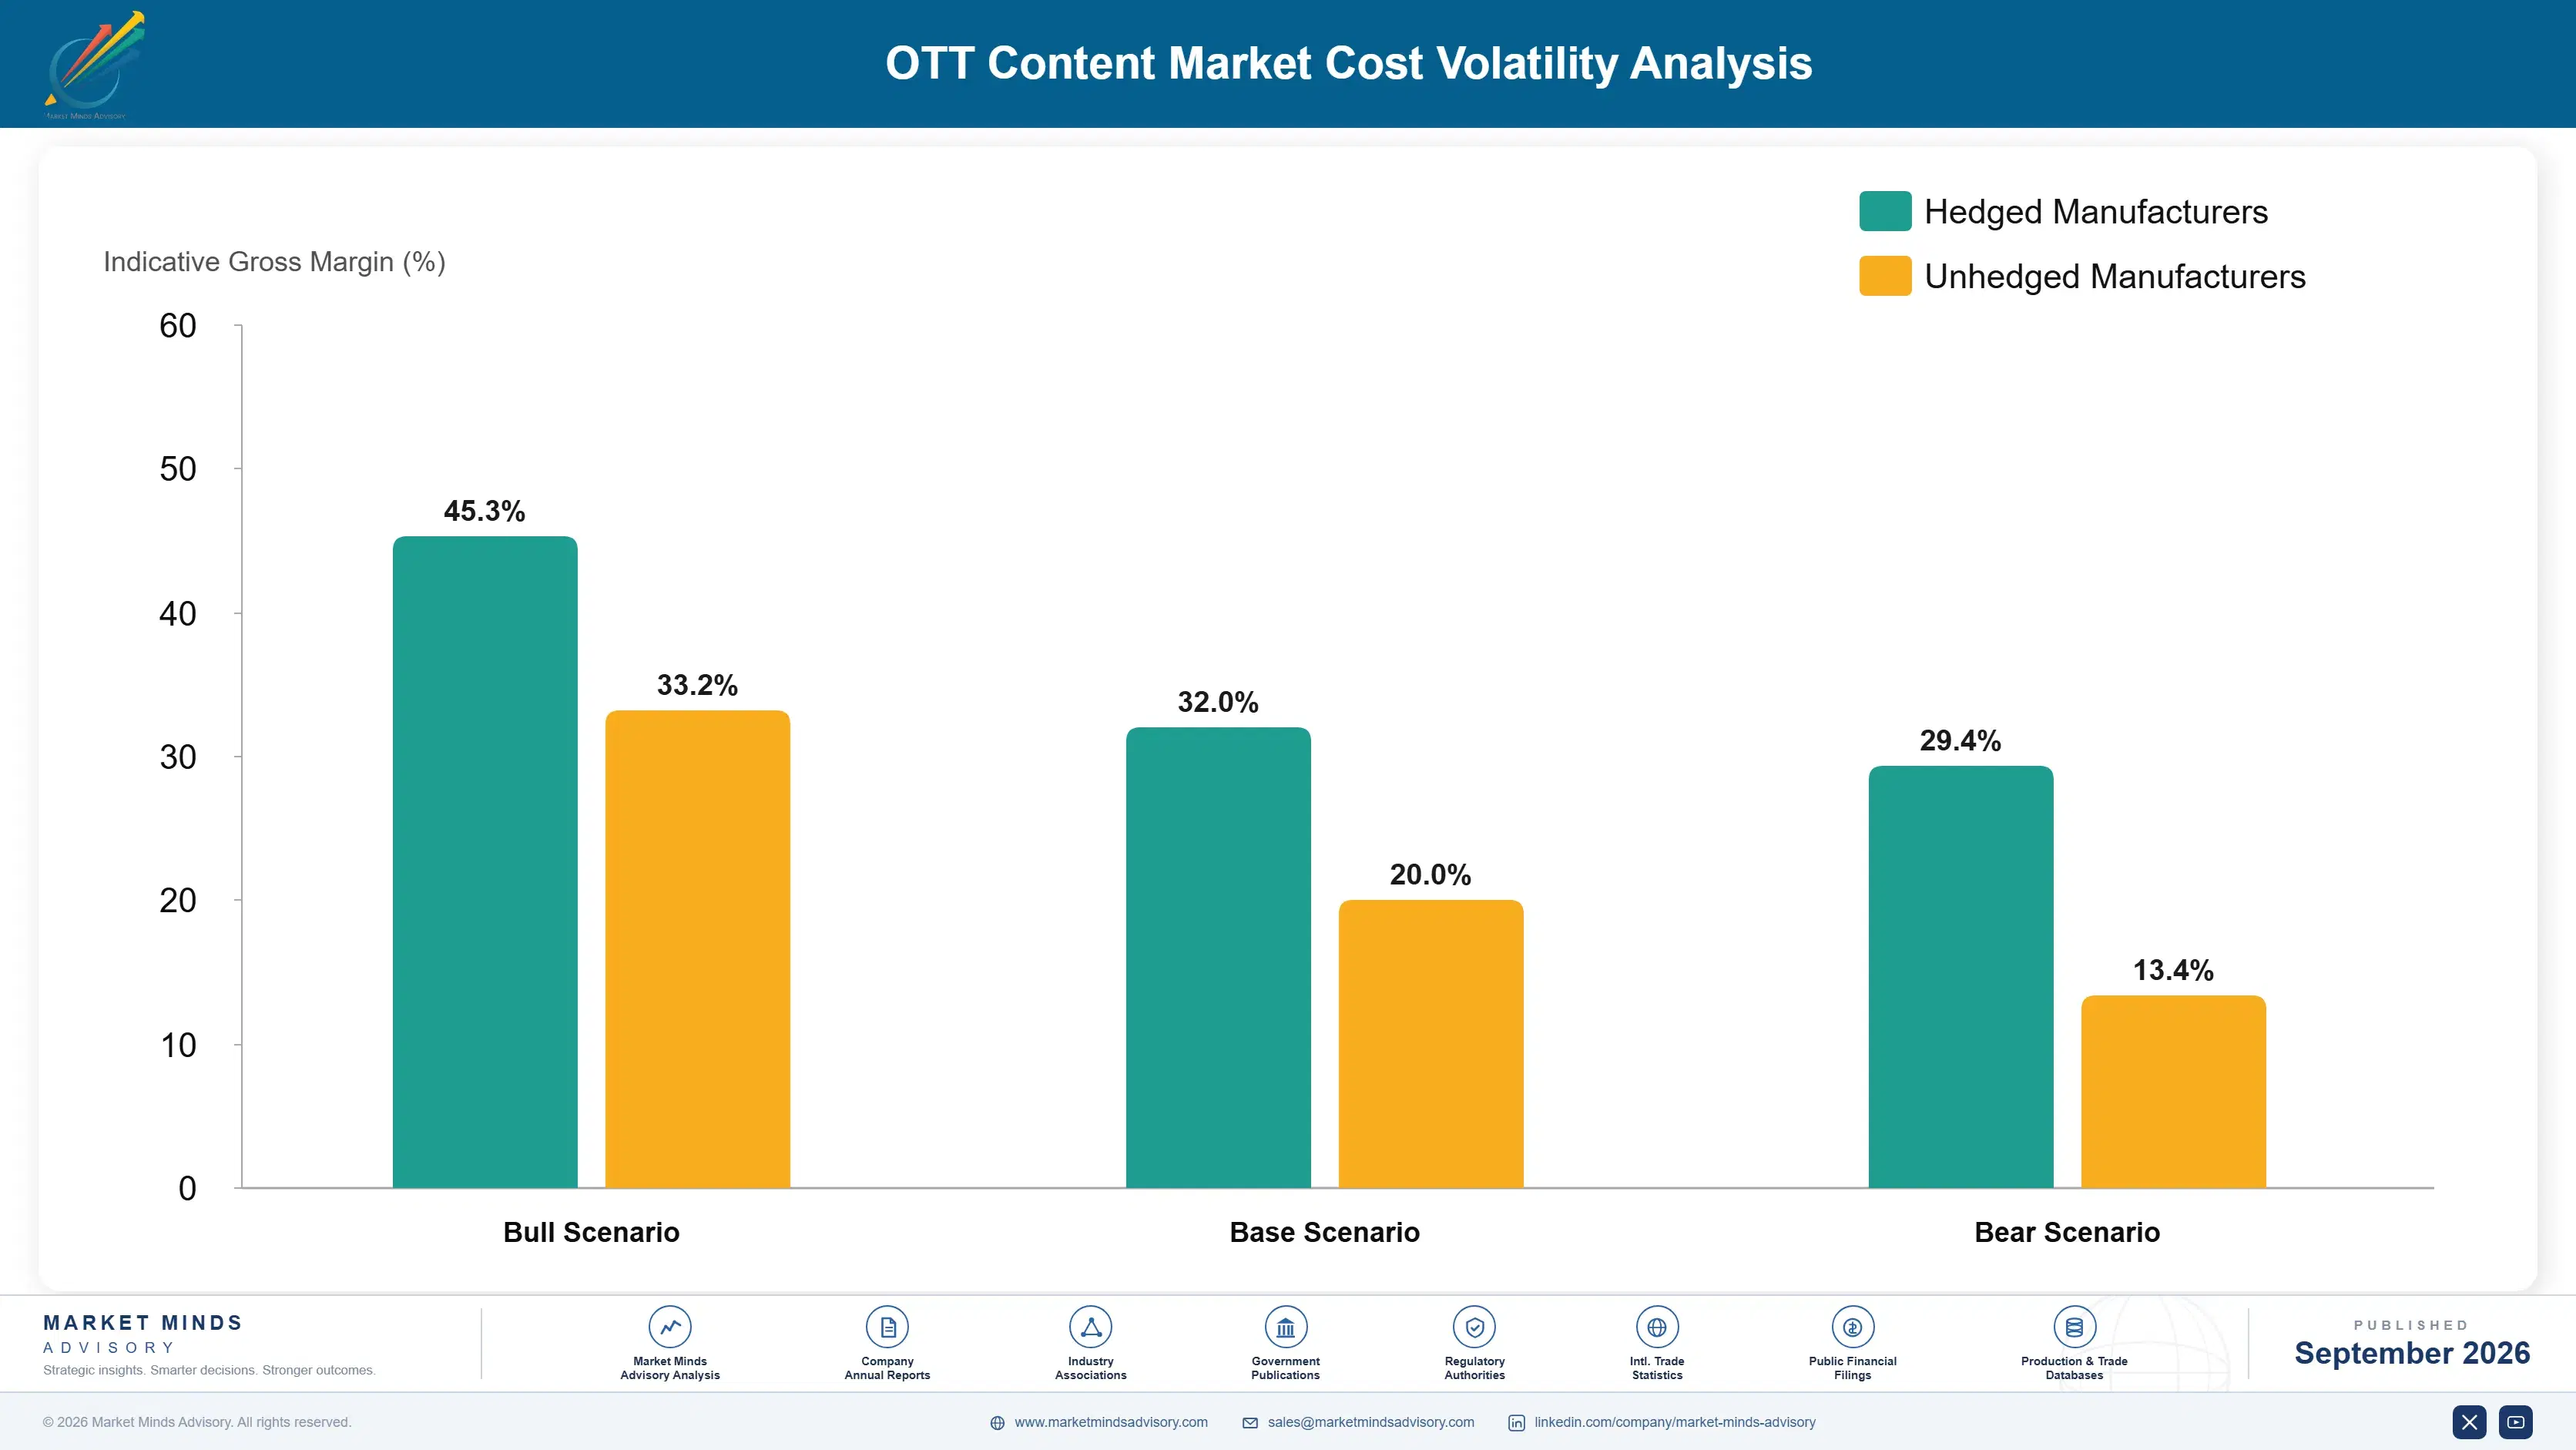
Original content production and licensing acquisition together represent roughly 60 to 65 percent of platform cost of goods sold, sourced primarily from in-house studio production, third-party independent studios, and international co-production partners across North America, Western Europe, and increasingly parts of East Asia. Talent compensation, union labor agreements, and location production costs drive most of this spend.
The 2023 Hollywood writers and actors strikes delayed dozens of major productions and pushed several platforms to increase reliance on international and unscripted content temporarily, according to company annual reports filed during that period. Resulting production delays compressed content release calendars into 2024 and 2025, forcing platforms to spend materially more on marketing to sustain subscriber engagement during thinner content windows than originally planned by finance teams.

Smaller platforms without large in-house production infrastructure face proportionally higher per-title costs than vertically integrated majors like Disney and Warner Bros Discovery, since they must pay external studios full commercial rates without internal cost absorption capacity of their own. Platforms operating primarily in markets with weaker currencies also face amplified dollar-denominated content licensing costs, widening the competitive gap versus dominant players considerably over time.
over-the-top-ott-content-market-cost-volatility-analysis-1788677737540

Diversify Production Across Lower-Cost Regions

Platforms increasingly shift production volume toward lower-cost filming locations in Central Europe, Canada, and parts of Asia, capturing tax incentives and favorable currency exchange rates worth 15 to 20 percent of budget. This reduces average per-episode production costs meaningfully while maintaining comparable production quality standards, letting platforms fund a larger content slate within existing budget constraints.

Expand Owned Studio Production Capacity

Building owned soundstage and post-production capacity reduces reliance on third-party vendors charging full commercial markup rates on every production across the entire annual slate. Vertically integrated platforms capture savings on equipment rental, crew staffing, and facility costs that otherwise flow to external studio partners, improving overall content margin structure over multi-year investment horizons considerably and predictably.

Lock Multi-Year Talent and Studio Agreements

Securing multi-year output deals with top-tier talent and independent studios at fixed rates protects platforms against rising per-project costs during future labor negotiations or sudden demand spikes. This pricing certainty lets finance teams plan content budgets several years ahead with materially less exposure to unpredictable spot-market cost volatility and currency swings across every major production region.

Portfolio Architecture for Margin Defence

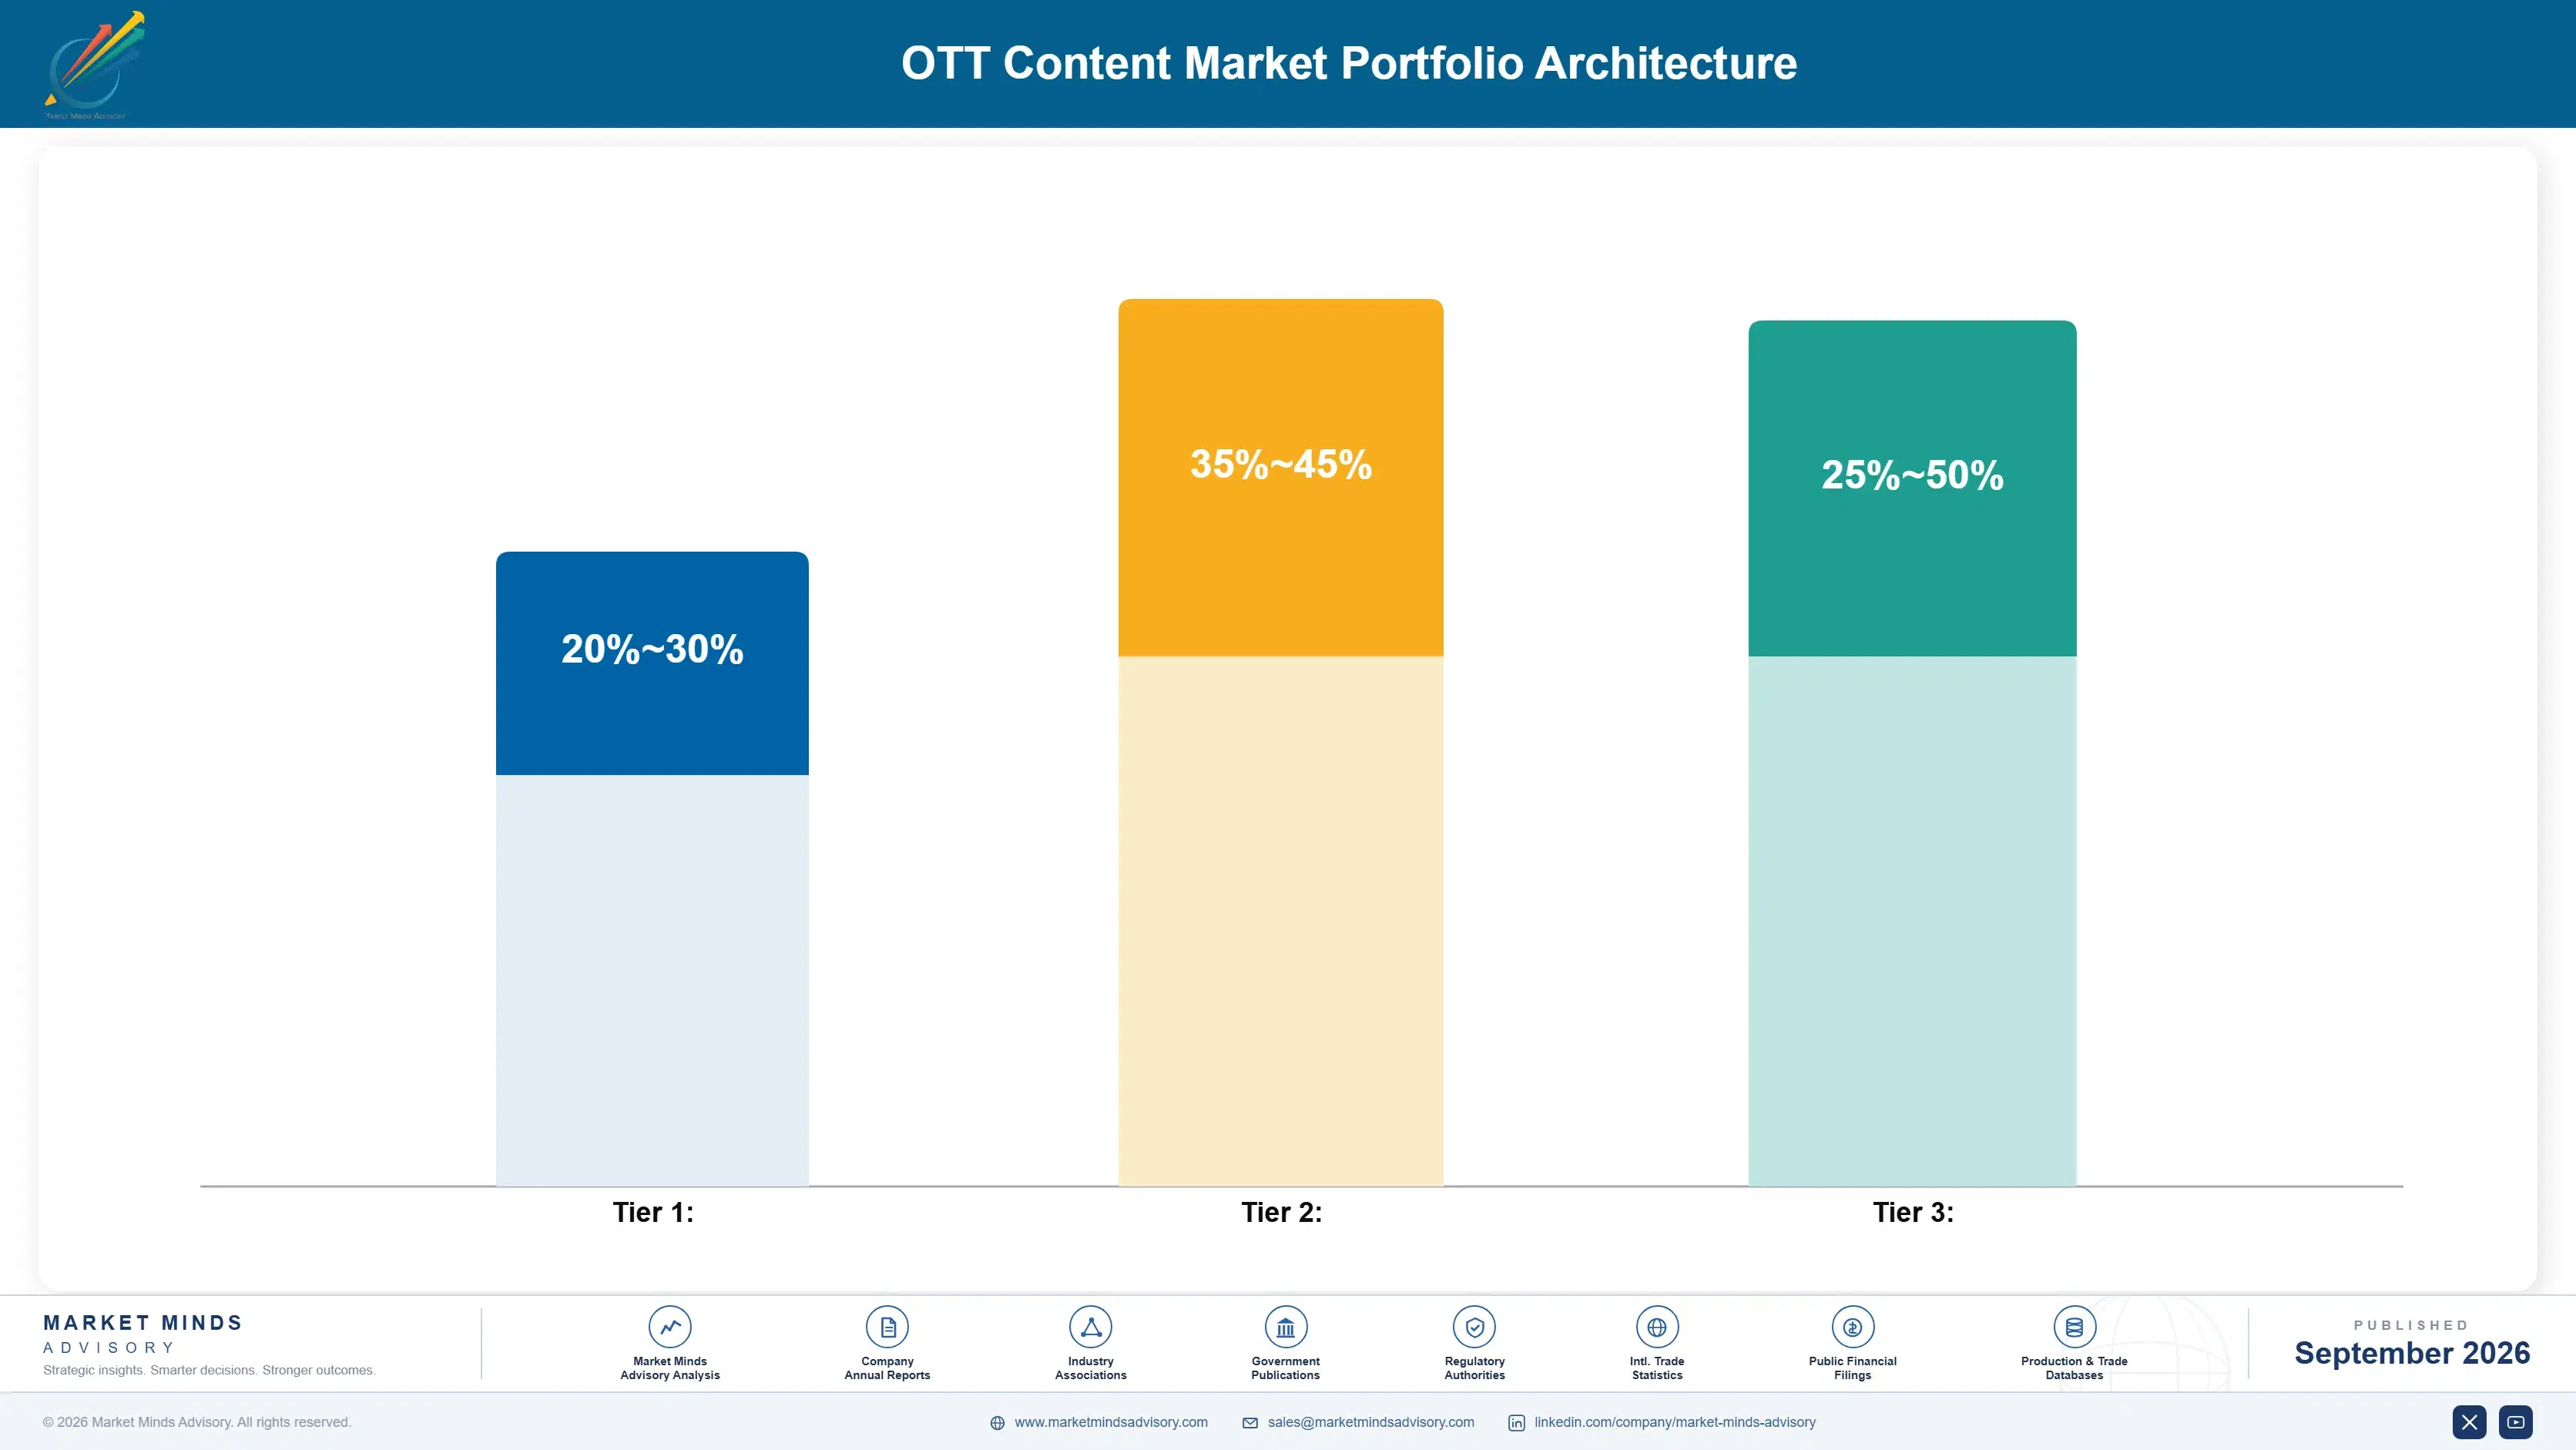
Platform economics split cleanly into three tiers by content investment intensity and subscriber value capture. Volume-tier ad-supported subscriptions carry gross margins around 20 to 30 percent, while premium ad-free and sports-bundled tiers reach 35 to 45 percent. Next-generation interactive and localized regional content commands the widest margin variance, since production discipline differs enormously between markets, formats, and audience segments.
Tension between volume and premium tiers centers on subscriber cannibalization: platforms fear ad-supported tiers pull existing full-price subscribers downward rather than purely capturing new price-sensitive audiences who would otherwise churn entirely and unsubscribe. Most operators now report net positive migration, since ad-tier subscribers rarely would have paid full price otherwise, expanding total addressable revenue rather than eroding it across most measured cohorts and markets.

High-value margin pools concentrate overwhelmingly in exclusive live sports rights and franchise intellectual property, where subscriber willingness to pay premium pricing remains durable across economic cycles, demographic segments, and household income brackets. Regional-language original content increasingly commands outsized margins too, since production costs run far below Hollywood-scale budgets while local subscriber loyalty and retention rates hold comparably strong across most covered territories today.

Ad-supported subscription tiers and catalog-driven library content aimed at price-sensitive audiences, prioritizing subscriber volume over per-user revenue capture across broad demographic segments in most covered international markets and territories today.
Gross Margin: 20-30%

Ad-free subscription tiers bundled with exclusive live sports rights and flagship original programming, commanding higher per-subscriber revenue from audiences with strong willingness to pay premium pricing across most demographic and income segments.
Gross Margin: 35-45%

Interactive, localized regional-language content and emerging co-viewing formats where margin outcomes vary widely depending on production cost discipline, regional subscriber loyalty strength, and how effectively platforms localize distribution and marketing spend.
Gross Margin: 25-50%
over-the-top-ott-content-market-portfolio-architecture-1788677738046

High-value Sub-segments and Strategic Watch-out

Live Sports and Event Content

Exclusive live sports rights drive the strongest subscriber acquisition and retention economics across nearly every major platform today, commanding premium ad rates and record-setting renewal pricing during rights negotiation cycles that recur every several years across football, basketball, cricket, and motorsport properties worldwide and domestically.

Original Scripted Series and Films

Flagship scripted originals continue anchoring subscriber retention despite rising per-title production costs, though moderate growth reflects saturation among major platforms already funding large annual content slates across most established international territories, languages, and demographic segments simultaneously today, leaving limited incremental headroom for further meaningful expansion.

Catalog and Library Content

Deep back-catalog libraries retain steady baseline viewership and support platform stickiness at comparatively low incremental cost, functioning as the reliable volume core underpinning most subscription tiers across every major region, demographic cohort, and household income bracket consistently and predictably over multi-year retention cycles and renewal periods.

Password Sharing Enforcement Backlash

Aggressive account-sharing crackdowns risk alienating price-sensitive households in emerging markets where shared viewing was culturally embedded for years, a strategic watch-out that could accelerate churn if cheaper regional alternatives expand distribution quickly, aggressively, and with materially lower pricing structures across comparable content catalogs and libraries.

Renewal Economics of OTT Content Investment

OTT content investment runs on multi-year rights acquisition and production commitment cycles tied to subscriber retention performance, producing recurring licensing revenue that compounds as platforms expand catalog depth across successive content seasons and renewal windows. Renewal rates exceed 70 percent among successful original titles once audience metrics validate continued investment, since discontinuing popular franchises carries genuine subscriber churn and brand reputation risk.
Adoption depth varies meaningfully by content category across the platform base. Premium global platforms deploy the deepest content investment, often producing dozens of exclusive original titles simultaneously across multiple genres and regional markets, while smaller regional platforms typically license only a modest catalog supplemented by limited local production. Sports-focused platforms show growing investment depth as exclusive rights acquisition expands beyond traditional broadcast windows.

Buyer profiles are shifting generationally as data-driven content executives replace veteran programming chiefs who once relied on intuition-based greenlighting decisions built over decades of traditional broadcast industry experience and instinct. Younger buyers expect real-time viewership analytics and audience retention data by default, pushing platforms to prioritize measurable engagement metrics over the subjective creative judgment that once defined content investment decisions in this industry.
over-the-top-ott-content-market-end-use-penetration-index-1788677738540

Streaming Content Investment Playbook

These are among the four positions where our research anticipates prominent divergence between winners and laggards over the coming forecast period. Each is grounded in the demand model, the regulatory perimeter, and the announced capacity pipeline.
01 / SPORTS RIGHTS STRATEGY

Prioritize exclusive live sports rights over incremental scripted spend

Sports content now drives subscriber retention more reliably than scripted originals across nearly every major national market, and rights costs keep rising sharply as more well-capitalized platforms bid aggressively for the same limited broadcast inventory available each season. Operators that lock multi-year exclusivity agreements now secure meaningful pricing certainty before the next renewal cycle pushes acquisition costs even higher across every major sports property and territory. Waiting even one additional negotiation cycle risks losing marquee rights permanently to a better-capitalized, more aggressive rival entirely.
02 / REGIONAL LOCALIZATION PUSH

Expand regional-language content production ahead of subscriber saturation

South Asia and Pacific markets are growing fastest among all seven covered regions, and local-language content converts far better than dubbed international programming in most tested consumer markets across the region today. Platforms that under-invest in regional production infrastructure risk losing early-mover advantage permanently to domestic competitors who understand cultural nuance and local storytelling conventions far more intimately than global studios. Building local production capability now costs materially less than acquiring it later through expensive acquisition once entrenched regional rivals establish themselves.
03 / AD-TIER MONETIZATION DISCIPLINE

Refine advertising technology before expanding ad-supported tier further

Ad-supported tiers now generate a meaningful and growing share of platform revenue, but only where targeting technology matches the broadcast-grade sophistication that major advertisers actually demand before committing meaningful budget across a full year. Platforms rushing tier expansion without matching ad infrastructure investment risk underpricing valuable inventory and training advertisers to expect permanent discount rates that prove difficult to unwind later once established. Getting the underlying technology right first protects long-term advertising yield across every subsequent negotiation cycle, renewal, and upfront commitment.
04 / COST DISCIPLINE REBALANCING

Rebalance production geography toward lower-cost, tax-favorable locations

Production costs keep climbing steadily across traditional Hollywood filming locations, and margin pressure will only intensify further as sports rights spend increasingly crowds out available scripted content budgets across most major streaming platforms today. Shifting incremental production volume toward Central Europe, Canada, and parts of Asia captures valuable tax incentives without meaningfully sacrificing the content quality standards that subscribing audiences have come to expect and demand. Platforms that delay this rebalancing risk ceding durable margin advantage to more disciplined, cost-conscious competitors permanently and irreversibly.

Engagement Snapshot From the Field

A live engagement with an industry participant carrying material or product regulatory and market exposure ahead of a defining policy shift, showing how our research translates into a defensible multi-year portfolio strategy.
MARKET MINDS ADVISORY · CLIENT ENGAGEMENT SUMMARY
OTT Content Producer Strategic Portfolio Review and Transition Roadmap 2026·Investment Scenario on OTT Content Exposure Evaluation 2025-26
CLIENT PROFILE
The client operates a mid-tier regional streaming platform serving several Southeast Asian markets, with roughly 8 million paid subscribers and revenue exceeding 140 million dollars annually (client-reported, unverified by MMA). The platform competes against much larger global entrants while maintaining stronger local-language content depth and cultural relevance than international rivals typically achieve in these specific national markets.
STRATEGIC CHALLENGE
The client faced accelerating subscriber growth deceleration as two global platforms launched aggressive localized content investment programs in its core markets. Management needed an independent assessment of whether continued organic growth alone would sustain competitive position, or whether the platform required external capital, partnership, or acquisition to defend its subscriber base credibly.
MMA APPROACH
MMA conducted primary interviews with regional advertising buyers, content licensors, and telecom distribution partners across the client's four core markets over six weeks. Analysts benchmarked the client's content spend efficiency and subscriber economics against comparable regional platforms in Latin America and Eastern Europe facing similar competitive pressure from global entrants.
KEY FINDINGS
  1. Local-language original content converted subscribers at nearly triple the rate of dubbed international programming across every tested demographic segment and national market studied.
  2. Global entrants underpriced local advertising inventory initially, creating a temporary window for the client to lock multi-year advertiser commitments at favorable rates.
  3. Telecom bundling partnerships drove lower customer acquisition costs than any other channel tested, cutting effective subscriber acquisition spend by roughly 35 percent.
  4. Content licensing partnerships with regional broadcasters generated meaningful incremental revenue without requiring additional original production investment or expanded internal studio capacity and staffing.
CLIENT PROFILE
The client operates a mid-tier regional streaming platform serving several Southeast Asian markets, with roughly 8 million paid subscribers and revenue exceeding 140 million dollars annually (client-reported, unverified by MMA). The platform competes against much larger global entrants while maintaining stronger local-language content depth and cultural relevance than international rivals typically achieve in these specific national markets.
STRATEGIC CHALLENGE
The client faced accelerating subscriber growth deceleration as two global platforms launched aggressive localized content investment programs in its core markets. Management needed an independent assessment of whether continued organic growth alone would sustain competitive position, or whether the platform required external capital, partnership, or acquisition to defend its subscriber base credibly.
MMA APPROACH
MMA conducted primary interviews with regional advertising buyers, content licensors, and telecom distribution partners across the client's four core markets over six weeks. Analysts benchmarked the client's content spend efficiency and subscriber economics against comparable regional platforms in Latin America and Eastern Europe facing similar competitive pressure from global entrants.
KEY FINDINGS
  1. Local-language original content converted subscribers at nearly triple the rate of dubbed international programming across every tested demographic segment and national market studied.
  2. Global entrants underpriced local advertising inventory initially, creating a temporary window for the client to lock multi-year advertiser commitments at favorable rates.
  3. Telecom bundling partnerships drove lower customer acquisition costs than any other channel tested, cutting effective subscriber acquisition spend by roughly 35 percent.
  4. Content licensing partnerships with regional broadcasters generated meaningful incremental revenue without requiring additional original production investment or expanded internal studio capacity and staffing.
RECOMMENDED STRATEGY
Phase 1: Phase one: lock telecom bundling partnerships across all four core markets within two quarters to secure lower-cost subscriber acquisition immediately. Phase 2: Phase two: expand regional-language original content production budget by 40 percent, prioritizing formats proven to convert subscribers most reliably across markets. Phase 3: Phase three: pursue selective content licensing partnerships with regional broadcasters to generate incremental revenue without new capital investment or added risk.
OUTCOME
Within twelve months of implementation, the client reported subscriber growth returning to positive territory and advertising revenue increasing by roughly 22 percent year over year (client-reported, unverified by MMA). Telecom bundling partnerships now account for a meaningful share of new subscriber acquisition, reducing blended acquisition cost materially versus the prior year.

Frequently Asked Questions

Foundational context covering the market sizes, CAGR, scope, country, region and competition that inform every finding below. This section is provided to cover basics and most often pre-purchase conversations, answered from the MMA Primary Research Dataset.

What is the current size of the OTT Content Market?

The OTT Content Market reached 198.5 billion dollars in 2025, the base year for this report's forecast. Growth continues at a compound annual rate of 9.6 percent through 2036, driven primarily by sports rights investment and expanding international subscriber bases.

How large will the OTT Content Market be by 2036?

The market is projected to reach 544.11 billion dollars by 2036, representing a 2.50 times expansion from its 2026 value. Live sports content and regional-language original programming drive most of this incremental growth across nearly every covered territory.

What is the CAGR for the OTT Content Market 2026 to 2036?

The base case compound annual growth rate is 9.6 percent across the ten-year forecast window. Bull case scenarios reach 10.8 percent on accelerated sports rights investment, while bear case scenarios fall to 8.4 percent.

Which segment is growing fastest?

Live Sports and Event Content grows fastest at a 14.5 percent compound annual rate, roughly 1.51 times the overall market average. Original Scripted Series and Films follows as the second-fastest visible segment at 11.2 percent.

Who are the major companies in the OTT Content Market?

Netflix, Disney, Warner Bros Discovery, Amazon, and Comcast lead the field, together representing roughly 46 percent combined concentration. Paramount, Sony Pictures, and Apple also maintain meaningful competitive positions across several major regional markets.

Which country is growing fastest?

India leads country-level growth at a 13.2 percent compound annual rate, outpacing the broader South Asia and Pacific region. Rising smartphone penetration and expanding regional-language content libraries drive this acceleration across most major Indian metropolitan and rural markets.

Report Segmentation Architecture

The full report scope spans multiple orthogonal segmentation dimensions, with cross-tabulated demand data provided for each dimension pair. Coverage extends further to regional breakdowns, trend trajectories, and the competitive detail needed to support segment-level decision-making.

By Primary Market Dimension

  • Live Sports and Event Content
  • Original Scripted Series and Films
  • Documentary and Non-Fiction Programming
  • Children's and Family Content
  • Regional and Local-Language Content

By End-Use Industry

  • Direct-to-Consumer Streaming Platforms
  • Telecom-Bundled Distribution
  • Advertising and Media Agencies
  • Hospitality and Travel Sector Licensing

By Commercial Dimension

  • Subscription-Based Access
  • Advertising-Supported Access
  • Transactional and Pay-Per-View Access
  • Content Licensing and Syndication

By Region

  • North America
  • Western Europe
  • East Asia
  • South Asia and Pacific
  • Latin America
  • Middle East and Africa
  • Eastern Europe

Scope, Methodology, and Coverage

Every figure in this report is reproducible from documented input assumptions. The scope below maps the historical period, the forecast horizon, the segmentation dimensions, and the countries covered, alongside the underlying primary and qualitative methodology.
Historical Period
2020 to 2025
Forecast Period
2026 to 2036
Base Year
2025 (USD billions; MMA Primary Research Dataset, September 2026)
Market Definition
The OTT Content Market covers original and licensed video programming distributed directly to consumers over internet-based platforms, including subscription, advertising-supported, and transactional access models. It excludes linear broadcast television, traditional cable distribution infrastructure, and gaming or interactive software content not classified as video programming.
Quantitative Units
USD Billion
Segmentation Dimensions
Content Type, End-Use Industry, Commercial Access Model, Region
Regions Covered
North America, Western Europe, East Asia, South Asia and Pacific, Latin America, Middle East and Africa, Eastern Europe
Countries Covered
United States, United Kingdom, Germany, India, China, Japan, Brazil, and 35 additional countries
Key Companies Profiled
Netflix Inc, The Walt Disney Company, Warner Bros Discovery Inc, Amazon.com Inc, Comcast Corporation, Paramount Global, Sony Pictures Entertainment Inc, Apple Inc, Lionsgate Studios Corp, A24 Films LLC, Legendary Entertainment, Skydance Media, Banijay Group SAS, Fremantle Ltd, ITV plc, All3Media, Zee Entertainment Enterprises Ltd, Reliance Industries Limited, CJ ENM Co Ltd, Toei Animation Co Ltd
Quantitative Methodology
Primary survey, n=3,800 respondents, Q4 2025, six countries; demand-side model with trade association cross-validation
Qualitative Methodology
47 expert interviews, Q4 2025; applied to validate demand model assumptions, identify emerging dynamics, and assess competitive positioning
Report Format
PDF and XLSX data workbook (Word format preview document)
Publisher
Market Minds Advisory
Report Code
MMA-2026-TEC-861
Published
September 2026
Contact
sales@marketmindsadvisory.com | www.marketmindsadvisory.com

Purchase the full OTT Content Market Report (2026 to 2036).

This report examines the global OTT Content Market across content type, end-use industry, and commercial access model through 2036. It quantifies sports rights investment, regional-language content expansion, and advertising-tier monetization as primary growth mechanisms shaping platform strategy decisions. Coverage spans competitive positioning among five leading platforms and fifteen additional challengers across seven world regions, with detailed input cost and portfolio analysis. The analysis draws on primary survey data spanning 3,800 respondents and 47 expert interviews conducted across six countries in the fourth quarter of 2025.
Full regional breakdown across all seven markets
Five-year forecast scenarios with bull and bear cases
Detailed competitive profiles of twenty major platforms
Segment-level growth rates and margin economics
Input cost exposure and mitigation strategy analysis
Anonymized client case study with strategic recommendations

Built For The People Who Decide

From boardroom strategy to bench-side execution, this report is read cover-to-cover by leaders shaping the next decade of their industry, turning demand scenarios, market dynamics and valuation benchmarks into decisions.
CXOs/ Presidents/ VPs/ Managers
M&A and Corporate Development
Strategy Teams and R&D Heads
Procurement and Product Directors
Regulatory and Compliance Leaders
Investor Relations and Equity Analysts