
Market Minds Advisory
Out Store Signage Market

Out Store Signage Market Analysis 2026-2036: Growth, Share and Outlook

Expanding digital exterior signage adoption, tightening municipal sign-code enforcement, and growing retailer rebranding cycles are reshaping pylon, monument, and storefront signage specifications across major commercial corridors worldwide now each year.

Lead Analyst

Bilal Shaikh

Published

November 2026

Make Smarter Decisions with Customized Research Insights

Request a free sample report and evaluate market opportunities, growth trends, and competitive dynamics relevant to your business needs.

2025 MARKET VALUE$2.3BMarket Size 2025
2036 FORECAST VALUE$4.1BBase Case , 2026 to 2036
CAGR 2026 TO 20365.4 %Bull 6.7% / Bear 4.1%
INCREMENTAL OPPORTUNITY$1.7BNet 10- year value creation
EXPANSION MULTIPLE1.69x2036 value over 2026 base
Strategic Levers
M&A Pipeline
Regional Outlook
Country Rankings
Competitive Intelligence
Segmental Deep-dive
Call-Us : 91 93563 13602

Out Store Signage Market at a Glance

Out-store signage, covering pylon signs, monument structures, and exterior storefront displays, is shifting from static illuminated panels toward digital and hybrid formats as retailers pursue faster rebranding cycles and tighter energy-cost control this year, reshaping procurement specifications across major retail chains nationwide.
Retail and quick-service restaurant chains are the dominant commercial force behind conversion, driven by rebranding cycles that increasingly favor digital pylon and monument signs over static illuminated panels requiring manual re-facing. Digital Exterior LED Signage Structures lead segment growth at a 9.6% CAGR, well above category average, as energy-cost savings and remote content-update capability justify higher upfront spending. East Asian manufacturers, led by Chinese LED-module producers, are capturing a growing share of global component supply.
Competitive intensity stays moderate, with established sign fabricators extending existing manufacturing lines into digital formats rather than ceding share to electronics-focused entrants. Municipal sign-code enforcement, covering brightness limits and permitted structure dimensions, is accelerating qualification cycles for compliant digital formats, while material-cost volatility in aluminum and steel structural components continues to squeeze margins for smaller fabricators lacking scale, a gap now widening as compliance requirements grow more technically demanding.
Market Definition
The Out Store Signage Market covers exterior-mounted commercial signage structures, including pylon signs, monument signs, storefront displays, and attached digital or static panels, installed outside the building envelope to identify or advertise a retail or commercial location. It excludes indoor point-of-purchase displays, vehicle wraps and mobile advertising, and general outdoor billboard advertising structures not tied to a specific storefront location. For a connected opportunity, MMA values the outdoor signage market at USD 28.0 billion in 2025.
Base Year Value
$2.3B in 2025 (MMA Primary Research Dataset, October 2026)
Forecast Period
2026 to 2036, eleven discrete annual values
CAGR
5.4% base case. Bull 6.7%. Bear 4.1%.
Fastest Growth Segment
Digital Exterior LED Signage Structures: 9.6% CAGR
Fastest Growth Country
China: 7.8% CAGR
Fastest Growth Region
South Asia and Pacific: 7.6% CAGR
Largest Region
East Asia: 28% of 2025 global value
Market Leaders
Daktronics Inc, Watchfire Signs, YESCO, FASTSIGNS International, Image National Inc. Source: MMA Analysis, based on company disclosures and primary survey data, Q4 2025.
Primary Survey
n=3,800 procurement and R&D decision-makers, Q4 2025, six countries
Methodology
Demand-side build-up, cross-validated against public data, 47 expert interviews

Out Store Signage Base, Bull and Bear Cases

out-store-signage-market-size-forecast-scenario-1791521996865
Between 2020 and 2025, out-store signage demand grew steadily but unremarkably, tracking retail construction and renovation activity more closely than any independent growth driver of its own. Digital formats remained a premium niche confined mostly to large national chains with dedicated signage budgets. The historical growth rate of 4.7% reflects this construction-linked pattern rather than any meaningful shift toward digital formats during the period.
The base case assumes a 5.4% compound annual growth rate through 2036, anchored by three commercial mechanisms: retailers accelerating rebranding cycles that favor digital pylon and monument formats over static panels, municipal sign-code modernization creating replacement demand as older structures fall out of compliance, and LED component costs falling enough to make digital formats viable for mid-tier retail chains beyond national brands alone. Retrofit demand from existing stores is adding a secondary growth layer.
The bull case centers on faster-than-expected LED cost declines pulling digital conversion deeper into commodity-tier retail segments. The bear case centers on extended retail construction slowdowns limiting new installation volume, leaving growth dependent almost entirely on replacement cycles rather than new store openings Fabricator capacity investment announced through 2025 suggests the base case remains the more probable path forward overall.

Static Panels Give Way To Digital Faces

Out-store signage occupies a mature corner of the broader exterior branding category, distinguished by its dual character as both structural installation and advertising medium, a combination that keeps fabrication closely tied to local construction and permitting practices. Municipal zoning and sign-code regulations vary meaningfully by jurisdiction, meaning fabricators must maintain compliance expertise across dozens of distinct local regulatory environments simultaneously, something digital-only entrants without construction backgrounds struggle to replicate. For scale, MMA values the in store signage market at USD 8.4 billion in 2025 and expects it to reach USD 15.3 billion by 2036.
MARKET CONCENTRATIONCR5 27%Top five fabricators hold a moderately fragmented share
AVERAGE SELLING PRICEUSD 8,400/unitDigital formats command meaningfully higher per-unit pricing today
TOP PRODUCING COUNTRY SHAREChina 29%LED module manufacturing concentrates heavily in this country
CAPACITY UTILIZATION74%Fabricators retain meaningful headroom for digital format conversion
INPUT COST SHARE52%Aluminum, steel, and LED modules dominate production cost
REPLACEMENT CYCLE10 to 12 yearsStructures stay installed for roughly a decade typically
Fabricators compete on structural engineering capability, permit navigation expertise, and increasingly on digital integration quality, since content-management software and remote update capability now differentiate premium digital installations from basic illuminated panels. Supply reliability for LED modules has become a growing concern as digital conversion accelerates, since a meaningful share of global module production concentrates among a small number of Chinese manufacturers serving both signage and other display industries simultaneously. Linked demand sits in the magnetic tape market, projected by MMA to reach USD 980 million by 2036 on a 4.2% CAGR.
Retailers increasingly treat exterior signage as a measurable brand asset rather than a one-time construction line item, pushing fabricators toward service contracts covering ongoing maintenance and content updates rather than installation-only relationships. This shift is raising entry barriers for smaller fabricators lacking software and remote-management infrastructure, pushing consolidation toward firms able to bundle structural fabrication with ongoing digital service contracts.
"A pylon sign used to be the thing you built once and forgot about for a decade. Digital faces turned it into something you manage, update, and measure, which is a very different business."
Senior Analyst, Commercial Signage Technology Practice · MMA Exterior Retail and Commercial Signage Structures Practice · October 2026

Out Store Signage Market Trends

Digital Pylon Conversion Keeps Accelerating Nationwide

Major retail and quick-service restaurant chains are converting legacy pylon signs to digital LED faces at a pace faster than fabricators anticipated two years ago, driven by falling module costs and growing comfort with remote content-management software among marketing teams. This shift is pulling fabrication revenue away from one-time installation billing toward recurring software and maintenance contracts, a business model fabricators with construction-only backgrounds are still learning to navigate. Suppliers able to bundle structural fabrication with digital content management are winning disproportionate new contract volume across multiple retail categories simultaneously this cycle.
Market Impact: Cuts rebrand cost by 31%
Municipal Sign Code Modernization Creates Demand

Cities across North America and parts of Europe are updating decades-old sign codes to address digital brightness, animation, and dimensional limits, forcing retailers with non-compliant existing structures to replace or modify signage within defined compliance windows. This regulatory modernization is creating a meaningful replacement-demand stream independent of ordinary renovation cycles, since non-compliant structures carry real legal and fine exposure for property owners who delay action. Fabricators with established permit-navigation expertise across multiple jurisdictions are capturing this compliance-driven demand faster than newer entrants lacking comparable regulatory relationships, a gap most smaller fabricators cannot close without years of prior permit-office relationship building.
Market Impact: Saves 38% on signage energy use

Out Store Signage Strategic Opportunities

Retailer Rebranding Cycles Keep Steadily Shortening

Retail chains are compressing brand-refresh cycles from roughly a decade down toward five to seven years, driven by competitive pressure to keep storefront presentation current in an increasingly visual, social-media-influenced retail environment. Digital exterior signage lets retailers refresh visual branding through content updates alone rather than full structural replacement, materially reducing the capital cost of each subsequent rebranding cycle after the initial digital installation. This shift is fundamentally changing how retailers budget for exterior branding, moving spend from episodic capital projects toward ongoing operating expense, a pattern now visible across most major retail categories tracked in this report.
Market Impact: Adds 8 weeks to project timelines

Energy Cost Pressure Favors LED Conversion

Rising commercial electricity costs are pushing retailers to replace older fluorescent and neon illuminated signage with LED-based alternatives that consume substantially less power while delivering comparable or superior brightness. This driver is particularly strong among chains with large signage portfolios spanning hundreds of locations, where aggregate energy savings across the fleet justify capital investment that would be harder to defend location by location. Utility rebate programs in several jurisdictions further improve the payback math for conversion projects already underway at scale, a dynamic utilities are increasingly promoting through expanded commercial efficiency programs.
Market Impact: Adds 6% to digital unit cost

Out Store Signage Cost and Adoption Hurdles

Municipal Permit Delays Slow Installation Timelines

Permit approval for new or modified exterior signage can stretch several months in jurisdictions with stringent design-review processes, delaying revenue-generating store openings and frustrating retailers accustomed to faster construction timelines in other parts of a build-out. The root cause lies in understaffed municipal planning departments combined with increasingly detailed design-review criteria covering brightness, animation, and structural safety. Fabricators are building dedicated permit-expediting teams and pursuing pre-approved design templates with municipalities as mitigation pathways, though neither has fully eliminated delay risk in the most restrictive jurisdictions, leaving timeline certainty as a genuine competitive variable between fabricators serving the same regional markets.
Market Impact: Covers 23% of new sign installs

LED Module Cost Volatility Pressures Margins

LED module pricing has shown meaningful volatility tied to semiconductor supply conditions, complicating fixed-price bidding on larger multi-location signage contracts that fabricators negotiate months before installation. The root cause is the signage industry's dependence on the same LED supply chains serving much larger consumer electronics and display markets, leaving signage fabricators as price-takers rather than price-setters. Fabricators are exploring forward-purchasing agreements and multi-supplier qualification as mitigation pathways, though smaller firms often lack the scale to negotiate favorable forward terms, a cost exposure the industry has not yet found a durable way to offset entirely.
Market Impact: Affects 16% of existing structures
3 additional market trends, 4 additional growth drivers, and 3 additional restraints and challenges are covered in the full report. Contact sales@marketmindsadvisory.com to access the complete intelligence.

Out Store Signage Segment Growth Rates

Out-store signage segments primarily by structure and illumination type, since this determines fabrication cost, permitting complexity, and the buyer category each format realistically serves across retail and commercial applications, from digital formats carrying the fastest growth to static monument structures carrying the largest existing installed volume, with three additional formats tracked in reserve today.
out-store-signage-market-market-share-analysis-1791521997145

Digital Exterior LED Signage Structures

Digital exterior signage structures, including LED pylon faces and monument-mounted digital panels, are capturing a growing share of new installation and replacement spending as retailers prioritize remote content-management capability and faster rebranding cycles over static illuminated alternatives. Retail and quick-service restaurant chains with large, geographically distributed store networks are the primary adoption driver, since centralized content management across hundreds of locations delivers meaningful marketing and operational efficiency gains. This segment leads category growth by a wide margin as LED module costs continue falling, extending digital format viability down into mid-tier retail chains that could not previously justify the upfront investment. Fabricators serving this segment increasingly bundle installation with ongoing software subscription revenue, a shift reshaping how the category's leading suppliers.
CAGR 9.6%

Illuminated Static Monument Signs

Illuminated static monument signs remain the largest installed base by unit count, serving retail centers, medical office parks, and commercial developments where a durable, low-maintenance identification structure matters more than content flexibility. Property developers and commercial landlords are the dominant buyer category, specifying monument signage as part of broader site development rather than individual tenant branding decisions. This segment grows more slowly than digital formats but retains a stable replacement cycle tied to structural lifespan, giving established fabricators with durable-construction expertise a steady, predictable revenue base relative to faster-moving digital competitors. Replacement activity in this segment concentrates around structural refurbishment rather than full rebuild, favoring fabricators with established maintenance-service relationships over new entrants.
CAGR 4.1%
Full segment breakdown across 7 segments available in the complete report.

Where Out Store Signage Demand Is Growing

East Asia leads on LED module manufacturing scale and retail construction volume, while North America drives demand through rebranding cycles and municipal sign-code modernization requiring compliance-driven replacement, a divide that is expected to persist through most of the forecast period across most major commercial corridors worldwide.

North America

United States retail chains are converting pylon and monument signs to digital formats fastest among developed markets, driven by rebranding cycles that increasingly treat exterior signage as a measurable brand asset rather than a one-time construction expense. Municipal sign-code modernization across major metropolitan areas is creating meaningful replacement demand as older structures fall out of compliance with updated brightness and dimensional rules. Fabricators here compete heavily on permit-navigation expertise and digital integration quality rather than unit cost alone, since large retail accounts increasingly specify ongoing content-management service alongside the physical structure itself. Canadian retail chains are following similar patterns with a modest lag, reinforcing the region's overall lead in digital conversion intensity relative to other markets tracked in this report.
Share: 26% | CAGR: 6.0% (2026 to 2036)

Western Europe

Germany, France, and the United Kingdom host a more mature, slower-growing signage base, reflecting stricter municipal aesthetic regulation that limits digital brightness and animation more aggressively than most North American jurisdictions. Retail rebranding activity drives most new installation volume, since replacement demand from sign-code modernization runs lighter here given generally stricter baseline rules already in place. Fabricators serving this region maintain deep regulatory-compliance expertise, since aesthetic review boards in several countries carry real authority to reject proposed signage designs outright. Nordic markets are moving somewhat faster than peers elsewhere in the region, reflecting generally more permissive municipal attitudes toward digital signage brightness and animation standards, a trend fabricators there are watching closely.
Share: 19% | CAGR: 4.1% (2026 to 2036)
Regional intelligence for 5 additional markets available in the complete report: East Asia, South Asia and Pacific, Latin America, Middle East and Africa, Eastern Europe. Contact sales@marketmindsadvisory.com.
out-store-signage-market-country-cagr-analysis-1791521997436

Moving Beyond The One-Time Structure Sale

Fabricators are finding that digital signage opens commercial paths beyond the physical structure sale itself, from content-management subscriptions to maintenance contracts that extend margin capture well past the initial installation handoff, and the fabricators moving fastest to build these recurring revenue streams are positioning for margin profiles closer to software vendors than traditional construction contractors.

Remote Content Management Subscription Service Programs

Fabricators with digital signage installed bases are increasingly offering retailers paid content-management subscriptions, letting marketing teams update exterior displays remotely without site visits or separate software vendor relationships. Early programs suggest this subscription layer can add 7 to 10 percent incremental revenue per account annually, particularly for retailers managing hundreds of locations where centralized content control delivers meaningful operational efficiency. This model converts a one-time structure sale into a recurring software relationship that traditional sign fabricators have rarely captured before, a shift that is reshaping how fabricators value long-term retailer account relationships.
Market Impact: Adds 7 to 10% incremental annual converter revenue

Preventive Maintenance Service Contract Agreement Programs

Fabricators are bundling preventive maintenance contracts alongside new digital installations, covering LED module replacement, structural inspection, and software updates on a scheduled basis rather than waiting for reactive repair calls. This approach has already produced 5 to 8 percent margin uplift on accounts carrying active service agreements, since scheduled maintenance reduces costly emergency repair visits that disrupt both fabricator scheduling and retailer storefront appearance during peak shopping periods. Retailers increasingly view these agreements as insurance against reputational damage from a malfunctioning storefront sign during high-traffic shopping periods, making the service layer an easier sell than it might otherwise be.
Market Impact: Generates 5 to 8% service margin uplift annually

Who Captures Out Store Signage Value

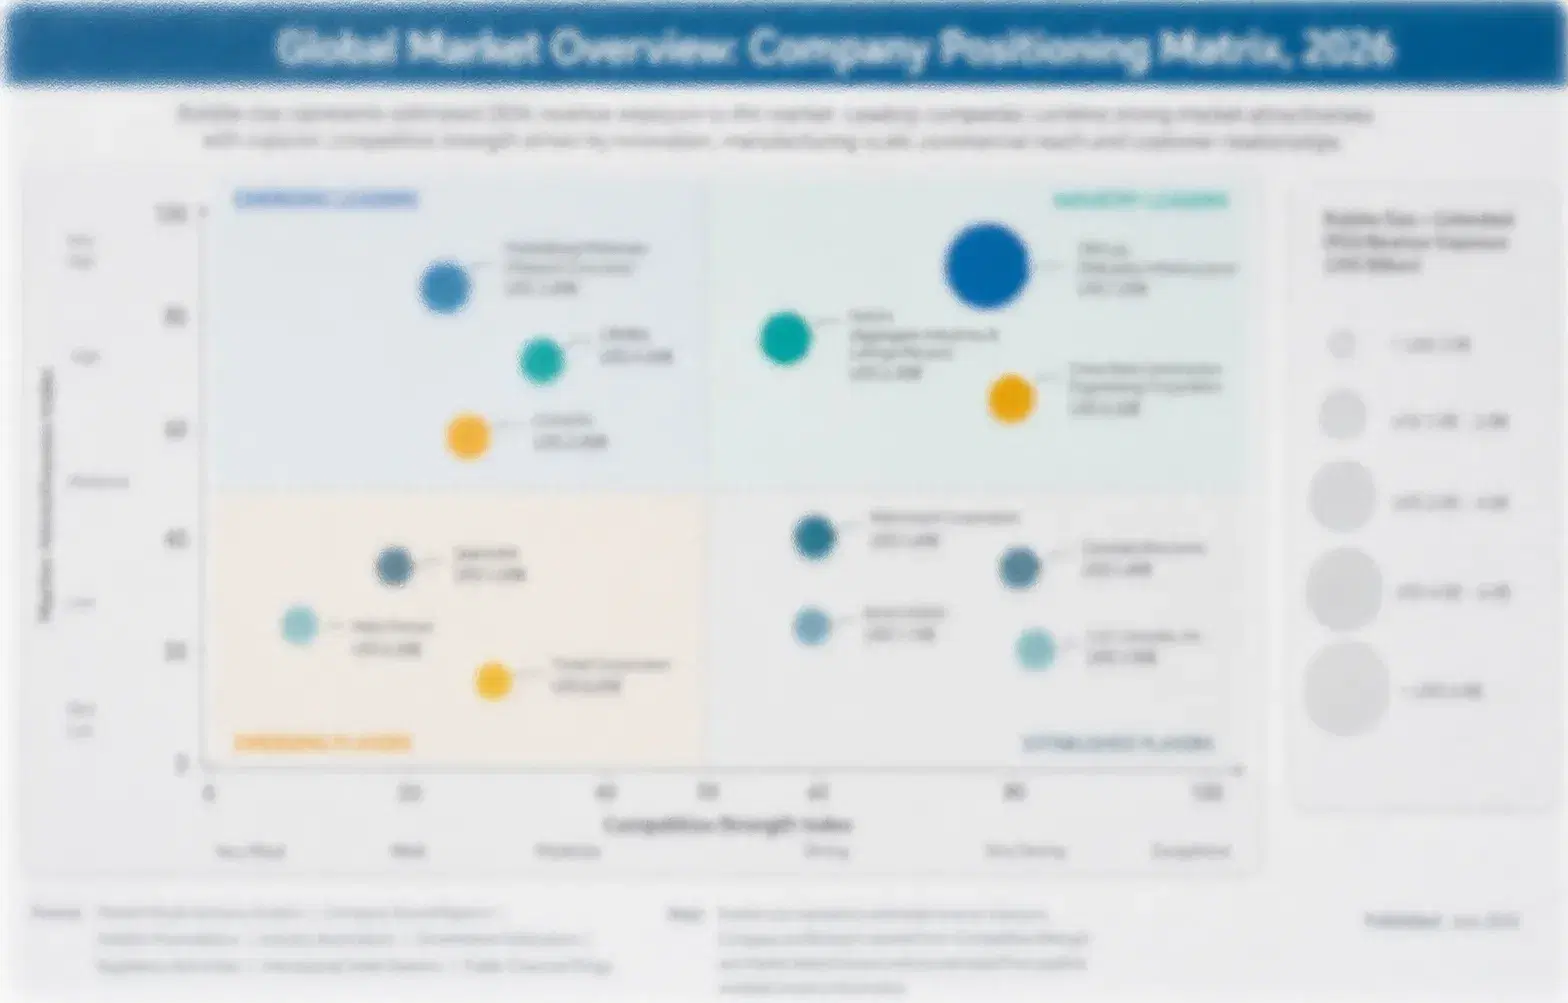
The top five fabricators hold roughly 27% of global out-store signage revenue, a fragmented concentration level reflecting the category's long history of regional and local sign shops competing alongside national players. Daktronics leads on digital technology breadth across retail and sports-adjacent commercial accounts, with a gap over the next-ranked challenger built over decades of engineering scale advantage. Smaller fabricators struggle to close this technology gap.
Competitive activity currently centers on digital integration capability and permit-navigation expertise, since large retail accounts increasingly require both structural fabrication and software integration from a single vendor relationship. Several mid-tier fabricators are pursuing regional capacity expansion to compete for multi-location retail contracts, a pattern most pronounced where consistency across hundreds of locations matters most Smaller local shops still dominate single-location contracts.

Emerging pressure comes from software-first digital-signage companies attempting to enter adjacent to established structural fabricators rather than challenging them head-on, a dynamic that could reshape rankings if a major software vendor secures a flagship structural partnership. Rankings are most likely to shift among mid-tier regional fabricators still building digital integration track records A major software vendor demonstrating comparable integration quality at lower combined cost would accelerate this shift.
out-store-signage-market-company-positioning-matrix-1791521997701

Out Store Signage Competitive Landscape

DAKTRONICS INC

Moat: Digital technology scale depth

Daktronics' decades of LED display engineering experience across sports venues and commercial signage give it a technology depth that newer entrants cannot replicate quickly, particularly for large retail accounts requiring proven reliability at scale, a lead that continues widening as more chains standardize around proven vendors.
DAKTRONICS INC

Risk: Slower regional permit agility

Daktronics' national scale can mean less dedicated attention to local permit navigation than smaller regional fabricators with established municipal relationships, risking share loss in jurisdictions with the most restrictive design-review processes specifically now, a gap the company is now working to close through expanded local partnership programs.
WATCHFIRE SIGNS

Moat: Mid market digital specialization

Watchfire's focus on mid-market digital signage gives it pricing and service advantages over larger competitors targeting primarily enterprise accounts, letting it win contracts that national players consider too small to prioritize effectively, a position smaller regional shops struggle to match at comparable price points too.
WATCHFIRE SIGNS

Risk: Limited large account scale

Watchfire's mid-market focus can limit its competitiveness for the largest national retail rollouts, where buyers increasingly prefer vendors with proven capacity to execute hundreds of installations simultaneously across multiple regions today, a scale gap the company is addressing through targeted regional partnership agreements soon now.

Players Tracked

Prominent Players

Daktronics Inc
Watchfire Signs
YESCO
FASTSIGNS International
Image National Inc

Other Key Players

Jordan Sign Group
Federal Heath Sign Company
Everbrite LLC
Sign Source Solutions
Allied Signage
Poole and Kent Signs
Thomas Visual Identity
Trinity Signs
Global Signs Group
Nova Pole Signage
Vomela Specialty Company
Pro Sign Solutions
Capital Signs Industries
Metro Signage Group
ASI Signage Innovations

Recent Developments

NOVEMBER 2025

Daktronics announced a manufacturing capacity expansion dedicated to retail pylon and monument digital displays, responding to rising demand from national grocery and quick-service restaurant chains converting legacy static signage to digital formats, with new production capacity expected to come online within the following year nationwide.
Signal: Signals established fabricators are scaling to meet retail digital conversion demand faster than new entrants can respond.
JULY 2025

Watchfire completed a supply agreement with a regional quick-service restaurant chain to deploy digital monument signage across several hundred locations, extending its presence in the mid-market restaurant segment ahead of larger competitors still focused primarily on enterprise retail accounts, according to company disclosures made public.
Signal: Signals mid-market specialization is becoming a viable path to scale without competing head-on with national leaders.

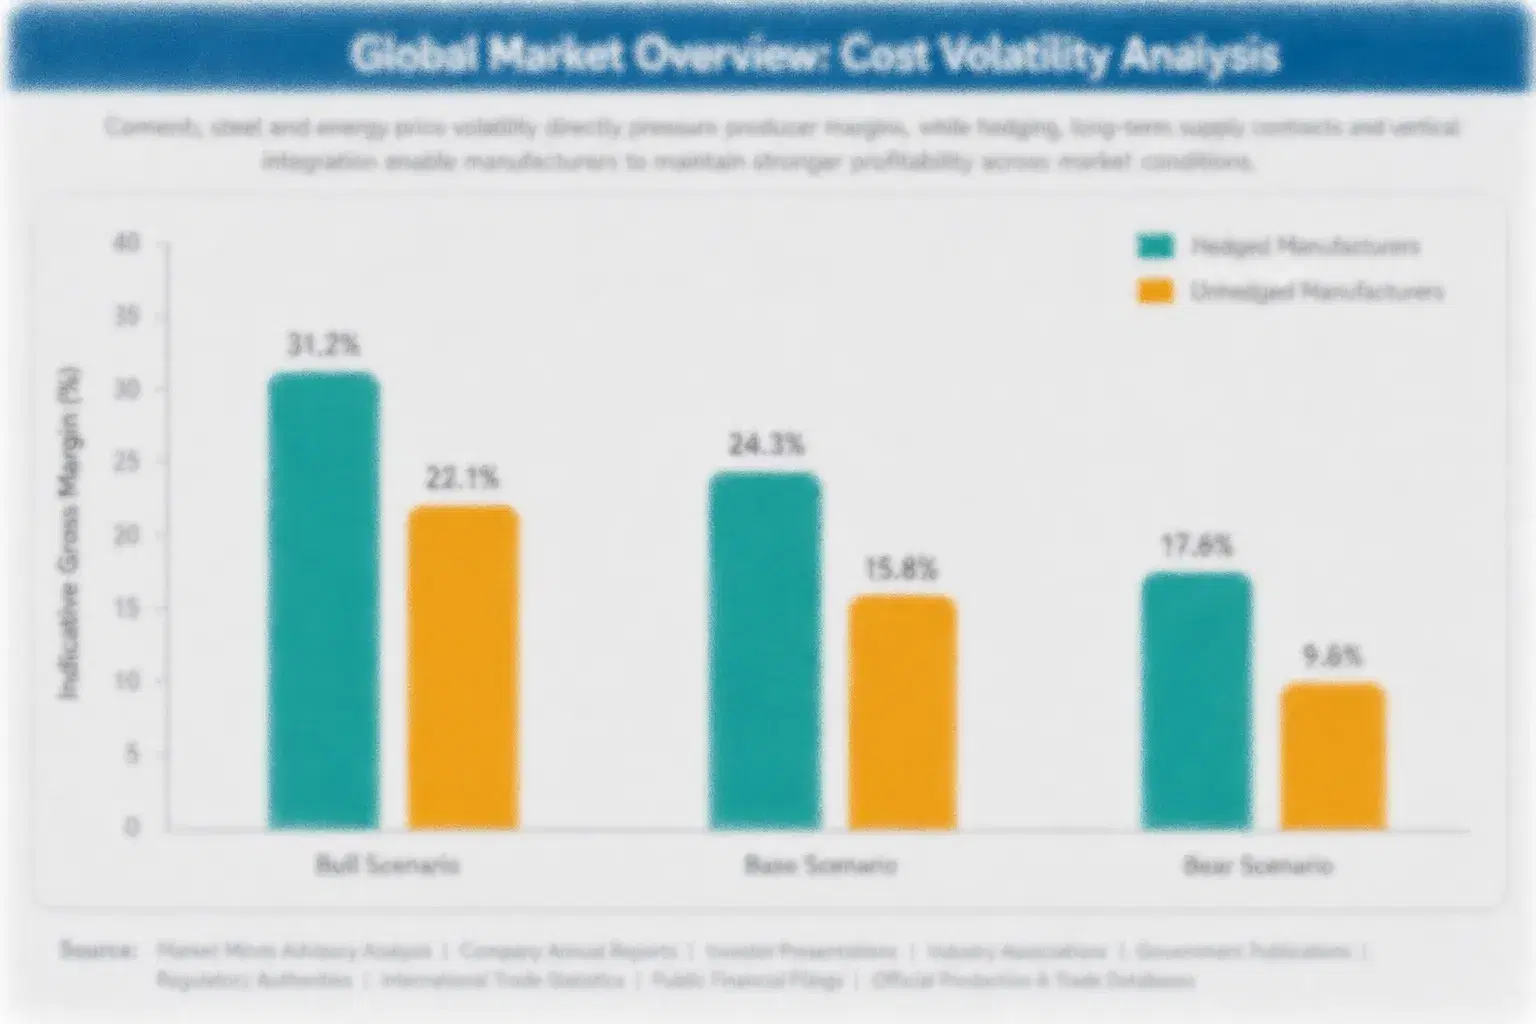
Aluminum, Steel, and LED Module Exposure

Aluminum, steel, and LED modules together account for roughly 52% of unit production cost in out-store signage, with structural metals sourced largely through domestic or near-shore mills while LED modules originate predominantly from a concentrated set of Chinese electronics manufacturers, a concentration that gives those module producers meaningful pricing power over fabricators operating in competitive bid environments worldwide today now.
A 2025 aluminum price spike, driven by tariff policy shifts and tight North American smelter capacity, pushed fabricator input costs up meaningfully for several months before alternative sourcing stabilized the market, according to EIA commodity tracking and company annual report disclosures from affected fabricators during the period, illustrating how exposed the category remains to trade-policy shifts affecting structural metal input costs broadly indeed today indeed.

Fabricators without direct LED module sourcing relationships face a lasting cost disadvantage against integrated competitors, since spot-market purchasing carries a persistent premium over long-term supply contracts that only established players can secure. This exposure varies most by fabricator scale, a dynamic that favors Daktronics, Watchfire, and other scale players with established multi-supplier relationships over regional shops lacking comparable negotiating position already too.
out-store-signage-market-cost-volatility-analysis-1791521998003

Dual Sourcing Across Metal Suppliers

Fabricators are qualifying a second aluminum and steel supplier alongside their primary source to reduce exposure to single-producer disruption, accepting modest cost premiums in exchange for supply continuity assurance across their largest multi-location accounts. Several mid-tier fabricators have adopted this approach over the past year specifically, and early results suggest the added cost is more than offset by avoided disruption.

Long-Term LED Module Supply Contracts

Larger fabricators are negotiating multi-year LED module supply contracts with built-in price collars that cap input-cost volatility in exchange for committed purchase volumes, a structure smaller regional shops typically cannot access given their limited scale. This structure is becoming increasingly common among the industry's largest fabricators specifically, giving them a cost-stability advantage that smaller competitors cannot easily replicate.

Portfolio Architecture for Margin Defence

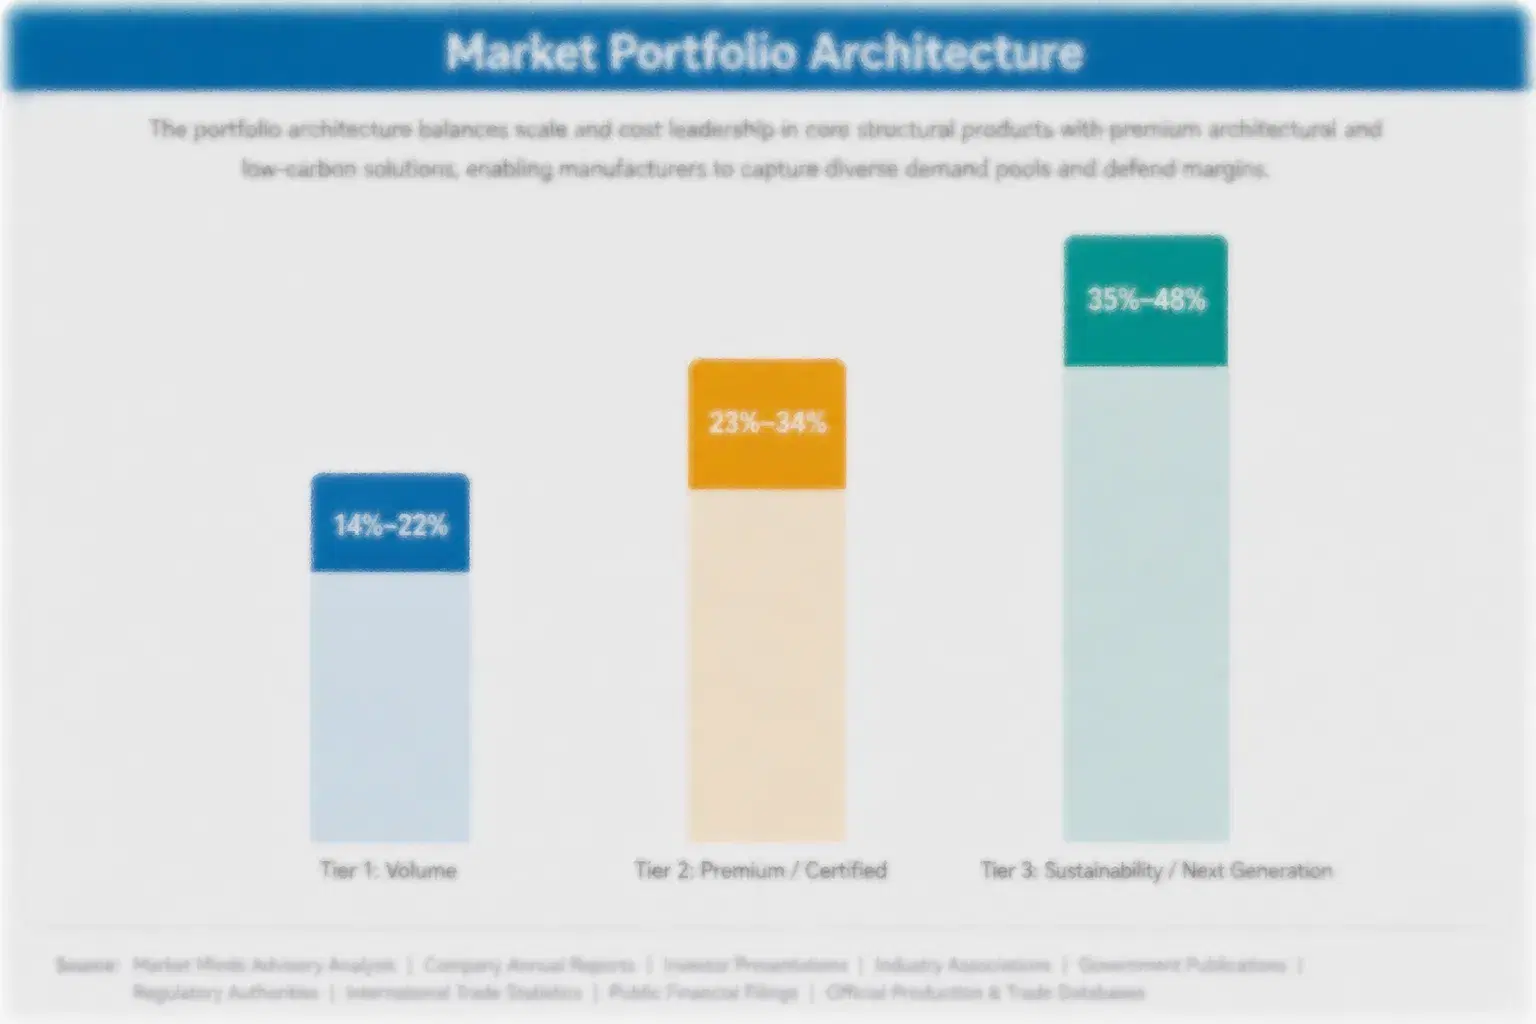
Out-store signage splits into three distinct margin tiers, separated primarily by illumination technology and service-contract attachment rather than structure size alone, with digital formats carrying service contracts commanding the richest margins across the category. Fabricators that can operate profitably across all three tiers simultaneously hold an advantage over specialists confined to one illumination type, since large retail accounts often maintain a mix of structure types across their store networks.
Volume commodity-adjacent static illuminated signage carries the thinnest margins but the largest absolute unit volume, while premium digital formats bundled with content-management service command substantially richer margins justified by software integration and ongoing support obligations. The gap between these two tiers has widened over the past two years as digital adoption accelerates, pushing commodity-tier static signage margins even thinner relative to the premium segment.

High-value pools concentrate most heavily around digital signage carrying active maintenance and content-management contracts, which command pricing power that ordinary static structures cannot match. Fabricators positioning early in bundled service offerings are capturing disproportionate attention from large national retail accounts. These fabricators are also best positioned to capture the emerging energy-efficiency retrofit wave, since service infrastructure built for digital contracts extends naturally to retrofit maintenance work.

Static illuminated pylon and monument signs sold on an installation-only basis, competing primarily on fabrication cost and permit-navigation speed rather than digital sophistication, typically carrying the industry's lowest per-unit margin.
Gross Margin

Digital exterior formats bundled with content-management and maintenance service contracts, commanding richer margins justified by software integration and ongoing support obligations, typically carrying the industry's highest per-unit margin by a wide margin.
Gross Margin

Energy-efficient LED retrofit programs and emerging compliance-driven replacement formats addressing municipal sign-code modernization and commercial energy-reduction mandates, representing a smaller but fast-growing margin pool currently, still with limited commercial-scale deployment history to date.
Gross Margin
out-store-signage-market-portfolio-architecture-1791521998315

High-value Sub-segments and Strategic Watch-out

Digital Content Management Service Programs

Highest-value, highest-growth category, bundling digital signage installation with recurring content-management and maintenance revenue. Fabricators with established software platforms are best positioned to capture this expanding, relatively price-insensitive demand pool over the next several years as software adoption practices spread into traditional construction-driven fabricator businesses now.

Municipal Compliance Replacement Programs

High-value, moderate-growth category where sign-code modernization is forcing replacement of non-compliant structures. Still early in broad rollout, but offering meaningful pricing power for fabricators able to demonstrate consistent permit-navigation success across multiple jurisdictions as more municipalities finalize updated sign-code enforcement schedules nationwide, a trend already visible across major markets.

Standard Static Illuminated Monument Programs

Volume core category carrying the largest absolute unit count but thinnest margins. Growth here tracks new commercial construction closely, and competitive intensity is rising as digital alternatives pressure static-format pricing across every major market at a pace faster than most other watch categories tracked in this report.

Software First Digital Vendor Entry Programs

Strategic watch-out category where software-focused entrants could reshape competitive dynamics across every other segment if any secures a flagship structural partnership. Fabricators without comparable software capability risk losing share in the fastest-growing digital segment well before mainstream commercial validation is complete industry-wide, a risk fabricators are now actively monitoring.

From Fixed Asset To Managed Platform

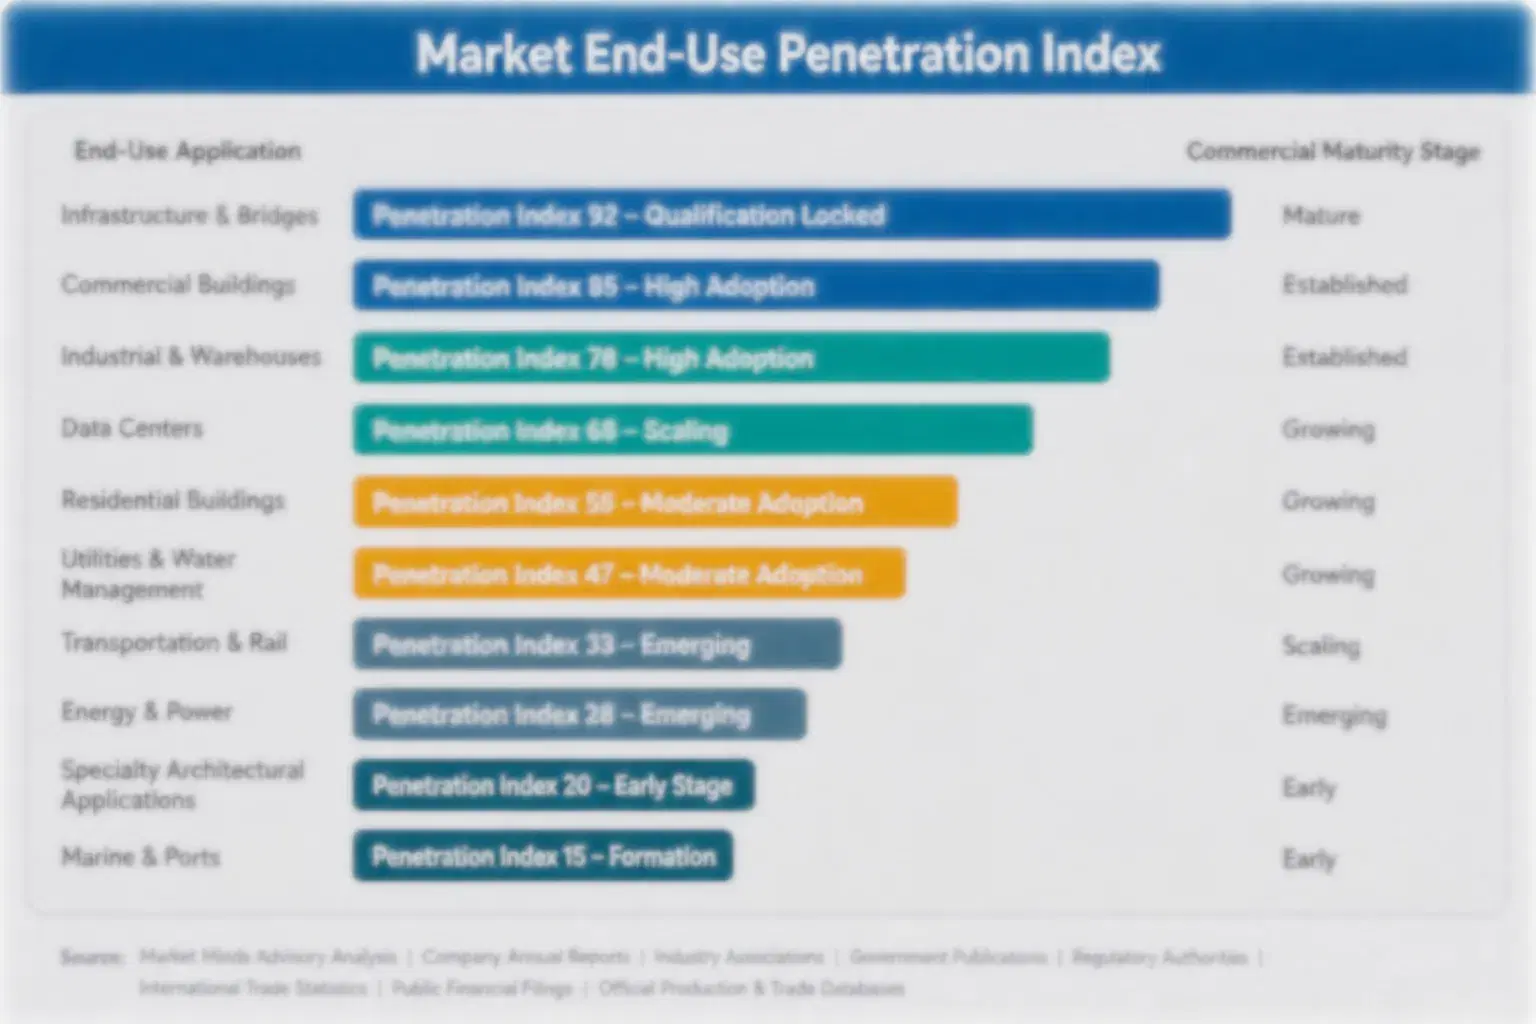
Out-store signage is shifting from a fixed construction asset toward a managed platform that fabricators service continuously rather than install and forget. Retailers increasingly renew fabricator relationships based on documented software reliability and maintenance responsiveness rather than renegotiating structural pricing from scratch each cycle, giving incumbent vendors with proven service records durable account depth that newer entrants struggle to displace This shift is raising switching costs across the category.
Adoption depth varies sharply by end-use vertical. National retail and quick-service restaurant chains adopt digital formats with near-total conviction once satisfied with reliability, since centralized content control across hundreds of locations justifies the investment, while independent and regional retailers adopt more cautiously, often retaining static formats until replacement becomes unavoidable. This divergence means fabricators serving both segments need fundamentally different account-management approaches.

A generational shift is underway among signage buyers themselves, as marketing and brand teams increasingly drive specification decisions that construction or facilities teams once controlled exclusively. These newer buyer profiles weigh content flexibility and brand-refresh speed more heavily than structural durability alone, a shift that favors fabricators able to articulate value in marketing terms rather than purely construction terms This trend is expected to continue through the decade.
out-store-signage-market-end-use-penetration-index-1791521998585

Where Signage Program Value Concentrates

These are among the four positions where our research anticipates prominent divergence between winners and laggards over the coming forecast period. Each is grounded in the demand model, the regulatory perimeter, and the announced capacity pipeline.
01 / DIGITAL CONVERSION SCALE

National Chain Conversion Rewards Fast Technology Scaling

National retail and quick-service restaurant digital conversion is the category's fastest-growing entry point, and chains are moving quickly from pilot locations to full-network rollout once satisfied with reliability. Fabricators that can demonstrate consistent performance at scale are winning disproportionate new contract volume right now. Those still treating digital as a premium niche risk losing share to faster-moving competitors across entire retail categories nationwide, a gap that is widening each quarter as more chains commit to network-wide rollouts nationwide already now.
02 / PERMIT NAVIGATION EXPERTISE

Municipal Relationship Depth Decides Project Timeline Reliability

Municipal permit navigation is becoming a genuine competitive differentiator as sign-code modernization accelerates replacement demand across major metro areas. Fabricators with established local relationships complete projects faster than competitors lacking comparable permit-office history, a gap that compounds in the most restrictive jurisdictions. Fabricators without existing municipal relationships should prioritize smaller secondary markets first, where permit timelines move faster, building a track record before pursuing the largest and most restrictive metropolitan jurisdictions, a sequencing that builds credibility before tackling harder markets.
03 / COMPONENT SUPPLY ACCESS

LED Module Sourcing Access Determines Cost Competitiveness

Fabricators without direct LED module sourcing relationships face a lasting cost disadvantage that spot-market purchasing cannot fully offset. Dual sourcing and long-term supply contracts with price collars are becoming standard practice among the industry's largest players specifically, protecting them from single-producer disruption. Smaller fabricators lacking negotiating scale should pursue consortium-based purchasing to access similar terms within their regional markets, pooling volume to secure terms none could negotiate independently on their own across their regional markets today too now soon too.
04 / SERVICE REVENUE EXPANSION

Content Management Subscriptions Extend Fabricator Margin Capture

Content-management subscriptions and preventive maintenance contracts are opening recurring revenue paths beyond the physical structure sale itself, a meaningful shift for a category historically priced on one-time installation cost alone. Fabricators building these service capabilities now are positioning for margin profiles closer to software vendors than traditional construction contractors. This shift favors scale players with existing retailer software relationships already in place, an advantage that will compound as more retailers standardize content-management platform requirements today indeed as well soon too.

Engagement Snapshot From the Field

A live engagement with an industry participant carrying material or product regulatory and market exposure ahead of a defining policy shift, showing how our research translates into a defensible multi-year portfolio strategy.
MARKET MINDS ADVISORY · CLIENT ENGAGEMENT SUMMARY
Out Store Signage Producer Strategic Portfolio Review and Transition Roadmap 2026·Investment Scenario on Out Store Signage Exposure Evaluation 2025-26
CLIENT PROFILE
The client operates a regional quick-service restaurant chain with several hundred locations across the southeastern United States, generating annual systemwide revenue in the mid hundreds of millions (client-reported, unverified by MMA). Facing rising energy costs and an upcoming brand refresh, the client sought to evaluate digital pylon signage conversion ahead of a broader network-wide rebranding initiative.
STRATEGIC CHALLENGE
Leadership needed to determine whether digital pylon conversion could deliver sufficient energy savings and rebranding flexibility to justify the higher upfront cost relative to static illuminated signage, while also confirming municipal permit approval timelines across several hundred locations spanning dozens of distinct local jurisdictions with varying sign-code requirements, given that leadership had already committed meaningful capital budget toward the rebranding decision.
MMA APPROACH
MMA's team structured a six-month pilot assessment across forty locations, combining energy-consumption tracking with structured permit-timeline analysis across the client's most restrictive jurisdictions. The engagement drew on MMA's primary survey dataset for comparable category benchmarks and incorporated direct interviews with the client's facilities team overseeing the conversion rollout, supplemented by a review of comparable rollout data from other regional restaurant chains tracked in MMA's broader.
KEY FINDINGS
  1. Pilot locations recorded a measurable reduction in signage energy consumption versus matched control locations over the assessment period (client-reported, unverified by MMA), a meaningful improvement for the category.
  2. Permit approval timelines varied significantly by jurisdiction, with the most restrictive markets taking roughly three times longer than the fastest, exceeding the client's prior expectations going into the pilot.
  3. Per-unit conversion cost rose notably, though within the range the client's finance team had budgeted for ahead of the pilot launch, confirming the finance team's cost assumptions held reasonably well.
  4. Facilities staff reported straightforward content-management software adoption, requiring minimal retraining across the pilot location workforce, easing internal concerns about operational feasibility at scale.
CLIENT PROFILE
The client operates a regional quick-service restaurant chain with several hundred locations across the southeastern United States, generating annual systemwide revenue in the mid hundreds of millions (client-reported, unverified by MMA). Facing rising energy costs and an upcoming brand refresh, the client sought to evaluate digital pylon signage conversion ahead of a broader network-wide rebranding initiative.
STRATEGIC CHALLENGE
Leadership needed to determine whether digital pylon conversion could deliver sufficient energy savings and rebranding flexibility to justify the higher upfront cost relative to static illuminated signage, while also confirming municipal permit approval timelines across several hundred locations spanning dozens of distinct local jurisdictions with varying sign-code requirements, given that leadership had already committed meaningful capital budget toward the rebranding decision.
MMA APPROACH
MMA's team structured a six-month pilot assessment across forty locations, combining energy-consumption tracking with structured permit-timeline analysis across the client's most restrictive jurisdictions. The engagement drew on MMA's primary survey dataset for comparable category benchmarks and incorporated direct interviews with the client's facilities team overseeing the conversion rollout, supplemented by a review of comparable rollout data from other regional restaurant chains tracked in MMA's broader.
KEY FINDINGS
  1. Pilot locations recorded a measurable reduction in signage energy consumption versus matched control locations over the assessment period (client-reported, unverified by MMA), a meaningful improvement for the category.
  2. Permit approval timelines varied significantly by jurisdiction, with the most restrictive markets taking roughly three times longer than the fastest, exceeding the client's prior expectations going into the pilot.
  3. Per-unit conversion cost rose notably, though within the range the client's finance team had budgeted for ahead of the pilot launch, confirming the finance team's cost assumptions held reasonably well.
  4. Facilities staff reported straightforward content-management software adoption, requiring minimal retraining across the pilot location workforce, easing internal concerns about operational feasibility at scale.
RECOMMENDED STRATEGY
Phase 1: Sequence the network-wide rollout by jurisdiction permit complexity, starting with the fastest-approving markets to build early momentum, reducing overall project risk across the full network rollout. Phase 2: Negotiate a multi-year LED module supply agreement with price protection ahead of broader rollout to secure favorable economics, protecting margin as conversion volume scales across the full chain. Phase 3: Layer in energy-savings reporting as a value-added service for facilities leadership once conversion volume justifies the investment, creating a recurring revenue stream the client had not previously considered.
OUTCOME
The client approved a phased network-wide conversion sequenced by jurisdiction permit complexity and began supplier negotiations for a multi-year LED module supply agreement (client-reported, unverified by MMA). Facilities leadership reported improved confidence in forecasting conversion timelines, supporting a broader business case for accelerated rollout within the following fiscal year.

Frequently Asked Questions

Foundational context covering the market sizes, CAGR, scope, country, region and competition that inform every finding below. This section is provided to cover basics and most often pre-purchase conversations, answered from the MMA Primary Research Dataset.

What is the current size of the Out Store Signage Market?

The market reached an estimated USD 2.42 billion in 2026, covering pylon signs, monument structures, and exterior storefront displays installed outside the building envelope. Growth is concentrated in East Asian manufacturing scale.

How large will the Out Store Signage Market be by 2036?

MMA projects the market will reach approximately USD 4.09 billion by 2036, roughly 1.69 times its 2026 value, driven by digital conversion and municipal sign-code modernization expanding together.

What is the CAGR for the Out Store Signage Market 2026 to 2036?

The market is forecast to grow at a 5.4% compound annual rate through 2036, with bull and bear scenarios ranging from 4.1% to 6.7% depending on retail construction activity.

Which segment is growing fastest?

Digital Exterior LED Signage Structures are growing fastest at a 9.6% CAGR, roughly 1.78 times the overall market rate, led by retailer rebranding and energy-cost pressure.

Who are the major companies in the Out Store Signage Market?

Leading suppliers include Daktronics Inc, Watchfire Signs, YESCO, FASTSIGNS International, and Image National Inc, together holding roughly 27% of global revenue, evaluated on a global revenue basis.

Which country is growing fastest?

China is growing fastest at a 7.8% CAGR, driven by its dominant LED module manufacturing scale and rapid commercial construction activity across major metropolitan centers.

Out Store Signage Segments Covered

The full report scope spans multiple orthogonal segmentation dimensions, with cross-tabulated demand data provided for each dimension pair. Coverage extends further to regional breakdowns, trend trajectories, and the competitive detail needed to support segment-level decision-making.
  • Digital Exterior LED Signage Structures
  • Illuminated Static Monument Signs
  • Pylon Sign Structures
  • Storefront Attached Display Panels
  • Hybrid Digital Static Combination Structures
  • Retail and Grocery Chains
  • Quick Service Restaurants
  • Commercial Real Estate Developments
  • Automotive Dealerships
  • Medical and Office Parks
  • New Construction Installation Programs
  • Retrofit and Replacement Programs
  • Content Management Service Contracts
  • Fabricator Maintenance Agreements

By Region

  • North America
  • Western Europe
  • East Asia
  • South Asia and Pacific
  • Latin America
  • Middle East and Africa
  • Eastern Europe

Scope, Methodology, and Coverage

Every figure in this report is reproducible from documented input assumptions. The scope below maps the historical period, the forecast horizon, the segmentation dimensions, and the countries covered, alongside the underlying primary and qualitative methodology.
Historical Period
2020 to 2025
Forecast Period
2026 to 2036
Base Year
2025 (USD billions; MMA Primary Research Dataset, October 2026)
Market Definition
The Out Store Signage Market covers exterior-mounted commercial signage structures, including pylon signs, monument signs, storefront displays, and attached digital or static panels, installed outside the building envelope to identify or advertise a retail or commercial location. It excludes indoor point-of-purchase displays, vehicle wraps and mobile advertising, and general outdoor billboard advertising structures not tied to a specific storefront location.
Quantitative Units
USD billions
Segmentation Dimensions
Regions Covered
North America, Western Europe, East Asia, South Asia and Pacific, Latin America, Middle East and Africa, Eastern Europe
Countries Covered
Key Companies Profiled
Daktronics Inc, Watchfire Signs, YESCO, FASTSIGNS International, Image National Inc, Jordan Sign Group, Federal Heath Sign Company, Everbrite LLC, Sign Source Solutions, Allied Signage, Poole and Kent Signs, Thomas Visual Identity, Trinity Signs, Global Signs Group, Nova Pole Signage, Vomela Specialty Company, Pro Sign Solutions, Capital Signs Industries, Metro Signage Group, ASI Signage Innovations
Quantitative Methodology
Primary survey, n=3,800 respondents, Q4 2025, six countries; demand-side model with trade association cross-validation
Qualitative Methodology
47 expert interviews, Q4 2025; applied to validate demand model assumptions, identify emerging dynamics, and assess competitive positioning
Report Format
PDF and XLSX data workbook (Word format preview document)
Publisher
Market Minds Advisory
Report Code
MMA-2026-CON-708
Published
October 2026
Contact
sales@marketmindsadvisory.com | www.marketmindsadvisory.com

Purchase the full Out Store Signage Market Report (2026 to 2036).

This report provides a comprehensive assessment of the Out Store Signage Market through 2036. It covers digital LED, illuminated static, and hybrid pylon and monument structures across retail, restaurant, and commercial real estate end-use categories. The analysis details regional demand patterns, competitive positioning among established sign fabricators, and input-cost exposure tied to aluminum, steel, and LED module supply concentration. It draws on primary survey data, expert interviews, and company disclosures to quantify segment-level growth and margin architecture across the forecast period. Forecasts reflect both base-case and scenario-adjusted bull and bear trajectories through 2036.
Ten-year revenue and unit volume forecasts
Seven-region demand share and CAGR breakdown
Twenty-company competitive benchmarking and positioning profile
Segment-level CAGR and margin tier analysis
Input-cost exposure mapping and mitigation pathways
Anonymized client case study with full strategy roadmap

Built For The People Who Decide

From boardroom strategy to bench-side execution, this report is read cover-to-cover by leaders shaping the next decade of their industry, turning demand scenarios, market dynamics and valuation benchmarks into decisions.
CXOs/ Presidents/ VPs/ Managers
M&A and Corporate Development
Strategy Teams and R&D Heads
Procurement and Product Directors
Regulatory and Compliance Leaders
Investor Relations and Equity Analysts