

Market Minds Advisory
Out of Band Authentication Market

Out of Band Authentication Market: Out of Band Authentication Market: Channel Deprecation, Fraud Economics and What Replaces The Text Message 2026 to 2036

The channel almost everybody still uses is the one that regulators and fraud teams are actively deprecating. Text messages carry most of the volume and almost none of the confidence.

Lead Analyst

Published

September 2026

Make Smarter Decisions with Customized Research Insights

Request a free sample report and evaluate market opportunities, growth trends, and competitive dynamics relevant to your business needs.

2025 MARKET VALUE$2.6BMarket Size 2025
2036 FORECAST VALUE$8.9BBase Case , 2026 to 2036
CAGR 2026 TO 203611.8 %Bull 13.1% / Bear 10.5%
INCREMENTAL OPPORTUNITY$6.0BNet 10- year value creation
EXPANSION MULTIPLE3.07x2036 value over 2026 base
Strategic Levers
M&A Pipeline
Regional Outlook
Country Rankings
Competitive Intelligence
Segmental Deep-dive
Call-Us : 91 93563 13602

Executive Snapshot and Market Trajectory.

The channel almost everybody still uses is the one regulators and fraud teams are actively deprecating. Text message authentication carries most of the volume in this market and almost none of the confidence, and that contradiction is now repricing the whole category. Volume and confidence have never been further apart.
The market reaches USD 2.9 billion in 2026 and USD 8.9 billion by 2036, a 3.07 times expansion at 11.8% annually. Cryptographic push and device-bound authentication grows at 17.7%, half again the market rate of 11.8%, because it removes the interception route that makes text messages cheap to defeat. East Asia holds 27% of authentication revenue and India compounds fastest at 19.4% on mandated transaction authentication event volume.
Five providers hold 41% of authentication revenue, low for a security category, because telecommunications aggregators, identity platforms and specialist vendors all compete for the same events on entirely different cost bases. Twilio, Cisco Systems, Okta, Entrust and Thales lead. Roughly 64% of events still travel by text message, and enrolment friction rather than fraud exposure keeps them there. Per event delivery cost decides most competitive outcomes here. Concentration has stayed low for years.
Market Definition
This report covers out of band authentication: the delivery, verification and platform infrastructure that authenticates a user through a channel separate from the primary session. It spans text message and voice one-time passcodes, cryptographic push and device-bound authentication, email and messaging application delivery, hardware token provisioning, and the orchestration and risk engines that route between channels. It excludes in-session passwords, biometric matching software sold independently, physical access control, and payment processing infrastructure.
Base Year Value
$2.6B in 2025 (MMA Primary Research Dataset, September 2026)
Forecast Period
2026 to 2036, eleven discrete annual values
CAGR
11.8% base case. Bull 13.1%. Bear 10.5%.
Fastest Growth Segment
Cryptographic Push And Device-Bound Authentication: 17.7% CAGR
Fastest Growth Country
India: 19.4% CAGR
Fastest Growth Region
South Asia and Pacific: 14.0% CAGR
Largest Region
East Asia: 27% of 2025 global value
Market Leaders
Twilio, Cisco Systems, Okta, Entrust and Thales lead on out of band authentication platform and delivery revenue. Source: MMA Analysis.
Primary Survey
n=3,800 procurement and R&D decision-makers, Q4 2025, six countries
Methodology
Demand-side build-up, cross-validated against public data, 47 expert interviews

Out of Band Authentication Market Forecast Scenarios

out-of-band-authentication-market-size-forecast-scenario-1789999101211
Between 2020 and 2025 the category compounded at 10.6%, and volume grew considerably faster than revenue did. Regulators across banking and payments mandated a second factor, which pushed authentication events up sharply while per-message pricing fell under aggregator competition. The result was a market getting larger and cheaper at the same time, and providers who had built their economics around message margin found that position eroding underneath them.
The base case holds 11.8% on three mechanisms. Fraud losses from interception keep pushing enterprises off text messages onto cryptographic channels that cost more per event and carry far better economics for the provider. Regulated sectors keep expanding which transactions require a second factor rather than which logins do. And risk-based routing keeps replacing blanket authentication, which reduces event volume while raising the value of each remaining decision considerably. Those three run largely independently.
The bull case at 13.1% assumes device-bound credentials reach consumer scale across banking and government services, since that would convert a per-message business into a platform one. The bear case at 10.5% is authentication being absorbed into operating system and browser capability supplied at no cost, which removes the purchase for the largest consumer use cases entirely.

The Cheapest Channel Is The Weakest

Roughly 64% of authentication events still travel by text message, which is the channel with the worst security properties in the category and the only one that requires no application, no enrolment and no device binding. That combination is exactly why it persists. Confirmed interception and subscriber transfer fraud rose around 31% over the past year, and enterprises are moving, though considerably more slowly than the incident data alone would suggest they should.
TOP FIVE CONCENTRATION41%Low for security, reflecting aggregators competing against identity platforms
TEXT MESSAGE VOLUME SHARE64%Authentication events still delivered through the least trusted channel
INTERCEPTION ATTACK GROWTH31%Annual rise in confirmed interception and subscriber transfer fraud
DELIVERY COST DIFFERENTIAL7xCryptographic push against message delivery on a per event basis
RISK BASED ROUTING ADOPTION37%Enterprises routing by risk rather than authenticating every single session
REGULATED SECTOR REVENUE SHARE58%Revenue from banking, payments, healthcare and government buyers combined
Cost is what actually governs the pace. Cryptographic push authentication costs roughly seven times a delivered message on a per event basis, and for a consumer bank running very large volumes that difference is a budget line rather than a rounding error. Providers pitching security improvement lose to those reframing it around fraud loss avoided, which sits with a different function entirely.
Routing is quietly changing the shape of demand. Around 37% of enterprises now authenticate by risk rather than authenticating every session, which reduces total event volume while raising what each remaining decision is worth. That shift favours platforms with risk engines and disadvantages providers whose revenue depends on message count. Cryptographic push and device-bound authentication grows at 17.7% against 11.8% for the market.
"Everybody in this market knows text message authentication is the weak link and everybody keeps shipping it, because it is the only channel that works for a customer who has not installed anything. The vendors winning are not the ones with the best cryptography. They are the ones who made enrolment survivable."
Director, Identity and Authentication Technology Practice · MMA Technology Practice · September 2026

Market Trends

Interception Fraud Is Repricing The Default Channel

Confirmed interception and subscriber transfer fraud rose around 31% across the past year, which turned text message authentication from an accepted compromise into a quantified liability that risk committees now examine directly. Roughly 64% of events still travel that way because it needs no application and no enrolment. Enterprises are moving off it, though slower than the incident data suggests they should, and the ones moving fastest are those whose fraud losses became large enough to appear in financial reporting rather than in a security dashboard. Loss arithmetic drives migration, not awareness.
Market Impact: Regulated buyers supply 58% of revenue

Risk Based Routing Reduces Volume And Raises Value

Around 37% of enterprises now authenticate by assessed risk rather than challenging every session, which cuts total event volume while making each remaining decision considerably more valuable to get right. That shift favours platforms holding risk engines and signal history, and it disadvantages providers whose revenue moves with message count. Aggregators built on delivery margin are watching their own customers deliberately send fewer messages, which is an uncomfortable position for a business priced entirely per event delivered. Providers holding the routing decision keep revenue as volume falls away beneath them.
Market Impact: Push costs roughly 7x messages

Market Opportunities and Growth Drivers

Regulators Expand Which Transactions Require A Second Factor

Banking and payment supervisors keep widening the set of transactions requiring a second factor rather than merely the set of logins, which multiplies authentication events across payment initiation, beneficiary changes and account modification. Regulated buyers now account for roughly 58% of revenue in this category. India compounds at 19.4% substantially on that basis, as domestic payment volumes and mandated authentication expand together at a pace no other market approaches at present. Payment initiation, beneficiary changes and account modification each generate their own authentication event, which multiplies volume per customer several times over against a login-only requirement.
Market Impact: Around 64% remain on messages

Fraud Loss Arithmetic Beats Security Argument Entirely

Cryptographic push authentication costs roughly seven times a delivered message per event, and no consumer bank approves that on security improvement alone. Providers who reframe the comparison around fraud loss avoided reach the risk and finance functions rather than the security team, and those functions hold the budget that matters. That reframing is what actually moves large consumer deployments, and vendors still selling cryptographic strength are pitching to people who cannot approve the spending. Interception fraud rising around 31% annually supplies the numerator that argument needs to work at all.
Market Impact: Consumer cases face 0 cost rivals

Market Restraints and Challenges

Enrolment Friction Blocks The Better Channels

Cryptographic and device-bound authentication requires the user to install something and complete enrolment, which text messages never did, and consumer drop-off during that step is what keeps roughly 64% of events on the weakest channel. The root cause is that authentication is a barrier the customer did not ask for. Commercially this caps migration regardless of fraud exposure. Mitigation runs through enrolment inside existing banking applications, through progressive enrolment triggered by risk, and through fallback routing that keeps messages available. None of those removes the friction; they move it to a moment the customer is already engaged.
Market Impact: Interception fraud rose 31% annually

Platform Capability Threatens Consumer Use Cases

Operating system and browser vendors increasingly supply device-bound authentication at no additional cost, which removes the purchase entirely for the largest consumer scenarios rather than competing on price for them. The root cause is that the credential lives on hardware those vendors already control. Commercially this caps the consumer addressable base. Mitigation runs through regulated workflows platforms will not certify, through cross-channel orchestration, and through risk engines that platform credentials do not include at all. Regulated buyers already supply roughly 58% of category revenue, and that concentration is what remains defensible against something free and improving.
Market Impact: Some 37% now route by risk
4 additional market trends, 3 additional growth drivers, and 2 additional restraints and challenges are covered in the full report. Contact sales@marketmindsadvisory.com to access the complete intelligence.

Segment CAGR and Growth Architecture

Segmentation follows authentication channel and platform layer, since each carries quite different delivery economics, enrolment friction and regulatory acceptance. Six classes cover the market: cryptographic push and device-bound authentication, risk engines and orchestration, text message delivery, voice delivery, messaging application delivery, and hardware token provisioning. Buyer sector and deployment route are separate dimensions handled elsewhere in this report.
out-of-band-authentication-market-market-share-analysis-1789999101771

Cryptographic Push And Device-Bound Authentication

Cryptographic push and device-bound authentication grows at 17.7%, half again the market rate of 11.8%, because it removes the interception route that makes text message authentication cheap for an attacker to defeat and increasingly expensive for a bank to defend. It costs roughly seven times a delivered message per event, so adoption follows fraud loss arithmetic rather than any security argument. Enrolment friction is the binding constraint rather than cost alone: a customer who never installs the application never reaches the better channel, which is why progressive enrolment inside existing banking applications has become the deciding capability. Providers treating enrolment as the customer's problem lose deployments to those treating it as product work.
CAGR 17.7%

Risk Engines And Authentication Orchestration

Risk engines and authentication orchestration compound at 15.2% as around 37% of enterprises move to challenging by assessed risk rather than authenticating every session indiscriminately. That reduces total event volume while raising what each remaining decision is worth, which suits platforms and disadvantages providers priced per message delivered. Orchestration also solves the fallback problem: an enterprise migrating toward cryptographic channels still needs messages available for customers who have not enrolled, and routing between them intelligently is a capability rather than a configuration setting. Signal history accumulates over years of observed authentication outcomes, which is why newer entrants price aggressively and still lose the accounts that care about decision quality. Decision quality wins those accounts.
CAGR 15.2%
Full segment breakdown across 6 segments available in the complete report.

Regional Architecture and Country Demand Map

East Asia holds 27% of authentication revenue, the largest regional share, because consumer payment and messaging volumes generate authentication events at a density no other region approaches. North America follows at 25% on enterprise and regulated sector platform spending. India compounds fastest at 19.4% on mandated transaction authentication.

East Asia

East Asia takes 27% of authentication revenue, the largest regional share, because consumer payment and messaging volumes generate authentication events at a density no other region comes close to matching. Chinese and South Korean payment platforms authenticate at transaction level rather than session level, which multiplies events per user considerably. Messaging application delivery is far more established here than elsewhere, since the applications concerned already hold near universal installation. Growth at 12.9% runs above the global rate on transaction volume rather than on enterprise platform purchasing. Enrolment friction is lower here for the same reason, since the applications carrying authentication are ones customers open daily rather than ones they installed once.
Share: 27% | CAGR: 12.9% (2026 to 2036)

North America

North America accounts for 25% of revenue, weighted toward enterprise platform spending and regulated sector deployment rather than toward consumer transaction volume. Twilio, Cisco Systems and Okta all operate from here, and the competition between aggregators and identity platforms is sharpest in this region. Interception fraud reporting is most developed here, which makes the loss arithmetic that drives migration easier for buyers to construct. Growth at 12.4% sits above the global rate on cryptographic channel migration rather than on any event volume expansion. Platform vendors supplying free device-bound credentials also press hardest here, which caps the unregulated consumer opportunity more sharply than in any other region. Enterprise platform pricing holds up better here than anywhere else.
Share: 25% | CAGR: 12.4% (2026 to 2036)
Regional intelligence for 5 additional markets available in the complete report: Western Europe, South Asia and Pacific, Latin America, Middle East and Africa, Eastern Europe. Contact sales@marketmindsadvisory.com.
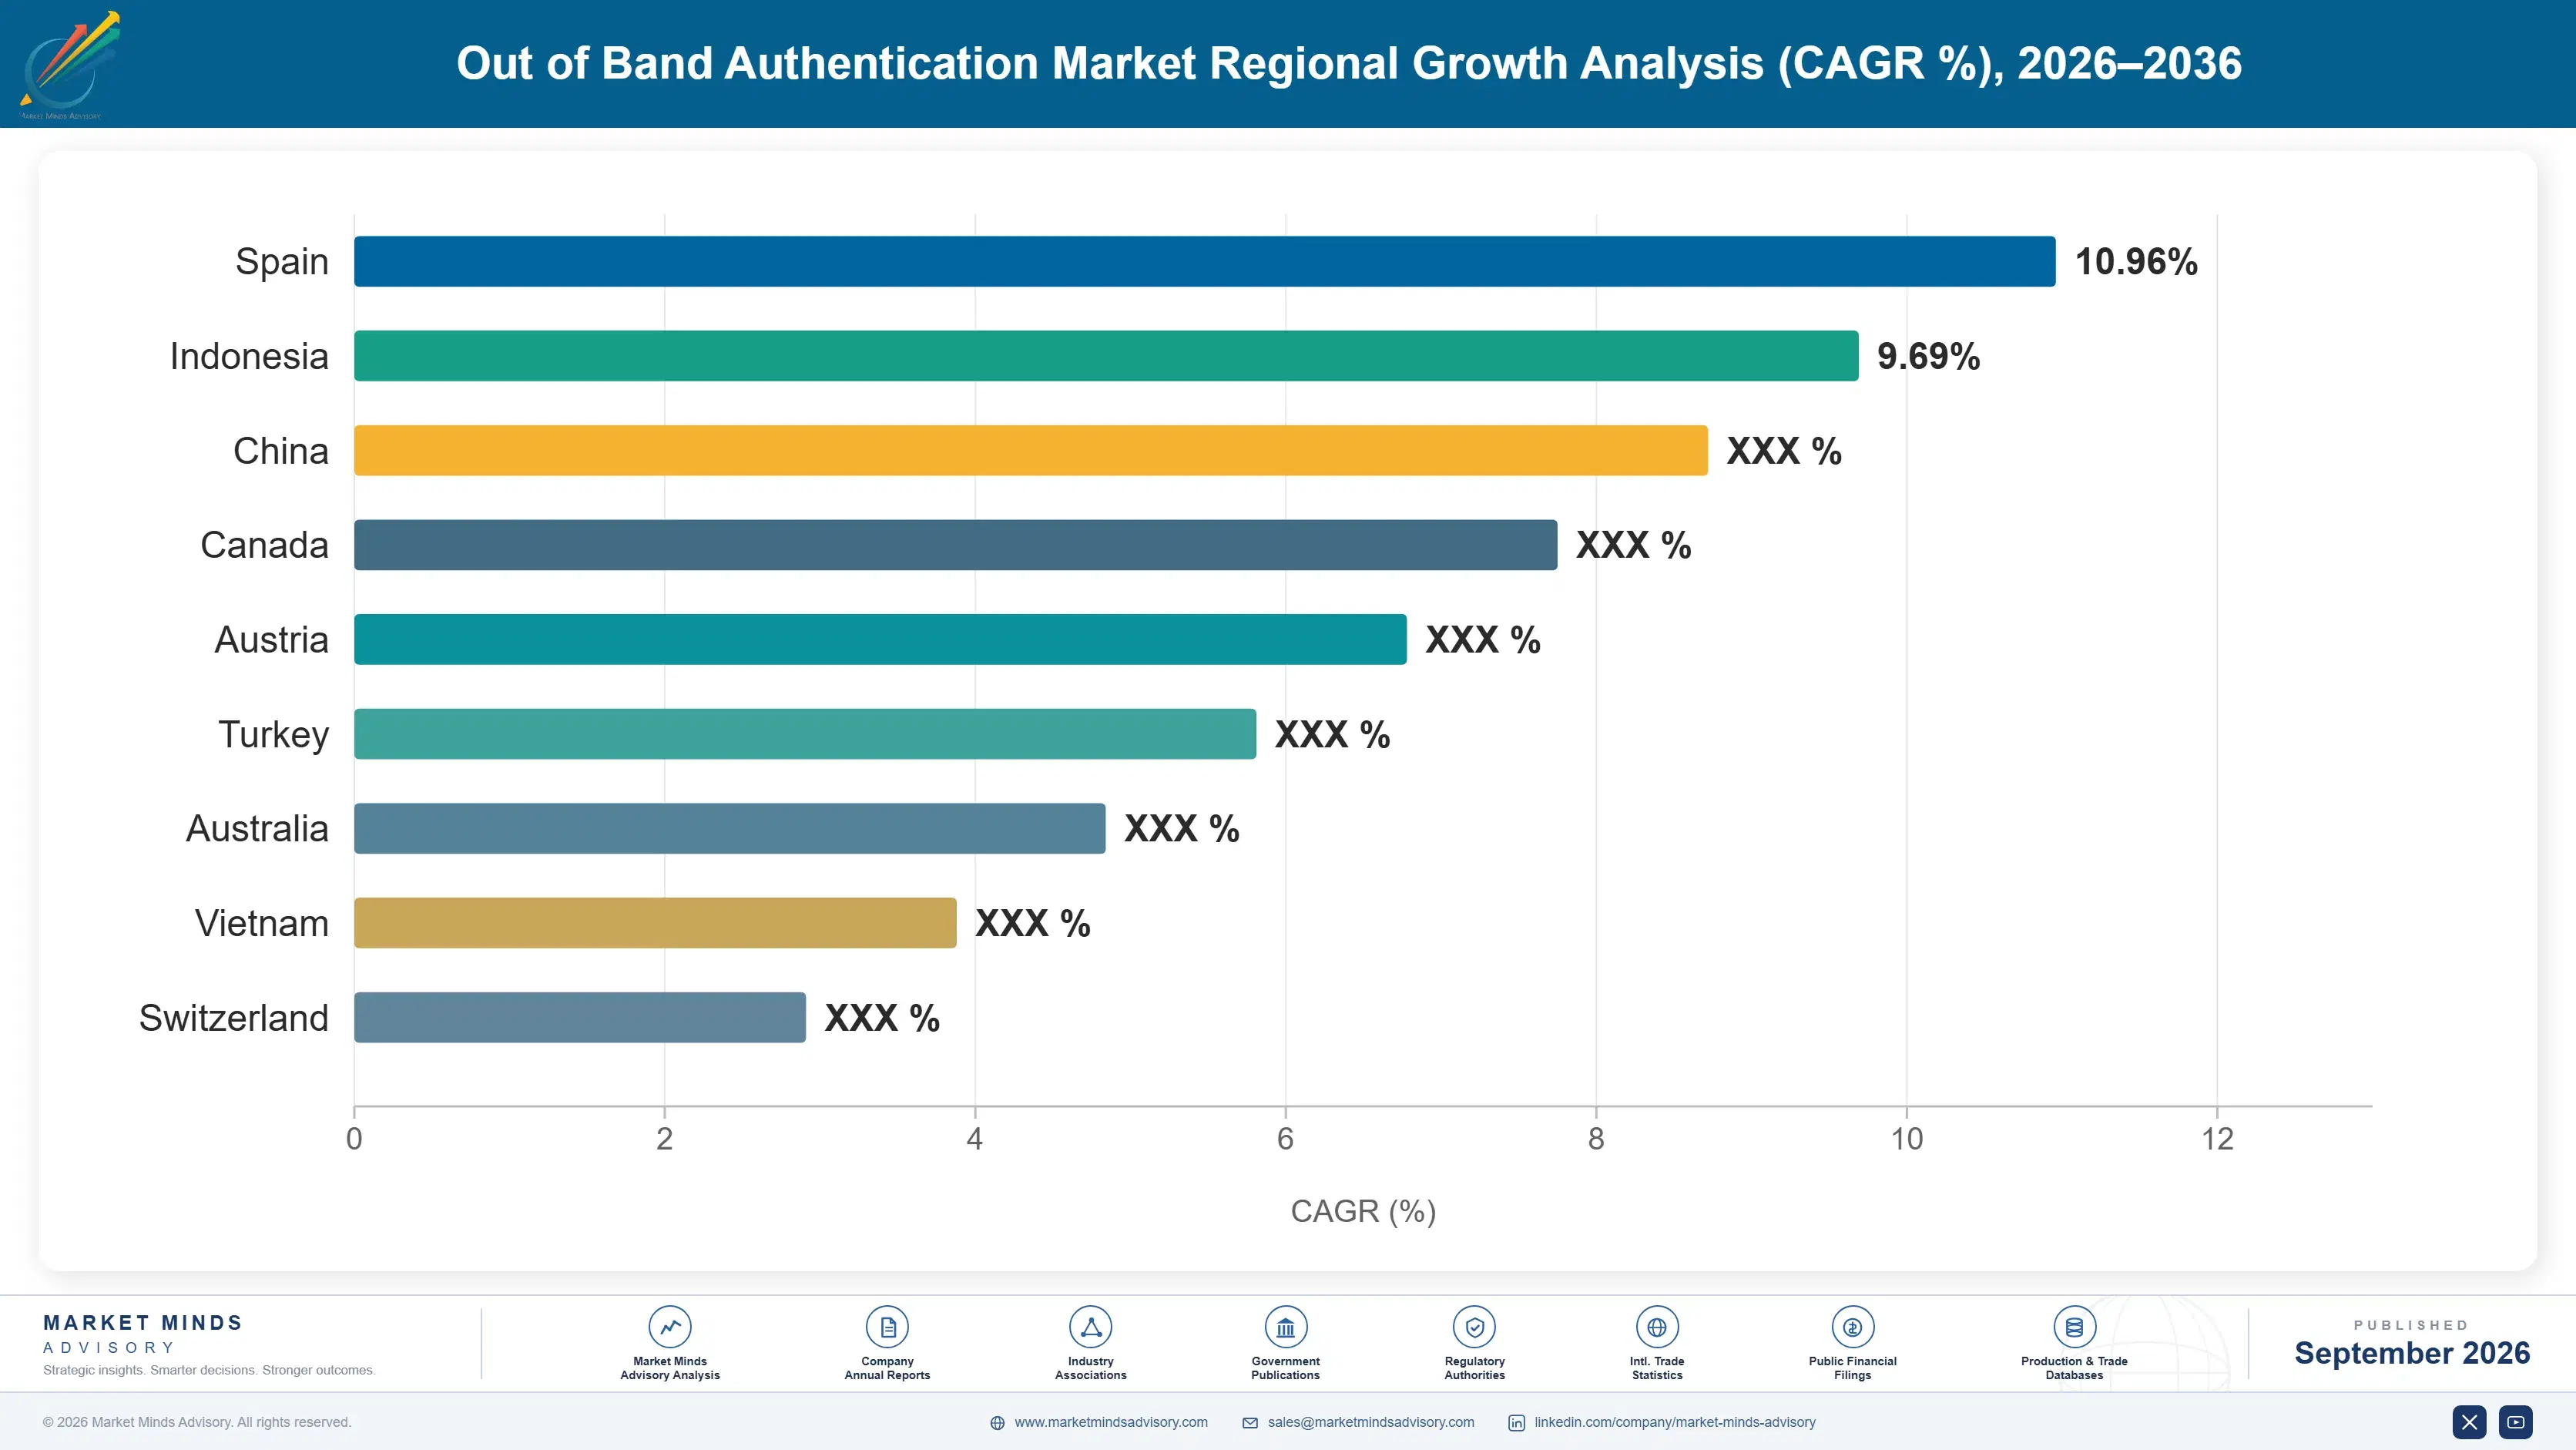
out-of-band-authentication-market-country-cagr-analysis-1789999102285

Where Authentication Revenue Is Won

Delivery cost per event decides most outcomes, enrolment friction rather than fraud exposure caps migration to better channels, and routing by risk is reducing the volume that per-message businesses depend on. The four levers below follow those conditions rather than any argument about cryptographic strength. Each addresses a commercial condition rather than a technical one.

Sell Fraud Loss Avoided, Not Security Improvement

Cryptographic push costs roughly 7 times a delivered message per event, and no consumer bank approves that on security merit alone. Providers who build the comparison from fraud loss avoided reach risk and finance functions holding the budget, rather than the security team that cannot approve it. Interception fraud rising around 31% annually supplies the numerator that argument needs, and vendors still pitching cryptographic strength are talking to people without spending authority. Fraud loss avoided is a number the risk function can already produce, which makes the case considerably easier to build than any security comparison.
Market Impact: Push now costs roughly 7x a delivered message

Make Enrolment Survivable Inside Existing Applications

Roughly 64% of events remain on text messages because a customer who never installs anything never reaches a better channel, and consumer drop-off during enrolment is what actually caps migration. Enrolling inside a banking application the customer already uses removes that step entirely. Providers treating enrolment as the customer's problem lose deployments to those treating it as a product requirement, and the difference shows up in migration rates rather than in any feature comparison. Progressive enrolment triggered at high risk transactions reaches customers already engaged rather than interrupting them. Drop-off measured by step tells you where.
Market Impact: Some 64% of all events remain unmigrated today

Own The Routing Decision Rather Than The Message

Around 37% of enterprises now challenge by assessed risk rather than authenticating every session, which cuts event volume while raising the value of each remaining decision considerably. Providers holding the routing decision keep revenue as volume falls. Those priced per message watch customers deliberately send fewer, which is an uncomfortable position for a delivery business and one that worsens every quarter as risk based routing spreads further through regulated buyers. Repricing to the decision is easier before customers reduce volume than afterwards. Risk based routing keeps spreading through regulated buyers quarter by quarter.
Market Impact: Fully 37% of buyers now route by risk

Anchor In Workflows Platforms Will Not Certify

Operating system vendors supply device-bound credentials at no cost, which removes the purchase for large consumer scenarios rather than competing on price for them. Regulated payment and healthcare workflows requiring audit evidence, channel fallback and jurisdictional controls are ones platform credentials do not address. Regulated buyers already supply roughly 58% of category revenue. Providers concentrated in unregulated consumer authentication are competing against something free and improving. Audit evidence, channel fallback and jurisdictional routing are all capabilities platform credentials do not include, and regulated buyers will not accept a credential that cannot produce them on demand.
Market Impact: Regulated work now supplies fully 58% of revenue

Who Controls the Margin Pool

Five providers hold 41% of out of band authentication revenue, low for a security category, because telecommunications aggregators, identity platforms and specialist vendors compete for the same events from entirely different cost bases. Twilio, Cisco Systems, Okta, Entrust and Thales lead. All participants are assessed on authentication platform and delivery revenue rather than on broader communications or identity businesses they also operate.
Competition runs on delivery cost per event and on enrolment capability far more than on cryptographic capability, which almost every serious participant now holds. The second dimension is risk engine depth, because around 37% of enterprises route by assessed risk and that share is rising, which shifts value from the message toward the decision that precedes it. Cryptographic capability competes a distant third behind both of those, which is not how most participants position themselves at all.

Pressure is emerging from operating system vendors supplying device-bound credentials at no cost, which removes the purchase rather than competing for it. Rankings shift where payment regulation expands and where interception losses become large enough to reach financial reporting, particularly across India, Brazil and East Asia. Participants concentrated in unregulated consumer authentication are competing against something free and improving.
out-of-band-authentication-market-company-positioning-matrix-1789999102810

Competitive Moat and Risk Dimensions

TWILIO

Moat: Delivery Reach Advantage

Twilio holds carrier relationships and delivery reach that determine whether an authentication message actually arrives, which varies considerably by network and market. Since roughly 64% of events still travel by text message, deliverability remains what buyers care most about. Competitors without equivalent carrier depth quote lower prices and deliver worse.
TWILIO

Risk: Per Message Revenue Exposure

Revenue tied to message volume shrinks as around 37% of enterprises route by assessed risk and as buyers migrate toward cryptographic channels priced differently. Delivery reach defends a channel regulators are actively deprecating. The routing decision and the risk engine are where value is moving, and both sit upstream of delivery.
OKTA

Moat: Identity Platform Position

Okta authenticates from inside the identity platform enterprises already run, which puts it upstream of the delivery decision and lets it route between channels rather than supplying one. As risk based routing spreads across roughly 37% of enterprises, holding that decision matters more than holding any channel.
OKTA

Risk: Consumer Scale Absence

Enterprise identity platform position reaches workforce and business authentication rather than the consumer payment volumes that drive event density across East Asia, India and Brazil. Those volumes are where growth concentrates. A platform strong in workforce identity and thin in consumer banking is positioned in the smaller and slower half of a market whose centre of gravity keeps moving.

Players Tracked

Prominent Players

Twilio
Cisco Systems
Okta
Entrust
Thales

Other Key Players

Ping Identity
RSA Security
OneSpan
HID Global
Infobip
Sinch
MessageBird
Vonage
Yubico
Transmit Security
Prove Identity
Telesign
BioCatch
IDEMIA
Nok Nok Labs

Recent Developments

MARCH 2025

Payment Supervisors Widen Transaction Authentication Requirements

Payment supervisors across several jurisdictions widened the set of transactions requiring a second factor beyond login events, a regulatory development rather than any corporate transaction. Payment initiation, beneficiary changes and account modification now generate authentication events, which multiplies volume across regulated buyers already supplying roughly 58% of category revenue.
Signal: Authentication at transaction level rather than session level multiplies events per customer several times over each year.
SEPTEMBER 2024

Interception Fraud Losses Reach Financial Reporting Thresholds

Confirmed interception and subscriber transfer fraud rose around 31% across the year, pushing losses at several large consumer banks past the point where they appear in financial reporting rather than security dashboards. That change moved channel migration decisions from security teams toward risk and finance functions holding real budget authority.
Signal: Migration accelerates only once fraud losses become visible to somebody who actually controls the spending decision.
JUNE 2025

Platform Vendors Expand Free Device-Bound Credential Support

Operating system and browser vendors expanded device-bound credential support available at no additional cost, a capability development rather than any acquisition. That removes the purchase for large unregulated consumer scenarios rather than competing on price, while leaving regulated workflows requiring audit evidence and channel fallback largely untouched.
Signal: Free capability removes the consumer purchase and leaves regulated workflows as the only genuinely defensible remainder.

What An Authentication Costs

Carrier termination and message delivery fees absorb roughly 44% of cost for delivery-led providers, paid to mobile network operators whose pricing varies sharply by country and by route. Platform engineering and risk model development take around 21%. Fraud and deliverability monitoring absorbs about 12%, and compliance certification across payment and healthcare regimes takes most of the remaining balance.
Message termination pricing rose across several large markets through 2023 and 2024 as network operators repriced application-to-person traffic and tightened enforcement against grey routes. Twilio Annual Report 2024 and Thales Annual Report 2024 both record delivery cost and regulatory compliance among principal operating variables. Providers whose revenue is priced per message absorbed that increase directly, while platform-priced competitors passed considerably less of it through to their customers.

The competitive disadvantage mechanism is revenue model rather than input cost. A provider earning per message carries termination cost that rises while customers deliberately reduce volume through risk based routing, which squeezes from both directions at once. Exposure concentrates among aggregators without platform or risk engine revenue, since every efficiency their customers gain removes revenue rather than merely reducing cost.
out-of-band-authentication-market-cost-volatility-analysis-1789999103006

Price The Decision Rather Than The Delivered Message

Carrier termination absorbs roughly 44% of delivery-led cost while around 37% of enterprises now deliberately send fewer messages through risk based routing. Pricing the authentication decision rather than the delivery converts customer efficiency from lost revenue into retained revenue. The change is commercial rather than technical, and it is considerably easier to make before customers have already reduced their volumes.

Diversify Delivery Routes Against Termination Repricing

Message termination pricing varies sharply by country and route, and network operators have repriced application traffic repeatedly across recent years. Holding multiple certified routes per market preserves margin and deliverability when any single one moves against you. The investment looks unnecessary while pricing is stable, which is precisely when it needs to be made rather than after a repricing lands.

Automate Compliance Certification Across Payment Regimes

Compliance certification across payment and healthcare regimes recurs by jurisdiction and by regime version, and regulated buyers supply roughly 58% of category revenue. Building evidence collection into the platform converts a repeating project into a reporting function. Providers treating each certification as a separate engagement carry cost that scales with jurisdictions served rather than staying flat across them.

Portfolio Architecture for Margin Defence

Margin architecture separates on whether revenue passes through a carrier. Text message and voice delivery earn least, since termination fees absorb roughly 44% of cost and pricing competition among aggregators is severe. Messaging application delivery and hardware token provisioning sit above. Cryptographic push and device-bound authentication and risk engines earn most, because neither carries termination cost and both price against fraud loss rather than message volume.
The volume versus premium tension runs between delivery scale and platform position, which reward opposite commercial behaviour entirely. Delivery rewards route optimisation and aggressive pricing against very large volumes. Platform rewards risk model depth and enrolment capability at far higher revenue per event. Providers attempting both frequently find the delivery business subsidising a platform their own customers are using to send fewer messages.

High-value pools concentrate in cryptographic authentication and in risk engines, and neither is reached through delivery scale. Cryptographic channels require enrolment capability inside customer applications, which is product work rather than infrastructure. Risk engines require signal history that accumulates over years of observed authentication outcomes. Both are why platform participants keep holding those positions while aggregators compete on price beneath them.

Volume / Commodity-Adjacent

Text message and voice delivery, where carrier termination absorbs roughly 44% of cost and aggregator pricing competition is severe across every major market. The fourteen point spread separates providers holding multiple certified routes per market from those dependent on single arrangements.
Gross Margin: 22% to 36%

Premium / Certified

Messaging application delivery and hardware token provisioning, where installed application reach or physical logistics determine position rather than any pricing comparison. The fourteen point spread tracks how much of each provider's volume travels through channels it controls rather than routes it rents.
Gross Margin: 44% to 58%

Sustainability / Regulatory / Next-Generation

Cryptographic push and device-bound authentication and risk engines, neither carrying termination cost and both pricing against fraud loss avoided rather than message volume. The fifteen point spread reflects enrolment capability and accumulated risk signal history, which take years to build.
Gross Margin: 66% to 81%
out-of-band-authentication-market-portfolio-architecture-1789999103513

High-value Sub-segments and Strategic Watch-out

Cryptographic Push And Device-Bound Authentication

Grows at 17.7% because it removes the interception route that makes text messages cheap for attackers to defeat. The fifteen point spread reflects enrolment capability. Cost per event runs roughly seven times message delivery, so adoption follows fraud arithmetic. Enrolment friction caps the pace. Product work decides it.
Gross Margin: 66% to 81%

Risk Engines And Authentication Orchestration

Grows at 15.2% as around 37% of enterprises challenge by assessed risk rather than authenticating every session. The fifteen point spread reflects accumulated signal history. Holding the routing decision matters more than holding any single delivery channel. Value is moving upstream steadily. Newer entrants price aggressively.
Gross Margin: 66% to 81%

Messaging Application Delivery

Grows at 12.6% on installed application reach that is far stronger across East Asia than anywhere else in the world. The fourteen point spread reflects channel control. Deliverability depends on relationships with platforms rather than with mobile network operators. Reach outside Asia is thinner. Platform relationships govern here.
Gross Margin: 44% to 58%

Text Message And Voice Delivery

Grows at 6.8%, slowest of the six classes, as regulators and fraud teams actively deprecate the channel carrying most volume. The fourteen point spread reflects route diversity. Roughly 64% of events still travel this way despite everything known about it. Nothing else needs no enrolment.
Gross Margin: 22% to 36%

Why Enrolment Decides Everything

The annuity in this category is enrolment rather than any contract. A customer enrolled in a cryptographic channel authenticates through it for years, at higher revenue per event and considerably lower fraud exposure. A customer who never enrolled receives text messages indefinitely, at thin margin on a channel regulators are deprecating. Roughly 64% of events remain in the second category.
Depth varies by where enrolment happened. A credential established inside a banking application the customer already uses survives device changes and password resets because the relationship carrying it is one the customer values. A credential established through a separate authenticator application depends on the customer remembering something they installed once for a reason they no longer recall. Providers who understood that difference built enrolment into their customers' applications rather than alongside them.

The buyer has changed more than the technology has. A security function evaluated cryptographic strength and standards compliance against a technical checklist. A risk function evaluates fraud loss avoided against cost per event running roughly seven times higher. A product function evaluates how many customers abandon enrolment. Providers organised around the first buyer are selling to somebody without budget authority.
out-of-band-authentication-market-end-use-penetration-index-1789999104005

What Wins Authentication Deals

These are among the four positions where our research anticipates prominent divergence between winners and laggards over the coming forecast period. Each is grounded in the demand model, the regulatory perimeter, and the announced capacity pipeline.
01 / LOSS ARITHMETIC FRAMING

Quantify Fraud Avoided, Not Cryptographic Strength

Cryptographic push authentication costs roughly seven times a delivered message per event, and no consumer bank has ever approved that difference on security merit alone. Providers building the comparison from fraud loss avoided reach the risk and finance functions that actually hold budget authority, rather than a security team that cannot approve the spending. Interception fraud rising around 31% annually supplies exactly the numerator that argument requires to work, and the risk function can already produce that figure without help.
02 / ENROLMENT PRODUCT OWNERSHIP

Build Enrolment In, Do Not Delegate It

Roughly 64% of authentication events remain on text messages because a customer who never installs anything never reaches a better channel at all. Consumer drop-off during enrolment caps migration far more tightly than fraud exposure or cost ever has. Providers who build enrolment inside applications customers already use win deployments from those treating it as somebody else's problem, and the gap shows in migration rates rather than features or in any technical evaluation the buyer runs beforehand and rarely in the product comparison itself.
03 / DECISION LAYER POSITIONING

Own The Routing, Not The Channel

Around 37% of enterprises now challenge by assessed risk rather than authenticating every session, which cuts event volume while raising what each remaining decision is worth to get right. Providers holding the routing decision keep revenue as volume falls away beneath them. Those priced per message watch their own customers deliberately send fewer, which worsens every quarter as risk based routing spreads through regulated buyers, and repricing after that has happened is considerably harder once volumes have already fallen away.
04 / REGULATED WORKFLOW ANCHORING

Compete Where Free Credentials Cannot Reach

Operating system vendors supply device-bound credentials at no additional cost, which removes the purchase for large consumer scenarios rather than competing on price within them. Regulated payment and healthcare workflows requiring audit evidence, channel fallback and jurisdictional control are not addressed by those credentials at all. Regulated buyers already supply roughly 58% of category revenue, and that concentration is the defensible position remaining for participants who reach it in time, provided participants reach it before the free credentials improve further.

Engagement Snapshot From the Field

A live engagement with an industry participant carrying material or product regulatory and market exposure ahead of a defining policy shift, showing how our research translates into a defensible multi-year portfolio strategy.
MARKET MINDS ADVISORY · CLIENT ENGAGEMENT SUMMARY
Out of Band Authentication Producer Strategic Portfolio Review and Transition Roadmap 2026·Investment Scenario on Out of Band Authentication Exposure Evaluation 2025-26
CLIENT PROFILE
A consumer bank running very large text message authentication volumes and absorbing rising interception fraud losses, having attempted a migration to cryptographic push authentication that reached a small fraction of its customer base before stalling. Leadership had approved a further security awareness campaign, without anybody establishing where in the migration customers were actually dropping out.
STRATEGIC CHALLENGE
Security wanted mandatory migration with text message fallback withdrawn. Operations warned that withdrawal would generate call volumes the contact centre could not absorb. Nobody had measured enrolment drop-off by step, and fraud losses had grown large enough over four quarters to appear in financial reporting rather than in any internal security dashboard.
MMA APPROACH
MMA instrumented the enrolment path to establish where customers abandoned it and which cohorts never began at all. We modelled fraud loss avoided against cost per event for each migration scenario, and tested progressive enrolment triggered by transaction risk against the existing campaign approach. Work drew on 47 expert interviews conducted in Q4 2025 alongside the bank's own authentication and fraud records.
KEY FINDINGS
  1. Around 61% of enrolment abandonment occurred at a single step requiring customers to leave the banking application to install a separate authenticator.
  2. Awareness campaigns had moved enrolment by under 2 percentage points across 3 attempts, because the obstacle was never customer understanding at all.
  3. Progressive enrolment triggered by transaction risk reached 4 times the completion rate of campaign-driven enrolment across the tested cohort (client-reported, unverified by MMA).
  4. Fraud loss avoided exceeded the cost differential at roughly 7 times per event for the highest risk transaction cohort by a wide margin.
CLIENT PROFILE
A consumer bank running very large text message authentication volumes and absorbing rising interception fraud losses, having attempted a migration to cryptographic push authentication that reached a small fraction of its customer base before stalling. Leadership had approved a further security awareness campaign, without anybody establishing where in the migration customers were actually dropping out.
STRATEGIC CHALLENGE
Security wanted mandatory migration with text message fallback withdrawn. Operations warned that withdrawal would generate call volumes the contact centre could not absorb. Nobody had measured enrolment drop-off by step, and fraud losses had grown large enough over four quarters to appear in financial reporting rather than in any internal security dashboard.
MMA APPROACH
MMA instrumented the enrolment path to establish where customers abandoned it and which cohorts never began at all. We modelled fraud loss avoided against cost per event for each migration scenario, and tested progressive enrolment triggered by transaction risk against the existing campaign approach. Work drew on 47 expert interviews conducted in Q4 2025 alongside the bank's own authentication and fraud records.
KEY FINDINGS
  1. Around 61% of enrolment abandonment occurred at a single step requiring customers to leave the banking application to install a separate authenticator.
  2. Awareness campaigns had moved enrolment by under 2 percentage points across 3 attempts, because the obstacle was never customer understanding at all.
  3. Progressive enrolment triggered by transaction risk reached 4 times the completion rate of campaign-driven enrolment across the tested cohort (client-reported, unverified by MMA).
  4. Fraud loss avoided exceeded the cost differential at roughly 7 times per event for the highest risk transaction cohort by a wide margin.
RECOMMENDED STRATEGY
Phase 1: Phase one: move enrolment inside the existing banking application entirely, removing the separate installation step where most of the abandonment happens. Phase 2: Phase two: trigger enrolment progressively at high risk transactions rather than through further awareness campaigns that have already failed 3 times. Phase 3: Phase three: retain text message fallback indefinitely for unenrolled customers, since withdrawal generates contact volumes well exceeding the fraud saving.
OUTCOME
The bank moved enrolment inside its banking application and triggered it progressively at high risk transactions (client-reported, unverified by MMA). Migration rates improved substantially without any campaign spending, and interception losses fell across the enrolled cohort. Enrolment completion is now tracked by step rather than in aggregate, which is the change that outlasted the engagement.

Frequently Asked Questions

Foundational context covering the market sizes, CAGR, scope, country, region and competition that inform every finding below. This section is provided to cover basics and most often pre-purchase conversations, answered from the MMA Primary Research Dataset.

What is the current size of the Out of Band Authentication Market?

Global value reaches USD 2.9 billion in 2026, measured as authentication platform and delivery revenue. The 2025 base was USD 2.6 billion on the same basis.

How large will the Out of Band Authentication Market be by 2036?

The market reaches USD 8.9 billion by 2036, an increase of USD 6.0 billion across the forecast period. That represents 3.07 times expansion from the 2026 base.

What is the CAGR for the Out of Band Authentication Market 2026 to 2036?

The base case runs at 11.8% annually, with a bull case at 13.1% if device-bound credentials reach consumer scale and a bear case at 10.5% if platform vendors absorb consumer authentication.

Which segment is growing fastest?

Cryptographic push and device-bound authentication grows at 17.7%, half again the market rate of 11.8%. It removes the interception route that makes text messages cheap to defeat.

Who are the major companies in the Out of Band Authentication Market?

Twilio, Cisco Systems, Okta, Entrust and Thales lead on platform and delivery revenue, holding 41% between them. OneSpan and Yubico hold smaller specialist positions in the category.

Which country is growing fastest?

India leads at 19.4%, as domestic payment volumes and mandated transaction authentication expand together at a pace no other market approaches. Brazil and Indonesia follow.

Report Segmentation Architecture

The full report scope spans multiple orthogonal segmentation dimensions, with cross-tabulated demand data provided for each dimension pair. Coverage extends further to regional breakdowns, trend trajectories, and the competitive detail needed to support segment-level decision-making.

By Authentication Channel And Layer

  • Cryptographic Push And Device-Bound Authentication
  • Risk Engines And Authentication Orchestration
  • Messaging Application Delivery
  • Text Message Delivery
  • Voice Delivery
  • Hardware Token Provisioning

By End-Use Industry

  • Retail And Consumer Banking
  • Payment Processors And Networks
  • Healthcare Providers And Insurers
  • Government And Public Services
  • Technology And Online Platforms
  • Telecommunications Operators

By Commercial Dimension

  • Per Event Delivery Pricing
  • Platform Subscription Licensing
  • Identity Platform Bundled Inclusion
  • Managed Service Provider Delivery
  • Direct Enterprise Contracting
  • Aggregator Wholesale Supply

By Region

  • North America
  • Western Europe
  • East Asia
  • South Asia and Pacific
  • Latin America
  • Middle East and Africa
  • Eastern Europe

Scope, Methodology, and Coverage

Every figure in this report is reproducible from documented input assumptions. The scope below maps the historical period, the forecast horizon, the segmentation dimensions, and the countries covered, alongside the underlying primary and qualitative methodology.
Historical Period
2020 to 2025
Forecast Period
2026 to 2036
Base Year
2025 (USD billions; MMA Primary Research Dataset, September 2026)
Market Definition
This report covers out of band authentication: the delivery, verification and platform infrastructure authenticating a user through a channel separate from the primary session, spanning text message and voice one-time passcodes, cryptographic push and device-bound authentication, messaging application delivery, hardware token provisioning, and the orchestration and risk engines routing between them. It excludes in-session passwords, standalone biometric matching software, physical access control, and payment processing infrastructure.
Quantitative Units
USD millions, authentication platform and delivery revenue basis; authentication events delivered; channel volume shares as percentages; cost per event ratios between channels; risk based routing adoption rates; regulated sector revenue share.
Segmentation Dimensions
Authentication channel and platform layer; end-use industry; commercial pricing route; geography across seven regions.
Regions Covered
North America, Western Europe, East Asia, South Asia and Pacific, Latin America, Middle East and Africa, Eastern Europe
Countries Covered
United States, Canada, United Kingdom, Germany, France, Netherlands, Spain, Sweden, Poland, Czechia, China, Japan, South Korea, India, Australia, Indonesia, Brazil, Mexico, Nigeria, United Arab Emirates.
Key Companies Profiled
Twilio, Cisco Systems, Okta, Entrust, Thales, Ping Identity, RSA Security, OneSpan, HID Global, Infobip, Sinch, Vonage, Yubico, Prove Identity, IDEMIA.
Quantitative Methodology
Primary survey, n=3,800 respondents, Q4 2025, six countries; demand-side model with trade association cross-validation
Qualitative Methodology
47 expert interviews, Q4 2025; applied to validate demand model assumptions, identify emerging dynamics, and assess competitive positioning
Report Format
PDF and XLSX data workbook (Word format preview document)
Publisher
Market Minds Advisory
Report Code
MMA-2026-TEC-941
Published
September 2026
Contact
sales@marketmindsadvisory.com | www.marketmindsadvisory.com

Purchase the full Out of Band Authentication Market Report (2026 to 2036).

This report sizes the global out of band authentication market from 2026 to 2036 across six channels and platform layers, six industries and seven regions. It explains why roughly 64% of authentication events still travel by the channel regulators and fraud teams are actively deprecating, and why enrolment friction rather than fraud exposure caps migration away from it. Cost per event running roughly seven times higher on cryptographic channels is analysed as the arithmetic that governs adoption pace. Risk based routing is examined as a shift moving value from delivery toward decision. Regional analysis explains why East Asia holds 27% of revenue.
Six authentication channels sized through to 2036
Channel migration economics quantified against fraud loss
Enrolment friction analysed as the binding adoption constraint
Twenty named providers assessed on authentication revenue
Four revenue levers with quantified commercial impact
Anonymised consumer bank migration engagement documented in full

Built For The People Who Decide

From boardroom strategy to bench-side execution, this report is read cover-to-cover by leaders shaping the next decade of their industry, turning demand scenarios, market dynamics and valuation benchmarks into decisions.
CXOs/ Presidents/ VPs/ Managers
M&A and Corporate Development
Strategy Teams and R&D Heads
Procurement and Product Directors
Regulatory and Compliance Leaders
Investor Relations and Equity Analysts