Market Minds Advisory
Organic Fertilizer Market

Organic Fertilizer Market: Certification Now Decides Who Captures The Premium

A commercial reading of crop nutrition, where organic certification now decides who captures premium pricing, microbial biofertilizers challenge composted waste on efficacy, and synthetic fertilizer price volatility keeps pushing growers toward alternatives.

Lead Analyst

Bilal Shaikh

Published

September 2026

Make Smarter Decisions with Customized Research Insights

Request a free sample report and evaluate market opportunities, growth trends, and competitive dynamics relevant to your business needs.

2025 MARKET VALUE$12.8BMarket Size 2025
2036 FORECAST VALUE$27.5BBase Case , 2026 to 2036
CAGR 2026 TO 20367.2 %Bull 8.4% / Bear 5.9%
INCREMENTAL OPPORTUNITY$13.8BNet 10- year value creation
EXPANSION MULTIPLE2.00x2036 value over 2026 base
Strategic Levers
M&A Pipeline
Regional Outlook
Country Rankings
Competitive Intelligence
Segmental Deep-dive
Call-Us : 91 93563 13602

Executive Snapshot and Market Trajectory

Synthetic fertilizer price volatility taught growers a lesson organic suppliers had been making for years, and certification now converts that lesson into a durable price premium few commodity crop inputs anywhere ever earn at comparable margin across an entire growing season.
The market stands at USD 12.8 billion in 2025 and reaches USD 27.5 billion by 2036 at a 7.2% CAGR. Microbial biofertilizers and inoculants grow fastest at 12.5%, about 1.74 times the overall rate, as growers seek efficacy that synthetic-adjacent alternatives can genuinely match at comparable cost per treated hectare. East Asia holds 26% of value on Chinese organic farming expansion, while India posts the quickest national growth at 11.5% on domestic biofertilizer subsidy programmes.
Concentration is low, with the top five holding roughly 22% of revenue against thousands of regional composters, cooperatives, and biofertilizer producers filling out the rest of the market almost entirely on their own. Two forces reshape the field now. Certification standards separate premium-priced product from commodity organic material that barely clears minimum thresholds, and liquid formulations attack solid composted product in horticultural segments where application precision matters most of all.
Market Definition
The organic fertilizer market covers crop nutrition products derived from plant, animal, or microbial sources that meet recognised organic certification standards, spanning composted plant and animal waste, manure-based fertilizers, bone and blood meal, vermicompost, liquid organic concentrates, and microbial biofertilizers. Synthetic fertilizers, biostimulants sold for purposes other than nutrition, and soil amendments without nutrient content are excluded.
Base Year Value
$12.8B in 2025 (MMA Primary Research Dataset, August 2026)
Forecast Period
2026 to 2036, eleven discrete annual values
CAGR
7.2% base case. Bull 8.4%. Bear 5.9%.
Fastest Growth Segment
Microbial Biofertilizers and Inoculants: 12.5% CAGR
Fastest Growth Country
India: 11.5% CAGR
Fastest Growth Region
South Asia and Pacific: 9.3% CAGR
Largest Region
East Asia: 26% of 2025 global value
Market Leaders
Coromandel International, True Organic Products, Rizobacter Argentina, Andersons Inc., Novozymes. Source: MMA Analysis based on company annual reports.
Primary Survey
n=3,800 procurement and R&D decision-makers, Q4 2025, six countries
Methodology
Demand-side build-up, cross-validated against public data, 47 expert interviews

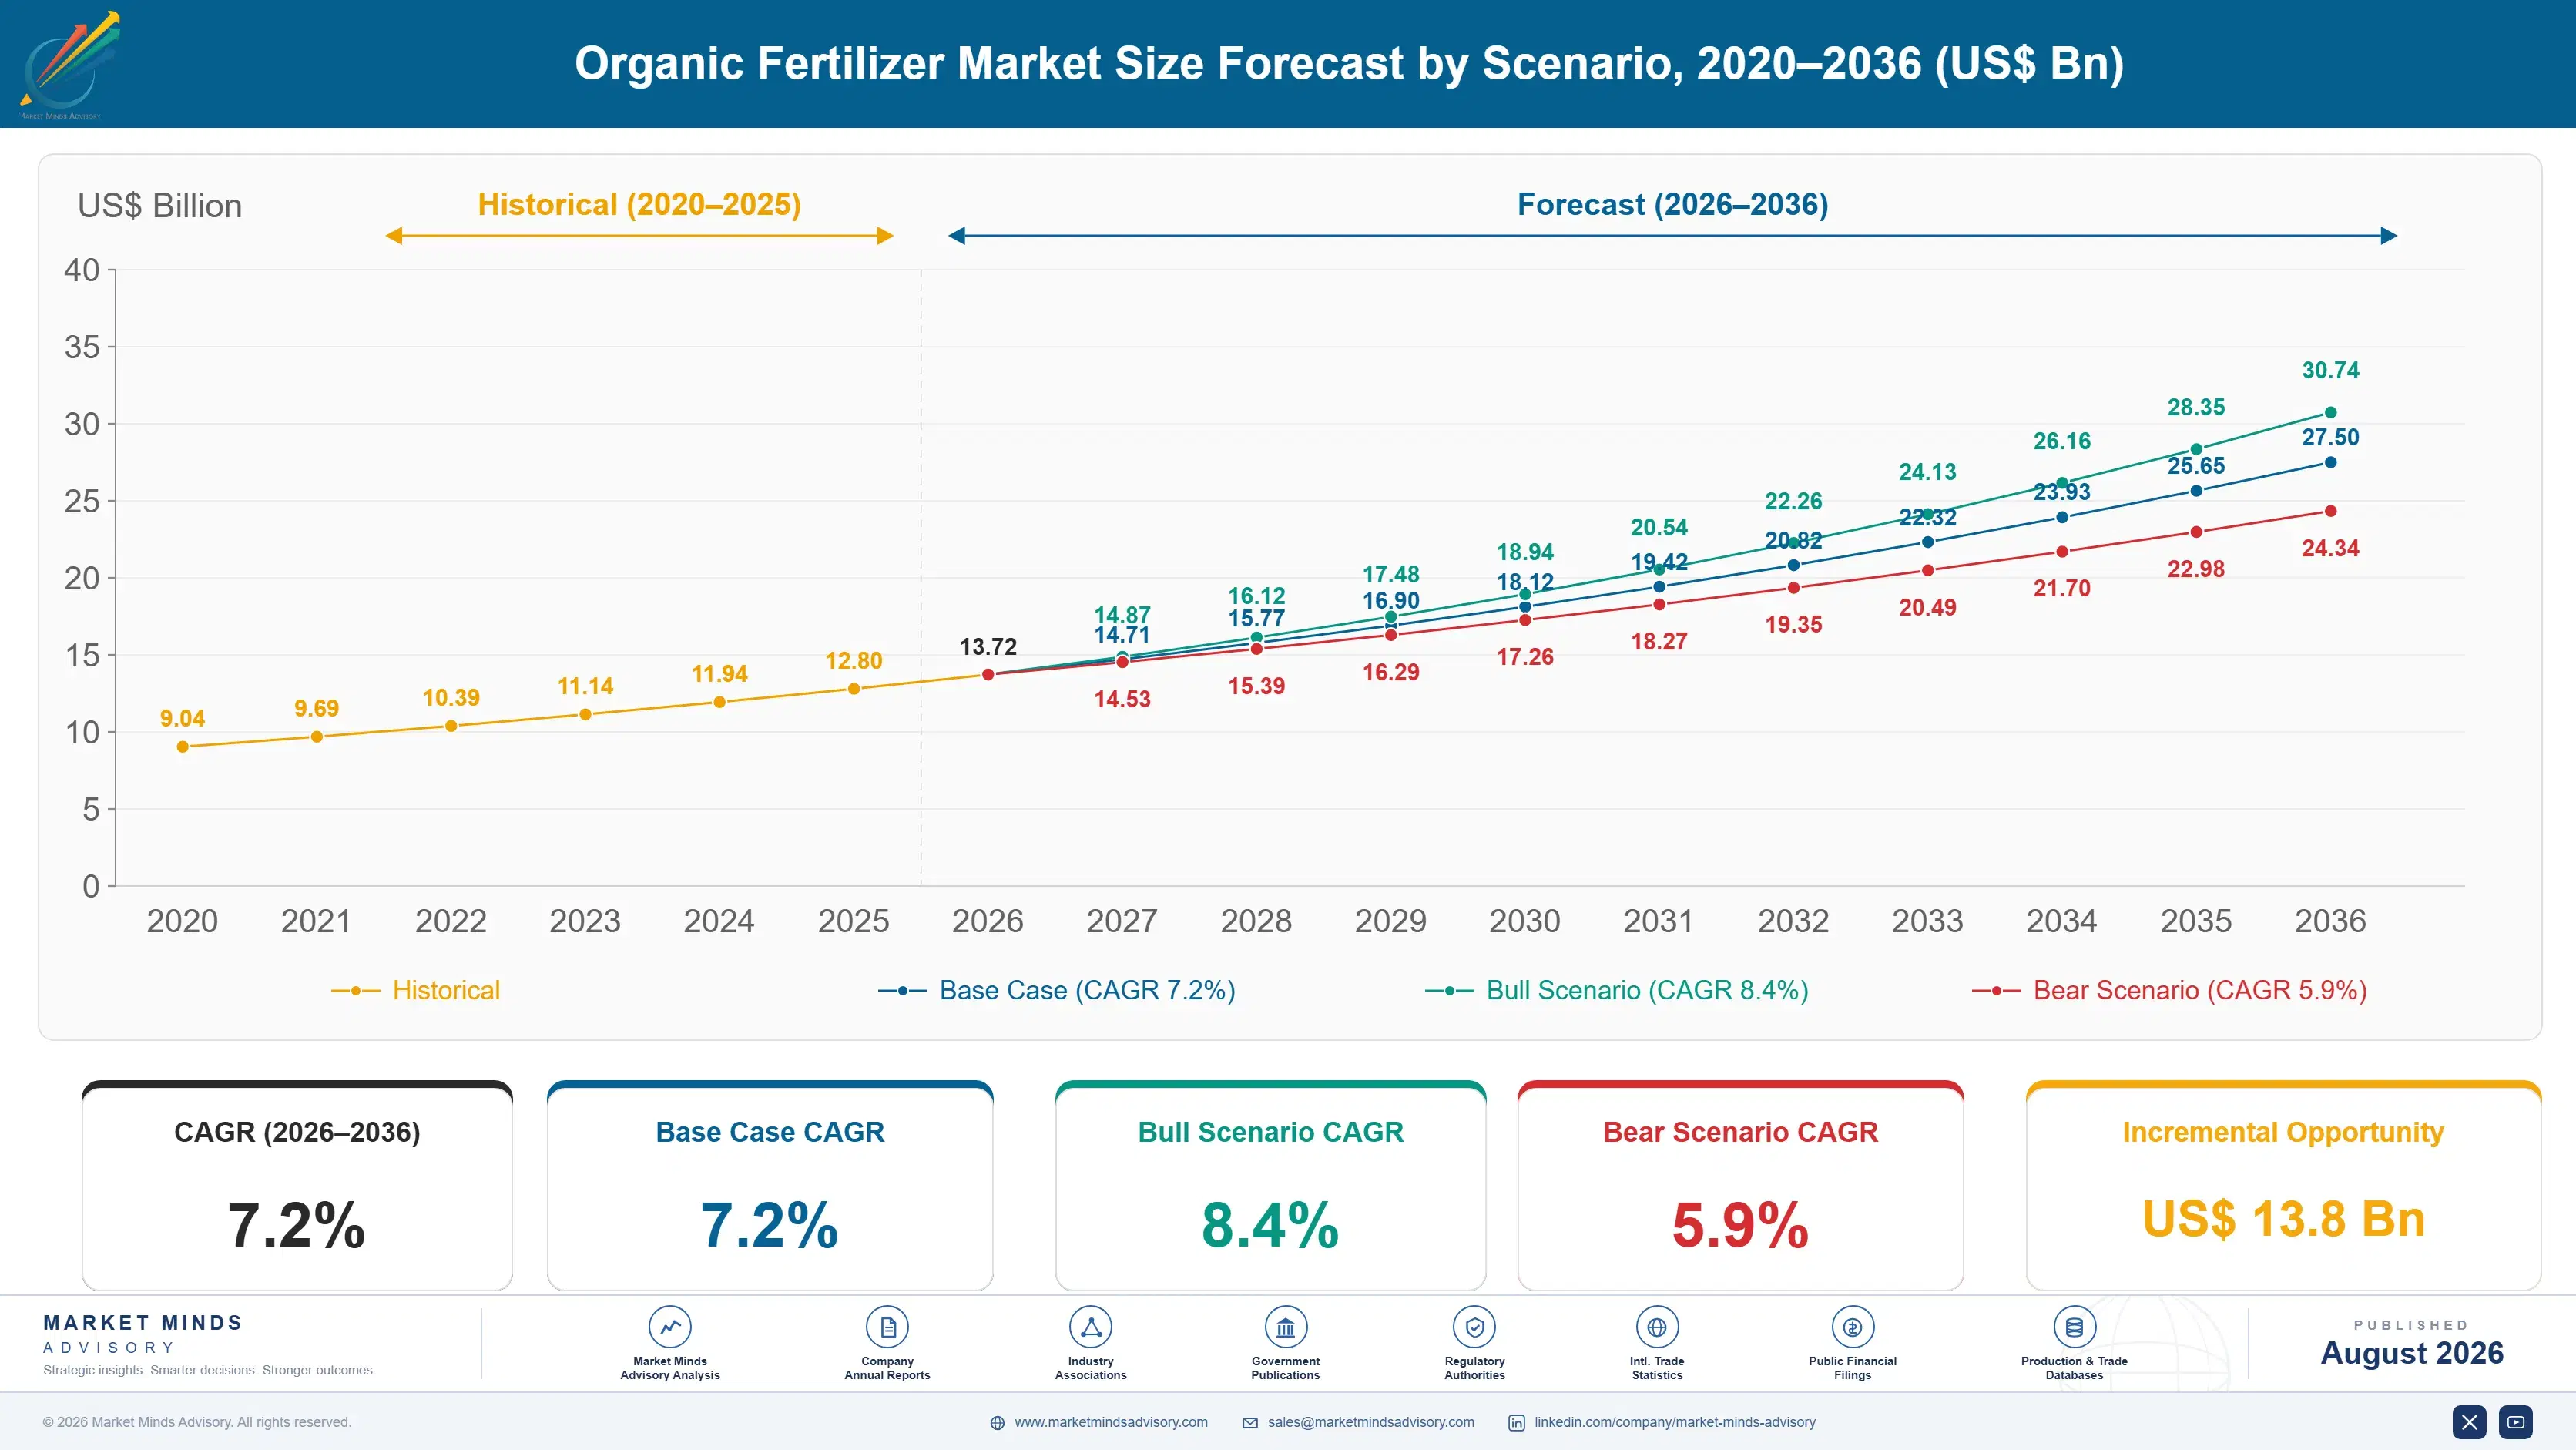
Organic Fertilizer Market Forecast Scenarios

organic-fertilizer-market-size-forecast-scenario-1787324827523
Growth from 2020 to 2025 compounded near 6.4%, accelerating as synthetic fertilizer prices spiked sharply through 2022 and growers facing that volatility looked seriously at organic alternatives for the first time in years of conventional practice. Certification infrastructure expanded meaningfully across the same period, widening the addressable market for premium-priced organic product considerably across every major producing region.
Three mechanisms carry the base case to 7.2%. First, certified organic farmland keeps expanding globally, and every converted hectare needs a compliant nutrition programme synthetic fertilizer cannot legally supply. Second, synthetic fertilizer price volatility keeps pushing conventional growers toward organic alternatives even outside certified acreage, since blended programmes reduce exposure. Third, microbial biofertilizer efficacy keeps improving, closing the yield gap that once limited organic adoption on major row crops specifically.
The bull case at 8.4% assumes synthetic fertilizer prices remain elevated and certified organic farmland expansion accelerates further across major producing regions worldwide over the decade. The bear case at 5.9% assumes synthetic prices normalise meaningfully and growers who adopted organic inputs during the volatility spike revert once conventional alternatives become cheaper again on a sustained basis.

Why Certification Now Decides The Price Premium

Three converging forces set demand now. Certified organic farmland keeps expanding steadily across every major producing region, and every converted hectare needs a compliant nutrition programme synthetic fertilizer cannot legally provide under organic standards. Synthetic fertilizer price volatility keeps pushing conventional growers toward blended organic programmes even outside certified acreage entirely. And microbial biofertilizer efficacy keeps closing the yield gap that once limited organ
MARKET CONCENTRATIONCR5: 22%Highly fragmented supply base of regional and cooperative producers
AVERAGE SELLING PRICEUSD 280 to 620 per tonneBlended pricing across composted, manure, and liquid formats
TOP PRODUCING COUNTRY SHAREChina: 29% of global tonnage outputChinese composting and manure processing scale supplying regional demand
CERTIFIED ACREAGE GROWTH6 to 9% annuallyGlobal certified organic farmland expansion driving addressable demand base
FEEDSTOCK COST SHAREManure and biomass: 28 to 38%Raw feedstock collection and processing costs dominate production expense
APPLICATION FREQUENCY2 to 4 applications per seasonSeasonal reapplication cycle typical across most row crop programmes
The commercial character splits along buyer sophistication almost entirely across the whole value chain. Certified organic growers buy on compliance documentation and consistent nutrient analysis, treating supplier reliability as more important than unit price given how narrow the compliance window runs each growing season. Conventional growers experimenting with organic inputs buy on demonstrated yield performance instead, comparing every product directly against the synthetic alternative they already trust and know works.
The next decade turns on efficacy and traceability together. Suppliers that close the yield gap against synthetic fertilizer on major row crops capture volume no composted product alone could ever reach at comparable scale. Traceability requirements under tightening certification standards are forcing supply chain documentation few smaller producers can afford without meaningful consolidation.
"Everybody assumed organic meant compost and manure, and that assumption is aging badly. The products actually winning share right now are microbial and liquid, priced closer to a specialty input than a bulk soil amendment, and most incumbent producers still have not repositioned for that shift."
Director, Crop Nutrition and Soil Health Practice · MMA Agriculture / Crop Nutri

Market Trends

Certification Standards Tighten Across Major Producing Regions

The USDA National Organic Program, European Union organic regulation, and India's National Programme for Organic Production have all raised documentation and traceability requirements over the past several years, closing loopholes that once let marginal product carry a certified label. Compliance now requires supply chain records tracing feedstock origin through processing to final application, a burden smaller producers increasingly struggle to fund without partnering or consolidating with larger operators. The commercial consequence is a widening gap between certified premium product and commodity organic material that cannot clear the newer documentation bar, even when the underlying nutrient content is genuinely comparable.
Market Impact: Certified farmland grows 4% to 6%
Liquid Biofertilizers Attack Solid Compost From Underneath

Microbial inoculants and liquid concentrates deliver targeted nutrient and biological activity in precise doses that bulky solid compost cannot match, particularly in horticultural and specialty crop applications where application precision drives yield outcomes directly. Rizobacter and Lallemand have both scaled microbial production meaningfully over the past several years, targeting exactly the row crop and horticultural segments where composted product historically dominated by default across most regions. Suppliers with validated liquid formulation capability are capturing share from solid product suppliers who have not yet built comparable production and quality control infrastructure at scale.
Market Impact: Synthetic prices rose over 80%

Market Opportunities and Growth Drivers

Certified Organic Farmland Keeps Expanding Every Year

Global certified organic farmland has grown steadily for over a decade, and every newly converted hectare needs a compliant nutrition programme that synthetic fertilizer cannot legally supply under organic certification standards anywhere. The European Union's Farm to Fork strategy targets a substantial share of agricultural land under organic management by the end of the decade, and similar national programmes across India, Brazil, and China are pushing conversion incentives directly at growers. Each converted hectare represents recurring demand for the life of the certification, not a one-time purchase, which makes farmland conversion the single most durable driver in the category.
Market Impact: Yield gap runs 8% to 15%

Synthetic Fertilizer Price Volatility Pushes Blended Adoption

Synthetic fertilizer prices spiked sharply through 2022 as natural gas costs, a key input to nitrogen production, rose considerably across Europe and elsewhere following supply disruption in the region. Conventional growers facing that volatility looked seriously at organic alternatives for the first time, often blending organic and synthetic inputs rather than converting acreage fully to certified organic production immediately. That blended adoption expanded the addressable market well beyond certified acreage alone, and much of that blended demand has persisted even as synthetic prices have partly normalised since the initial spike.
Market Impact: Transport limits radius to 150 mile

Market Restraints and Challenges

Yield Gap On Major Row Crops Still Limits Adoption

Organic nutrition programmes on major row crops including corn and wheat still trail synthetic fertilizer yield performance in many trial comparisons, particularly during the first several seasons after conversion while soil biology rebuilds. The root cause is that organic nutrient release is slower and less precisely timed to peak crop uptake than synthetic formulations engineered specifically for that purpose. Commercially this keeps large-acreage row crop growers cautious about full conversion despite the price premium available. Suppliers are mitigating the gap through improved microbial formulations and precision application timing research funded jointly with agricultural extension services.
Market Impact: Compliance costs rise 15% to 20%

Feedstock Collection Logistics Constrain Regional Scale

Manure, plant waste, and other organic feedstock are bulky, low value per unit weight, and expensive to transport over any meaningful distance, which keeps most composting and processing operations regional rather than national in scale. The root cause is that feedstock economics simply do not support long-haul transport the way concentrated synthetic fertilizer does. Commercially this fragments the supply base and limits the economies of scale larger producers could otherwise achieve. Producers are mitigating the constraint through regional processing hub networks and increased use of concentrated liquid formats that carry more nutrient value per transported unit.
Market Impact: Liquid segment grows at 10.8%
3 additional market trends, 4 additional growth drivers, and 2 additional restraints and challenges are covered in the full report. Contact sales@marketmindsadvisory.com to access the complete intelligence.

Segment CAGR and Growth Architecture

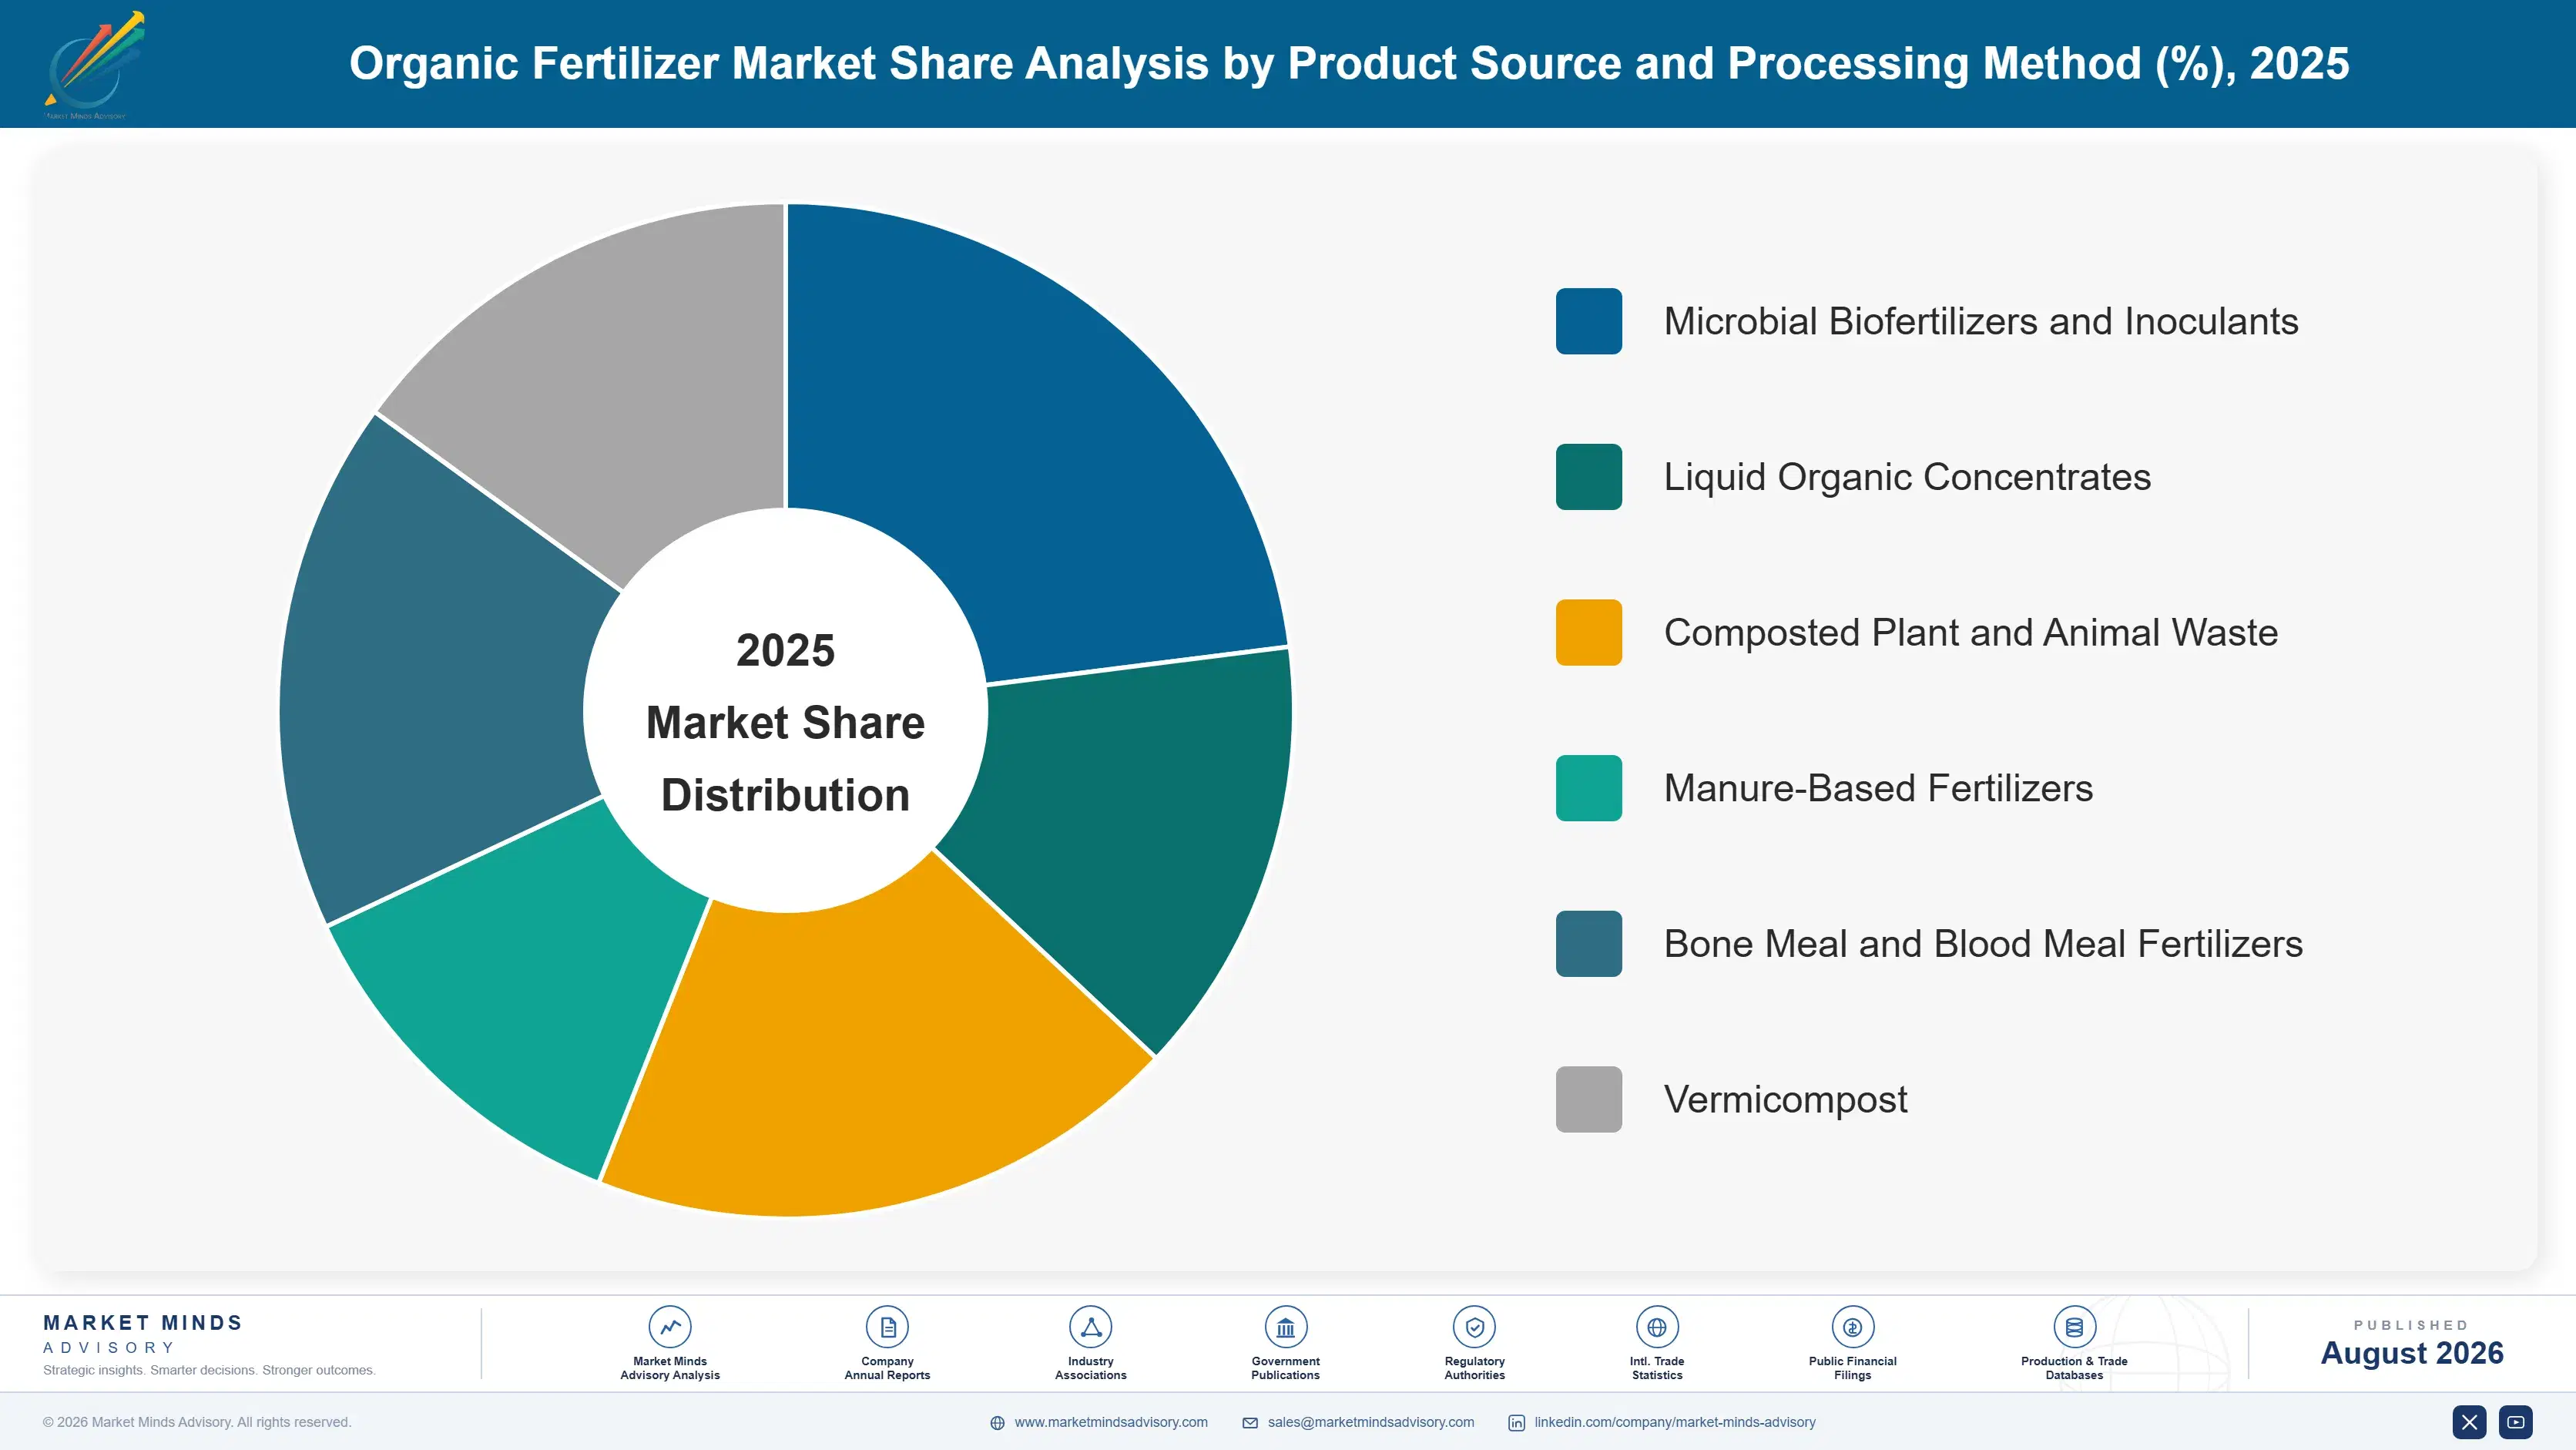
Segmentation follows product source and processing method, a single technical logic describing what the fertilizer is derived from and how it is prepared. Each source carries its own nutrient release profile, application method, and price positioning, so commercial character tracks the product type rather than the crop applied to. End-use crop type and distribution channel appear separately in the framework.
organic-fertilizer-market-market-share-analysis-1787324828487

Microbial Biofertilizers and Inoculants

Microbial biofertilizers and inoculants grow fastest at 12.5%, about 1.74 times the overall 7.2% rate, covering nitrogen-fixing bacteria, mycorrhizal fungi, and phosphate-solubilising microbial strains applied as seed treatments or soil inoculants. Efficacy has improved considerably as strain selection and formulation science both advance, closing the yield gap that once limited adoption on major row crops specifically across most climates. Rizobacter and Lallemand have both scaled production meaningfully, and demand now extends well beyond certified organic acreage into conventional farming seeking input cost reduction through biological nitrogen fixation. Quality control and strain viability through the supply chain separate credible suppliers from the many that entered the category during recent years of rapid growth.
CAGR 12.5%

Liquid Organic Concentrates

Liquid organic concentrates grow second-fastest at 10.8%, including fish emulsion, seaweed and kelp extracts, and compost tea formulations delivering targeted nutrient doses that bulky solid compost cannot match precisely at the plant root during critical growth stages. Horticultural and specialty crop growers value the application precision liquid formats allow, particularly through existing irrigation infrastructure that eliminates the labour cost of spreading solid product manually across every treated acre each growing season. True Organic Products and several dedicated liquid formulators hold strong positions here, though the segment remains considerably more fragmented than biofertilizers given lower capital barriers to entry for many smaller regional producers competing on formulation quality and price together.
CAGR 10.8%
Full segment breakdown across 6 segments available in the complete report.

Regional Architecture and Country Demand Map

Certified farmland conversion and feedstock availability together set this distribution across the seven regions tracked here almost entirely. East Asia and North America lead on processing scale and certified acreage, while share elsewhere tracks conversion incentive strength, feedstock density, and how far domestic certification infrastructure has actually matured.

North America

North America holds 24% of value on well-developed USDA certification infrastructure and a growing base of large-scale composting and manure processing operations across the corn belt and California specifically. Consumer demand for organic produce keeps pulling farmland conversion forward even where yield economics alone would not justify the switch immediately. True Organic Products and Andersons have both scaled composted and blended organic product lines to serve expanding certified acreage across multiple states. Feedstock availability from large dairy and poultry operations gives the region genuine cost advantages most other regions cannot match at comparable scale. Growth of 7.6% tracks certified acreage expansion closely, and blended adoption among conventional growers adds meaningful incremental volume beyond certified demand alone.
Share: 24% | CAGR: 7.6% (2026 to 2036)

Western Europe

Western Europe holds 24% of value, and the European Union's Farm to Fork strategy has pushed member states toward aggressive organic farmland conversion targets that few other regions have matched in ambition or funding. German, French, and Nordic certification standards run stricter than most global equivalents, and compliance documentation requirements have consolidated smaller producers into fewer, larger certified operations over recent years. Composting infrastructure is mature and well distributed, though feedstock costs run higher than in regions with larger livestock operations feeding cheaper manure volume into processing. Growth of 5.8%, the slowest of the seven regions, reflects a maturing organic farmland base and conversion incentive spending that has plateaued somewhat after the initial policy push.
Share: 24% | CAGR: 5.8% (2026 to 2036)
Regional intelligence for 5 additional markets available in the complete report: East Asia, South Asia and Pacific, Latin America, Middle East and Africa, Eastern Europe. Contact sales@marketmindsadvisory.com.
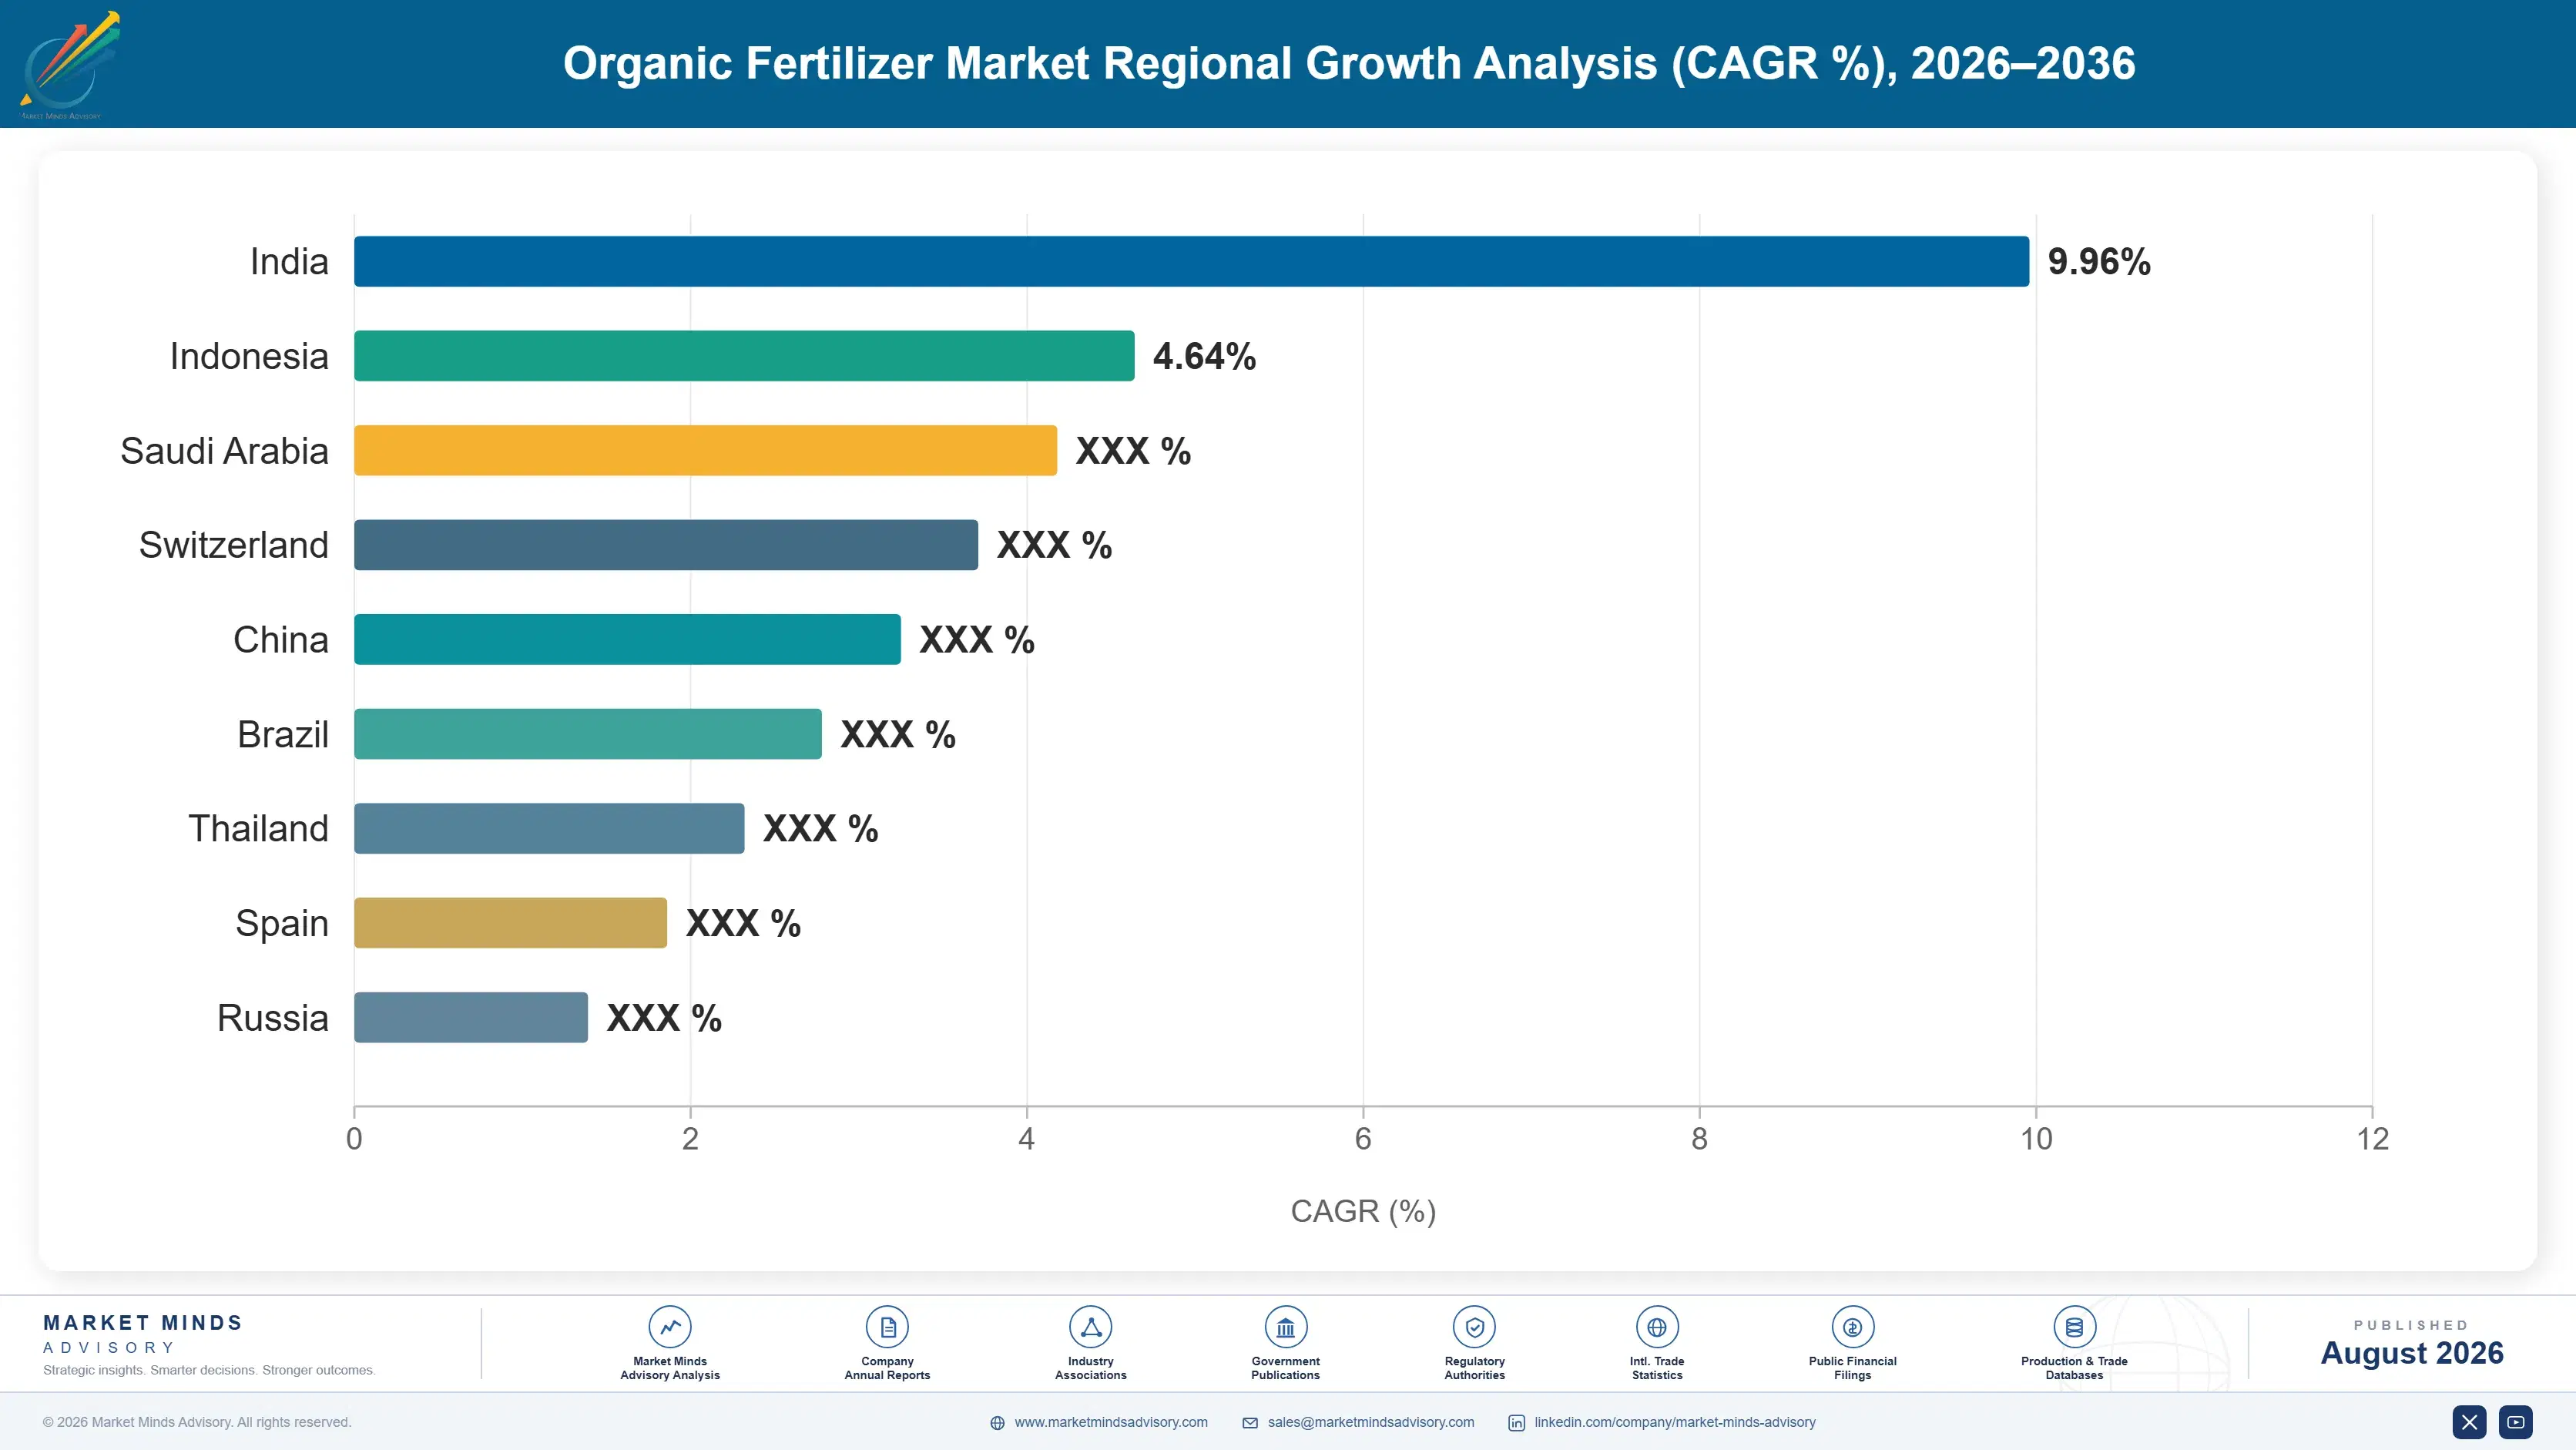
organic-fertilizer-market-country-cagr-analysis-1787324829335

Where Organic Fertilizer Value Actually Concentrates

Selling composted material by the tonne is a race regional producers with cheap feedstock nearby are already winning steadily against distant competitors. The four moves below shift value toward positions a bulk-commodity price comparison cannot easily erode: certification depth, microbial efficacy, liquid formulation capability, and supply chain traceability documentation built ahead of enforcement deadlines.

Build Certification Depth Ahead Of Documentation Rules

Tightening USDA, European Union, and Indian certification standards are closing loopholes that once let marginal product carry a certified label without genuine supply chain documentation behind it. Compliance now requires feedstock origin tracing through processing to final application, a burden costing 15% to 20% more than looser prior standards required of any producer. Suppliers who build that documentation infrastructure ahead of deadlines win shelf space and contracts that undercertified competitors simply cannot supply once buyers actually verify compliance. Waiting until enforcement tightens further leaves a supplier scrambling against a fixed deadline.
Market Impact: Compliance investment now runs 15%

Close The Yield Gap Through Microbial Efficacy

Organic nutrition programmes on major row crops still trail synthetic fertilizer yield by 8% to 15% in many trial comparisons, which keeps large-acreage growers cautious about full conversion despite the price premium available on certified product. Suppliers investing in strain selection and formulation science that closes this gap capture volume no composted product alone could reach, since row crop acreage dwarfs horticultural acreage by a wide margin globally. Rizobacter and Lallemand both demonstrate what sustained investment in this specific capability can achieve commercially. The gap is closing, and the suppliers closing it fastest win the largest addressable volume.
Market Impact: Yield gap of 8% to 15% is closing

Expand Liquid Formulation To Reach Horticultural Buyers

Liquid organic concentrates grow at 10.8% against a market at 7.2%, winning horticultural and specialty crop segments where application precision through existing irrigation infrastructure beats manual spreading of bulky solid compost decisively across every treated acre. That growth gap represents a genuine capability many solid-product suppliers have not yet built, since liquid formulation requires different processing infrastructure and quality control than composting operations use. Suppliers adding liquid product lines capture share from competitors still selling solid-only product into a segment that increasingly prefers precision dosing over bulk volume delivered by the truckload.
Market Impact: Liquid segment outgrows the market

Consolidate Regional Feedstock Into Larger Processing Hubs

Feedstock economics keep most composting operations regional rather than national, since manure and plant waste are bulky and expensive to transport past roughly 150 miles from source to processing facility economically. Consolidating smaller regional operations into larger processing hubs improves both cost efficiency and the documentation consistency tightening certification standards now demand of every participant. Suppliers pursuing this consolidation capture scale economies competitors operating single small facilities cannot match, while also meeting traceability requirements more credibly across one unified operation than a patchwork of independent regional producers ever genuinely could.
Market Impact: Transport economics cap radius near

Who Controls the Margin Pool

Concentration is low: the top five hold roughly 22% of revenue, with thousands of regional composters, cooperatives, and specialised biofertilizer producers competing on quite different terms across a fragmented supply base. The gap between leaders and challengers is formulation science and certification depth rather than manufacturing scale, which remains widely distributed regionally. All participants are assessed on one basis, revenue from certified organic fertilizer products sold to commerc
Competition runs along three lines. First, certification depth, since suppliers with credible traceability documentation win premium shelf space commodity organic material cannot access. Second, formulation science, where microbial and liquid capability increasingly separates leaders from producers still selling undifferentiated bulk compost. Third, feedstock cost position, since regional access to cheap manure or plant waste decides margin on commodity-tier product directly.

Pressure is building from two directions. Microbial specialists including Rizobacter and Lallemand are winning volume from solid compost producers who have not built comparable biological formulation capability internally. Meanwhile tightening certification standards are consolidating smaller regional producers who cannot fund documentation infrastructure into partnerships or acquisition by larger operators. Rankings should favour companies with genuine formulation science and certification depth over those still selling undifferentiated bulk product.
organic-fertilizer-market-company-positioning-matrix-1787324830214

Competitive Moat and Risk Dimensions

COROMANDEL INTERNATIONAL

Moat: Formulation science and product breadth

Coromandel International supplies both composted and specialty organic products across a wide customer base, giving it formulation science and distribution relationships that smaller regional composters struggle to replicate quickly. Its scale across conventional and organic crop nutrition lets it fund research investment most single-category competitors simply cannot match at comparable depth.
COROMANDEL INTERNATIONAL

Risk: Conventional business dilutes focus

A meaningful share of Coromandel's revenue still comes from conventional synthetic fertilizer, so organic-specific investment competes internally against a much larger established business line for capital and management attention. Dedicated organic specialists without that internal competition can move faster on certification and formulation investment specifically targeted at this category.
RIZOBACTER ARGENTINA

Moat: Microbial formulation and strain science

Rizobacter built its business specifically around microbial biofertilizer science rather than as one product line among many, giving it strain selection and formulation depth broader agricultural input suppliers often lack entirely. Close relationships with growers across Latin America gave it validated field performance data competitors are still accumulating.
RIZOBACTER ARGENTINA

Risk: Regional concentration and scale gap

Rizobacter carries meaningful revenue concentration in Latin America, leaving it more exposed than diversified global rivals to any single region's certification policy or currency conditions shifting adversely over time. Its manufacturing scale trails the largest diversified crop nutrition suppliers, limiting capital available for aggressive geographic expansion.

Players Tracked

Prominent Players

Coromandel International
True Organic Products
Rizobacter Argentina
Andersons Inc.
Novozymes

Other Key Players

Lallemand Inc.
Sustane Natural Fertilizer
Agrinos
Symborg
Marrone Bio Innovations
Camson Bio Technologies
T-Bailey Inc.
Multiplex Group
Krishak Bharati Cooperative
National Fertilizers Limited
Biomin Holding
Kiwa Bio-Tech
Italpollina
Verdesian Life Sciences
Grow More Inc.

Recent Developments

APRIL 2025

Rizobacter opens new inoculant plant in Argentina

Rizobacter opened a new microbial inoculant production facility in Argentina, expanding capacity to serve both domestic demand and growing export volume into North American and European markets seeking biological nitrogen fixation alternatives. This was an organic capacity expansion rather than any acquisition, adding supply closer to major growing regions.
Signal: Regional capacity investment tracks where
OCTOBER 2024

Coromandel and research partner accelerate biofertilizer formulation science

Coromandel International entered a joint development agreement with a specialty biofertilizer research partner to accelerate formulation science for row crop applications facing persistent yield gap challenges. This was a joint development agreement rather than an acquisition or equity investment, targeting faster efficacy gains ahead of competitors.
Signal: Formulation science partnerships are becom
FEBRUARY 2025

True Organic Products expands liquid concentrate capacity

True Organic Products expanded liquid concentrate manufacturing capacity to serve growing horticultural and specialty crop demand for precision-dosed organic nutrition delivered through existing irrigation infrastructure across several states. This was organic capacity growth rather than any acquisition or merger, reflecting rising demand from specialty growers nationwide.
Signal: Liquid formulation capacity is increasingl

Feedstock, Processing, And Certification Cost Exposure

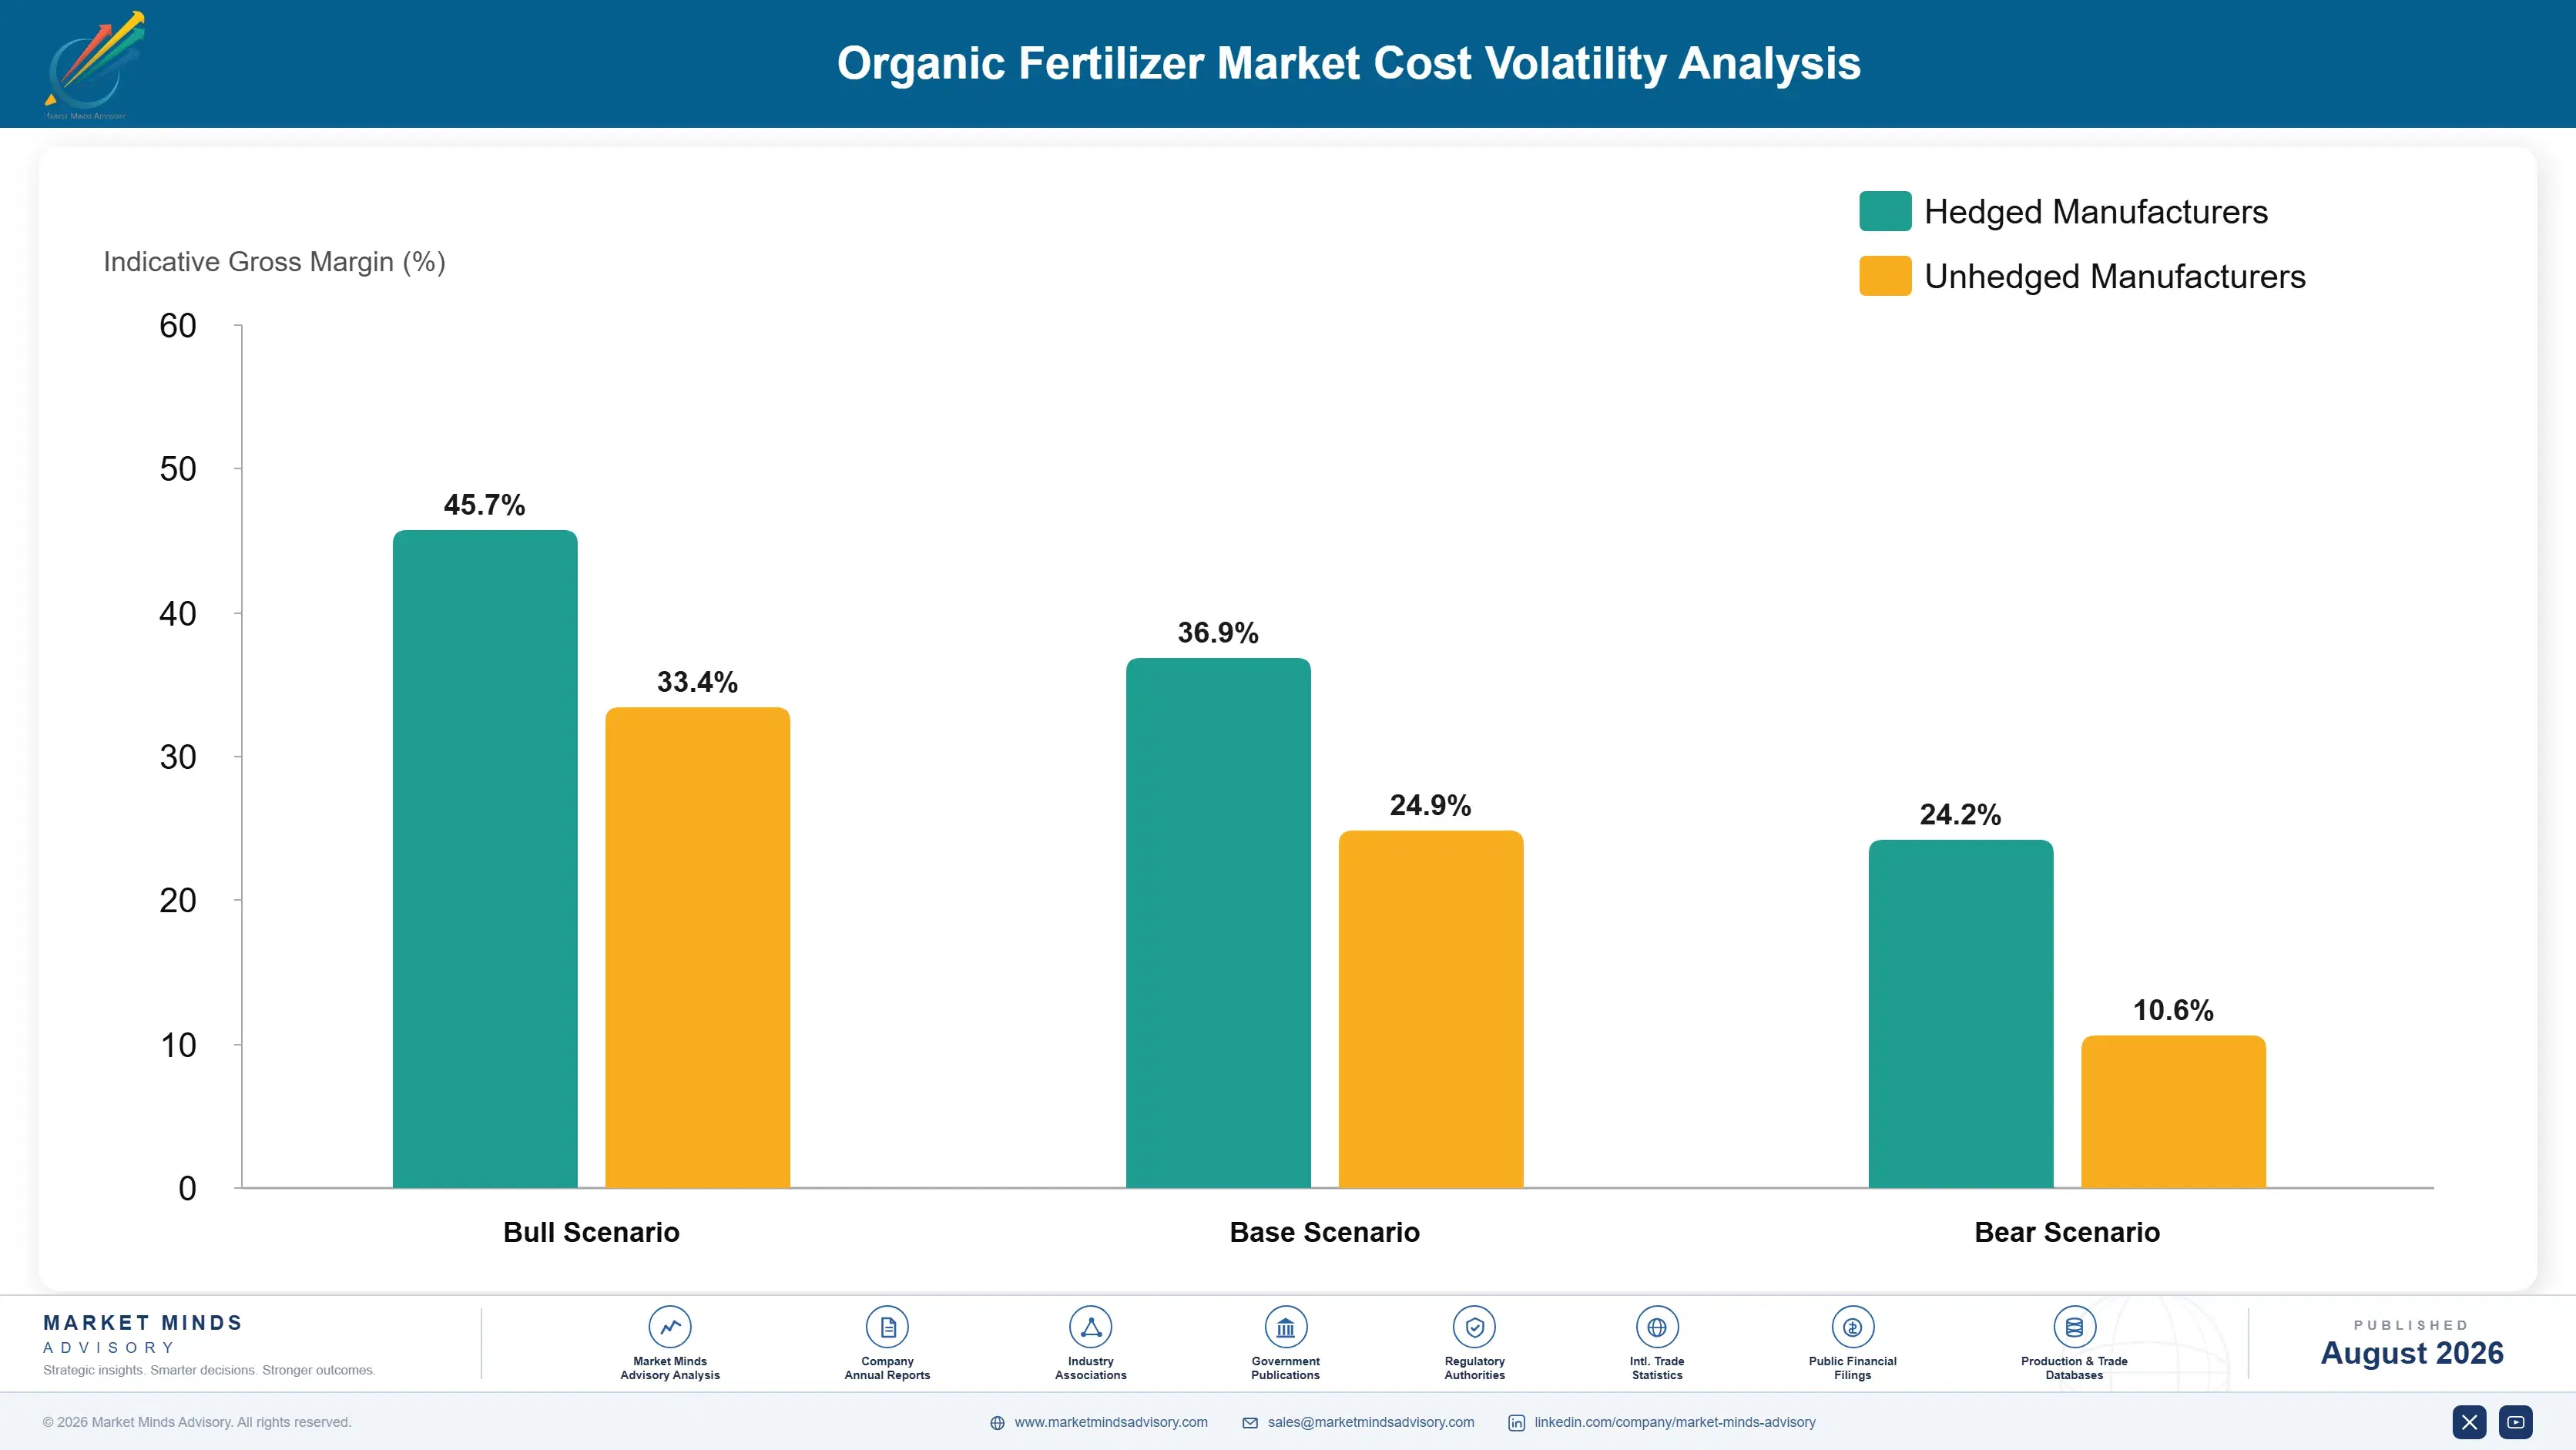
Feedstock, mainly manure and plant waste collection, accounts for roughly 28% to 38% of production cost, sourced from regional livestock operations and agricultural residue. Processing energy for composting and drying adds another 15% to 22%, and certification and compliance documentation now runs 8% to 14% following tightened traceability requirements across major markets. Packaging and logistics make up most of the remainder.
Natural gas prices spiked sharply through 2022 as European supply disruption pushed costs considerably higher across the continent, and organic fertilizer processors relying on gas-fired drying and composting equipment felt that spike directly alongside synthetic fertilizer producers. The IEA recorded European natural gas prices trading multiple times above the prior five-year average at the 2022 peak, and Coromandel's 2022 annual report cited energy cost inflation as a direct margin pressure across its crop nutrition division.

Exposure separates sharply by feedstock proximity and processing scale. Large processors near concentrated livestock operations secure feedstock at minimal transport cost, while smaller regional producers further from supply pay considerably more per tonne collected. Certification documentation cost falls disproportionately on smaller producers too, since compliance infrastructure carries largely fixed cost regardless of production volume processed.
organic-fertilizer-market-cost-volatility-analysis-1787324830513

Secure long-term feedstock contracts with regional livestock operations

Spot market feedstock purchasing exposes processors to seasonal price swings and availability gaps that disrupt production planning considerably during peak demand periods. Long-term supply agreements with regional dairy, poultry, or livestock operations lock in predictable feedstock cost and volume, giving processors planning certainty spot purchasing simply cannot provide during a genuine supply disruption of any real scale.

Invest in energy-efficient composting and drying equipment

Natural gas price volatility hit processors using older, less efficient drying equipment hardest during the 2022 spike, since fuel consumption per tonne processed varied considerably across equipment generations in use. Modern energy-efficient composting and drying systems reduce fuel exposure meaningfully and pay back the capital investment within a few operating seasons for most processors running at reasonable scale.

Build shared certification infrastructure across smaller regional producers

Certification documentation cost falls disproportionately on smaller producers who cannot spread fixed compliance investment across large production volume the way bigger operators can absorb it easily and quickly. Shared certification infrastructure, whether through cooperative arrangements or industry association support, spreads that fixed cost across many smaller participants and keeps them competitive against consolidating larger rivals.

Portfolio Architecture for Margin Defence

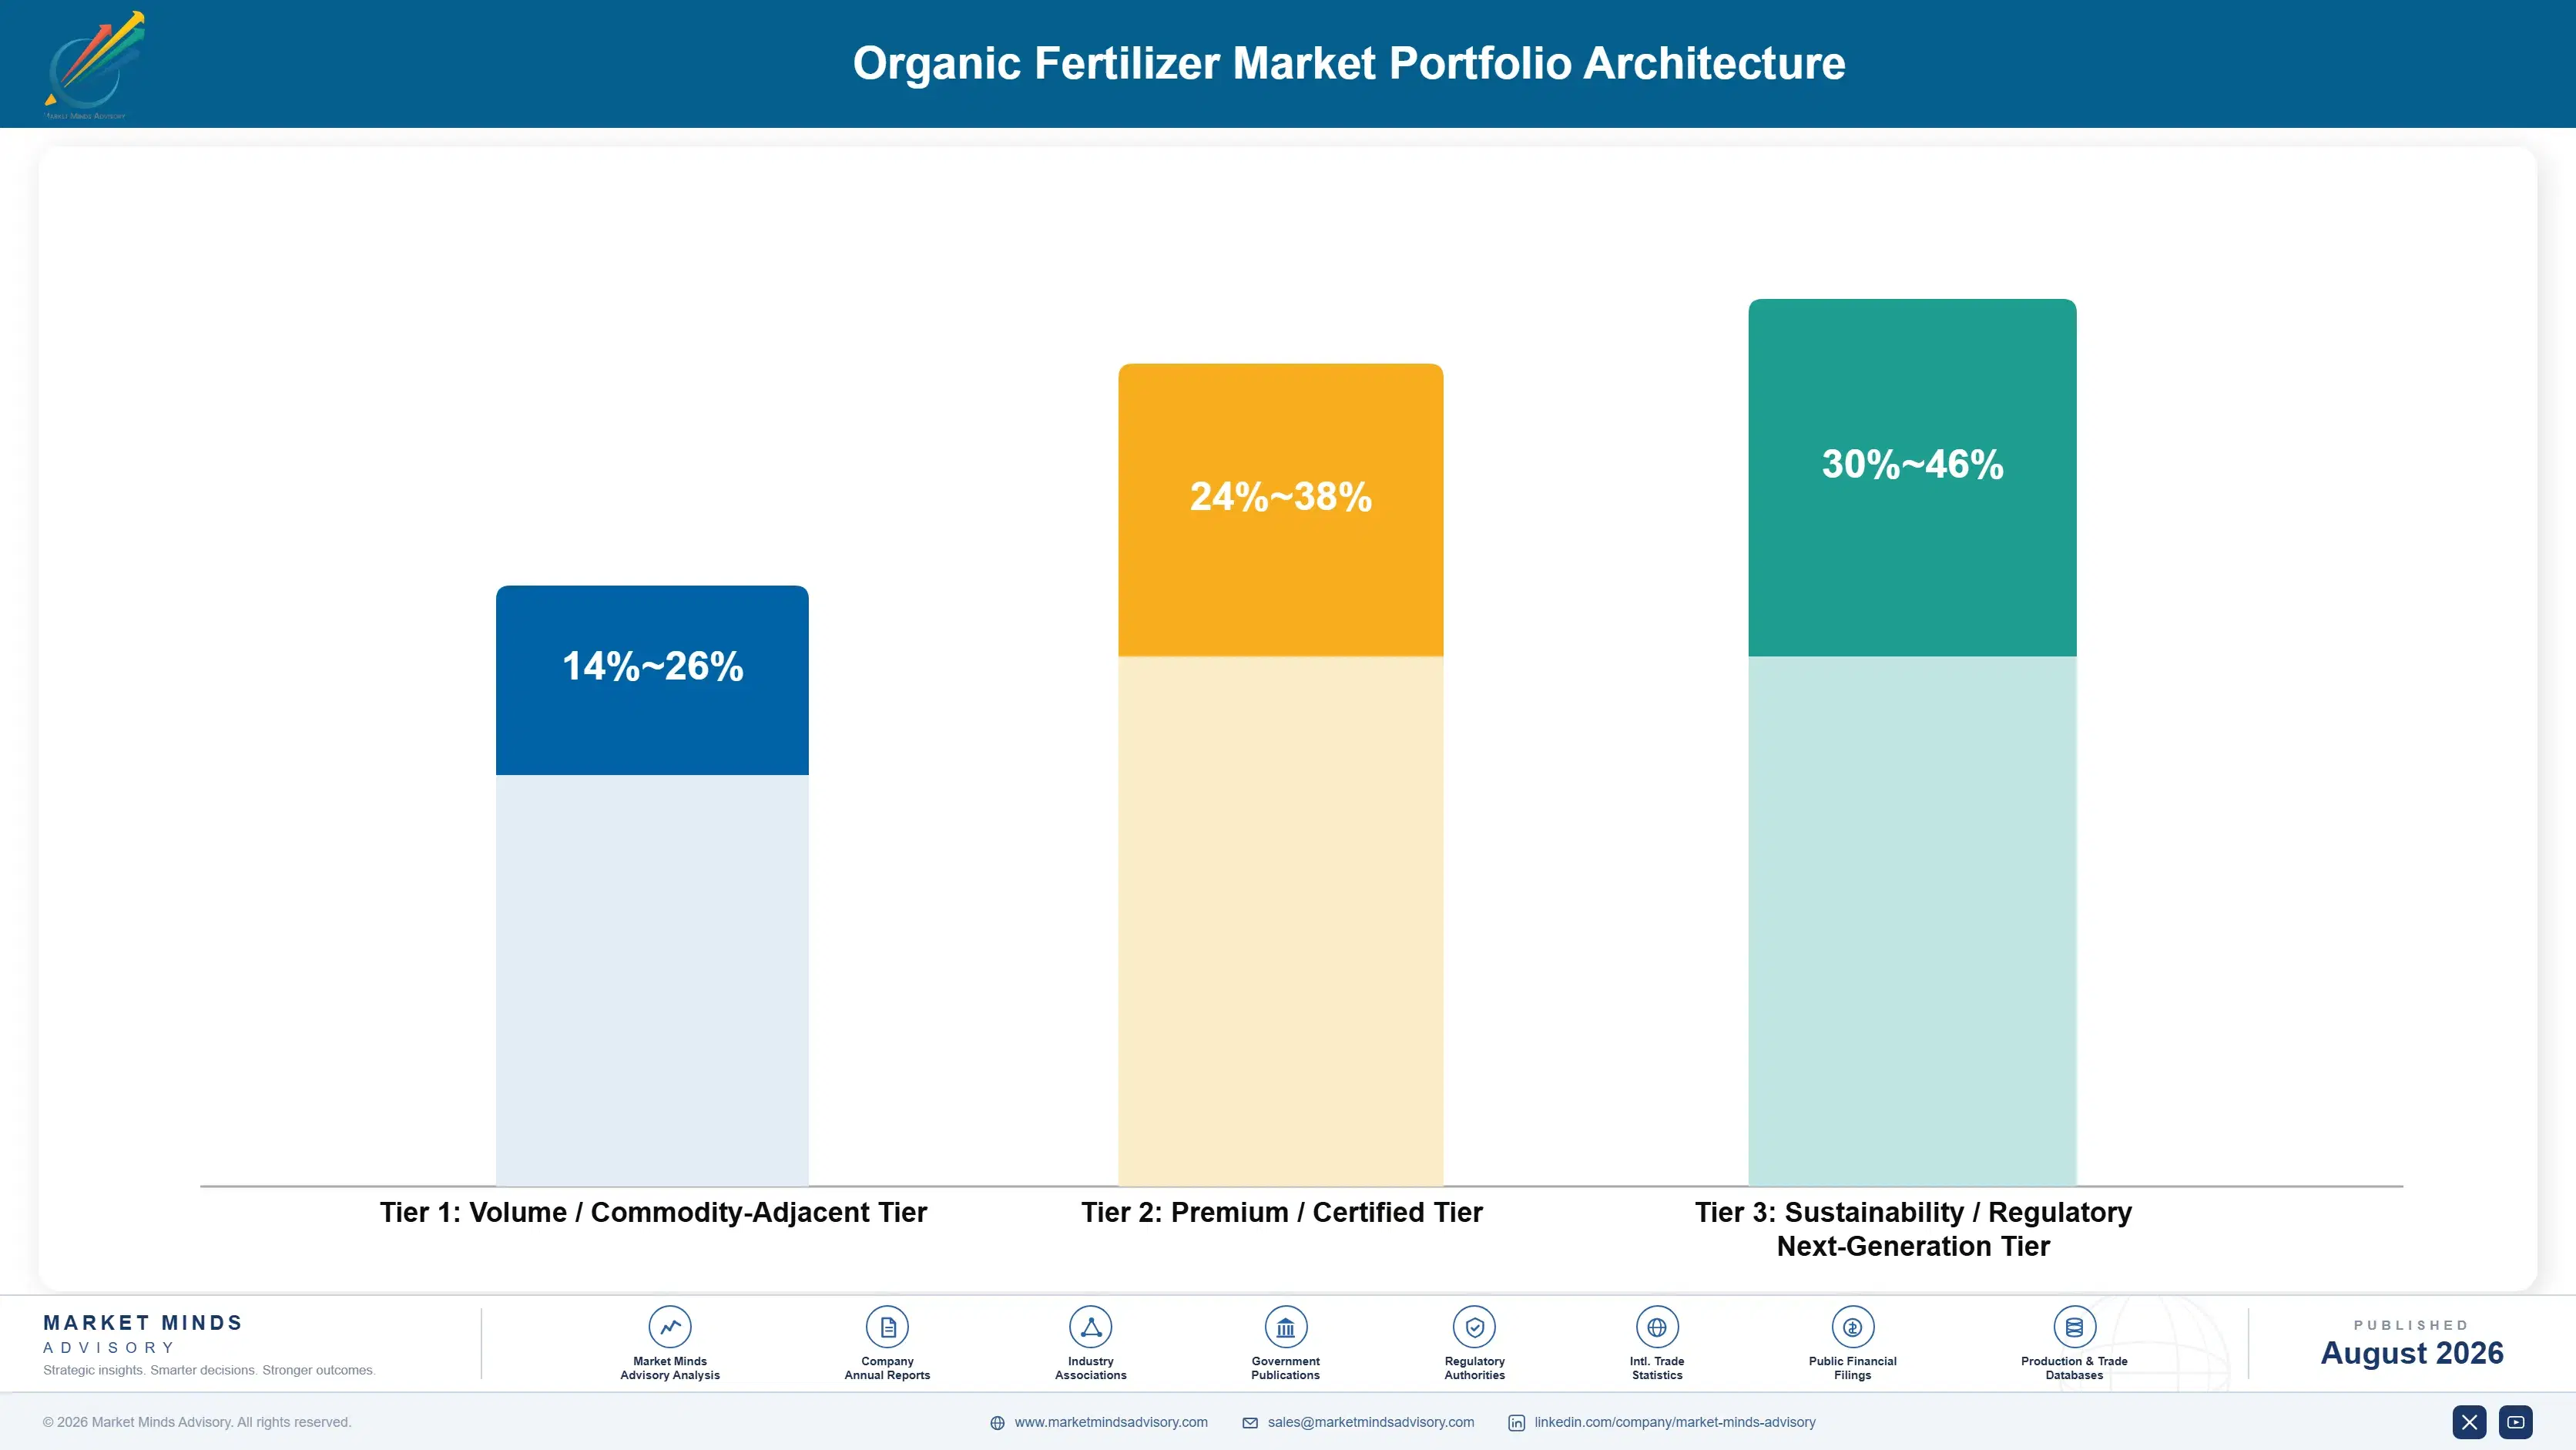
The portfolio splits into three tiers with distinct economics. Commodity composted and manure-based product forms the volume tier, priced by the tonne against every regional competitor with comparable feedstock access nearby, leaving thin margin across the board. Certified premium product with validated nutrient analysis earns considerably more, since certification documentation and consistent quality both resist pure price negotiation between buyer and processor throughout the growing season.
Tension runs between the composted volume business funding today's operations and the microbial and liquid investment that captures tomorrow's growth across every premium segment. A processor defending bulk composted volume too aggressively under-invests in the formulation science premium segments actually demand from every credible supplier now bidding for that business. Yet abandoning volume revenue too early starves the cash flow that funds the very capability build a processor needs simply to compete.

High-value pools concentrate where certification barriers or formulation complexity limit competition meaningfully across the category: microbial biofertilizers with validated strain efficacy, liquid concentrates for horticultural precision application, and certified product carrying full supply chain traceability documentation buyers now require. Commodity compost for undifferentiated bulk sale sits at the other end, competing purely on feedstock cost against every regional producer nearby.

Volume / Commodity-Adjacent Tier

Commodity composted plant and animal waste and manure-based fertilizers sold by the tonne, priced through regional feedstock cost comparison with thin, closely benchmarked margin across every nearby competitor in the same catchment.
Gross Margin: 14-26%

Premium / Certified Tier

Certified premium composted and blended organic product with validated nutrient analysis, where certification depth and supply chain documentation both resist pure price negotiation between buyer and processor across the season.
Gross Margin: 24-38%

Sustainability / Regulatory / Next-Generation Tier

Microbial biofertilizers, liquid concentrates, and fully traceable certified product commanding premium pricing on demonstrated efficacy and compliance readiness that genuinely differentiates one qualified supplier from another during the annual buyer bid.
Gross Margin: 30-46%
organic-fertilizer-market-portfolio-architecture-1787324831012

High-value Sub-segments and Strategic Watch-out

Microbial Biofertilizers and Inoculants

Microbial biofertilizers on row crop and horticultural applications, high-value and fastest-growing at 12.5%, where demonstrated strain efficacy and yield performance both justify premium pricing well above conventional compost margins. Quality control and validation keep new entrants out for years, protecting incumbent margin considerably longer than most categories allow.
Gross Margin: 32-48%

Liquid Organic Concentrates

Liquid organic concentrates, high-value with strong growth at 10.8%, as horticultural and specialty crop growers increasingly prefer precision dosing over bulk composted volume delivered by the truckload each season. Manufacturers of irrigation systems increasingly design compatibility with liquid organic feed lines as standard equipment now.
Gross Margin: 26-40%

Composted Plant and Animal Waste

Composted plant and animal waste, the volume core across most crop types, growing steadily at 6.8% but priced through routine tonne-based negotiation that leaves limited room for margin expansion over time regardless of region. Scale and feedstock proximity, not differentiation, decide who wins this business.
Gross Margin: 14-24%

Bone Meal and Blood Meal Fertilizers

Bone meal and blood meal fertilizers, the strategic watch-out, growing just 4.5% and constrained by limited slaughterhouse byproduct feedstock availability that cannot scale with rising organic farmland demand across major regions. Volume persists mainly in niche specialty applications where alternative nutrient sources remain scarce and costly to source reliably.
Gross Margin: 12-22%

How Organic Nutrition Demand Repeats Yearly

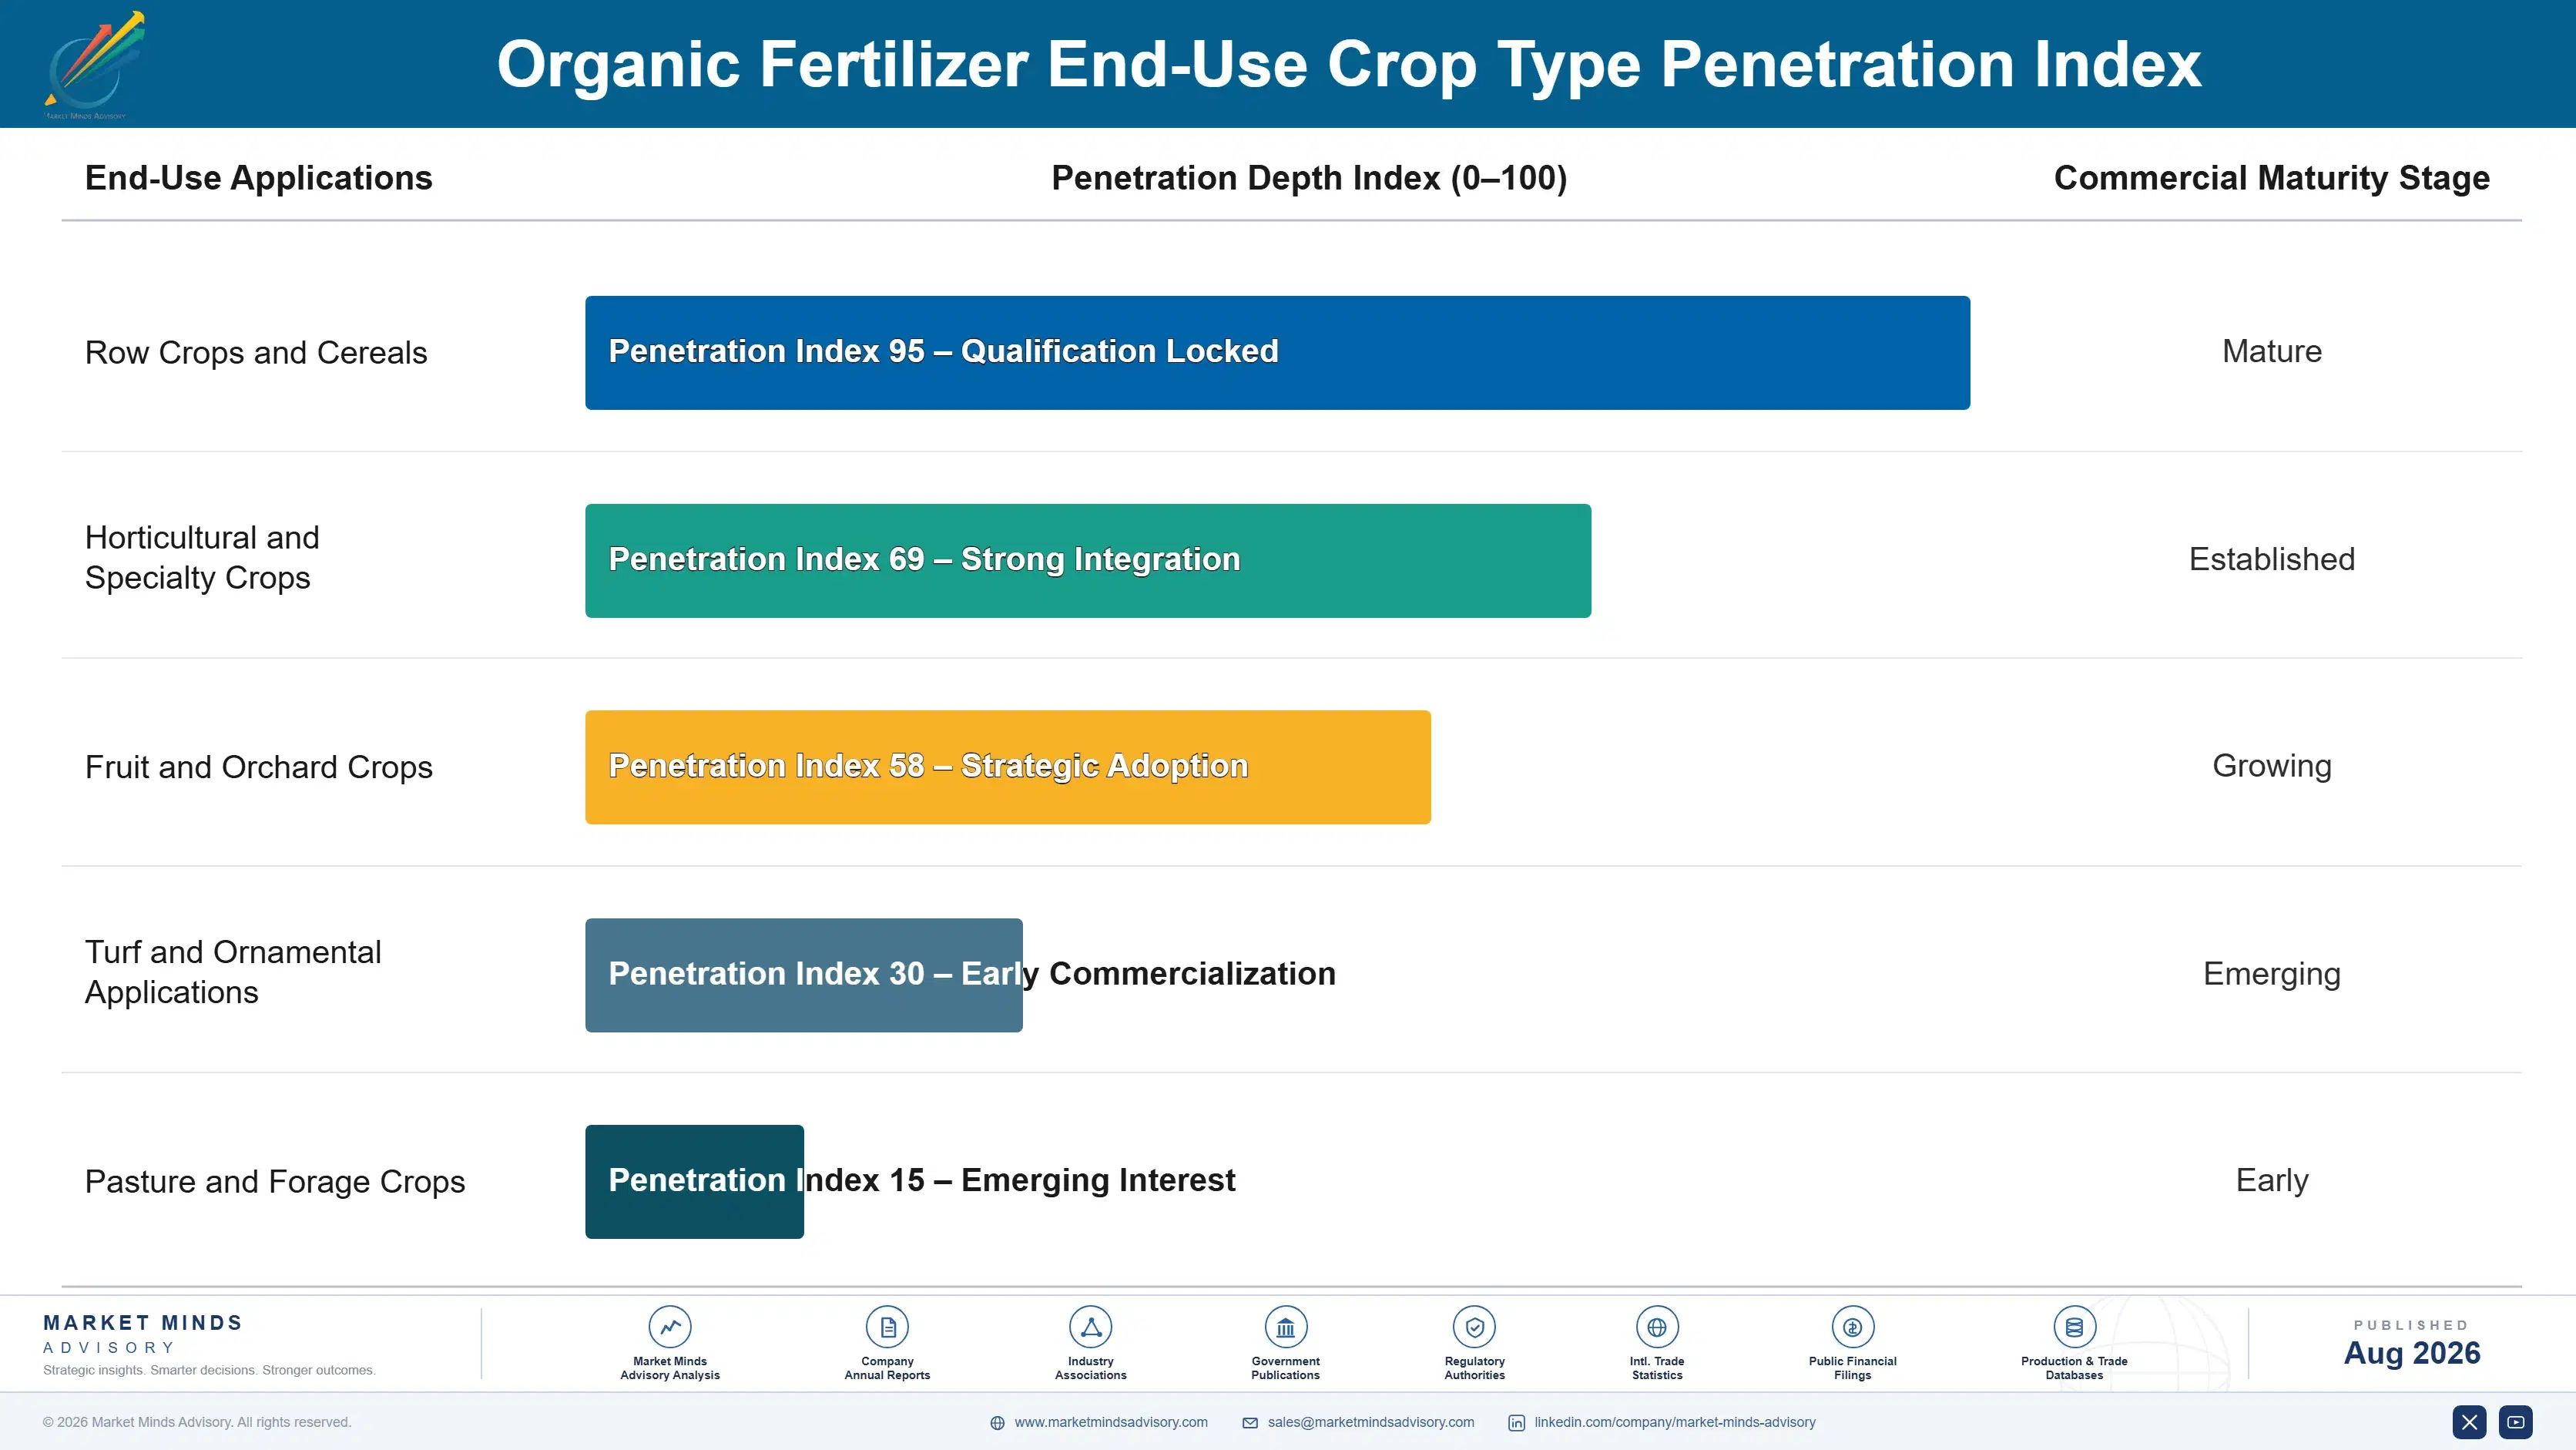
Revenue depends on recurring seasonal application rather than one-time purchase, and a grower's certified acreage generates repeat demand for the entire duration of certification, typically renewed annually across the growing season. A supplier winning a certified grower relationship captures that recurring volume for years, while losing the relationship to a competitor means lost revenue across every future season the grower remains certified.
Adoption depth varies sharply by crop type. Horticultural and specialty crop growers adopt liquid and microbial product first, since margin per acre justifies the premium pricing these formats command over bulk compost readily. Row crop growers follow with a meaningful lag as efficacy improves and cost per acre falls enough to justify conversion. Smallholder farmers in developing regions retain manure-based and composted product largely unchanged, since feedstock is often available locally at minimal cost.

Buyer profiles have shifted from pure input procurement toward agronomic advisory relationships where suppliers increasingly provide application guidance alongside the product itself rather than selling tonnage alone. Younger farm operators increasingly treat organic nutrition as a differentiated input category worth researching directly, which favours suppliers with genuine formulation science and demonstrated field data over pure commodity compost sellers.
organic-fertilizer-market-end-use-penetration-index-1787324831501

Our Read On Organic Crop Nutrition

These are among the four positions where our research anticipates prominent divergence between winners and laggards over the coming forecast period. Each is grounded in the demand model, the regulatory perimeter, and the announced capacity pipeline.
01 / CERTIFICATION SETS THE PREMIUM

Documentation depth now decides who captures pricing power

Tightening USDA, European Union, and Indian certification standards are closing loopholes that once let marginal product carry a certified label without genuine supply chain documentation behind it at all. Compliance now costs 15% to 20% more than looser prior standards required of any producer in the category, and suppliers who build that documentation infrastructure ahead of deadlines win shelf space undercertified competitors simply cannot supply once buyers actually verify compliance directly. Producers should invest in traceability now, since enforcement only tightens further from here.
02 / MICROBIAL EFFICACY CLOSES GAPS

Yield performance, not price, decides row crop conversion

Organic nutrition programmes on major row crops still trail synthetic fertilizer yield by 8% to 15% in many trial comparisons, which keeps large-acreage growers cautious about full conversion despite the available price premium on certified product. Suppliers investing in strain selection and formulation science that closes this gap capture volume no composted product alone could ever reach, since row crop acreage dwarfs horticultural acreage globally by a wide margin still growing. Rizobacter and Lallemand both demonstrate what sustained investment achieves commercially here.
03 / LIQUID FORMATS WIN PRECISION

Irrigation-compatible dosing beats manual spreading decisively

Liquid organic concentrates grow at 10.8% against a market at 7.2%, winning horticultural and specialty crop segments where application precision through existing irrigation infrastructure beats manual spreading of bulky solid compost across every treated acre each growing season. That growth gap represents a genuine capability many solid-product suppliers have not yet built, since liquid formulation requires different processing and quality control infrastructure than composting operations use today. Suppliers should add liquid product lines before competitors capture the horticultural segment entirely first.
04 / FEEDSTOCK PROXIMITY LIMITS SCALE

Transport economics keep this category stubbornly regional

Manure and plant waste are bulky and expensive to transport past roughly 150 miles from source to processing facility, which keeps most composting operations regional rather than national in scale even as demand grows steadily. That fragments the supply base considerably and limits the economies of scale larger producers could otherwise achieve across a wider footprint. Suppliers should pursue regional processing hub consolidation and concentrated liquid formats that carry more nutrient value per transported unit than bulky solid compost ever could.

Engagement Snapshot From the Field

A live engagement with an industry participant carrying material or product regulatory and market exposure ahead of a defining policy shift, showing how our research translates into a defensible multi-year portfolio strategy.
MARKET MINDS ADVISORY · CLIENT ENGAGEMENT SUMMARY
Organic Fertilizer Producer Strategic Portfolio Review and Transition Roadmap 2026·Investment Scenario on Organic Fertilizer Exposure Evaluation 2025-26
CLIENT PROFILE
A regional composted organic fertilizer processor with an established manure-based product line engaged MMA as synthetic fertilizer price volatility drove new conventional grower interest beyond its traditional certified organic customer base. The client reported annual revenue near USD 85 million, with roughly 82% tied to bulk composted product and no liquid or microbial formulation capability in its current portfolio (client-reported, unverified by MMA).
STRATEGIC CHALLENGE
Sales leadership wanted to expand volume by lowering price to attract new conventional growers, competing purely on tonnage cost against every nearby regional composter with comparable feedstock access. Operations leadership worried this strategy would simply compress margin further without building any durable differentiation the client could defend once competitors matched the lower pricing.
MMA APPROACH
MMA benchmarked the client's formulation capability against where category growth was actually concentrating, rather than against the price-led volume expansion sales leadership had already proposed internally. We modelled revenue and margin outcomes under both a price-led volume strategy and a liquid concentrate product line requiring new processing investment the client did not yet have in place.
KEY FINDINGS
  1. A price-led volume strategy carried an estimated 18% margin compression within two seasons as nearby competitors matched pricing quickly across the whole region.
  2. Developing liquid concentrate production capability required roughly nine months and USD 4 million in dedicated processing investment and staff training (client-reported, unverified by MMA).
  3. Liquid product commanded pricing roughly 2.4 times bulk composted product per nutrient-equivalent unit sold into premium horticultural accounts across the whole territory.
  4. Three nearby horticultural buyers expressed explicit interest in liquid product the client's existing solid-only product line could never actually supply at all.
CLIENT PROFILE
A regional composted organic fertilizer processor with an established manure-based product line engaged MMA as synthetic fertilizer price volatility drove new conventional grower interest beyond its traditional certified organic customer base. The client reported annual revenue near USD 85 million, with roughly 82% tied to bulk composted product and no liquid or microbial formulation capability in its current portfolio (client-reported, unverified by MMA).
STRATEGIC CHALLENGE
Sales leadership wanted to expand volume by lowering price to attract new conventional growers, competing purely on tonnage cost against every nearby regional composter with comparable feedstock access. Operations leadership worried this strategy would simply compress margin further without building any durable differentiation the client could defend once competitors matched the lower pricing.
MMA APPROACH
MMA benchmarked the client's formulation capability against where category growth was actually concentrating, rather than against the price-led volume expansion sales leadership had already proposed internally. We modelled revenue and margin outcomes under both a price-led volume strategy and a liquid concentrate product line requiring new processing investment the client did not yet have in place.
KEY FINDINGS
  1. A price-led volume strategy carried an estimated 18% margin compression within two seasons as nearby competitors matched pricing quickly across the whole region.
  2. Developing liquid concentrate production capability required roughly nine months and USD 4 million in dedicated processing investment and staff training (client-reported, unverified by MMA).
  3. Liquid product commanded pricing roughly 2.4 times bulk composted product per nutrient-equivalent unit sold into premium horticultural accounts across the whole territory.
  4. Three nearby horticultural buyers expressed explicit interest in liquid product the client's existing solid-only product line could never actually supply at all.
RECOMMENDED STRATEGY
Phase 1: Phase 1 (0 to 3 months): Halt the price-led volume expansion and redirect capital toward liquid concentrate development work immediately. Phase 2: Phase 2 (3 to 9 months): Build liquid processing capacity and secure initial horticultural buyer commitments ahead of full-scale launch. Phase 3: Phase 3 (9 to 15 months): Launch the liquid product line at premium pricing while retaining the composted line for volume customers.
OUTCOME
The client abandoned the price-led volume strategy and launched a liquid concentrate line instead, securing three horticultural accounts within the first season at pricing roughly 2.4 times its composted product. Blended margin improved measurably as liquid volume scaled, offsetting continued thin margin on the legacy composted business (client-reported, unverified by MMA).

Frequently Asked Questions

Foundational context covering the market sizes, CAGR, scope, country, region and competition that inform every finding below. This section is provided to cover basics and most often pre-purchase conversations, answered from the MMA Primary Research Dataset.

What is the current size of the Organic Fertilizer Market?

The global organic fertilizer market is valued at USD 12.8 billion in 2025, covering composted, manure-based, liquid, and microbial products meeting organic certification standards. Synthetic fertilizers are excluded from this figure.

How large will the Organic Fertilizer Market be by 2036?

The market is forecast to reach USD 27.5 billion by 2036 in the base case, about 2.0 times the 2026 level. That represents incremental value of roughly USD 13.78 billion across the decade.

What is the CAGR for the Organic Fertilizer Market 2026 to 2036?

The market grows at a 7.2% CAGR in the base case, with bull and bear scenarios at 8.4% and 5.9%. The spread turns mainly on synthetic fertilizer price trends and certified farmland conversion pace.

Which segment is growing fastest?

Microbial biofertilizers and inoculants grow fastest at 12.5%, about 1.74 times the overall rate, as growers seek efficacy synthetic-adjacent alternatives can genuinely match. Liquid concentrates follow at 10.8%.

Who are the major companies in the Organic Fertilizer Market?

Leading companies include Coromandel International, True Organic Products, Rizobacter Argentina, Andersons Inc., and Novozymes. Concentration is low, with the top five holding roughly 22% of revenue across a fragmented base.

Which country is growing fastest?

India grows fastest at an 11.5% CAGR, as domestic biofertilizer subsidy programmes and export demand for certified organic produce pull conversion forward. China follows on domestic organic farming expansion.

Report Segmentation Architecture

The full report scope spans multiple orthogonal segmentation dimensions, with cross-tabulated demand data provided for each dimension pair. Coverage extends further to regional breakdowns, trend trajectories, and the competitive detail needed to support segment-level decision-making.

By Product Source and Processing Method

  • Microbial Biofertilizers and Inoculants
  • Liquid Organic Concentrates
  • Composted Plant and Animal Waste
  • Manure-Based Fertilizers
  • Bone Meal and Blood Meal Fertilizers
  • Vermicompost

By End-Use Crop Type

  • Row Crops and Cereals
  • Horticultural and Specialty Crops
  • Fruit and Orchard Crops
  • Turf and Ornamental Applications
  • Pasture and Forage Crops

By Commercial Dimension

  • Certified Organic Farm Sourcing
  • Blended Conventional Farm Sourcing
  • Cooperative and Direct Distribution
  • Retail and Garden Centre Channel

By Region

  • North America
  • Western Europe
  • East Asia
  • South Asia and Pacific
  • Latin America
  • Middle East and Africa
  • Eastern Europe

Scope, Methodology, and Coverage

Every figure in this report is reproducible from documented input assumptions. The scope below maps the historical period, the forecast horizon, the segmentation dimensions, and the countries covered, alongside the underlying primary and qualitative methodology.
Historical Period
2020 to 2025
Forecast Period
2026 to 2036
Base Year
2025 (USD billions; MMA Primary Research Dataset, August 2026)
Market Definition
The organic fertilizer market comprises crop nutrition products derived from plant, animal, or microbial sources meeting recognised organic certification standards, valued at manufacturer net revenue. It spans composted plant and animal waste, manure-based fertilizers, bone and blood meal, vermicompost, liquid organic concentrates, and microbial biofertilizers applied across row crop, horticultural, and specialty crop production. Synthetic fertilizers, biostimulants sold for purposes other than nutrition, and soil amendments without nutrient content are excluded.
Quantitative Units
USD billions (current prices); tonnage volume where applicable
Segmentation Dimensions
By Product Source and Processing Method; By End-Use Crop Type; By Commercial Dimension; By Region
Regions Covered
North America, Western Europe, East Asia, South Asia and Pacific, Latin America, Middle East and Africa, Eastern Europe
Countries Covered
USA, China, Germany, France, UK, Japan, South Korea, India, Australia, Canada, Brazil, Mexico, Indonesia, Vietnam, Thailand, Malaysia, UAE, Saudi Arabia, South Africa, Nigeria, Turkey, Poland, Netherlands, Italy, Spain, Sweden, Switzerland, Argentina, Colombia, Singapore, and additional markets relevant to this sector
Key Companies Profiled
Coromandel International, True Organic Products, Rizobacter Argentina, Andersons Inc., Novozymes, Lallemand Inc., Sustane Natural Fertilizer, Agrinos, Symborg, Marrone Bio Innovations, Camson Bio Technologies, T-Bailey Inc., Multiplex Group, Krishak Bharati Cooperative, National Fertilizers Limited, Biomin Holding, Kiwa Bio-Tech, Italpollina, Verdesian Life Sciences, Grow More Inc.
Quantitative Methodology
Primary survey, n=3,800 respondents, Q4 2025, six countries; demand-side model with trade association cross-validation
Qualitative Methodology
47 expert interviews, Q4 2025; applied to validate demand model assumptions, identify emerging dynamics, and assess competitive positioning
Report Format
PDF and XLSX data workbook (Word format preview document)
Publisher
Market Minds Advisory
Report Code
MMA-2026-AGR-102
Published
August 2026
Contact
sales@marketmindsadvisory.com | www.marketmindsadvisory.com

Purchase the full Organic Fertilizer Market Report (2026 to 2036).

The full MMA Organic Fertilizer report sizes the market across six product sources, five crop types, four commercial dimensions, and seven regions through 2036. It profiles 20 companies on a consistent revenue basis, scoring each on certification depth, formulation science, and feedstock cost position. Scenario models quantify how certified farmland conversion, synthetic fertilizer price volatility, and microbial efficacy gains move addressable demand by product category. The report also includes feedstock cost benchmarking, certification compliance timeline tracking, and regional processing capacity assessment for commercial and product strategy teams.
Six-source and four-channel market sizing to 2036
Twenty-company benchmark on consistent organic revenue basis
Certification compliance timeline tracking across major regulated markets
Feedstock cost benchmarking against natural gas volatility events
Yield gap analysis by crop type and formulation category
Regional processing capacity assessment for product strategy teams

Built For The People Who Decide

From boardroom strategy to bench-side execution, this report is read cover-to-cover by leaders shaping the next decade of their industry, turning demand scenarios, market dynamics and valuation benchmarks into decisions.
CXOs/ Presidents/ VPs/ Managers
M&A and Corporate Development
Strategy Teams and R&D Heads
Procurement and Product Directors
Regulatory and Compliance Leaders
Investor Relations and Equity Analysts