Market Minds Advisory
Optical Time-Domain Reflectometer Market

Optical Time-Domain Reflectometer Market: OTDR Market. Cloud-Connected Fiber Analytics Redraws Network Test Standards

Expanding fiber-to-the-home network buildout, tightening fiber network certification requirements, growing cloud-connected fiber analytics adoption, and rising specialized optoelectronic component cost pressure are reshaping OTDR priorities across network operators worldwide this decade.

Lead Analyst

Published

September 2026

Make Smarter Decisions with Customized Research Insights

Request a free sample report and evaluate market opportunities, growth trends, and competitive dynamics relevant to your business needs.

2025 MARKET VALUE$0.7BMarket Size 2025
2036 FORECAST VALUE$1.5BBase Case , 2026 to 2036
CAGR 2026 TO 20367.2 %Bull 8.4% / Bear 6.0%
INCREMENTAL OPPORTUNITY$0.7BNet 10- year value creation
EXPANSION MULTIPLE2.00x2036 value over 2026 base
Strategic Levers
M&A Pipeline
Regional Outlook
Country Rankings
Competitive Intelligence
Segmental Deep-dive
Call-Us : 91 93563 13602

Executive Snapshot and Market Trajectory.

Cloud-connected OTDR software and analytics demand is pulling category growth well ahead of conventional handheld test instruments, as network operators increasingly demand centralized, remotely monitored fiber diagnostic architecture across major fiber-to-the-home buildout programs worldwide, reshaping capital allocation each deployment cycle overall consistently across most operator segments today.
Cloud-connected analytics and automated fiber monitoring adoption are accelerating growth across fiber-to-the-home and 5G backhaul channels, while conventional handheld test instruments sustain steady baseline demand across established field technician fleets. Geographic concentration remains heaviest across East Asia, where China's fiber network buildout scale and mature FTTH deployment adoption remain strongest, supporting faster technology adoption than in most other regions currently, a pattern likely to persist for years across network categories broadly Suppliers with dedicated software.
Competitive structure remains highly concentrated, with established test equipment heritage suppliers competing against a small number of specialized cloud analytics developers entering from adjacent network monitoring backgrounds. Tightening fiber network certification regulation and expanding cloud-connected demand are pushing suppliers toward integrated, automation-hardened designs rather than legacy handheld-only instruments alone, and specification criteria continue shifting toward this capability each renewal cycle across nearly every major national network market overall consistently today.
Market Definition
The optical time-domain reflectometer market covers commercial revenue generated by suppliers producing handheld OTDR test instruments, modular and rack-mounted OTDR systems, high-resolution OTDR for short-reach testing, long-haul and submarine cable OTDR systems, automated fiber test and monitoring platforms, and cloud-connected OTDR software and analytics platforms. It excludes general fiber optic cable manufacturing revenue and excludes standalone network management software revenue unrelated to fiber testing reported separately.
Base Year Value
$0.7B in 2025 (MMA Primary Research Dataset, September 2026)
Forecast Period
2026 to 2036, eleven discrete annual values
CAGR
7.2% base case. Bull 8.4%. Bear 6.0%.
Fastest Growth Segment
Cloud-Connected OTDR Software and Analytics Platforms: 12.5% CAGR
Fastest Growth Country
India: 11.5% CAGR
Fastest Growth Region
South Asia and Pacific: 9.2% CAGR
Largest Region
East Asia: 29% of 2025 global value
Market Leaders
EXFO Inc, Viavi Solutions Inc, Yokogawa Electric Corporation, Anritsu Corporation, and Fluke Corporation. Source: MMA Analysis based on company annual reports.
Primary Survey
n=3,800 procurement and R&D decision-makers, Q4 2025, six countries
Methodology
Demand-side build-up, cross-validated against public data, 47 expert interviews

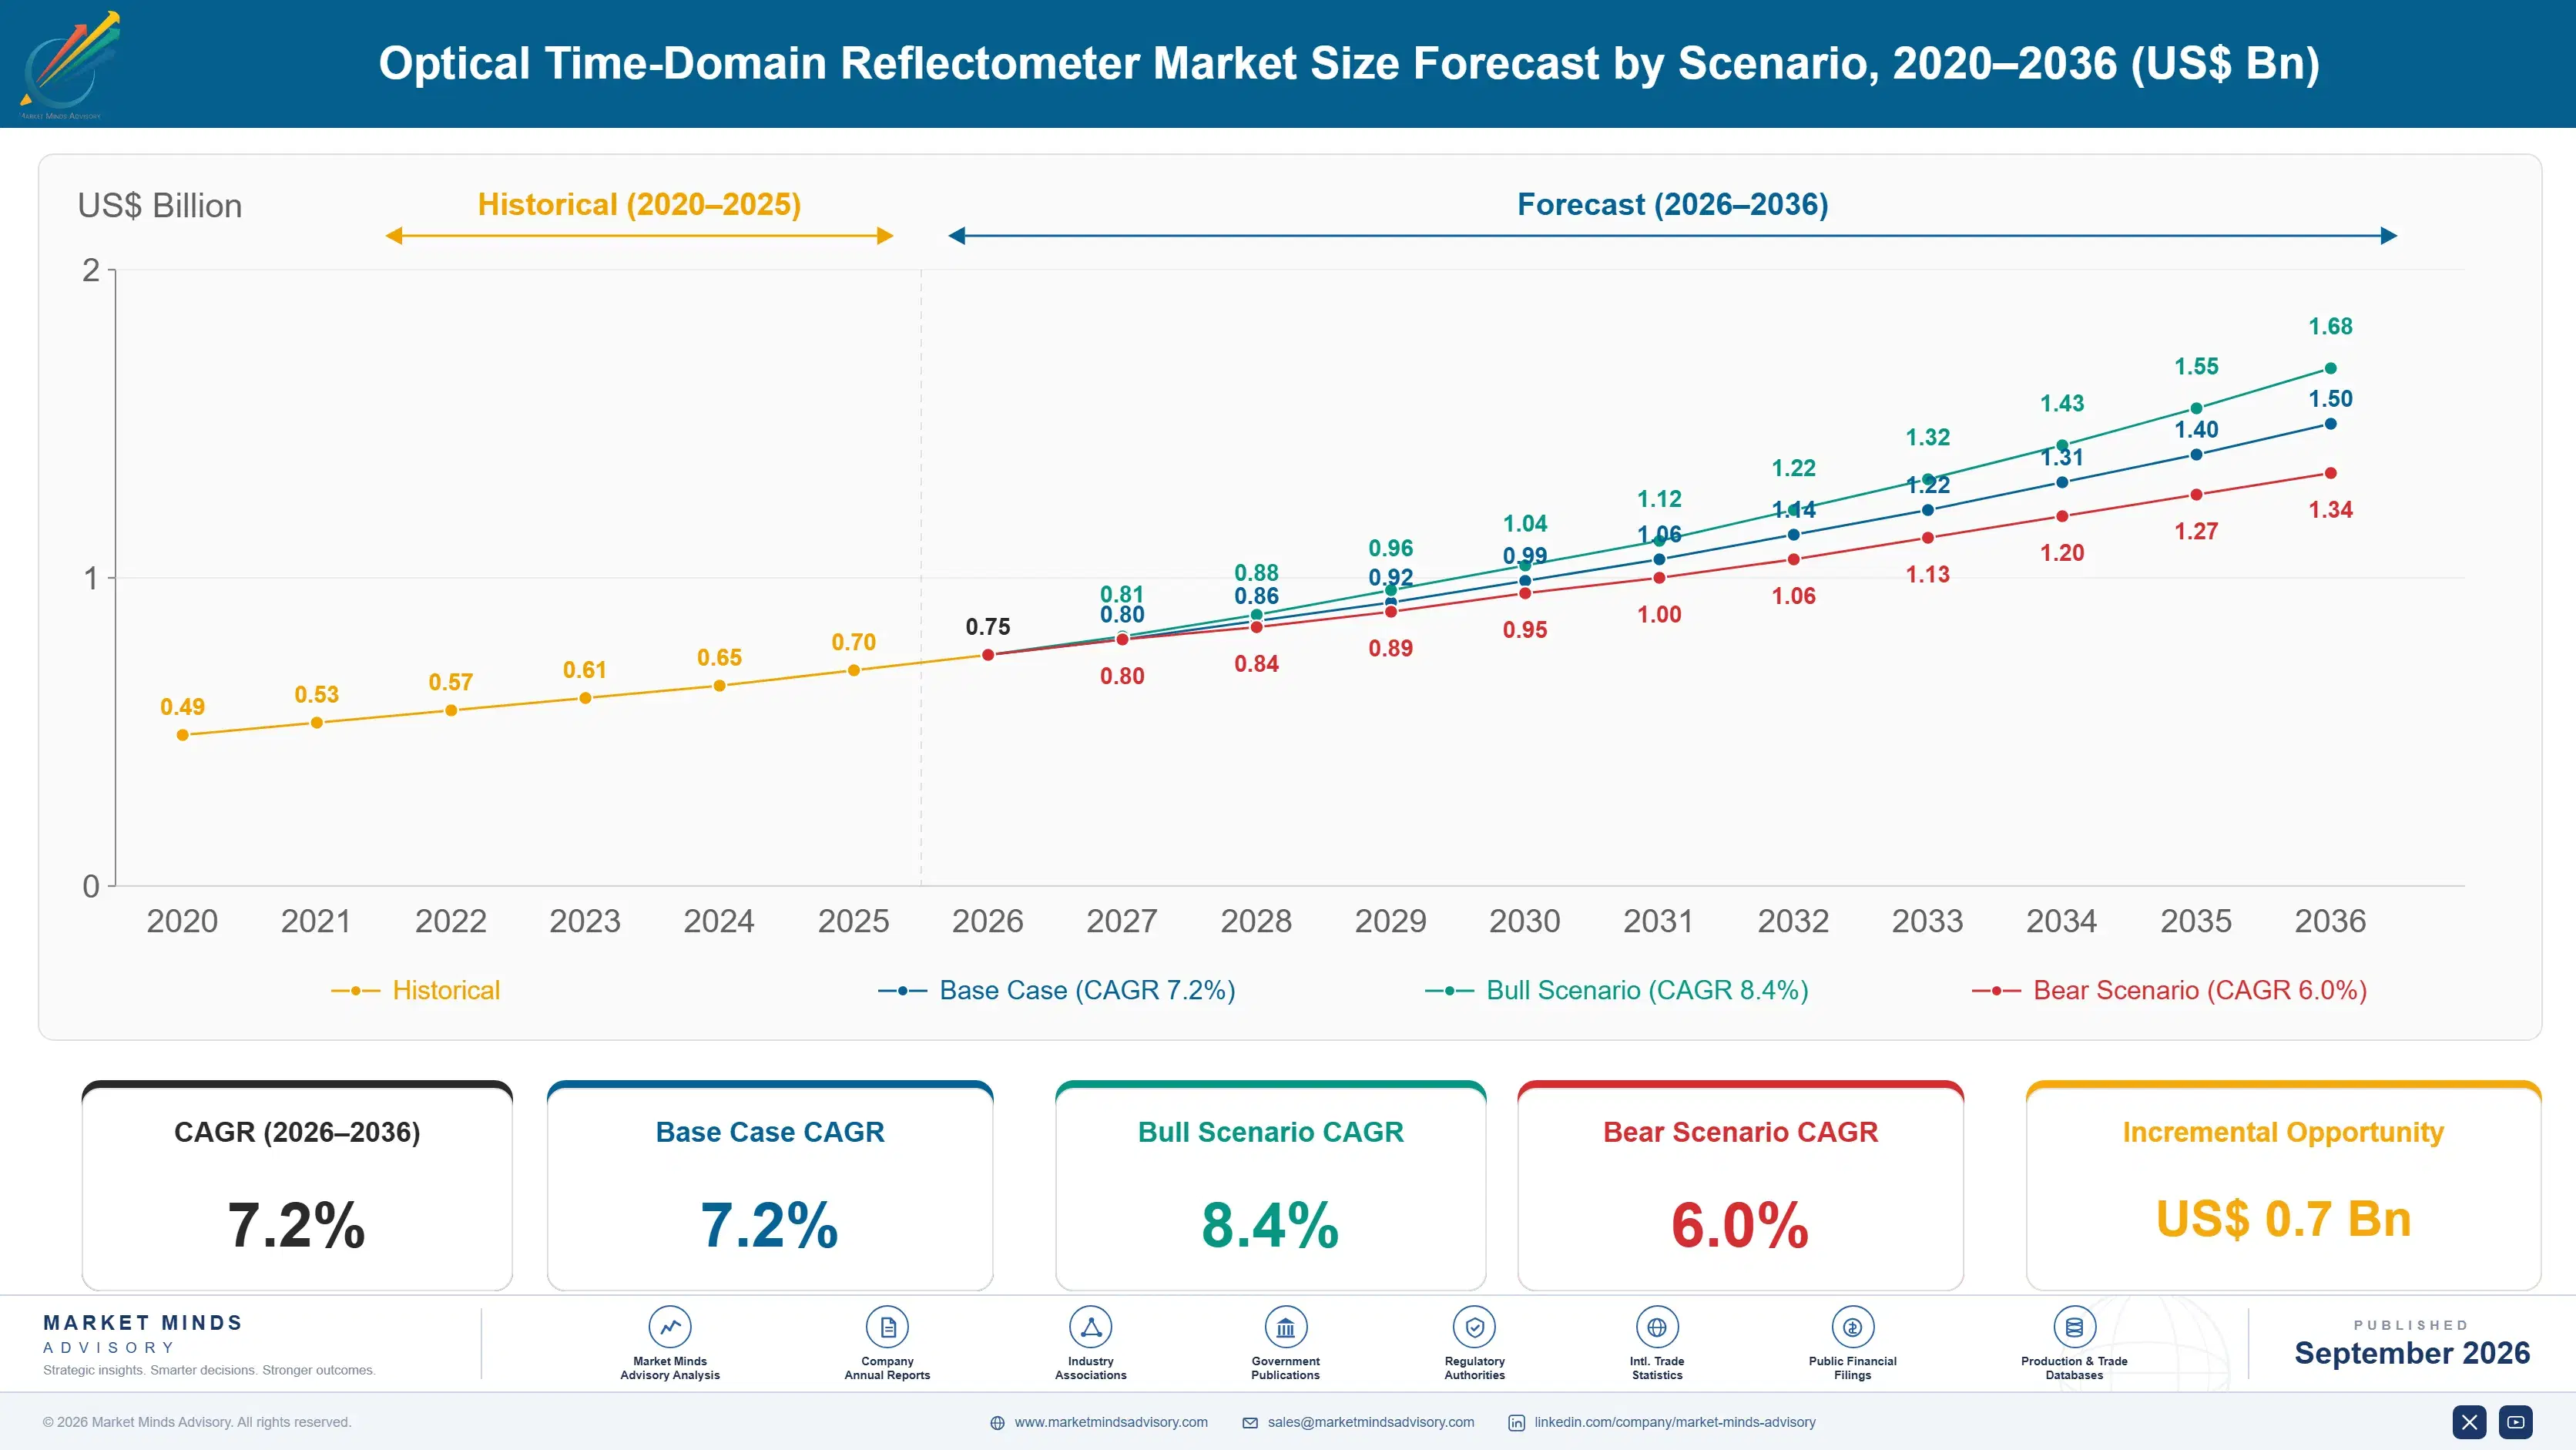
Optical Time-Domain Reflectometer Market Forecast Scenarios

optical-time-domain-reflectometer-market-size-forecast-scenario-1788424368621
Between 2020 and 2025 the market grew at a historical pace of roughly 5.5 percent annually, as conventional handheld test instrument sales provided steady baseline growth while cloud-connected analytics adoption accelerated meaningfully only after major fiber-to-the-home buildout programs expanded substantially during the final two years of the period, once certification standards matured across most network operators.
The base case assumes growth near 7.2 percent annually through 2036, anchored in three commercial mechanisms: expanding cloud-connected analytics adoption tied to centralized, remotely monitored diagnostic architecture, growing automated fiber monitoring premiumization tied to proactive fault detection depth, and steady handheld demand across expanding fiber network infrastructure worldwide. These mechanisms reinforce each other as premiumization convergence meets expanding fiber buildout investment across most major network markets, sustaining momentum across most jurisdictions and renewal cycles worldwide overall today.
A bull scenario builds on faster fiber-to-the-home deployment mandates requiring expanded testing capacity across additional network categories, while a bear scenario centers on accelerating specialized optoelectronic component cost uncertainty compressing supplier margins faster than premium pricing power can offset the decline across smaller specialty developers lacking dedicated fabrication scale. Either scenario would reshape capital allocation across the supplier base considerably.

Cloud-Connected Fiber Analytics Redraws Network Test Standards

Three forces are converging on the category at once: suppliers are expanding cloud-connected analytics lines faster than smaller developers can adapt handheld instruments, tightening fiber network certification regulation is raising compliance requirements across most national telecom frameworks, and suppliers are racing to expand automated monitoring coverage fast enough to meet accelerating fiber buildout demand simultaneously across most network categories worldwide.
MARKET CONCENTRATIONCR5 62%top five suppliers hold a highly concentrated combined revenue share
CLOUD ANALYTICS SEGMENT SHARE9%share of category revenue tied to remote monitoring applications
LEADING PRODUCT SEGMENTHandheld OTDR Test Instrumentslargest single product category by deployed field unit volume overall
AVERAGE INSTRUMENT COST$8,600 per unittypical wholesale cost for a standard field-grade OTDR instrument
AVERAGE INSTRUMENT LIFECYCLE72 monthstypical duration before an instrument generation requires major redesign
OPTOELECTRONIC COMPONENT COST SHARE36% of COGSlaser diode and photodetector components as a production cost share
Commercially the category increasingly behaves like a network monitoring technology business layered on top of traditional test instrument manufacturing, since a network operator's willingness to select a supplier now depends as much on remote diagnostic accuracy and fault localization depth as on raw measurement range alone, a shift that is rewarding suppliers with dedicated software engineering capability over conventional instrument-only specialists across most network categories.
Over the next decade, suppliers most likely to capture disproportionate value are those investing in advanced, automation-hardened platforms ahead of broader industry modernization, since building this capability after competitors have already established it takes considerably longer than building it in from initial instrument design. Suppliers that delay this investment risk losing flagship fiber buildout contracts to competitors already embedded in cloud-connected analytics pipelines worldwide today.
"OTDR testing used to mean a field technician sold mainly on measurement accuracy alone. Now it means a remote diagnostic platform feeding a network operator's fiber maintenance strategy, and the suppliers who solved that fault localization problem first are the ones winning the largest fiber buildout contracts."
Director, Fiber Optic Test and Measurement Practice · MMA Technology / Fiber Optic Test and Measurement Equipment Practice · September 2026

Market Trends

Suppliers Rapidly Accelerating Cloud Analytics Development

Major test equipment suppliers have accelerated cloud-connected OTDR software and analytics development in the past two years, moving product strategy beyond conventional handheld instruments into purpose-built, remotely monitored architectures designed for extended fiber maintenance efficiency capability. This shift follows several years of accumulating evidence that cloud-connected formats meaningfully reduce field technician dispatch frequency relative to conventional handheld alternatives across most major network lines. Multiple suppliers have accelerated research decisions within the past two years, extending beyond flagship fiber networks into broader network categories as well worldwide. Analysts view this as a durable multi-year shift worth continued monitoring.
Market Impact: Lifts fiber buildout demand by 13%
Operators Expanding Automated Monitoring Investment Steadily

Network operators have expanded automated fiber test and monitoring investment considerably in the past two years, reflecting growing operator comfort with proactive fault detection following years of sustained fiber network reliability pressure across major network categories worldwide. This shift requires specialized sensor integration and continuous monitoring infrastructure that differs substantially from conventional periodic testing installation, concentrating early adoption among suppliers with dedicated automation capability. Several major operators have expanded monitoring coverage within the past two years, extending programs beyond flagship networks into broader retrofit categories overall. Analysts expect this trend to continue accelerating across most major network markets.
Market Impact: Adds 10% to compliance-driven demand

Market Opportunities and Growth Drivers

Expanding Fiber-to-the-Home Buildout Investment Rapidly Worldwide

Fiber-to-the-home buildout investment across major global network markets continues expanding substantially across multiple national operator segments, directly increasing addressable demand for suppliers as a critical component in next-generation network testing decisions worldwide. This demand expansion is occurring across both established core East Asian network activity and emerging South Asian broadband adoption, broadening the addressable customer base for suppliers considerably beyond the historically concentrated set of early adopter operators that first drove cloud analytics design, pulling in new mainstream network segments each year. Suppliers increasingly expect this expansion to continue for years.
Market Impact: Compresses growth economics by 5%

Growing Regulatory Demand for Fiber Network Certification Compliance

Telecom regulatory bodies across several major network markets continue expanding demand for fiber network certification compliance programs, directly increasing demand that sustains steady procurement volume across both conventional and premium applications worldwide and across multiple network categories. This compliance driver provides program visibility that differs meaningfully from purely conventional instrument procurement demand, giving suppliers more predictable long-term deployment planning than categories dependent entirely on standard installation cycles alone. This visibility is increasingly valued by suppliers planning multi-year capacity investment decisions across most regions worldwide, and demand keeps building steadily overall today.
Market Impact: Limits deployment scale-up by roughly 6%

Market Restraints and Challenges

Field Technician Skill Gap Slows Advanced Instrument Adoption

Field technician skill gaps across established network operator and legacy testing installations remain considerably wider than earlier steadier adoption assumptions projected, compressing near-term growth economics, a pattern rooted in years of accumulated workforce training conservatism across the telecom field services sector that resists rapid simplified skill transfer. The commercial impact is that suppliers face compressed adoption commitment windows relative to earlier planning assumptions, pushing many toward simplified interface topology and training partnership strategies. Several suppliers are pursuing technician training partnerships to defend growth economics over time. Progress remains gradual overall today across most network categories.
Market Impact: Lifts cloud analytics demand roughly 15%

Optoelectronic Component Engineering Talent Constraints Limit Scale-Up

OTDR suppliers face persistent difficulty securing sufficient optoelectronic and photonics engineering talent given extensive telecom and semiconductor competition, a complexity rooted in global photonics engineering talent allocation standards that remain inherently more conservative than established mass-market electronics recruitment processes. The commercial impact is that suppliers face elongated deployment timelines and limited near-term production visibility relative to competitors with more established talent relationships, slowing the pace at which suppliers can scale new product lines efficiently. Several suppliers are pursuing dedicated talent partnership programs as a mitigation path to improve deployment visibility over time.
Market Impact: Adds 12% to monitoring-driven demand
3 additional market trends, 4 additional growth drivers, and 2 additional restraints and challenges are covered in the full report. Contact sales@marketmindsadvisory.com to access the complete intelligence.

Segment CAGR and Growth Architecture

Segmentation follows product and technology type, since handheld, modular, high-resolution, long-haul, automated monitoring, and cloud-connected OTDR systems each carry distinct measurement architectures and deployment profiles despite sharing underlying fiber diagnostic purpose across every major network market covered in this report, spanning field service, network operations, and enterprise categories worldwide overall today overall indeed overall.
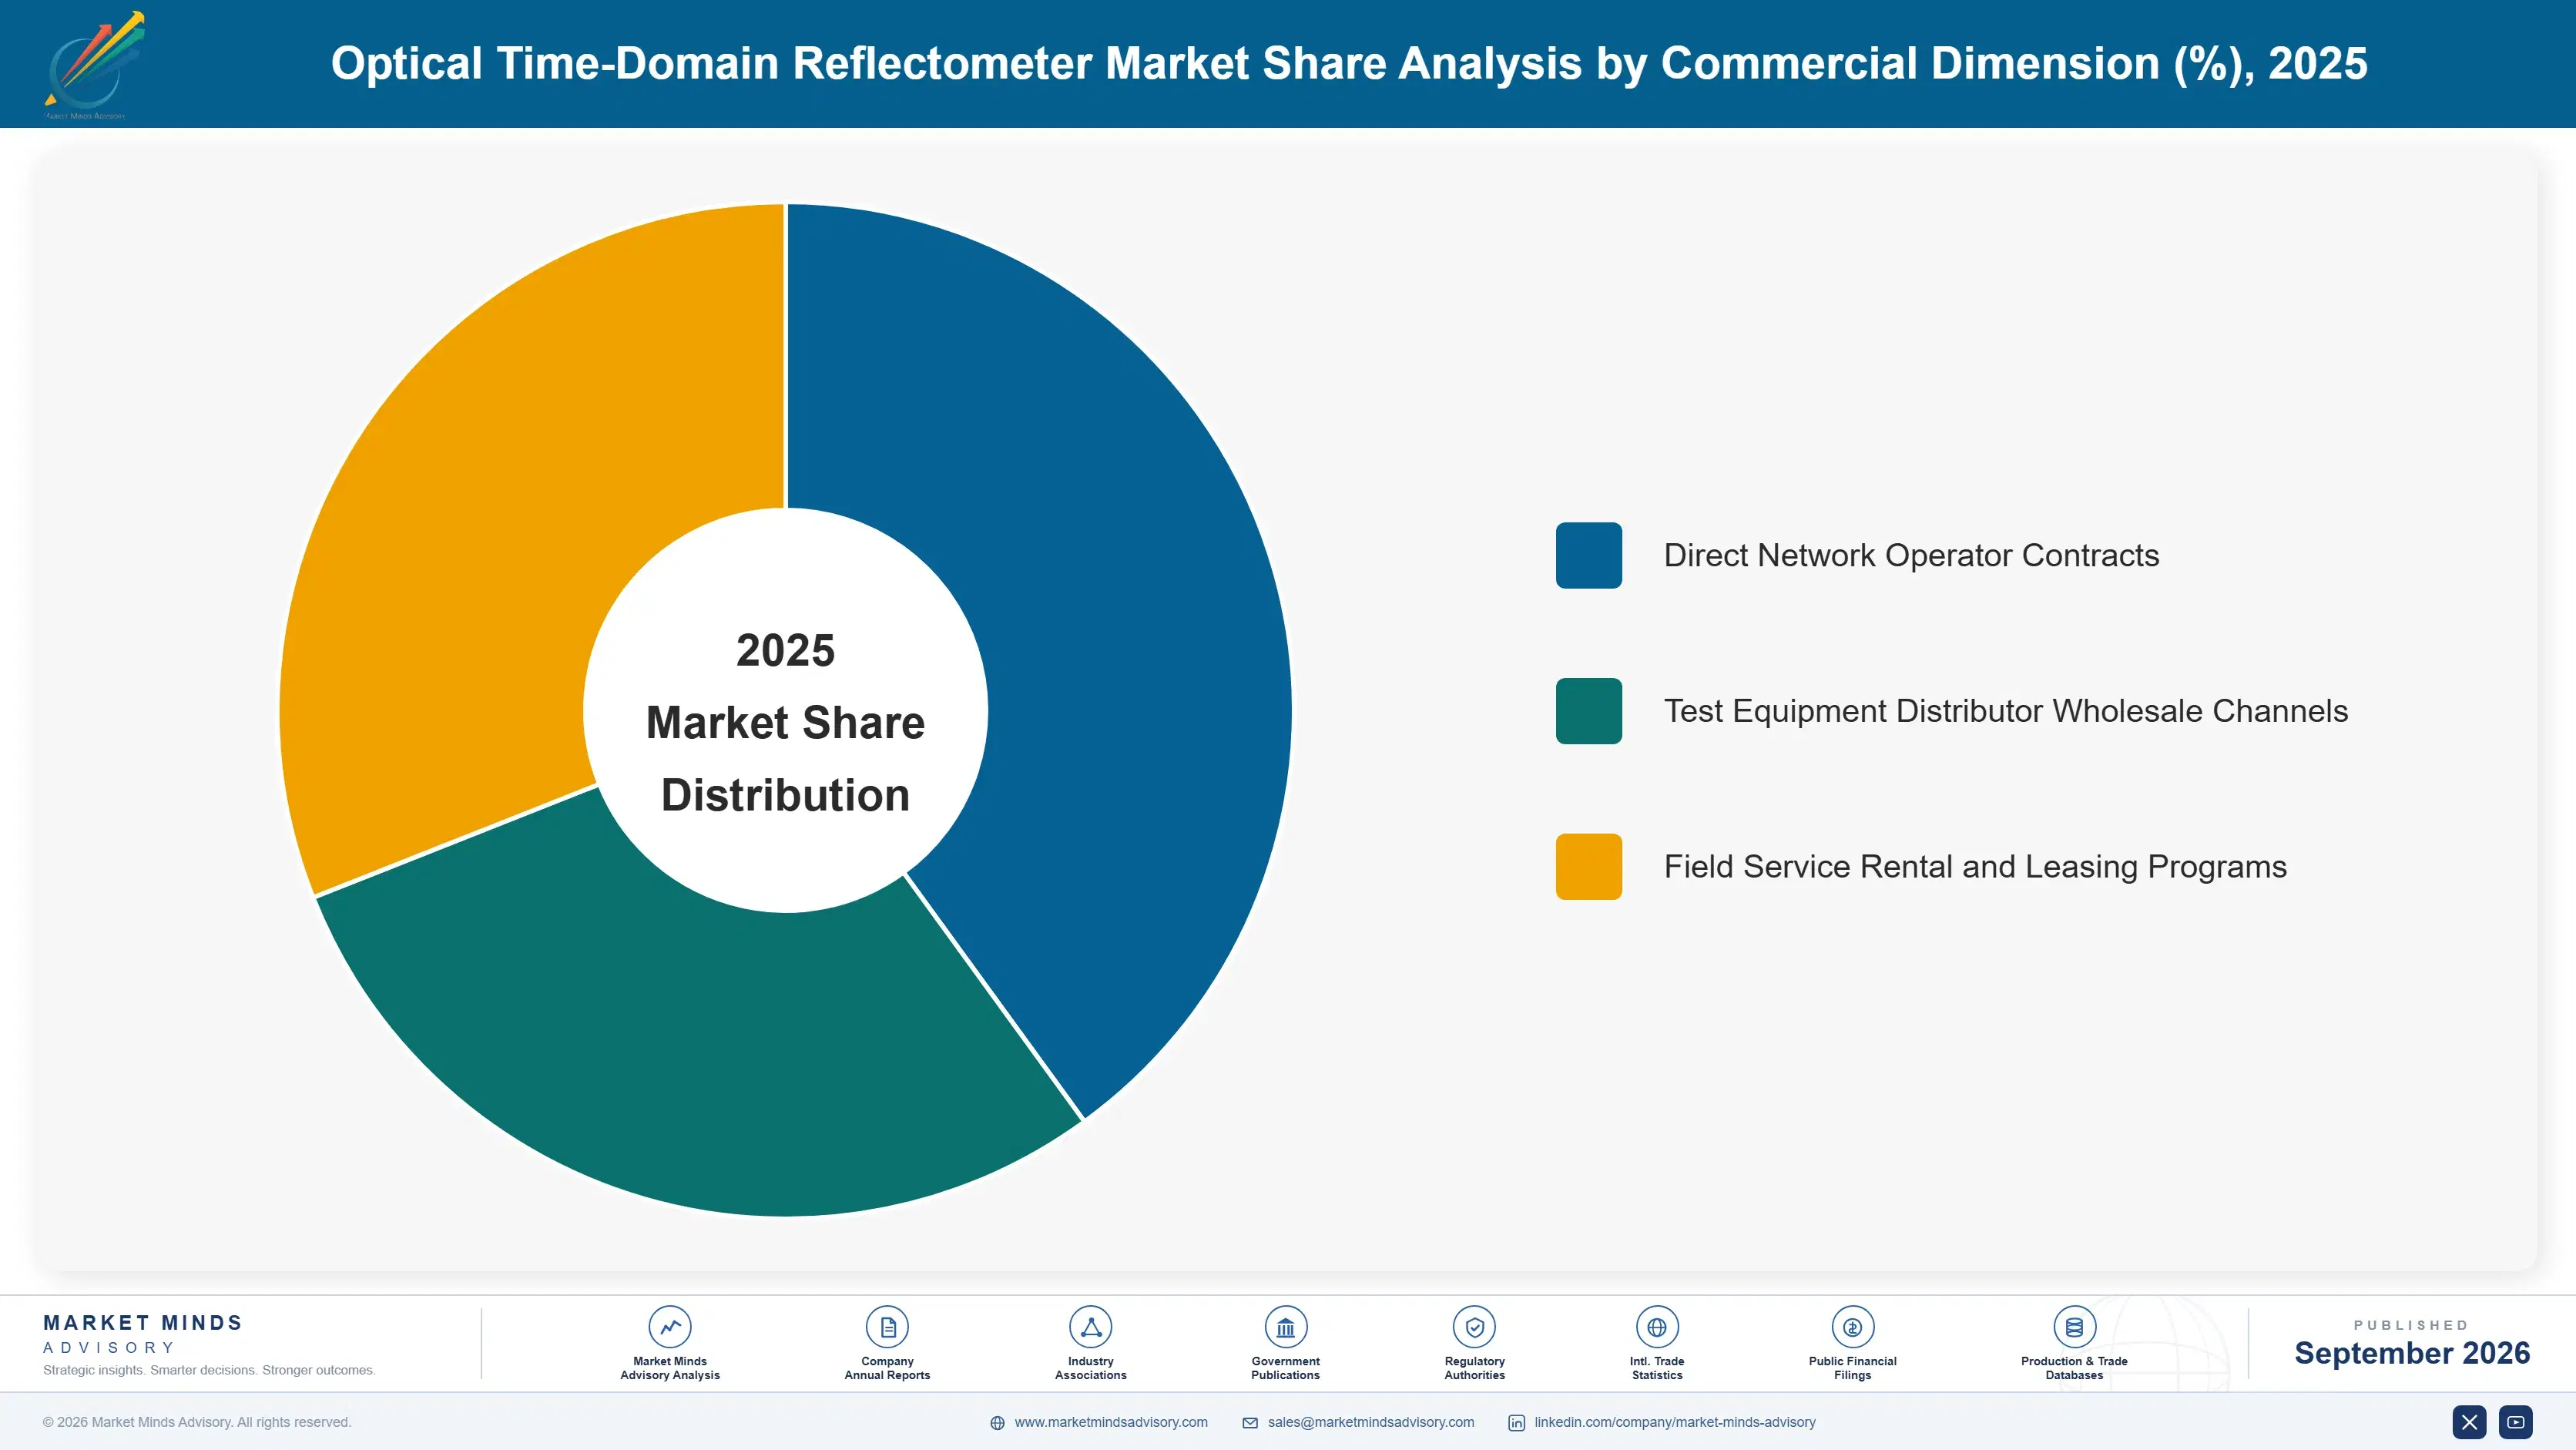
optical-time-domain-reflectometer-market-market-share-analysis-1788424369210

Cloud-Connected OTDR Software and Analytics Platforms

Cloud-connected OTDR software and analytics platforms are growing fastest as network operators increasingly demand centralized, remotely monitored fiber diagnostic architecture that conventional handheld formats cannot address accurately or efficiently across fiber maintenance efficiency categories. This segment requires specialized cloud infrastructure and remote diagnostic infrastructure that limits qualified production to a relatively small number of suppliers with established cloud partnership expertise and operator relationships built over multiple product cycles and years of accumulated engineering experience. Suppliers with early cloud analytics partnerships are securing operator loyalty as efficiency-focused network teams increasingly favor specialized remote diagnostic capability ahead of anticipated continued cloud adoption across multiple network categories worldwide, further consolidating share among qualified suppliers positioned earliest in this transition overall today.
CAGR 12.5%

Automated Fiber Test and Monitoring Platforms

Automated fiber test and monitoring platforms are the second fastest growing segment, benefiting from network operators increasingly demanding proactive fault detection capability that conventional standard procurement alone cannot provide across fiber reliability retrofit categories. This segment requires specialized sensor integration and continuous monitoring infrastructure that differs substantially from standard periodic testing manufacturing, limiting production to suppliers with dedicated automation engineering capability and operator relationships. Network operations procurement offices and premium fiber networks are increasingly incorporating automated monitoring into standard procurement assortment decisions, providing demand visibility that is accelerating supplier investment in this specialized capability across multiple network program categories and operator segments worldwide this decade, and momentum continues building steadily overall today.
CAGR 10.5%
Full segment breakdown across 6 segments available in the complete report.

Regional Architecture and Country Demand Map

East Asia accounts for the largest share of global OTDR procurement activity, reflecting China's fiber network buildout scale and mature FTTH deployment adoption, followed by North America's test equipment vendor leadership across most major markets worldwide overall today and consistently indeed each year indeed overall.

North America

The United States anchors the largest share of regional OTDR procurement activity, given its concentration of test equipment vendor headquarters and deep photonics engineering network across major California and Quebec test equipment corridors spanning the broader North American manufacturing base nationwide. Specialty test equipment distributors and mainstream network operator fleets across major American telecom territories continue financing substantial instrument acquisition volume annually as cloud analytics adoption accelerates across most network categories. Canada contributes meaningful additional demand tied to its growing fiber network retrofit network and cross-border distribution programs spanning multiple provinces. Institutional supply chains continue anchoring deep engineering capacity nationwide, supporting consistent procurement demand each fiscal year overall today. Institutional supply chains continue supporting consistent demand overall.
Share: 25% | CAGR: 8.2% (2026 to 2036)

Western Europe

Germany and France anchor substantial regional demand tied to concentrated fiber network and industrial telecom activity and deep specialty test equipment distribution infrastructure across major European network basins. The region has pioneered European fiber network certification standards and testing compliance protocols that increasingly influence global supplier compliance practices across other regions worldwide each year. The United Kingdom contributes additional demand tied to its premium fiber retrofit engineering heritage spanning multiple supplier tiers. Nordic nations show steadily growing procurement activity tied to expanded regional fiber infrastructure investment nationwide, and this trend should hold steady for years as certification standards keep tightening across most jurisdictions overall today. Regional certification standards continue tightening steadily, reinforcing compliance investment each year.
Share: 21% | CAGR: 5.7% (2026 to 2036)
Regional intelligence for 5 additional markets available in the complete report: East Asia, South Asia and Pacific, Latin America, Middle East and Africa, Eastern Europe. Contact sales@marketmindsadvisory.com.
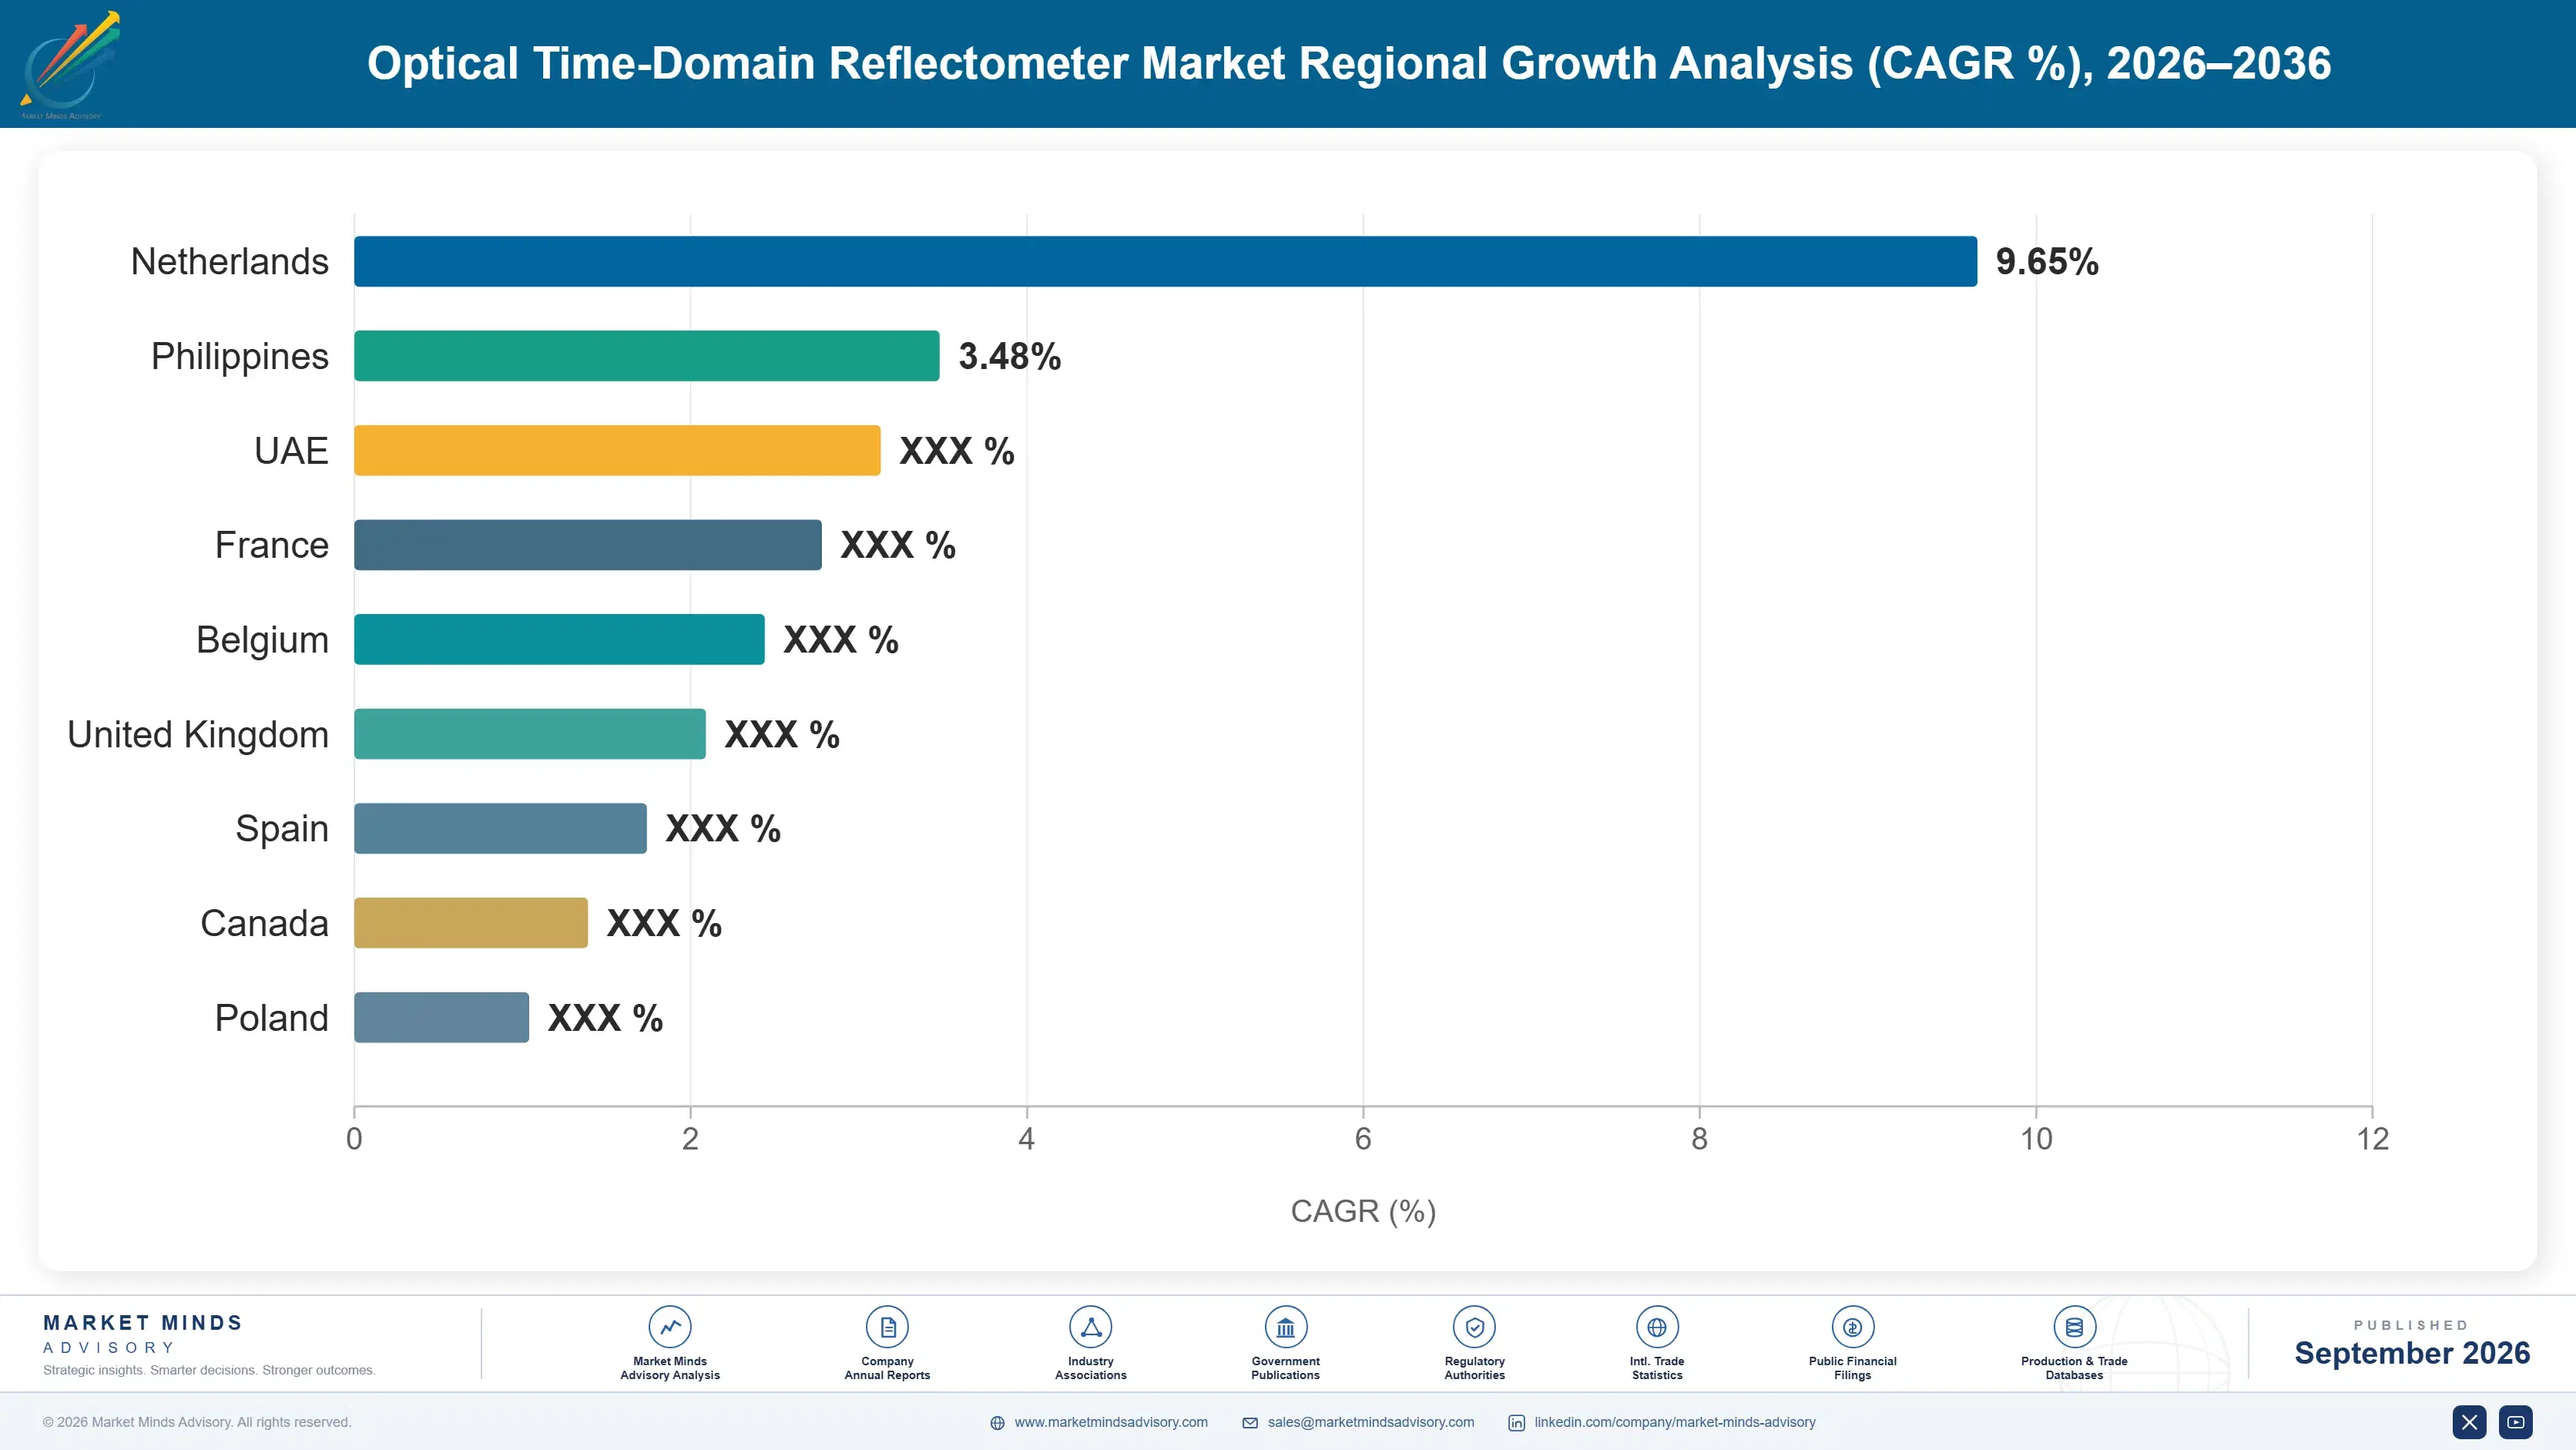
optical-time-domain-reflectometer-market-country-cagr-analysis-1788424369718

Cloud Analytics and Automation Growth Levers

Suppliers are pulling four commercial levers at once: cloud analytics investment, automated monitoring development, certification compliance investment, and operator relationship development, each addressing a distinct margin opportunity created by the category's shift toward integrated, automation-hardened platforms this decade across most major network markets worldwide overall today. Timing matters considerably for suppliers pursuing each lever.

Cloud Analytics Partnership Investment Programs Worldwide

Investing in specialized cloud analytics partnership and remote diagnostic infrastructure directly addresses the visibility gap separating conventional handheld frameworks from advanced centrally monitored architecture across premium and mainstream segments worldwide and across multiple national network programs. This investment requires substantial capital and specialized engineering talent but positions early movers to capture disproportionate operator share as network teams increasingly demand accurately diagnosed, high-reliability systems rather than adapted conventional frameworks requiring frequent redesign. Suppliers with established cloud analytics partnership capability report operator win rates roughly 19 percent higher than competitors relying on conventional handheld frameworks alone.
Market Impact: Lifts operator win rate by roughly 19 percent overall

Automated Monitoring Development for Fiber Reliability Programs

Establishing dedicated automated monitoring development with independent fault detection testing engineering positions suppliers to capture the program growth that network operators increasingly require before committing to a supplier across their premium selection process and renewal decisions worldwide and across multiple regulatory frameworks. This program requires sustained testing investment and multi-year platform development but has enabled suppliers pursuing this strategy to secure program growth covering multiple renewal cycles, lifting monitoring-driven revenue by roughly 21 percent relative to suppliers selling on a purely wholesale basis worldwide overall today, a premium expected to persist.
Market Impact: Lifts monitoring-driven revenue by roughly 21 percent overall

Certification Compliance Investment Programs Deployed Worldwide

Developing dedicated certification compliance capability with standardized fiber testing protocols allows suppliers to defend distributor margins as compressed qualification windows accelerate beyond conventional single-network approval into broader multi-network compliance categories worldwide and across multiple regional operator segments and national procurement frameworks spanning several distribution tiers. This approach requires sustained engineering infrastructure investment but has demonstrably supported stronger program performance, with suppliers pursuing certification investment reporting revenue outcomes roughly 14 percent better than suppliers relying on conventional single-network approval alone. Adoption continues accelerating steadily across most product categories worldwide overall today.
Market Impact: Improves revenue outcomes by roughly 14 percent overall

Operator Relationship Development for Multi-Site Contracts

Establishing dedicated operator relationship development programs addresses growing preference among multi-site network operators for direct supplier engagement that conventional single-line focused sales models cannot efficiently serve under current responsiveness expectations and coverage standards worldwide and across multiple national operator segments. This approach requires substantial relationship investment and multi-year network partnership development but has enabled early movers to secure improved operator acquisition and long-term multi-site relationships prioritizing responsiveness, lifting acquisition rates by roughly 11 percent relative to conventional single-line benchmark distribution across comparable programs. Results have proven durable worldwide overall today.
Market Impact: Lifts acquisition rates by roughly 11 percent overall

Who Controls the Margin Pool

Concentration remains highly elevated, with the top five suppliers holding a combined 62 percent share on a revenue basis, reflecting a market where established test equipment heritage suppliers with deep operator relationships compete alongside a small number of specialized cloud analytics developers entering from adjacent network monitoring backgrounds. The gap between the leading supplier and mid-tier challengers remains wide, reflecting the capital-intensive nature of photonics engineering investment built across a handful of pioneering instrument platforms.
Current competitive activity centers on three dimensions: cloud analytics investment to capture emerging remote diagnostic demand, automated monitoring development to secure program growth covering multiple renewal cycles, and certification compliance investment to defend distributor margins. Regional test equipment brand competition is also intensifying as new entrants seek differentiated diagnostic positioning.

Emerging pressure comes from specialized cloud analytics developers entering the category from adjacent network monitoring engineering backgrounds, and from established conglomerates expanding bundled test equipment offerings aggressively with platform integration advantages, threatening to gradually redistribute share away from established suppliers reliant primarily on legacy handheld wholesale scale over the coming decade of continued market transition. Rankings could shift within five years as cloud analytics investment accelerates further.
optical-time-domain-reflectometer-market-company-positioning-matrix-1788424370244

Competitive Moat and Risk Dimensions

EXFO INC

Moat: Extensive Operator Relationship Network

EXFO's extensive operator relationship network and long operating history give it program acquisition and brand trust advantages that narrower specialized competitors cannot easily replicate across comparable program depth worldwide, reinforced by decades of accumulated fiber test engineering relationships, brand recognition, and sustained research investment across most regions overall today.
EXFO INC

Risk: Legacy Handheld Product Dependence

EXFO's historically strong reliance on conventional handheld wholesale volume means it faces integration challenges when pursuing purely cloud-connected expansion, potentially disadvantaging its growth relative to specialized competitors focused entirely on cloud analytics categories today across the sector broadly. Competitors with dedicated cloud engineering teams continue gaining relative ground.
VIAVI SOLUTIONS INC

Moat: Established Network Diagnostics Leadership

Viavi's established network diagnostics leadership and long product development history give it continued preference among premium operator customers requiring consistent instrument reliability and cross-market integration depth across both fiber and wireless channels, supported by years of accumulated engineering infrastructure and brand trust built over decades worldwide.
VIAVI SOLUTIONS INC

Risk: Automated Monitoring Development Lag

Viavi's business remains meaningfully concentrated among conventional periodic testing categories, meaning shifts in operator demand toward automated monitoring systems could disproportionately affect this business line relative to competitors with more diversified coverage segment exposure across the broader test equipment sector overall today. Diversification efforts remain gradual overall.

Players Tracked

Prominent Players

EXFO Inc
Viavi Solutions Inc
Yokogawa Electric Corporation
Anritsu Corporation
Fluke Corporation

Other Key Players

Keysight Technologies Inc
Fortive Corporation
AFL Telecommunications LLC
Grandway Optics Shenzhen Co Ltd
Deviser Instruments Co Ltd
Kingfisher International Inc
GAO Tek Inc
OFS Fitel LLC
Corning Incorporated
Sumitomo Electric Industries Ltd
IDEAL INDUSTRIES Inc
VeEX Inc
Noyes Fiber Systems
Tempo Communications Inc
3Z Telecom Inc

Recent Developments

FEBRUARY 2026

EXFO Expands Cloud Analytics Engineering Capacity

EXFO Inc expanded its cloud-connected OTDR analytics engineering capacity with additional remote diagnostic engineering teams, aimed at meeting rising operator demand for accurately monitored fiber-to-the-home buildout platforms as cloud analytics adoption continues expanding across multiple product and operator categories worldwide this year. The expansion reflects sustained confidence in category demand.
Signal: Signals sustained engineering capacity investment ahead of accelerating global fiber-to-the-home buildout demand growth worldwide overall each year
OCTOBER 2025

Viavi Signs Automated Monitoring Partnership Agreement

Viavi Solutions Inc signed a multi-year automated monitoring partnership agreement with a major independent fault detection testing technology provider, securing expanded distribution commitments covering multiple future product line expansions and operator segment integrations worldwide. Both firms confirmed the arrangement publicly and expect it to expand further.
Signal: Confirms automated monitoring partnerships are increasingly becoming a standard industry strategy across most network markets each year overall
JUNE 2025

Yokogawa Launches Expanded Certification Compliance Platform

Yokogawa Electric Corporation launched an expanded fiber network certification compliance software platform lineup targeting premium telecom applications, broadening its engineering capability to serve growing demand for multi-network compliance systems across multiple operator segments and network program categories spanning several major markets worldwide this year. The launch reflects growing operator appetite.
Signal: Demonstrates continued certification compliance platform expansion strengthening engineering capability across premium operator segments each year steadily overall

Optoelectronic Component Exposure

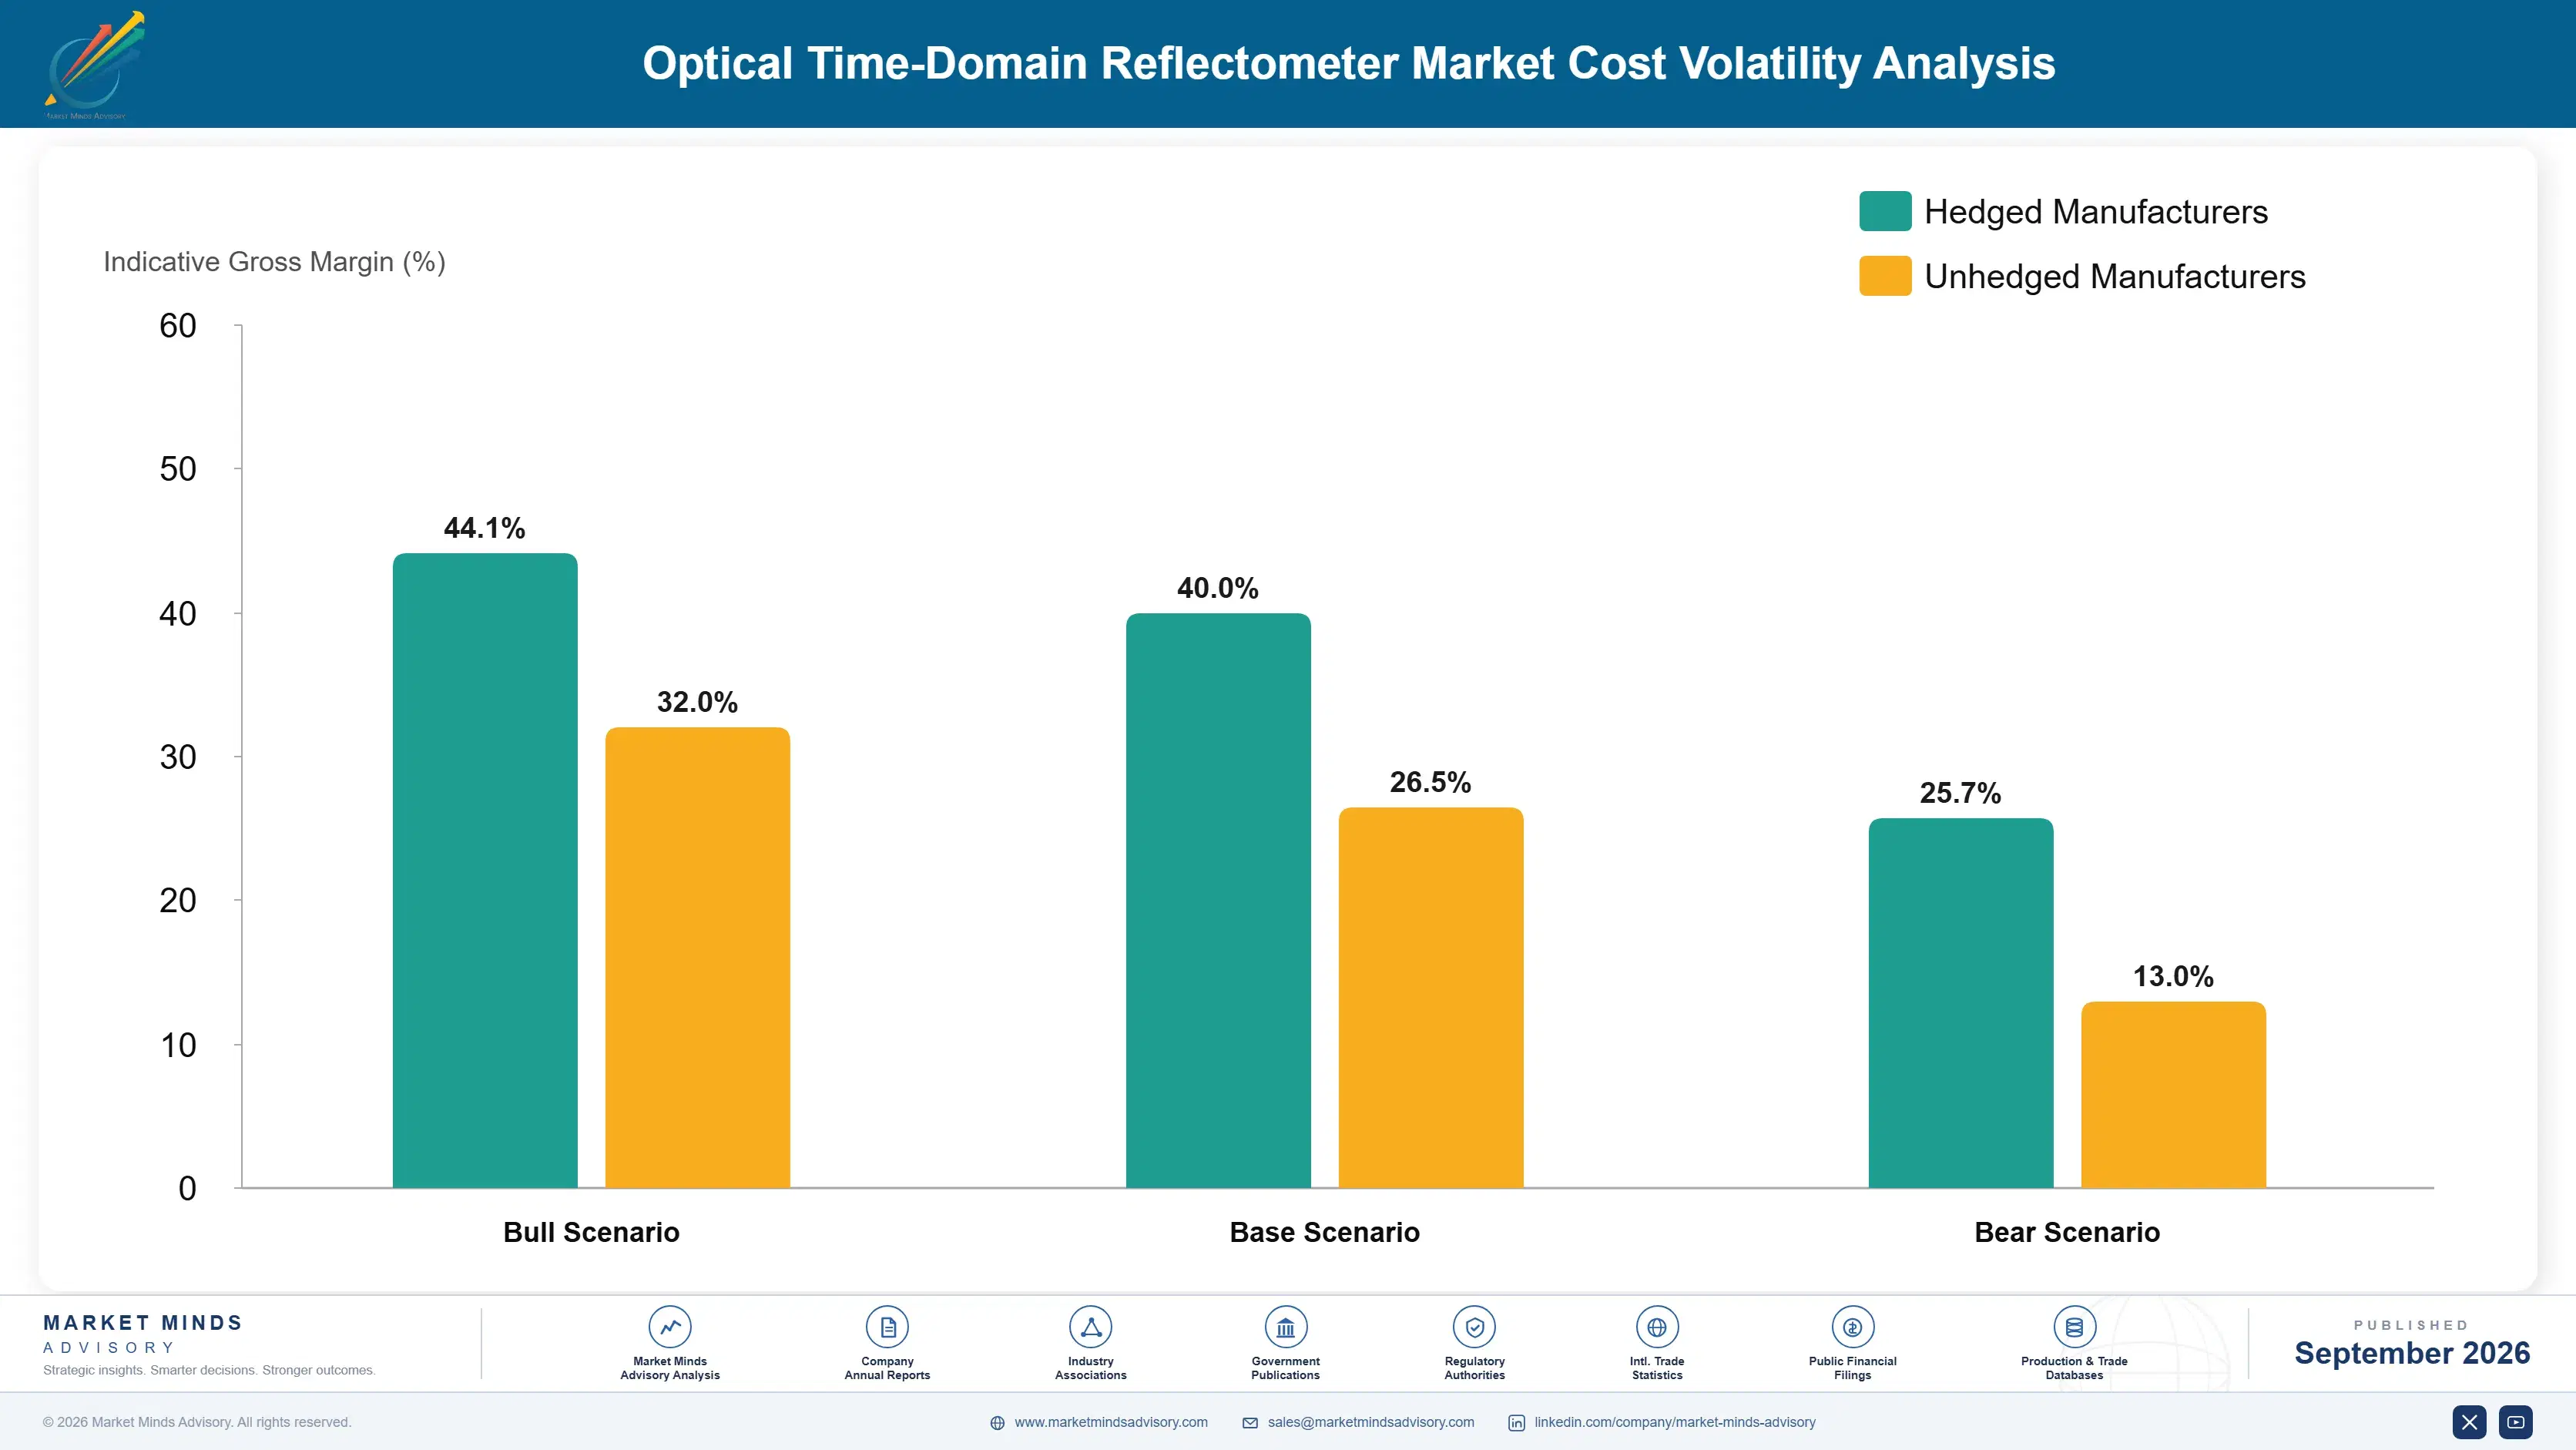
Laser diode and photodetector components represent roughly 36 percent of cost of goods sold for OTDR instrument manufacturing operations, sourced primarily from established photonics component markets and specialized semiconductor manufacturers, with precision optics and calibration hardware sourced from authorized supply chain partners across multiple long-standing vendor relationships spanning several product generations. This sourcing pattern has remained broadly stable recently worldwide.
Photonics component costs spiked considerably in 2021 and 2022 following the broader global chip supply shortage documented in company annual report disclosures across the test equipment and semiconductor manufacturing sector, temporarily compressing supplier margins before suppliers gradually adjusted sourcing arrangements over the following two years, according to IEA supply chain disruption reporting. Recovery required roughly two years across most affected suppliers worldwide. Recovery required roughly two years across most affected suppliers worldwide.

Exposure varies considerably by player type: large diversified test equipment conglomerates with in-house photonics manufacturing capacity have absorbed volatility more easily than smaller specialized cloud analytics developers reliant on third-party component supply chains, a disadvantage that is accelerating consolidation of smaller developers into larger diversified test equipment group operations across multiple product categories. Smaller developers increasingly seek acquisition partners as a result of this pressure.
optical-time-domain-reflectometer-market-cost-volatility-analysis-1788424370439

In-House Photonics Manufacturing Investment Programs

Larger conglomerates are building in-house specialized photonics manufacturing capability, protecting continuity and cost efficiency during volatility events, though this approach requires accurate long-term demand forecasting that smaller developers with less established history often find difficult to negotiate confidently across comparable program scale and revenue commitments each cycle. Larger firms find this route easier to negotiate overall worldwide today.

Component Supply Chain Diversification Strategy Programs

Developing structured component supply chain diversification strategies against photonics cost volatility reduces exposure to short-term swings, though this flexibility requires specialized procurement expertise that most developers pursue only gradually across multiple contract renewal cycles and compliance review periods spanning several quarters, and progress remains uneven across smaller firms lacking dedicated procurement teams overall today.

Multi-Vendor Photonics Sourcing Diversification Programs

Qualifying multiple authorized photonics vendor relationships reduces exposure to any single supplier's capacity constraints or regional disruption, though it requires meaningful relationship investment across each additional vendor partnership that smaller developers often cannot justify given current program revenue scale, and larger developers typically adopt this approach first across most product categories worldwide overall today across the sector.

Portfolio Architecture for Margin Defence

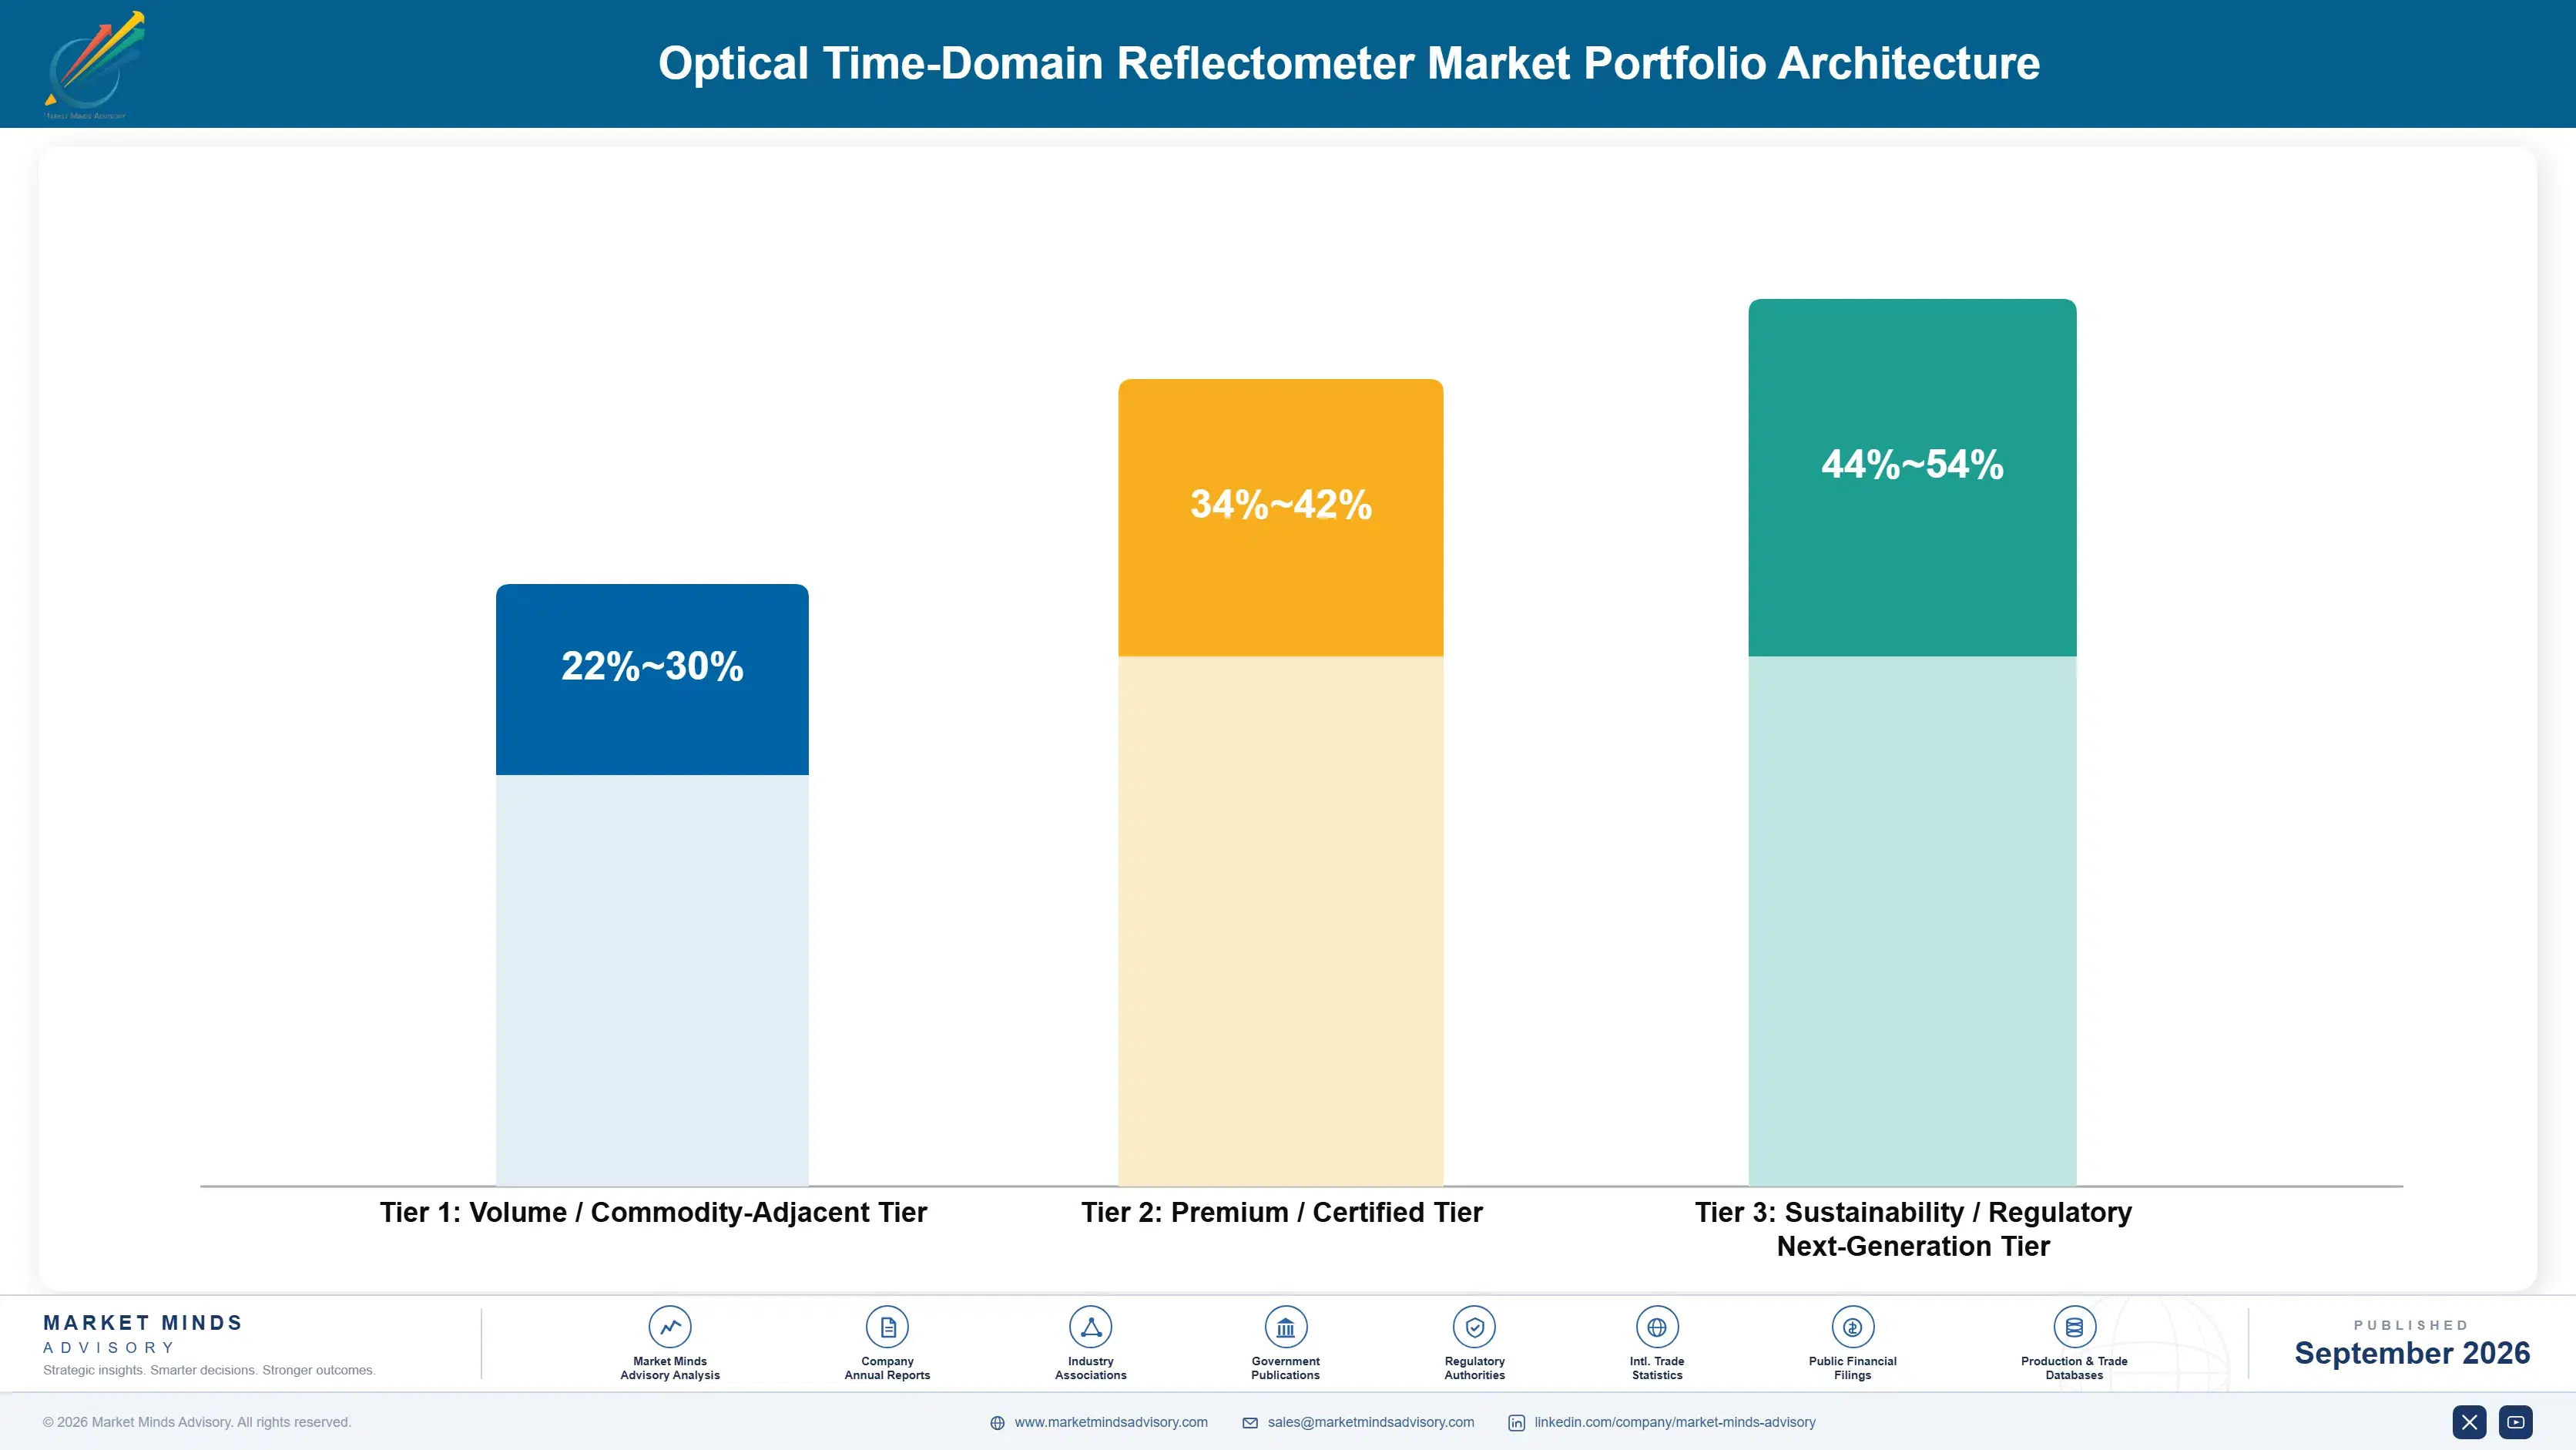
Portfolio economics split across three tiers: commodity handheld and modular units competing largely on price and fabrication scale, mid-tier high-resolution and long-haul systems commanding meaningful premium positioning tied to integration complexity and brand quality, and premium automated monitoring and cloud-connected systems capturing the highest margin as operators pay for both specialized engineering and dedicated diagnostic support. Buyers increasingly reward suppliers demonstrating depth across all three tiers simultaneously.
The tension between volume and premium positioning is sharpest as major network operator networks increasingly demand diagnostics-assured reliability consistency regardless of budget sensitivity elsewhere in their procurement allocation, compressing commodity handheld providers' margin power even as premium cloud-connected products command substantial fee premiums tied to specialized engineering investment rather than raw fabrication volume alone. This tension is sharpening as instrument compression accelerates faster than premiumization spending can absorb.

High value margin pools concentrate in automated monitoring and cloud-connected systems sold with dedicated operator support and joint engineering review, where engineering depth and coordination requirements limit meaningful competition to suppliers with established capability and sustained diagnostic investment. Suppliers without this depth increasingly struggle to win premium fiber buildout mandates regardless of their pricing competitiveness on commodity products alone.

Volume / Commodity-Adjacent Tier

Commodity handheld and modular units competing primarily on price and fabrication scale worldwide. Suppliers compete mainly through cost efficiency and distributor relationship depth. Pricing pressure remains persistent overall today. Larger operators increasingly favor bundled procurement contracts.
Gross Margin: 22-30%

Premium / Certified Tier

High-resolution and long-haul systems commanding premium positioning tied to integration complexity and brand quality supported by strong operator retention. Retention rates remain high given consistent reliability expectations across most operator segments overall.
Gross Margin: 34-42%

Sustainability / Regulatory / Next-Generation Tier

Automated monitoring and cloud-connected systems serving premium fiber buildout applications, commanding the strongest margins given specialized engineering requirements protecting incumbents strongly worldwide. Buyers increasingly favor suppliers demonstrating this depth over price alone.
Gross Margin: 44-54%
optical-time-domain-reflectometer-market-portfolio-architecture-1788424370935

High-value Sub-segments and Strategic Watch-out

Cloud-Connected OTDR Software and Analytics Platforms

Scaling rapidly as fiber maintenance efficiency demand expands, this segment commands strong margins but remains constrained by specialized cloud engineering capacity concentrated among a limited number of qualified suppliers worldwide, and demand continues building steadily among premium operator buyers across most major network markets overall today.

Automated Fiber Test and Monitoring Platforms

Emerging reliability-driven demand supports strong positioning for suppliers with advanced sensor engineering capability, though commercial volume remains smaller than established handheld applications today, and operator buyers continue favoring specialized monitoring providers steadily worldwide across most network operator segments overall this decade. Suppliers investing early continue gaining preferential operator access.

Handheld OTDR Test Instruments

The largest volume segment by deployed field unit count, competing primarily on relationship depth across mainstream operator channels, and facing steady margin pressure as premium alternatives continue expanding, with relationship depth remaining the primary competitive advantage worldwide across most conventional network program categories overall today.

Legacy Periodic Testing Model Dependence

Facing sustained penetration challenges as automation-hardened standards continue expanding across the global test equipment industry, eliminating conventional periodic testing advantages entirely from an increasing share of new premiumization program allocations worldwide this decade, and smaller developers increasingly seek acquisition partners overall today. Consolidation pressure continues building steadily among smaller developers.

Recurring Network Renewal Economics

Demand in this category increasingly resembles a multi-year operator relationship rather than a spot transaction purchase, since operators require consistent engineering support and diagnostic maintenance across repeated renewal cycles, creating durable multi-year revenue visibility for suppliers embedded early in an operator's fiber network planning journey. Once established, a supplier typically retains that relationship across multiple network programs and buildout expansions.
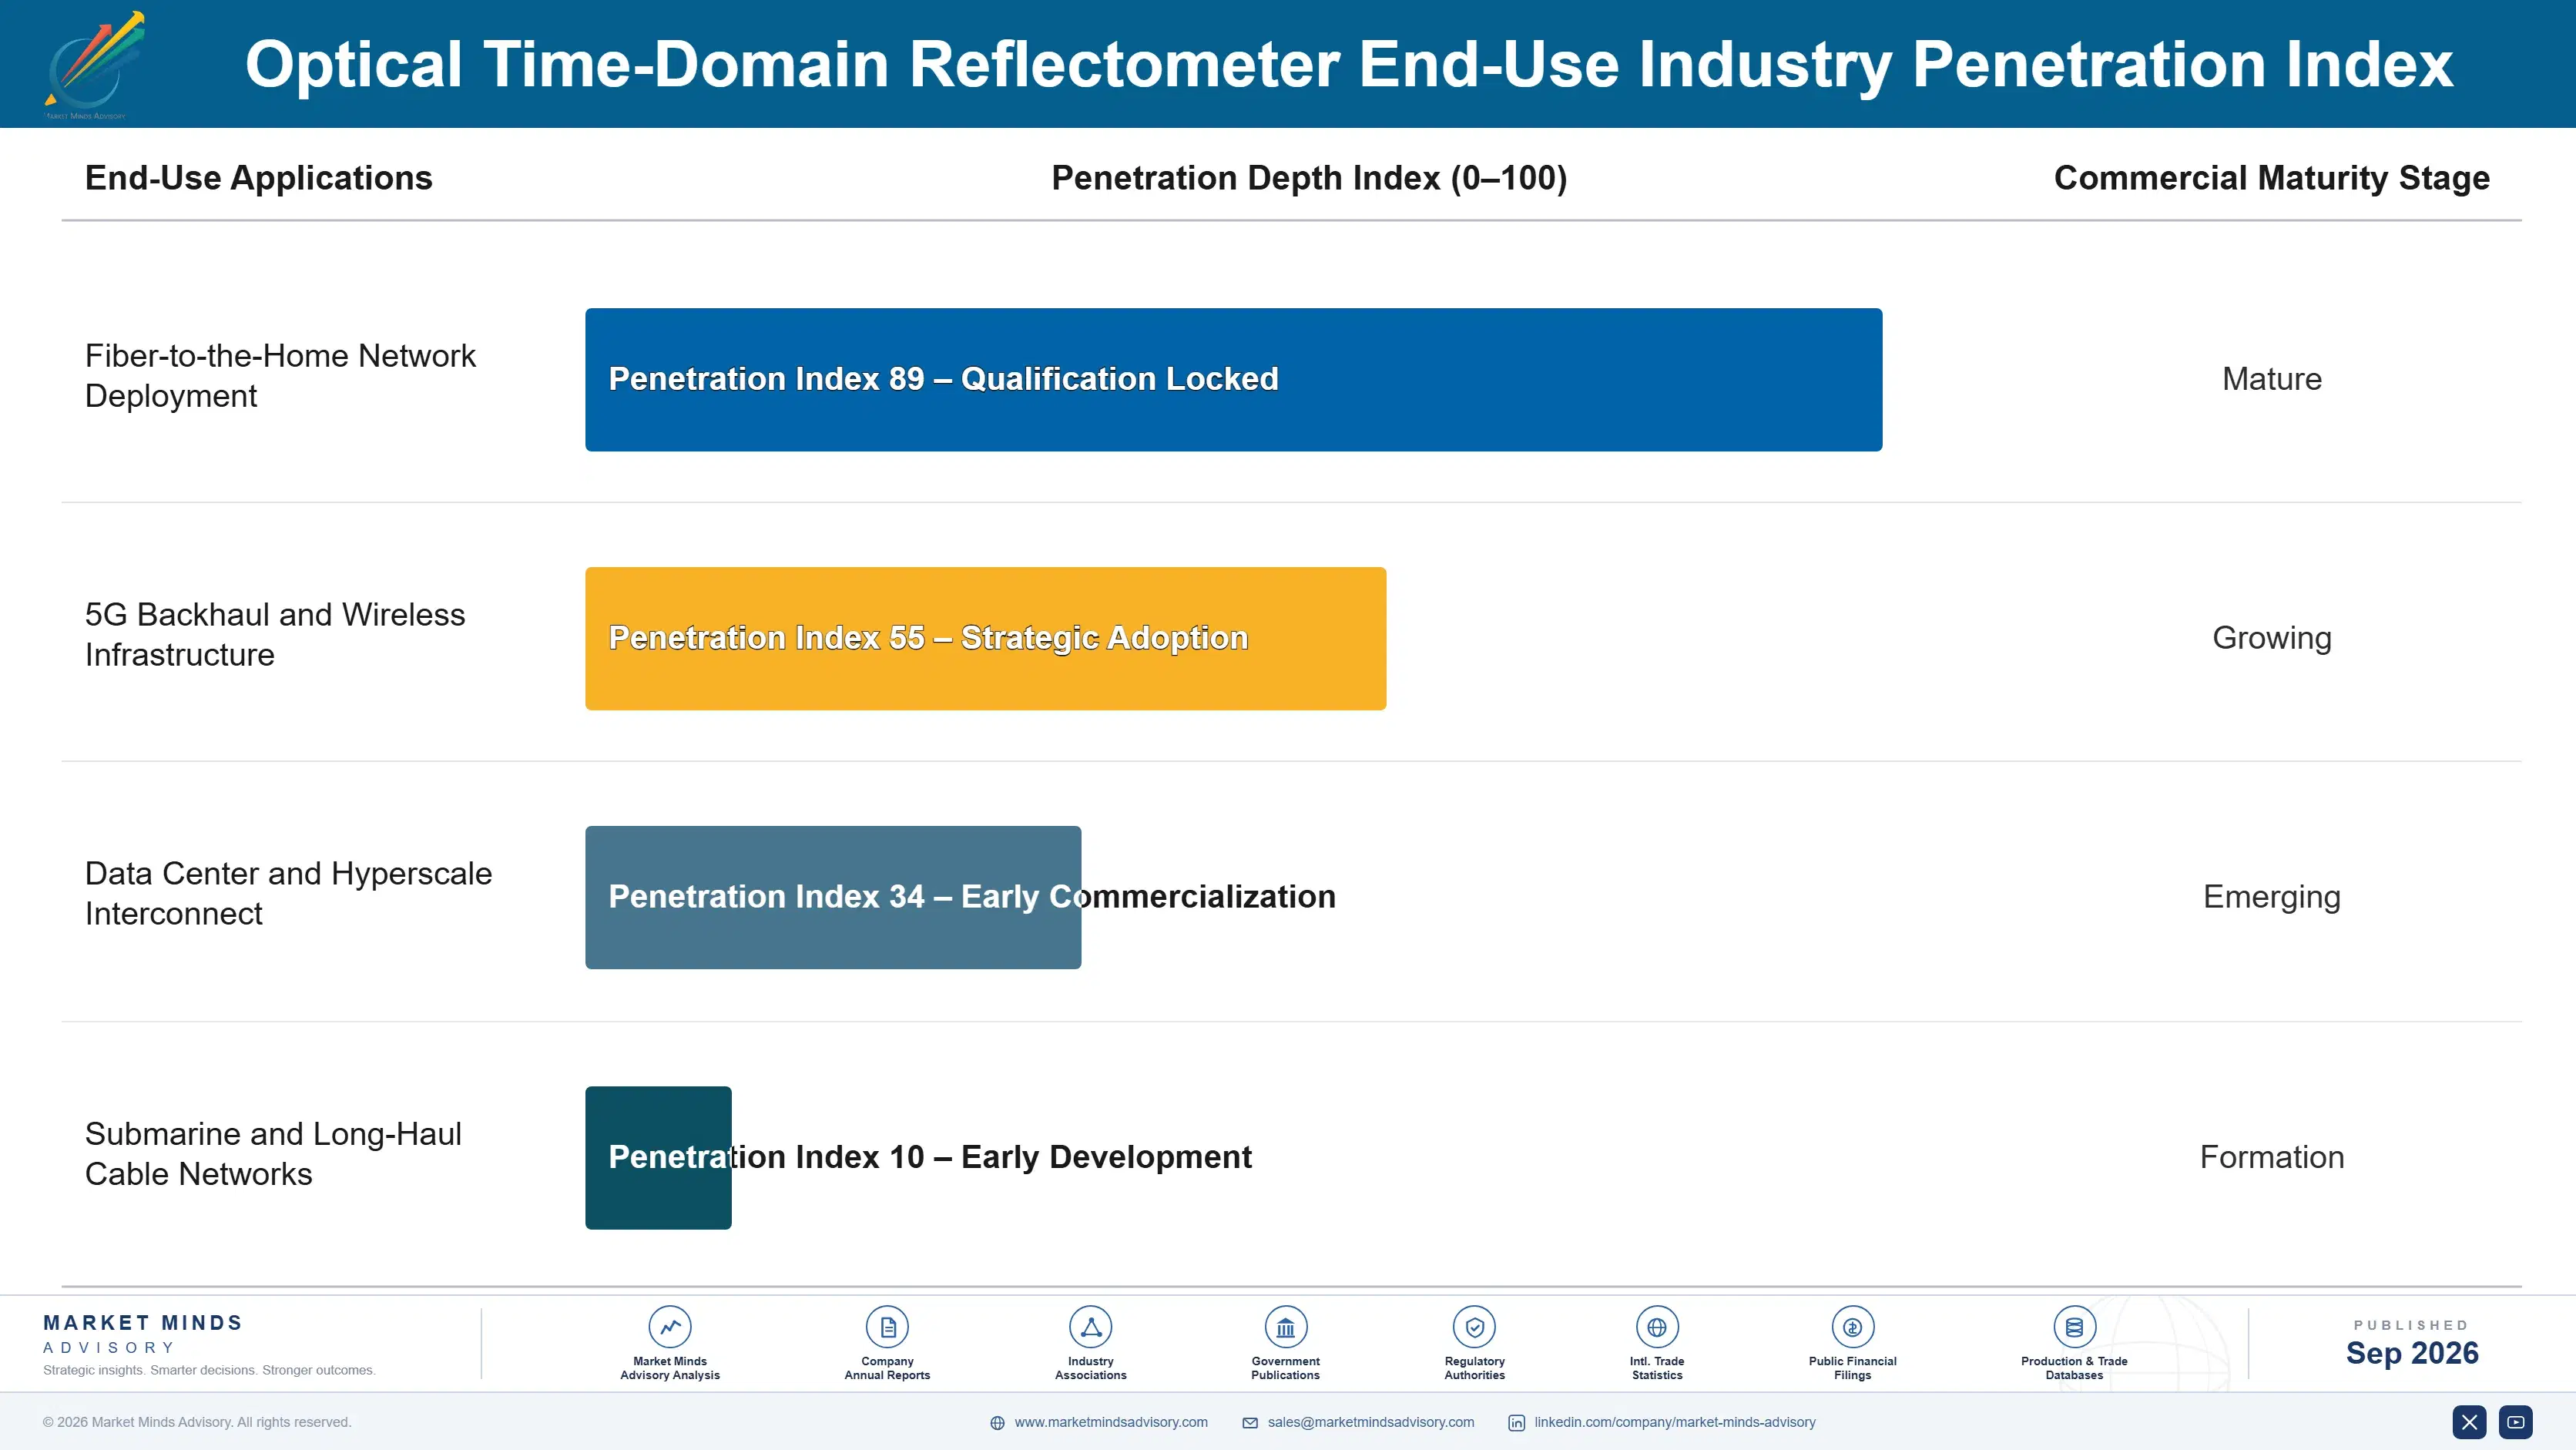
Adoption depth varies considerably by end use vertical: major premium fiber-to-the-home and hyperscale data center integrators show the deepest and most consistent adoption of specialized cloud-connected and automated monitoring technology, mainstream mid-tier telecom operator branches show moderate but accelerating adoption tied to premiumization efficiency goals, and smaller regional network cooperatives remain the shallowest formal adopters, still relying primarily on conventional handheld formulations to control complexity.

Younger digitally native network operations managers entering primary supplier selection decisions increasingly treat diagnostic transparency and rapid deployment refresh cycles as a baseline consideration rather than an optional convenience, a generational shift that is gradually normalizing broader adoption across a wider range of network categories beyond the historically dominant premium fiber-to-the-home early adopter segment. Suppliers slow to adapt engineering culture risk losing relevance among newer procurement cohorts worldwide each year.
optical-time-domain-reflectometer-market-end-use-penetration-index-1788424371425

Where Supplier Investment Should Concentrate

These are among the four positions where our research anticipates prominent divergence between winners and laggards over the coming forecast period. Each is grounded in the demand model, the regulatory perimeter, and the announced capacity pipeline.
01 / CLOUD ANALYTICS PLATFORM INVESTMENT

Build remote diagnostic capability before operator demand accelerates further

Network operators are increasingly standardizing supplier selection criteria around specialized, accurately diagnosed cloud-connected systems faster than suppliers relying on conventional handheld frameworks currently plan for within their commercial roadmaps and engineering development budgets. Suppliers with established cloud analytics capability already report meaningfully higher operator win rates than competitors relying on conventional handheld frameworks alone across comparable program revenue volume. This advantage compounds as more operators require specialized remote diagnostics, a gap unlikely to close soon without deliberate and sustained investment across engineering budgets.
02 / AUTOMATED MONITORING EXPANSION

Secure monitoring capability before specialized firms standardize elsewhere

Network operators typically finalize supplier selection decisions well ahead of program award, meaning suppliers without strong automated monitoring capability risk exclusion from multiple future renewal cycles entirely across their target operator base. Suppliers with established monitoring capability already report securing program growth at meaningfully higher rates than suppliers pursuing conventional wholesale-only coverage independently. Building this capability now, ahead of upcoming program award decisions, costs considerably less than attempting entry after competitors have already locked in monitoring agreements spanning multiple future network generations.
03 / MULTI-NETWORK COMPLIANCE DEVELOPMENT

Invest in compliance before distributor scrutiny intensifies further

Multi-line distributors increasingly favor suppliers with proven multi-network compliance over generic conventional single-network arrangements as certification enforcement accelerates across major jurisdictions worldwide. Suppliers pursuing compliance investment already report meaningfully better revenue outcomes than competitors relying on conventional single-network approval across comparable program accounts. This advantage compounds further as distributors increasingly value consistent compliance depth over marginal cost savings alone, particularly across larger multi-network programs scaling rapidly today across expanding product categories and geographic markets, a trend expected to intensify considerably over time.
04 / OPERATOR RELATIONSHIP DEVELOPMENT

Invest in relationships before regional competition intensifies further

Underserved multi-site operator demand for direct supplier engagement is increasing faster than suppliers relying entirely on conventional single-line focused sales models can efficiently address within typical program acquisition timelines and responsiveness expectations across major operator segments. Suppliers pursuing operator relationship development already report meaningfully higher acquisition rates than competitors relying solely on conventional single-line benchmark distribution across comparable operator categories. This advantage compounds further as more operators formalize direct engagement preferences into their procurement decisions going forward, a pattern expected to intensify over the coming decade.

Engagement Snapshot From the Field

A live engagement with an industry participant carrying material or product regulatory and market exposure ahead of a defining policy shift, showing how our research translates into a defensible multi-year portfolio strategy.
MARKET MINDS ADVISORY · CLIENT ENGAGEMENT SUMMARY
Optical Time-Domain Reflectometer Producer Strategic Portfolio Review and Transition Roadmap 2026·Investment Scenario on Optical Time-Domain Reflectometer Exposure Evaluation 2025-26
CLIENT PROFILE
The client is a mid-sized specialized cloud analytics developer generating approximately 14 million dollars in annual revenue (client-reported, unverified by MMA), historically focused on conventional handheld wholesale contracts without dedicated automated monitoring or certification compliance capability, facing declining growth as larger suppliers continued to expand premium program coverage. Its brand reputation remained solid despite the growth plateau overall today.
STRATEGIC CHALLENGE
Facing eroding operator win rates as premium cloud-connected and automated monitoring competitors continued gaining institutional attention, the client needed to evaluate whether to invest in remote diagnostic engineering design and automated monitoring capability to access these growing segments, without clear visibility into engineering requirements or realistic timelines for securing meaningful revenue growth across its target operator markets regionwide overall.
MMA APPROACH
MMA conducted a remote diagnostic engineering design and automated monitoring market entry feasibility assessment incorporating engineering requirement interviews, capital investment modeling, and competitive benchmarking against established cloud-connected focused suppliers, then developed a phased capability investment roadmap sequenced to the client's available capital and existing engineering infrastructure across multiple operator markets. Deliverables included a detailed risk-adjusted return model.
KEY FINDINGS
  1. Operator procurement offices required a minimum of five months of field testing and certification before considering a new supplier partner across most programs evaluated.
  2. Two major fiber-to-the-home network operators expressed preliminary interest in co-developing the client's cloud analytics platform once specified, scoped, and tested thoroughly ahead of formal budget approval.
  3. Existing engineering infrastructure could be adapted for remote diagnostic capability with moderate capital investment rather than requiring an entirely new engineering model.
  4. Competitive cloud analytics platform positioning offered meaningfully higher revenue growth than the client's existing wholesale business over a multi-year horizon evaluated overall today.
CLIENT PROFILE
The client is a mid-sized specialized cloud analytics developer generating approximately 14 million dollars in annual revenue (client-reported, unverified by MMA), historically focused on conventional handheld wholesale contracts without dedicated automated monitoring or certification compliance capability, facing declining growth as larger suppliers continued to expand premium program coverage. Its brand reputation remained solid despite the growth plateau overall today.
STRATEGIC CHALLENGE
Facing eroding operator win rates as premium cloud-connected and automated monitoring competitors continued gaining institutional attention, the client needed to evaluate whether to invest in remote diagnostic engineering design and automated monitoring capability to access these growing segments, without clear visibility into engineering requirements or realistic timelines for securing meaningful revenue growth across its target operator markets regionwide overall.
MMA APPROACH
MMA conducted a remote diagnostic engineering design and automated monitoring market entry feasibility assessment incorporating engineering requirement interviews, capital investment modeling, and competitive benchmarking against established cloud-connected focused suppliers, then developed a phased capability investment roadmap sequenced to the client's available capital and existing engineering infrastructure across multiple operator markets. Deliverables included a detailed risk-adjusted return model.
KEY FINDINGS
  1. Operator procurement offices required a minimum of five months of field testing and certification before considering a new supplier partner across most programs evaluated.
  2. Two major fiber-to-the-home network operators expressed preliminary interest in co-developing the client's cloud analytics platform once specified, scoped, and tested thoroughly ahead of formal budget approval.
  3. Existing engineering infrastructure could be adapted for remote diagnostic capability with moderate capital investment rather than requiring an entirely new engineering model.
  4. Competitive cloud analytics platform positioning offered meaningfully higher revenue growth than the client's existing wholesale business over a multi-year horizon evaluated overall today.
RECOMMENDED STRATEGY
Phase 1: Phase 1 (Months 1 to 4): Invest in remote diagnostic infrastructure while beginning early operator outreach worldwide each year. Early engineering reviews began concurrently. Phase 2: Phase 2 (Months 5 to 9): Complete field testing and certification across at least two target fiber-to-the-home network operators worldwide overall. Phase 3: Phase 3 (Months 10 to 14): Launch cloud analytics platform coverage while monitoring early revenue metrics closely and adjusting strategy accordingly.
OUTCOME
Within fourteen months of implementation, the client reported securing an initial fiber-to-the-home network operator partnership representing roughly 15 percent of projected future revenue growth and establishing durable remote diagnostic capability beyond its historical wholesale business, with a second operator partnership under active negotiation (client-reported, unverified by MMA).

Frequently Asked Questions

Foundational context covering the market sizes, CAGR, scope, country, region and competition that inform every finding below. This section is provided to cover basics and most often pre-purchase conversations, answered from the MMA Primary Research Dataset.

What is the current size of the Optical Time-Domain Reflectometer Market?

The Optical Time-Domain Reflectometer Market is valued at approximately 0.68 billion dollars in 2025, spanning handheld, modular, and cloud-connected categories worldwide. Growth reflects sustained fiber buildout demand.

How large will the Optical Time-Domain Reflectometer Market be by 2036?

The market is projected to reach roughly 1.46 billion dollars by 2036, driven by expanding cloud analytics adoption and growing automated monitoring premiumization across nearly every major network market worldwide.

What is the CAGR for the Optical Time-Domain Reflectometer Market 2026 to 2036?

The market is expected to grow at a compound annual growth rate of approximately 7.2 percent between 2026 and 2036, reflecting steady fiber buildout driven expansion globally across nearly the entire forecast period.

Which segment is growing fastest?

Cloud-connected OTDR software and analytics platforms are the fastest growing segment, expanding at roughly 1.7 times the overall market rate as remote diagnostic adoption accelerates across major network markets worldwide.

Who are the major companies in the Optical Time-Domain Reflectometer Market?

Leading companies include EXFO Inc, Viavi Solutions Inc, Yokogawa Electric Corporation, and Anritsu Corporation, each investing heavily in cloud analytics capability across multiple product categories worldwide.

Which country is growing fastest?

India is the fastest growing country market, supported by its substantial fiber broadband rollout expansion and BharatNet capital investment leadership nationwide across most metropolitan regions overall today.

Report Segmentation Architecture

The full report scope spans multiple orthogonal segmentation dimensions, with cross-tabulated demand data provided for each dimension pair. Coverage extends further to regional breakdowns, trend trajectories, and the competitive detail needed to support segment-level decision-making.

By Product and Technology Type

  • Handheld OTDR Test Instruments
  • Modular and Rack-Mounted OTDR Systems
  • High-Resolution OTDR for Short-Reach Testing
  • Long-Haul and Submarine Cable OTDR Systems
  • Automated Fiber Test and Monitoring Platforms
  • Cloud-Connected OTDR Software and Analytics Platforms

By End-Use Industry

  • Fiber-to-the-Home Network Deployment
  • 5G Backhaul and Wireless Infrastructure
  • Data Center and Hyperscale Interconnect
  • Submarine and Long-Haul Cable Networks

By Commercial Dimension

  • Direct Network Operator Contracts
  • Test Equipment Distributor Wholesale Channels
  • Field Service Rental and Leasing Programs

By Region

  • North America
  • Western Europe
  • East Asia
  • South Asia and Pacific
  • Latin America
  • Middle East and Africa
  • Eastern Europe

Scope, Methodology, and Coverage

Every figure in this report is reproducible from documented input assumptions. The scope below maps the historical period, the forecast horizon, the segmentation dimensions, and the countries covered, alongside the underlying primary and qualitative methodology.
Historical Period
2020 to 2025
Forecast Period
2026 to 2036
Base Year
2025 (USD billions; MMA Primary Research Dataset, September 2026)
Market Definition
The optical time-domain reflectometer market covers commercial revenue generated by suppliers producing handheld OTDR test instruments, modular and rack-mounted OTDR systems, high-resolution OTDR for short-reach testing, long-haul and submarine cable OTDR systems, automated fiber test and monitoring platforms, and cloud-connected OTDR software and analytics platforms. It excludes general fiber optic cable manufacturing revenue and excludes standalone network management software revenue unrelated to fiber testing reported separately.
Quantitative Units
USD billions (current prices); deployed field unit count figures for select operating metrics
Segmentation Dimensions
By Product and Technology Type; By End-Use Industry; By Commercial Dimension; By Region
Regions Covered
North America, Western Europe, East Asia, South Asia and Pacific, Latin America, Middle East and Africa, Eastern Europe
Countries Covered
United States, Canada, Germany, France, UK, China, Japan, South Korea, India, Australia, Indonesia, Vietnam, Brazil, Mexico, Colombia, Chile, UAE, Saudi Arabia, South Africa, Nigeria, Egypt, Poland, Romania, Russia, and additional comparative markets
Key Companies Profiled
EXFO Inc, Viavi Solutions Inc, Yokogawa Electric Corporation, Anritsu Corporation, Fluke Corporation, Keysight Technologies Inc, Fortive Corporation, AFL Telecommunications LLC, Grandway Optics Shenzhen Co Ltd, Deviser Instruments Co Ltd, Kingfisher International Inc, GAO Tek Inc, OFS Fitel LLC, Corning Incorporated, Sumitomo Electric Industries Ltd, IDEAL INDUSTRIES Inc, VeEX Inc, Noyes Fiber Systems, Tempo Communications Inc, 3Z Telecom Inc
Quantitative Methodology
Primary survey, n=3,800 respondents, Q4 2025, six countries; demand-side model with trade association cross-validation
Qualitative Methodology
47 expert interviews, Q4 2025; applied to validate demand model assumptions, identify emerging dynamics, and assess competitive positioning
Report Format
PDF and XLSX data workbook (Word format preview document)
Publisher
Market Minds Advisory
Report Code
MMA-2026-TEC-122
Published
September 2026
Contact
sales@marketmindsadvisory.com | www.marketmindsadvisory.com

Purchase the full Optical Time-Domain Reflectometer Market Report (2026 to 2036).

The full report delivers a complete quantitative and qualitative assessment of the optical time-domain reflectometer market, including detailed segment level forecasts through 2036, country-level analyses across the world's largest network markets, and profiles of twenty leading suppliers. It incorporates primary survey data from 3,800 respondents and 47 expert interviews conducted in the fourth quarter of 2025. Buyers receive editable data tables, a customizable Excel forecast model, and access to MMA analysts for follow up questions during a defined post purchase support window. The report also includes a detailed cloud analytics landscape assessment calibrated to current operator benchmarks.
Detailed segment-level market forecasts through 2036
Country-level analyses across major network markets
Twenty profiled leading global suppliers included
Editable Excel based forecast data model
Primary survey and expert interview data
Extended post-purchase analyst support access window

Built For The People Who Decide

From boardroom strategy to bench-side execution, this report is read cover-to-cover by leaders shaping the next decade of their industry, turning demand scenarios, market dynamics and valuation benchmarks into decisions.
CXOs/ Presidents/ VPs/ Managers
M&A and Corporate Development
Strategy Teams and R&D Heads
Procurement and Product Directors
Regulatory and Compliance Leaders
Investor Relations and Equity Analysts