Market Minds Advisory
Optical Switches Market

Optical Switches Market: Optical Switches Market: Insertion Loss Budgets, Operator Conservatism and Photons Nobody Trusts To Route 2026 to 2036

Switching light without converting it saves enormous power, and network operators still convert it anyway because they can see what the electronics are doing. Trust rather than physics limits it.

Lead Analyst

Published

September 2026

Make Smarter Decisions with Customized Research Insights

Request a free sample report and evaluate market opportunities, growth trends, and competitive dynamics relevant to your business needs.

2025 MARKET VALUE$3.4BMarket Size 2025
2036 FORECAST VALUE$11.0BBase Case , 2026 to 2036
CAGR 2026 TO 203611.3 %Bull 12.6% / Bear 10.0%
INCREMENTAL OPPORTUNITY$7.2BNet 10- year value creation
EXPANSION MULTIPLE2.89x2036 value over 2026 base
Strategic Levers
M&A Pipeline
Regional Outlook
Country Rankings
Competitive Intelligence
Segmental Deep-dive
Call-Us : 91 93563 13602

Executive Snapshot and Market Trajectory.

Switching light without converting it to electricity saves enormous power, and network operators convert anyway because they can see what the electronics are doing. Trust rather than physics is what has limited this market for two decades. Routing light avoids around 72% of the switching energy.
The market reaches USD 3.8 billion in 2026 and USD 11.0 billion by 2036, a 2.89 times expansion at 11.3% annually. Optical circuit switches for accelerator fabrics grow at 17.0%, half again the market rate of 11.3%, because compute clusters need reconfigurable topology at power budgets electrical switching cannot meet. East Asia holds 34% of consumption on data centre construction. Insertion loss budgets constrain placement further.
Five suppliers hold 54% of consumption value, and the position rests on qualification in operator networks rather than on switching technology. Lumentum, Coherent, Calient Technologies, Polatis and NTT Electronics lead. Insertion loss budget acceptance decides which switches reach a live network at all. Around 61% of shipments arrive embedded inside transport equipment rather than as standalone products, because operators accept switching they never had to justify separately to anybody. Qualification inside equipment platforms decides supply.
Market Definition
This report covers optical switches: devices that route optical signals between paths without converting them to electrical form. It spans optical circuit switches for accelerator and data centre fabrics, wavelength selective switches for transport networks, reconfigurable optical add-drop modules, protection and restoration switches for network resilience, test and measurement optical switching, and the control software supplied with them. It excludes electrical packet switches, optical transceivers and transponders, optical amplifiers, passive splitters and couplers, and complete transport network systems.
Base Year Value
$3.4B in 2025 (MMA Primary Research Dataset, September 2026)
Forecast Period
2026 to 2036, eleven discrete annual values
CAGR
11.3% base case. Bull 12.6%. Bear 10.0%.
Fastest Growth Segment
Optical Circuit Switches For Accelerator Fabrics: 17.0% CAGR
Fastest Growth Country
India: 18.5% CAGR
Fastest Growth Region
South Asia and Pacific: 13.6% CAGR
Largest Region
East Asia: 34% of 2025 global value
Market Leaders
Lumentum, Coherent, Calient Technologies, Polatis and NTT Electronics lead on optical switch consumption value. Source: MMA Analysis.
Primary Survey
n=3,800 procurement and R&D decision-makers, Q4 2025, six countries
Methodology
Demand-side build-up, cross-validated against public data, 47 expert interviews

Optical Switches Market Forecast Scenarios

optical-switches-market-size-forecast-scenario-1790004213372
Between 2020 and 2025 the category compounded at 9.9%, carried almost entirely by wavelength selective switches inside transport equipment rather than by any standalone optical switching. Operators bought what their transport vendors built in and declined optical switching everywhere else, because a device that routes light gives no visibility into what it is carrying and troubleshooting becomes considerably harder.
The base case holds 11.3% on three mechanisms. Accelerator cluster fabrics keep needing reconfigurable topology at power budgets electrical switching cannot meet at the port counts involved. Transport networks keep adding wavelength selective switching as capacity grows and manual patching becomes impractical. And data centre construction keeps proceeding in regions where designs are being specified rather than retrofitted onto existing electrical fabrics. Those three mechanisms run largely independently of one another across the forecast.
The bull case at 12.6% assumes accelerator cluster scale keeps rising, since optical circuit switching becomes more compelling with every additional port and every additional watt of electrical switching avoided. The bear case at 10.0% is operator conservatism holding, where optical switching stays confined to transport equipment and the visibility objection continues to block deployment everywhere else in the network.

Light Nobody Wants To Route

The physics argument has been won for years and it changed almost nothing. Routing light rather than converting and switching it avoids around 72% of the energy, which any network engineer accepts immediately. What they will not accept is losing visibility into traffic they can no longer inspect, because troubleshooting a fault through an optical path is considerably harder than through electronics that report their own state.
TOP FIVE CONCENTRATION54%Held by suppliers qualified inside operator transport equipment platforms
INSERTION LOSS BUDGET3 decibelsTypical loss a switch may consume within a link budget
SWITCHING TIME REQUIREMENT25 millisecondsReconfiguration speed protection applications demand from a switch
TRANSPORT EMBEDDED SHARE61%Switches shipping inside transport equipment rather than as standalone products
POWER SAVING AGAINST ELECTRICAL72%Energy avoided by routing light instead of converting and switching
ACCELERATOR FABRIC SHARE17%Consumption serving compute cluster fabrics rather than transport networks
Loss budgets decide what is physically possible. A switch may typically consume around three decibels of a link budget, and every decibel spent on switching is one unavailable for distance or for margin. That constraint governs where a switch can be placed regardless of what it costs, and it is why suppliers compete on insertion loss and port count rather than on price in most transport applications.
The growth is happening inside compute rather than transport. Around 17% of consumption now serves accelerator cluster fabrics, where reconfigurable topology at very high port counts cannot be delivered electrically within any acceptable power budget. Optical circuit switches for accelerator fabrics grow at 17.0% against 11.3% for the market, and that buyer weighs power and port count rather than operator visibility concerns.
"Every operator engineer agrees optical switching saves power and then explains why they will not put one in the path. It is not the physics. It is that when something breaks at three in the morning they want to see packets, and a mirror does not tell you anything."
Director, Optical Networking and Photonic Systems Practice · MMA Technology Practice · September 2026

Market Trends

Visibility Concerns Outweigh The Power Argument

Routing light rather than converting and switching avoids around 72% of the energy, which network engineers accept without argument. What blocks deployment is losing visibility into traffic that can no longer be inspected, since troubleshooting through an optical path is considerably harder than through electronics reporting their own state. That objection is operational rather than technical and no efficiency improvement addresses it, which is why the category grew slowly for two decades. Optical performance monitoring built into the switch addresses the objection directly rather than arguing against it, which is the only route into operator networks.
Market Impact: India compounds at 18.5% yearly
Accelerator Fabrics Buy On Power And Port Count

Around 17% of consumption now serves accelerator cluster fabrics, where reconfigurable topology at very high port counts simply cannot be delivered electrically within any acceptable power budget. Optical circuit switches for those fabrics grow at 17.0% against 11.3% for the market. That buyer weighs watts and ports rather than the traffic visibility concerns that govern operator networks, which makes it a fundamentally different commercial conversation. Cluster operators also specify architecture directly with component suppliers rather than through transport equipment vendors, which changes who a supplier must reach entirely. Different buyer entirely.
Market Impact: Embedded covers 61% of shipments

Market Opportunities and Growth Drivers

Cluster Scale Makes Electrical Switching Impractical

Compute clusters keep growing in port count and every additional tier of electrical switching consumes power and rack space the accelerators need instead. Optical circuit switching becomes more compelling with each additional port rather than less, which reverses how most technologies scale commercially. India compounds at 18.5% partly on data centre construction where fabric architecture is specified at design stage rather than retrofitted onto electrical infrastructure already installed. Optical circuit switches for those fabrics grow at 17.0% against 11.3% for the market as cluster scale keeps rising. Scale favours optical.
Market Impact: Switches consume 3 decibels typically

Transport Capacity Growth Ends Manual Patching

Transport networks adding wavelength capacity reach a point where manual fibre patching for provisioning and restoration becomes impractical at the scale involved. Wavelength selective switching inside transport equipment already accounts for around 61% of shipments, and that embedded position grows with network capacity regardless of any standalone deployment. Operators accept switching they did not have to specify separately far more readily than switching they must justify themselves. Suppliers selling through transport equipment vendors reach deployments that direct sales have never once achieved in this category anywhere. Margin is lower there.
Market Impact: Embedded switching covers 61%

Market Restraints and Challenges

Loss Budgets Limit Where Switches Can Sit

A switch typically consumes around three decibels of a link budget, and every decibel spent on switching is unavailable for reach or for operating margin. The root cause is that optical paths have a fixed power budget set by transmitter, receiver and fibre characteristics. Commercially this constrains placement regardless of price. Mitigation runs through lower loss switching architectures, through amplification placed to compensate, and through applications where link budgets are comfortable rather than marginal. Reducing insertion loss is harder engineering than adding ports and it opens applications price competition cannot reach.
Market Impact: Optical avoids 72% of energy

Operators Will Not Give Up Traffic Visibility

Network engineers decline optical switching in paths where they need to inspect traffic, because a device routing light reports nothing about what it carries and fault isolation becomes considerably slower. The root cause is that operational practice is built around electrical monitoring points. Commercially this confines optical switching to specific applications. Mitigation runs through optical performance monitoring built into switches, through hybrid designs retaining tap points, and through applications where visibility matters less. Cluster fabric buyers never raise this objection, which is why the category grows fastest there rather than in operator networks.
Market Impact: Fabrics take 17% of consumption
3 additional market trends, 4 additional growth drivers, and 2 additional restraints and challenges are covered in the full report. Contact sales@marketmindsadvisory.com to access the complete intelligence.

Segment CAGR and Growth Architecture

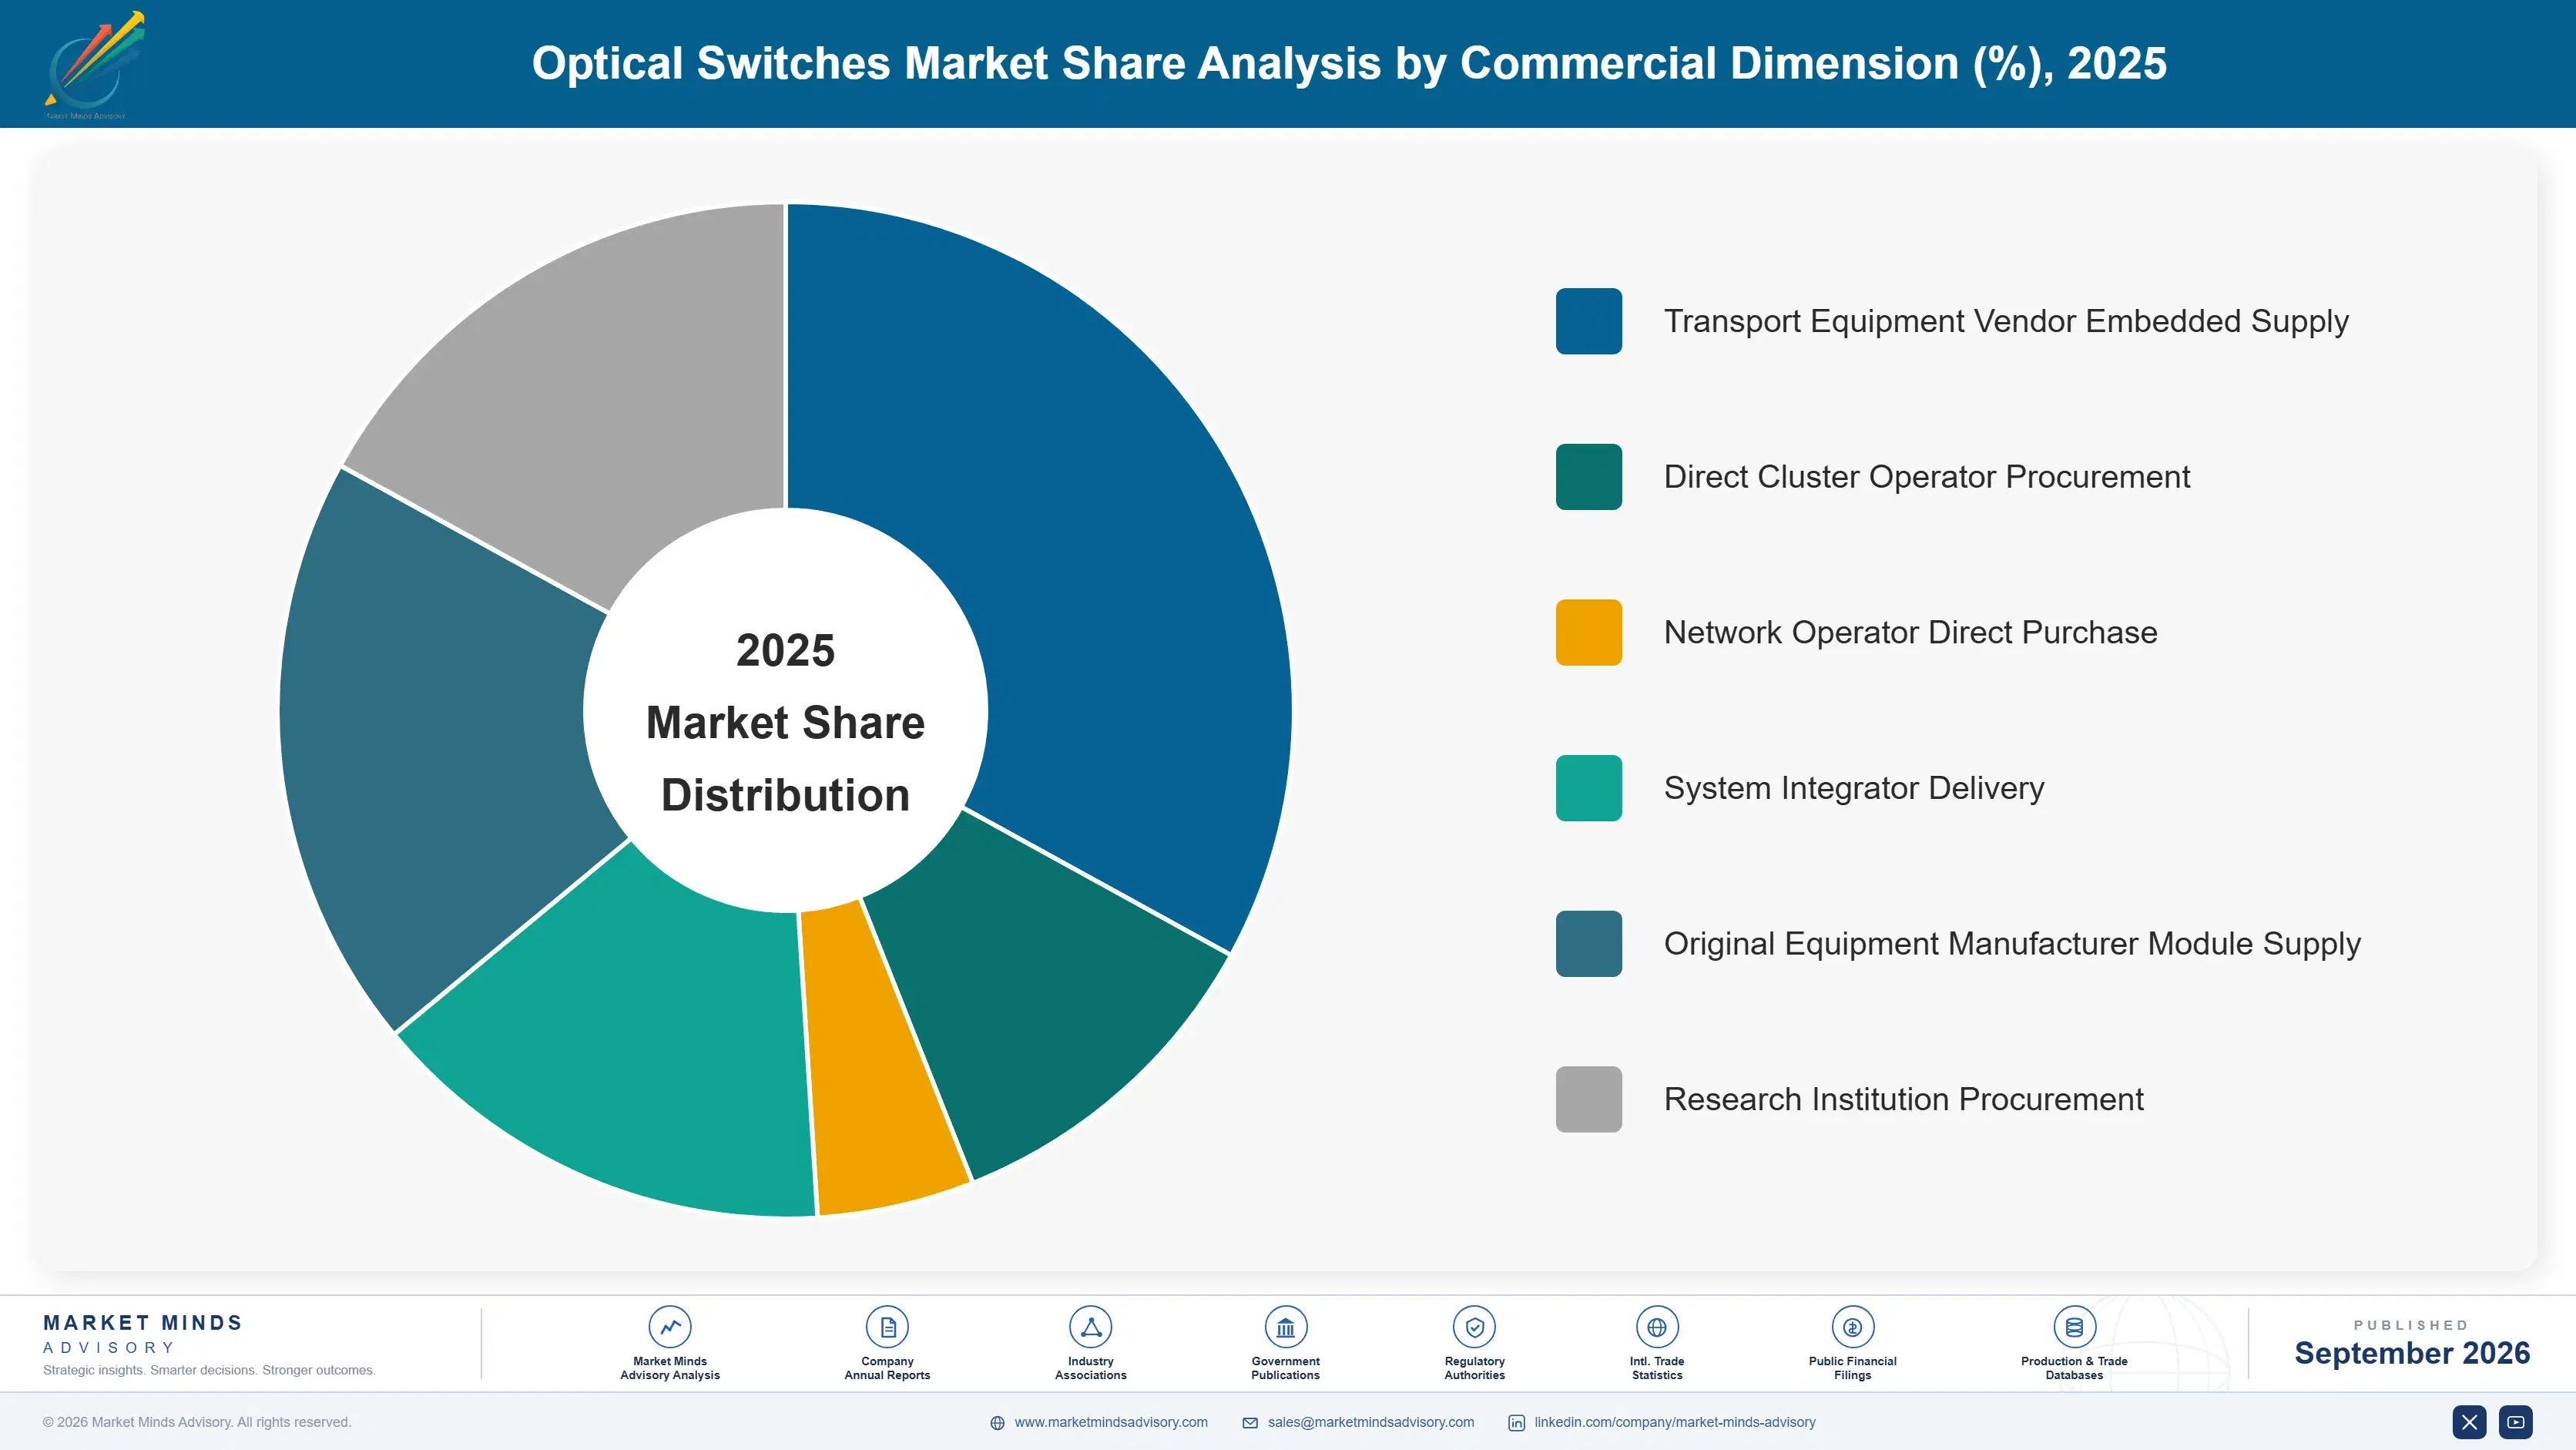
Segmentation follows switch type and application, since each carries quite different loss budget, switching speed requirement and buyer behaviour. Six classes cover the market: optical circuit switches for accelerator fabrics, wavelength selective switches for transport, reconfigurable optical add-drop modules, protection and restoration switches, test and measurement optical switching, and switch control software. Network type sits elsewhere.
optical-switches-market-market-share-analysis-1790004213918

Optical Circuit Switches For Accelerator Fabrics

Optical circuit switches for accelerator fabrics grow at 17.0%, half again the market rate of 11.3%, because reconfigurable topology at very high port counts cannot be delivered electrically within any power budget a cluster operator will accept. Around 17% of consumption already serves these fabrics. This buyer weighs watts and ports rather than the traffic visibility concerns governing operator networks, which makes it commercially distinct and considerably easier to sell into than transport applications have ever been. Port counts that fabrics need demand automated alignment, since manual precision assembly cost rises directly with every additional port added. That is a manufacturing constraint rather than an optical one, and it decides who can serve this growth.
CAGR 17.0%

Wavelength Selective Switches For Transport

Wavelength selective switches for transport compound at 12.4% because network capacity growth makes manual fibre patching impractical for provisioning and restoration at the scale operators now run. These devices ship inside transport equipment rather than as standalone products, and around 61% of category shipments arrive that way. Operators accept switching they did not have to specify separately far more readily than switching they must justify themselves, which is why the embedded route dominates so completely. Transport vendor qualification rather than any operator relationship is what determines who ships in volume here. Operators would decline the same device if asked to specify and justify it separately themselves. Embedded supply dominates. Volume follows equipment.
CAGR 12.4%
Full segment breakdown across 6 segments available in the complete report.

Regional Architecture and Country Demand Map

East Asia holds 34% of consumption, above the usual band, because data centre construction and optical component manufacturing both concentrate there at scale. North America follows at 26% on accelerator cluster deployment and transport equipment design. India compounds fastest at 18.5% on data centre construction.

East Asia

East Asia takes 34% of consumption, above the 30% band ceiling, because data centre construction and optical component manufacturing both concentrate here at scale and switches are consumed where networks are built. Chinese operators deploy transport equipment at volumes that make embedded wavelength selective switching a very large market on its own. Japanese suppliers including NTT Electronics hold genuine switching technology positions. Growth at 12.4% runs above the global rate on construction rather than on any operator behaviour change. Component manufacturing scale also supports cost positions that suppliers elsewhere cannot approach on comparable devices. Transport volume alone is enormous here. Construction rather than conversion drives regional demand across every application here.
Share: 34% | CAGR: 12.4% (2026 to 2036)

North America

North America accounts for 26% of consumption, where accelerator cluster deployment is most advanced and where transport equipment design concentrates regardless of manufacturing location. Calient Technologies and Lumentum both operate from here, and cluster operators weigh power and port count rather than the visibility objections governing operator networks. Growth at 11.9% sits above the global rate on accelerator fabric deployment rather than on any transport network expansion happening across the region. Cluster operators here specify switch architecture directly rather than accepting what transport equipment vendors happen to embed. Fabric deployment is furthest advanced anywhere in the world. Transport networks add steadier embedded demand alongside cluster fabric growth. Design concentrates here.
Share: 26% | CAGR: 11.9% (2026 to 2036)
Regional intelligence for 5 additional markets available in the complete report: Western Europe, South Asia and Pacific, Latin America, Middle East and Africa, Eastern Europe. Contact sales@marketmindsadvisory.com.
optical-switches-market-country-cagr-analysis-1790004214432

Where Optical Switching Gets Deployed

Operator visibility concerns rather than physics limit deployment, loss budgets constrain placement regardless of price, and the growth has moved into compute fabrics where different arguments apply. The four levers below follow those conditions rather than any argument about switching efficiency. Each addresses an operational or commercial condition rather than a technical one. Physics settled long ago.

Sell Watts And Ports To Cluster Operators

Around 17% of consumption serves accelerator fabrics where reconfigurable topology at high port counts cannot be delivered electrically inside any acceptable power budget. Optical switching avoids around 72% of the energy, and that buyer weighs watts and ports rather than traffic visibility. Suppliers pitching operators on efficiency are addressing people who accepted the physics years ago and still declined, while cluster operators simply need the ports. Ports are what they lack. Operators accepted the physics years ago and declined on operational grounds regardless. Cluster operators simply need the ports. Watts decide it.
Market Impact: Optical now avoids fully 72% of switching energy

Ship Inside Transport Equipment Rather Than Beside It

Around 61% of shipments arrive embedded in transport equipment rather than as standalone products, because operators accept switching they did not have to specify separately far more readily than switching they must justify. Suppliers selling through transport equipment vendors reach deployments that direct sales never achieve. The margin is lower and the volume is where the market actually is, which is a trade most specialists resist too long. Volume follows the equipment. Around 61% of shipments already arrive this way, which tells you where the market genuinely is. Specialists resist too long.
Market Impact: Embedded now covers a full 61% of all shipments

Compete On Insertion Loss Before Anything Else

A switch typically consumes around 3 decibels of a link budget and every decibel spent switching is unavailable for reach or margin, which constrains placement regardless of price or feature set. Suppliers reducing loss expand where their devices can physically sit. That is a harder engineering problem than adding ports and it opens applications that price competition cannot reach, since a switch outside the budget is simply not deployable. Placement rather than price is what a loss budget actually decides for a supplier. A switch outside the budget is simply not deployable.
Market Impact: Switches now consume 3 decibels of link budget

Build Monitoring Into The Optical Path

Network engineers decline optical switching where they need to inspect traffic, because a device routing light reports nothing about what it carries and fault isolation slows considerably. Optical performance monitoring built into the switch addresses the actual objection rather than arguing against it. That capability reaches deployments in operator networks that efficiency arguments have failed to win for the better part of two decades. Around 61% of shipments already avoid the objection by arriving embedded, which leaves the remaining direct market waiting for exactly this capability. Two decades of arguing achieved nothing.
Market Impact: Embedded switching now covers a full 61% today

Who Controls the Margin Pool

Five suppliers hold 54% of optical switch consumption, and that position rests on qualification inside operator transport equipment platforms rather than on any switching technology advantage between comparable devices. Lumentum, Coherent, Calient Technologies, Polatis and NTT Electronics lead. All participants are assessed on optical switch consumption value rather than on broader photonics, transceiver or component businesses they also operate. Concentration has held because transport vendor qualification takes years and cannot be bought by anybody entering now.
Competition runs on insertion loss performance and transport vendor qualification far more than on switching speed, which exceeds most application requirements already. The second dimension is accelerator fabric capability, because that buyer weighs power and port count and is growing considerably faster than transport applications are. Switching speed competes a distant third behind both of those.

Pressure is emerging from cluster operators specifying switch architecture directly with component suppliers rather than through equipment vendors. Rankings shift where accelerator fabrics deploy and where data centre construction proceeds, particularly across India, China and North America at present. Suppliers reaching only the embedded route carry the most exposure to that shift. Direct fabric relationships are where positions are now being established.
optical-switches-market-company-positioning-matrix-1790004214954

Competitive Moat and Risk Dimensions

LUMENTUM

Moat: Transport Vendor Qualification

Lumentum holds qualification inside transport equipment platforms where around 61% of optical switch shipments arrive embedded rather than standalone. Operators accept switching they did not specify separately far more readily than switching they must justify themselves. Competitors selling directly to operators face a visibility objection that equipment vendors never have to answer on their behalf at all.
LUMENTUM

Risk: Fabric Application Distance

Accelerator fabrics grow at 17.0% against 11.3% for the market and cluster operators specify switch architecture directly rather than through transport equipment vendors. Qualification inside transport platforms reaches none of that demand. A position built on the embedded route grows with transport capacity rather than with the compute construction expanding much faster alongside it.
CALIENT TECHNOLOGIES

Moat: High Port Count Switching

Calient built optical circuit switching at port counts that accelerator fabrics need and electrical switching cannot deliver within acceptable power budgets. Around 17% of consumption already serves those fabrics and the segment grows fastest in this market. That buyer weighs watts and ports rather than the traffic visibility concerns that have limited operator deployment for two decades.
CALIENT TECHNOLOGIES

Risk: Customer Concentration Exposure

Accelerator fabric demand concentrates among a small number of very large cluster operators whose architecture decisions can change between generations. A supplier positioned for that application depends on a handful of buyers rather than on many operators. Transport applications are slower growing and considerably more distributed, which is a stability that fabric-focused suppliers give up entirely.

Players Tracked

Prominent Players

Lumentum
Coherent
Calient Technologies
Polatis
NTT Electronics

Other Key Players

Fujitsu
Nokia
Ciena
Infinera
Molex
DiCon Fiberoptics
Agiltron
Sercalo Microtechnology
Thorlabs
Santec
Keysight Technologies
Huawei Technologies
Accelink Technologies
O-Net Technologies
Boston Applied Technologies

Recent Developments

MARCH 2025

Cluster Operators Specify Optical Circuit Switching Directly

Large compute cluster operators specified optical circuit switch architecture directly with component suppliers rather than through transport equipment vendors, a procurement development rather than any corporate transaction. Around 17% of consumption now serves accelerator fabrics where reconfigurable topology at high port counts cannot be delivered electrically within acceptable power budgets.
Signal: Cluster operators buy on watts and ports where network operators buy entirely on operational visibility instead.
SEPTEMBER 2024

Transport Capacity Growth Ends Manual Patching Practice

Operators expanded wavelength selective switching inside transport equipment as capacity growth made manual fibre patching impractical for provisioning and restoration, a network operations development rather than any acquisition. Around 61% of optical switch shipments arrive embedded in equipment rather than as separately specified standalone products.
Signal: Operators accept embedded switching that they would decline outright if asked to specify it for themselves.
JUNE 2025

Indian Data Centre Construction Specifies Fabric At Design

Indian data centre construction specified optical fabric architecture during design rather than retrofitting it onto installed electrical infrastructure, a specification development rather than any corporate event. India compounds at 18.5%, and design stage decisions avoid entirely the constraints that retrofit into running electrical fabrics imposes on operators elsewhere.
Signal: Design stage fabric decisions avoid the retrofit constraints that block conversion in older running facilities elsewhere.

What An Optical Switch Costs

Optical components including micromirrors, liquid crystal elements and collimators absorb roughly 41% of switch cost, and low loss variants carry substantial premiums over standard parts. Precision alignment and assembly take around 26%, which is labour intensive and difficult to automate at the tolerances involved. Test and characterisation absorb about 15%, with control electronics and software taking the remaining balance.
Precision optical component costs rose through 2023 and 2024 as photonics demand outpaced specialist supply while skilled alignment labour became harder to recruit across every manufacturing region. Lumentum Annual Report 2024 and Coherent Annual Report 2024 both record component availability and manufacturing labour among principal operating variables. Suppliers with automated alignment capability absorbed considerably less of that increase than those relying on manual precision assembly.

The competitive disadvantage mechanism is alignment labour rather than component price. A supplier assembling switches through manual precision alignment carries cost scaling directly with port count, while one with automated alignment does not. Exposure concentrates among suppliers building high port count devices manually, since that is precisely where accelerator fabric demand is growing and where manual assembly cost rises fastest with every added port.
optical-switches-market-cost-volatility-analysis-1790004215153

Automate Precision Alignment Before Scaling Port Counts

Precision alignment and assembly absorb around 26% of switch cost and that expense scales directly with port count in manual processes. Automated alignment converts a labour constraint into a capital one that scales far better. It is the only route to building the high port count devices accelerator fabric demand requires. Capital scales better.

Qualify Low Loss Component Supply Across Multiple Sources

Optical components absorb roughly 41% of switch cost and low loss variants carry substantial premiums from a specialist supply base that expanded slowly. Multiple qualified sources protect availability and pricing on parts determining insertion loss. Qualification takes months and delivers nothing until an interruption makes it necessary. Advance qualification is the only protection available against a single source failing.

Design Test Coverage Into The Switch Itself

Test and characterisation absorb about 15% of cost and rise with port count as every path requires verification during manufacture. Built-in monitoring reduces factory test time while simultaneously addressing the visibility objection that limits operator deployment. That dual return makes the engineering investment considerably easier to justify than either benefit would be on its own.

Portfolio Architecture for Margin Defence

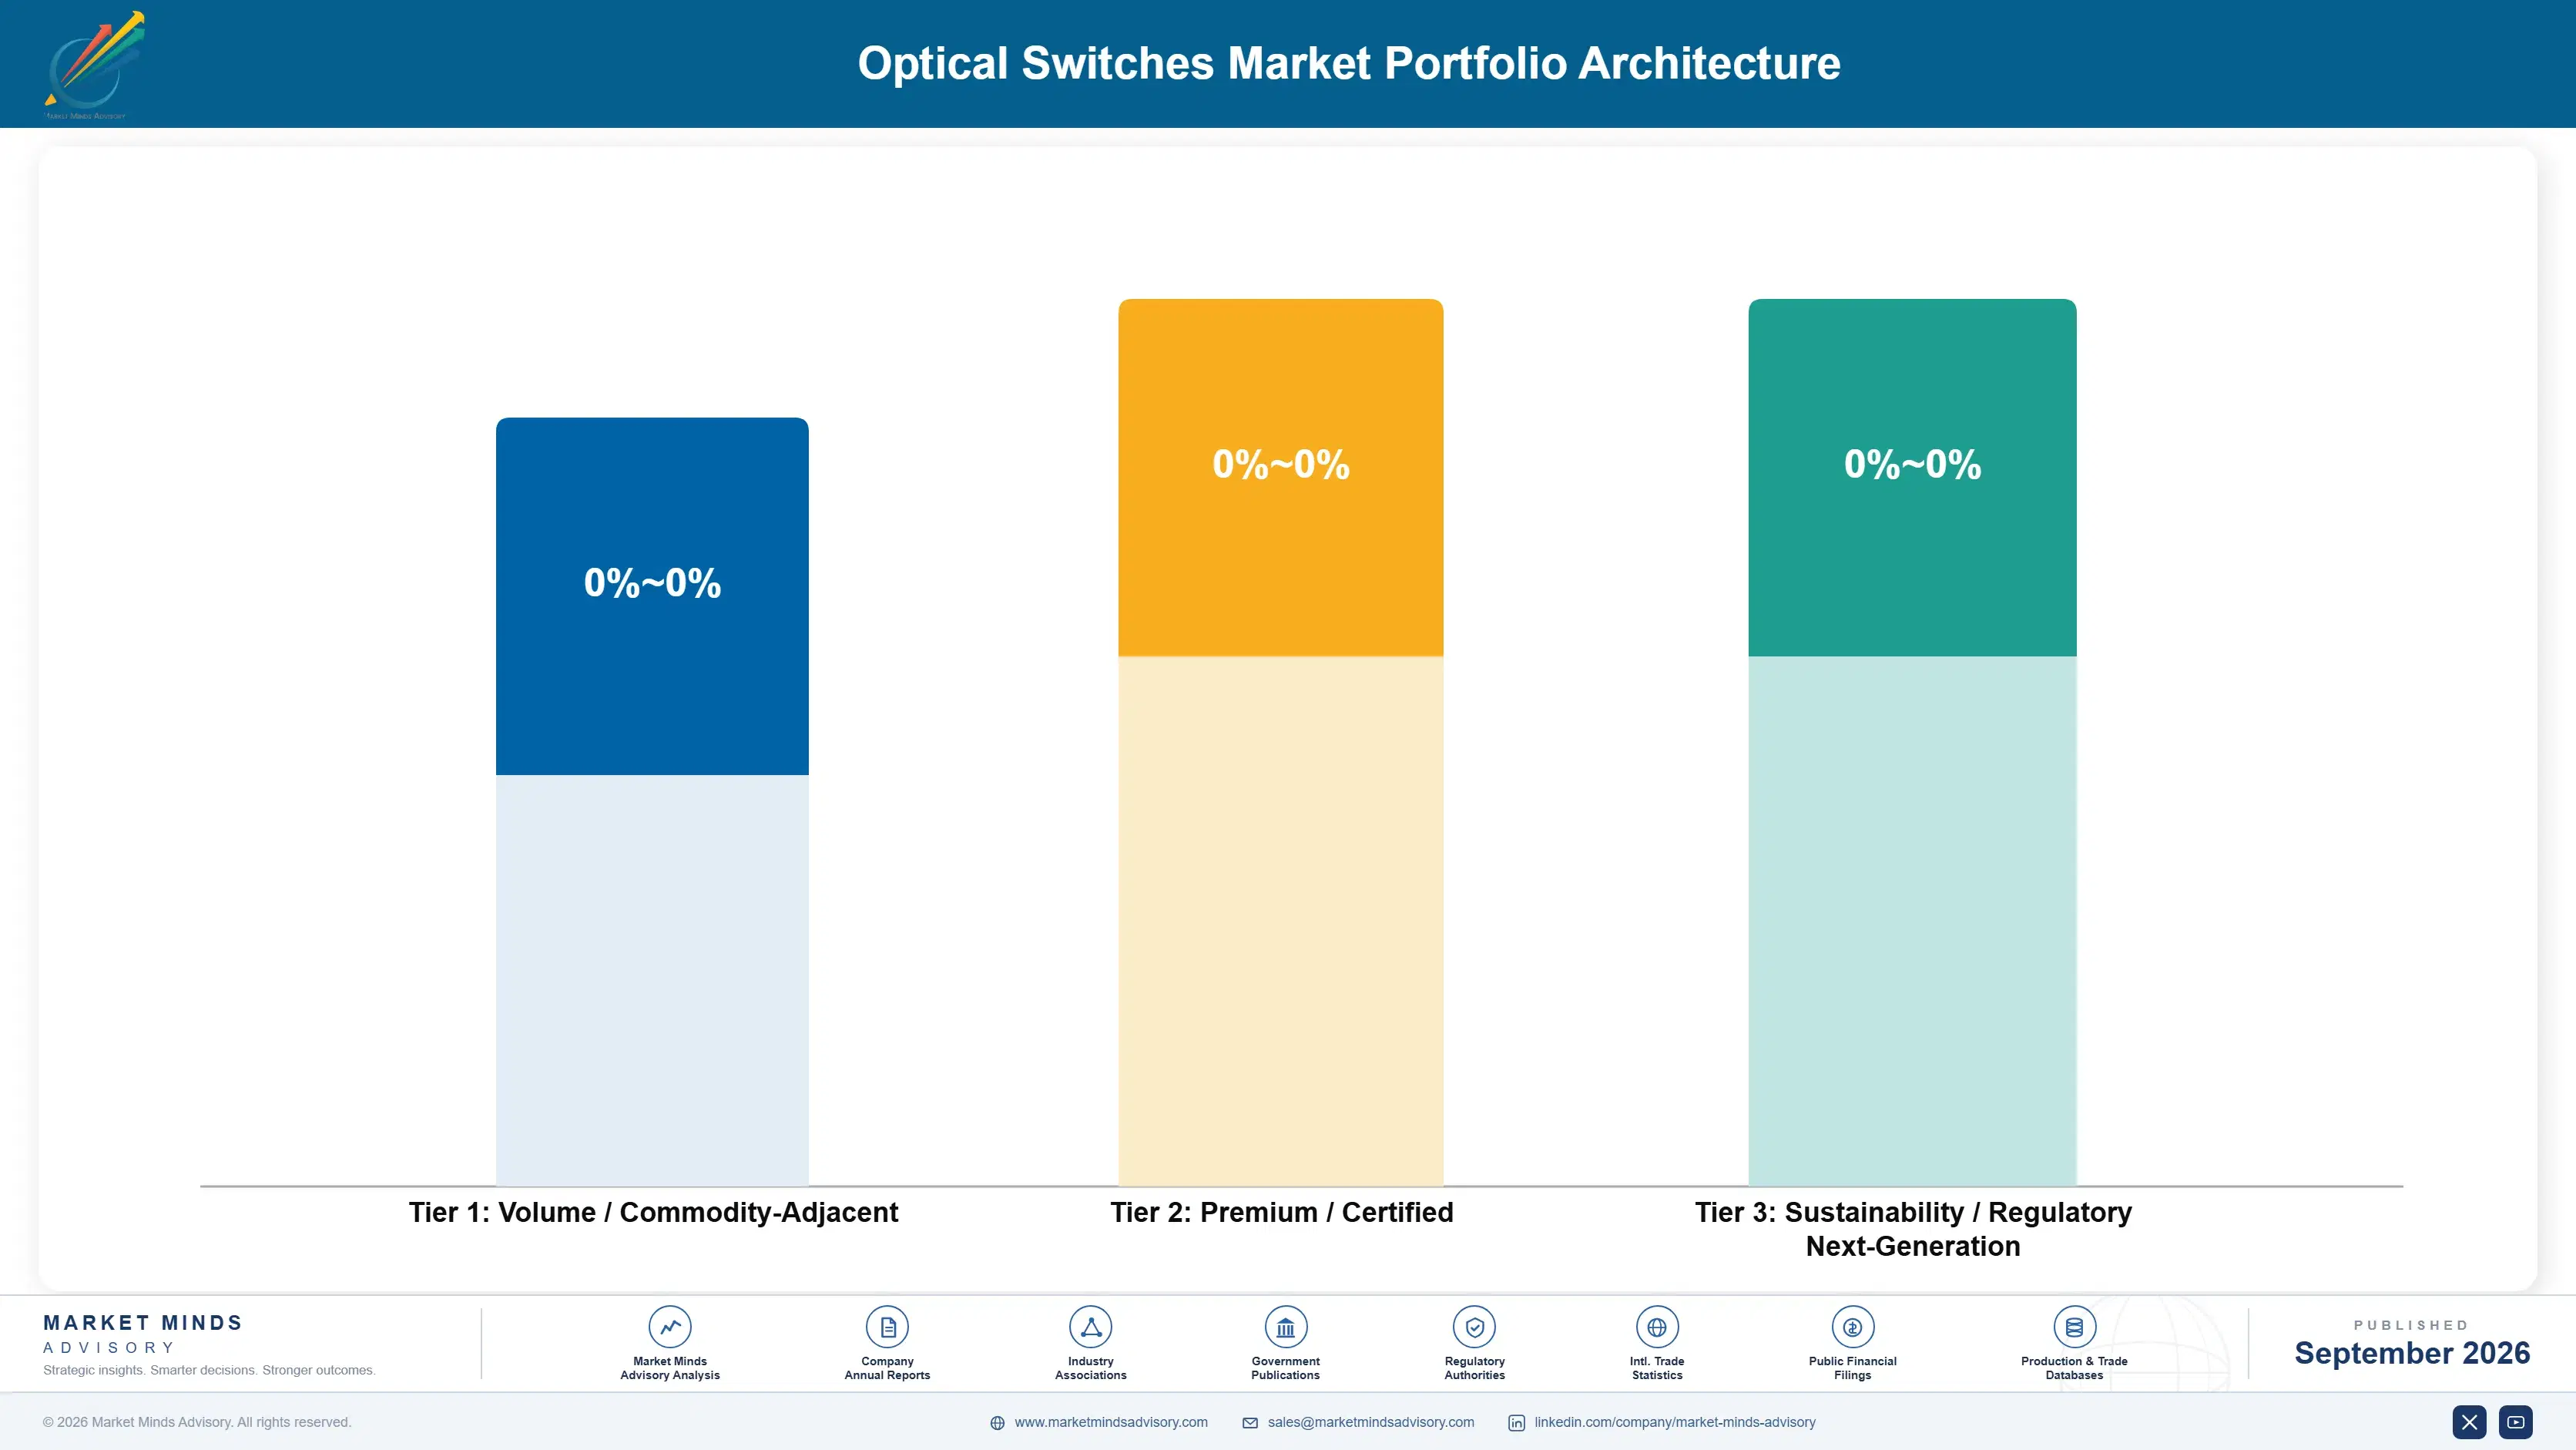
Margin architecture separates on application difficulty rather than switching principle. Test and measurement optical switching earns least, since volumes are modest and requirements are undemanding relative to network applications. Protection switches and add-drop modules sit above on network qualification. Accelerator fabric switches, wavelength selective devices and switch control software earn most, because each solves a problem that no alternative technology addresses acceptably.
The volume versus premium tension runs between embedded transport supply and direct fabric sales, which reward opposite commercial structures entirely. Embedded requires transport vendor qualification and accepts their margin above yours. Direct fabric sales reach cluster operators at better pricing against a handful of buyers. Suppliers holding only the embedded route grow with transport capacity while the faster growth happens somewhere they do not sell.

High-value pools concentrate in accelerator fabric switching and in low loss wavelength selective devices, and neither is reached through switching technology alone. Fabric switching requires port counts that demand automated alignment. Low loss requires component sourcing and assembly precision built over years. Both explain why five suppliers hold 54% while the underlying switching principles are documented in the open literature for anybody.

Volume / Commodity-Adjacent

Test and measurement optical switching, where volumes are modest and requirements are undemanding relative to anything a live network application would impose. The twelve point spread separates suppliers with automated alignment from those assembling through manual precision work at every port.
Gross Margin: 31% to 43%

Premium / Certified

Protection and restoration switches and reconfigurable optical add-drop modules, where network qualification and switching speed requirements determine selection rather than any price comparison. The thirteen point spread tracks component sourcing position on the low loss parts that govern insertion performance.
Gross Margin: 48% to 61%

Sustainability / Regulatory / Next-Generation

Optical circuit switches for accelerator fabrics, wavelength selective switches for transport and switch control software, each solving a problem no alternative technology addresses acceptably. The sixteen point spread reflects alignment automation and low loss component position taken together.
Gross Margin: 65% to 81%
optical-switches-market-portfolio-architecture-1790004215658

High-value Sub-segments and Strategic Watch-out

Optical Circuit Switches For Accelerator Fabrics

Grows at 17.0% because reconfigurable topology at high port counts cannot be delivered electrically within acceptable power budgets. The sixteen point spread reflects alignment automation. Cluster operators weigh watts and ports rather than any traffic visibility concern. Automated alignment gates entry here. Power budgets decide.
Gross Margin: 65% to 81%

Wavelength Selective Switches For Transport

Grows at 12.4% because capacity growth makes manual fibre patching impractical for provisioning and restoration at scale. The sixteen point spread reflects low loss component position. Around 61% of shipments arrive embedded inside transport equipment rather than standalone. Operators never had to justify it. Capacity growth drives it.
Gross Margin: 65% to 81%

Protection And Restoration Switches

Grows at 9.1% on network resilience requirements where switching within 25 milliseconds preserves service during a fibre fault. The thirteen point spread reflects qualification depth. Operators accept these more readily since the alternative is service interruption. Service interruption is the alternative. Twenty-five millisecond switching applies.
Gross Margin: 48% to 61%

Test And Measurement Optical Switching

Grows at 6.3%, slowest of the six classes, on modest volumes and requirements far less demanding than any network application imposes. The twelve point spread reflects assembly automation. Laboratory buyers are price sensitive and specification tolerant simultaneously. Requirements are undemanding throughout. Laboratory buyers are price sensitive.
Gross Margin: 31% to 43%

Why Visibility Blocks Adoption

The annuity here is transport vendor qualification rather than any operator relationship. Around 61% of shipments arrive embedded inside equipment an operator bought for other reasons, which means the switch was never separately justified to anybody. A supplier qualified into a transport platform ships with every unit that platform sells. One selling directly must answer a visibility objection that has blocked deployment for two decades.
Depth varies by which objection applies. A transport network engineer needs to inspect traffic and troubleshoot faults through paths that optical switching makes opaque. A cluster operator needs ports and watts and does not inspect individual flows in the same way. The same device therefore faces an insurmountable objection in one application and none at all in the other, which is why growth concentrates so narrowly.

The buyer has changed as compute scaled. A transport planner evaluated switching speed, loss budget and network management integration against operational practice built around electrical monitoring. A cluster architect evaluates port count and power against a rack budget. A facilities function evaluates energy avoided. Only the first buyer had the visibility objection, and only the first is not where growth is happening.
optical-switches-market-end-use-penetration-index-1790004216150

What Wins Switch Deployments

These are among the four positions where our research anticipates prominent divergence between winners and laggards over the coming forecast period. Each is grounded in the demand model, the regulatory perimeter, and the announced capacity pipeline.
01 / FABRIC BUYER TARGETING

Sell Ports And Watts, Not Efficiency

Around 17% of consumption now serves accelerator fabrics where reconfigurable topology at high port counts cannot be delivered electrically inside any power budget a cluster operator would accept. Optical switching avoids around 72% of the energy and that buyer weighs watts and ports directly. Suppliers pitching network operators on efficiency address people who accepted the physics years ago and declined anyway on entirely operational grounds that no efficiency case answers or ever will from any supplier at any point in the network.
02 / EMBEDDED CHANNEL PRIORITY

Ship Inside The Equipment They Already Bought

Around 61% of optical switch shipments arrive embedded in transport equipment rather than as separately specified standalone products, because operators accept switching they never had to justify far more readily. Suppliers selling through transport equipment vendors reach deployments that direct sales have never achieved in this category. The margin is lower and the volume is where the market genuinely sits, which specialists resist accepting for too long and lose the volume entirely to somebody who accepts it without objection or hesitation.
03 / LOSS BUDGET ENGINEERING

Win Decibels Before Winning Features

A switch typically consumes around three decibels of a link budget and every decibel spent on switching is unavailable for reach or for operating margin anywhere in the path. That constrains placement regardless of price or feature set entirely. Suppliers reducing insertion loss expand where their devices can physically sit, which opens applications that no amount of price competition could ever have reached for them at any price point at all whatever else the device offers to the buyer or the network.
04 / OBJECTION DIRECTED DESIGN

Build The Monitoring They Actually Want

Network engineers decline optical switching where they need to inspect traffic, because a device routing light reports nothing about what it carries and fault isolation slows considerably at exactly the wrong moment. Optical performance monitoring built into the switch addresses that objection rather than arguing against it. That capability reaches operator deployments which efficiency arguments have comprehensively failed to win across two decades of trying against the same objection from every operator engineer who evaluated it and then declined on operational grounds.

Engagement Snapshot From the Field

A live engagement with an industry participant carrying material or product regulatory and market exposure ahead of a defining policy shift, showing how our research translates into a defensible multi-year portfolio strategy.
MARKET MINDS ADVISORY · CLIENT ENGAGEMENT SUMMARY
Optical Switches Producer Strategic Portfolio Review and Transition Roadmap 2026·Investment Scenario on Optical Switches Exposure Evaluation 2025-26
CLIENT PROFILE
An optical component supplier with competitive switching technology selling directly to network operators and losing consistently, while its small accelerator fabric business grew faster than anything else it did. Management had approved further sales investment in operator accounts, without establishing why those accounts kept declining after positive technical evaluations. Nobody had asked the operators why.
STRATEGIC CHALLENGE
Sales wanted more operator coverage to convert a pipeline that looked promising on paper. Engineering wanted lower insertion loss to strengthen the technical case. Nobody had examined why operators declined after evaluating well, and a substantial cluster fabric opportunity was open with two large operators within the year. Both proposals assumed a technical problem.
MMA APPROACH
MMA interviewed operator engineers who had evaluated and declined the product to establish the actual objection, and compared the decision criteria cluster fabric buyers applied. We assessed the economics of selling through transport equipment vendors against direct operator sales. Work drew on 47 expert interviews conducted in Q4 2025 with operators, cluster operators and equipment vendors.
KEY FINDINGS
  1. Operators declined on traffic visibility in around 84% of cases after evaluating the technology positively, which lower insertion loss would not have changed at all.
  2. Cluster fabric buyers never raised visibility at all and evaluated the product entirely on port count and power against a rack budget instead.
  3. Selling through transport equipment vendors reached deployments that direct sales had not achieved across 3 years of continuous effort (client-reported, unverified by MMA).
  4. Building optical performance monitoring into the switch addressed the operator objection directly rather than continuing to argue against it repeatedly and fruitlessly.
CLIENT PROFILE
An optical component supplier with competitive switching technology selling directly to network operators and losing consistently, while its small accelerator fabric business grew faster than anything else it did. Management had approved further sales investment in operator accounts, without establishing why those accounts kept declining after positive technical evaluations. Nobody had asked the operators why.
STRATEGIC CHALLENGE
Sales wanted more operator coverage to convert a pipeline that looked promising on paper. Engineering wanted lower insertion loss to strengthen the technical case. Nobody had examined why operators declined after evaluating well, and a substantial cluster fabric opportunity was open with two large operators within the year. Both proposals assumed a technical problem.
MMA APPROACH
MMA interviewed operator engineers who had evaluated and declined the product to establish the actual objection, and compared the decision criteria cluster fabric buyers applied. We assessed the economics of selling through transport equipment vendors against direct operator sales. Work drew on 47 expert interviews conducted in Q4 2025 with operators, cluster operators and equipment vendors.
KEY FINDINGS
  1. Operators declined on traffic visibility in around 84% of cases after evaluating the technology positively, which lower insertion loss would not have changed at all.
  2. Cluster fabric buyers never raised visibility at all and evaluated the product entirely on port count and power against a rack budget instead.
  3. Selling through transport equipment vendors reached deployments that direct sales had not achieved across 3 years of continuous effort (client-reported, unverified by MMA).
  4. Building optical performance monitoring into the switch addressed the operator objection directly rather than continuing to argue against it repeatedly and fruitlessly.
RECOMMENDED STRATEGY
Phase 1: Phase one: stop expanding direct operator coverage, since around 84% of declines were on visibility rather than on any technical shortcoming. Phase 2: Phase two: pursue cluster fabric opportunities where port count and power decide the outcome and visibility never enters the discussion. Phase 3: Phase three: build optical performance monitoring into the product to address the operator objection rather than continuing to argue against it.
OUTCOME
The supplier redirected sales effort toward cluster fabric buyers and began building monitoring into the switch (client-reported, unverified by MMA). Fabric revenue grew substantially while operator effort was reduced, and monitoring reopened conversations that had previously closed. Objections are now traced to root cause before sales investment, which outlasted the engagement.

Frequently Asked Questions

Foundational context covering the market sizes, CAGR, scope, country, region and competition that inform every finding below. This section is provided to cover basics and most often pre-purchase conversations, answered from the MMA Primary Research Dataset.

What is the current size of the Optical Switches Market?

Global value reaches USD 3.8 billion in 2026, measured as optical switch consumption value across six device classes. The 2025 base was USD 3.4 billion.

How large will the Optical Switches Market be by 2036?

The market reaches USD 11.0 billion by 2036, an increase of USD 7.2 billion across the forecast period. That represents 2.89 times expansion from the 2026 base.

What is the CAGR for the Optical Switches Market 2026 to 2036?

The base case runs at 11.3% annually, with a bull case at 12.6% if accelerator cluster scale keeps rising and a bear case at 10.0% if operator conservatism holds firm.

Which segment is growing fastest?

Optical circuit switches for accelerator fabrics grow at 17.0%, half again the market rate of 11.3%. Electrical switching cannot deliver those port counts within acceptable power budgets.

Who are the major companies in the Optical Switches Market?

Lumentum, Coherent, Calient Technologies, Polatis and NTT Electronics lead on switch consumption value, holding 54% between them. Fujitsu and Accelink Technologies hold smaller positions here.

Which country is growing fastest?

India leads at 18.5%, because data centre fabric architecture is specified at design stage rather than retrofitted onto installed electrical infrastructure. China and Vietnam follow.

Report Segmentation Architecture

The full report scope spans multiple orthogonal segmentation dimensions, with cross-tabulated demand data provided for each dimension pair. Coverage extends further to regional breakdowns, trend trajectories, and the competitive detail needed to support segment-level decision-making.

By Switch Type And Application

  • Optical Circuit Switches For Accelerator Fabrics
  • Wavelength Selective Switches For Transport
  • Reconfigurable Optical Add-Drop Modules
  • Protection And Restoration Switches
  • Switch Control Software
  • Test And Measurement Optical Switching

By End-Use Industry

  • Compute Cluster And Data Centre Fabrics
  • Telecommunications Transport Networks
  • Submarine And Long Haul Systems
  • Research And Education Networks
  • Enterprise And Campus Optical Networks
  • Test Laboratories And Manufacturing

By Commercial Dimension

  • Transport Equipment Vendor Embedded Supply
  • Direct Cluster Operator Procurement
  • Network Operator Direct Purchase
  • System Integrator Delivery
  • Original Equipment Manufacturer Module Supply
  • Research Institution Procurement

By Region

  • North America
  • Western Europe
  • East Asia
  • South Asia and Pacific
  • Latin America
  • Middle East and Africa
  • Eastern Europe

Scope, Methodology, and Coverage

Every figure in this report is reproducible from documented input assumptions. The scope below maps the historical period, the forecast horizon, the segmentation dimensions, and the countries covered, alongside the underlying primary and qualitative methodology.
Historical Period
2020 to 2025
Forecast Period
2026 to 2036
Base Year
2025 (USD billions; MMA Primary Research Dataset, September 2026)
Market Definition
This report covers optical switches: devices routing optical signals between paths without converting them to electrical form, spanning optical circuit switches for accelerator and data centre fabrics, wavelength selective switches for transport networks, reconfigurable optical add-drop modules, protection and restoration switches, test and measurement optical switching, and the control software supplied with them. It excludes electrical packet switches, optical transceivers and transponders, optical amplifiers, passive splitters and couplers, and complete transport network systems.
Quantitative Units
USD millions, optical switch consumption value basis; switches and ports shipped; insertion loss budgets in decibels; switching time requirements in milliseconds; embedded share of shipments; energy avoided against electrical switching; accelerator fabric share of consumption.
Segmentation Dimensions
Switch type and application; end-use network or facility; commercial supply route; geography across seven regions.
Regions Covered
North America, Western Europe, East Asia, South Asia and Pacific, Latin America, Middle East and Africa, Eastern Europe
Countries Covered
China, Japan, South Korea, Taiwan, Singapore, India, Australia, Vietnam, United States, Canada, Mexico, Brazil, Germany, France, United Kingdom, Netherlands, Italy, Poland, Saudi Arabia, South Africa.
Key Companies Profiled
Lumentum, Coherent, Calient Technologies, Polatis, NTT Electronics, Fujitsu, Nokia, Ciena, Infinera, Molex, DiCon Fiberoptics, Santec, Huawei Technologies, Accelink Technologies, O-Net Technologies.
Quantitative Methodology
Primary survey, n=3,800 respondents, Q4 2025, six countries; demand-side model with trade association cross-validation
Qualitative Methodology
47 expert interviews, Q4 2025; applied to validate demand model assumptions, identify emerging dynamics, and assess competitive positioning
Report Format
PDF and XLSX data workbook (Word format preview document)
Publisher
Market Minds Advisory
Report Code
MMA-2026-TEC-331
Published
September 2026
Contact
sales@marketmindsadvisory.com | www.marketmindsadvisory.com

Purchase the full Optical Switches Market Report (2026 to 2036).

This report sizes the global optical switches market from 2026 to 2036 across six switch types, six network types and seven regions. It explains why optical switching avoiding around 72% of switching energy has still been blocked for two decades by traffic visibility objections that no efficiency argument addresses. Around 61% of shipments arriving embedded in transport equipment is analysed as the route operators actually accept. Accelerator fabrics at around 17% of consumption are examined as the buyer weighing watts and ports instead. Regional analysis explains why East Asia holds 34% of consumption.
Six switch types sized through to 2036
Energy savings quantified against operator visibility objections
Embedded supply route analysed against direct operator sales
Twenty named suppliers assessed on switch consumption value
Four revenue levers with quantified commercial impact
Anonymised component supplier strategy engagement documented in full

Built For The People Who Decide

From boardroom strategy to bench-side execution, this report is read cover-to-cover by leaders shaping the next decade of their industry, turning demand scenarios, market dynamics and valuation benchmarks into decisions.
CXOs/ Presidents/ VPs/ Managers
M&A and Corporate Development
Strategy Teams and R&D Heads
Procurement and Product Directors
Regulatory and Compliance Leaders
Investor Relations and Equity Analysts