Market Minds Advisory
Optical Networking Market

Optical Networking Market: High-Capacity Transmission Infrastructure for Data and Telecom Networks.

Hyperscale AI cluster interconnect is pulling optical networking demand toward power-efficient coherent transport far faster than legacy telecom capacity upgrades, rewarding vendors who solve capacity density per watt over those still selling raw port count.

Lead Analyst

Published

September 2026

Make Smarter Decisions with Customized Research Insights

Request a free sample report and evaluate market opportunities, growth trends, and competitive dynamics relevant to your business needs.

2025 MARKET VALUE$22.5BMarket Size 2025
2036 FORECAST VALUE$61.1BBase Case , 2026 to 2036
CAGR 2026 TO 20369.5 %Bull 10.8% / Bear 8.2%
INCREMENTAL OPPORTUNITY$36.4BNet 10- year value creation
EXPANSION MULTIPLE2.48x2036 value over 2026 base
Strategic Levers
M&A Pipeline
Regional Outlook
Country Rankings
Competitive Intelligence
Segmental Deep-dive
Call-Us : 91 93563 13602

Executive Snapshot and Market Trajectory.

Optical networking demand has shifted decisively toward coherent transport systems built for hyperscale data center interconnect, as AI training cluster buildout pushes bandwidth requirements well beyond what traditional telecom-driven capacity planning ever anticipated for backbone infrastructure investment cycles across the broader industry today.
Hyperscale AI infrastructure buildout and 5G network densification are the two dominant commercial forces, concentrating volume in East Asia, where telecom infrastructure investment scale and domestic equipment manufacturing capacity both outpace most other regions of the world. Coherent optical transport for hyperscale data center interconnect absorbs a rapidly growing share of spend, since AI training clusters require dramatically higher bandwidth between facilities than traditional enterprise or telecom network architectures ever demanded from suppliers worldwide.
Competitive intensity spans established telecom equipment vendors alongside specialized optical component makers competing on transmission capacity per fiber and power efficiency, a dynamic reshaping vendor selection criteria across hyperscale and carrier accounts worldwide today. Falling per-bit transmission cost from advanced coherent modulation techniques is pulling higher-capacity optical systems into metro and regional network tiers that previously relied on simpler, lower-capacity transmission equipment entirely across the broader industry landscape.
Market Definition
The Optical Networking Market covers transmission equipment, including coherent optical transponders, wavelength division multiplexing systems, and optical switching hardware used to carry high-capacity data traffic across telecom, data center, and enterprise networks. It excludes fiber optic cable manufacturing, passive optical components, and network management software sold separately from transmission hardware.
Base Year Value
$22.5B in 2025 (MMA Primary Research Dataset, September 2026)
Forecast Period
2026 to 2036, eleven discrete annual values
CAGR
9.5% base case. Bull 10.8%. Bear 8.2%.
Fastest Growth Segment
Coherent Optical Transport for Hyperscale Data Center Interconnect: 16.0% CAGR
Fastest Growth Country
China: 12.5% CAGR
Fastest Growth Region
South Asia and Pacific: 11.5% CAGR
Largest Region
East Asia: 30% of 2025 global value
Market Leaders
Huawei, Nokia, Ciena, Infinera, and ZTE Corporation lead the global Optical Networking Market. Source: MMA Primary Research Dataset, July 2026, and company disclosures.
Primary Survey
n=3,800 procurement and R&D decision-makers, Q4 2025, six countries
Methodology
Demand-side build-up, cross-validated against public data, 47 expert interviews

Optical Networking Market Forecast Scenarios

optical-networking-market-size-forecast-scenario-1790007621503
Optical networking demand grew steadily across 2020 to 2025, as 5G network buildout and pandemic-driven broadband traffic growth sustained telecom infrastructure investment even as enterprise data center spending remained more cyclical, given the category's mixed exposure to both stable carrier and considerably more volatile hyperscale capital expenditure cycles throughout the entire five-year period being examined here.
The base case assumes continued hyperscale AI infrastructure buildout driving coherent transport demand, sustained 5G network densification across developing markets, and gradual migration from legacy lower-capacity systems toward higher-speed coherent optical technology. These three mechanisms together sustain strong growth even as mature telecom markets approach saturation in basic capacity upgrades, shifting incremental spend toward higher-margin, higher-capacity coherent transport systems specifically designed for data center interconnect and long-haul backbone network expansion projects.
A bull scenario centers on accelerated AI infrastructure buildout pulling coherent optical transport demand well beyond current hyperscale capital expenditure plans industry-wide. A bear scenario centers on a broader data center capital expenditure slowdown combined with telecom operator capital discipline reducing network equipment orders across multiple major carrier markets simultaneously over an extended forecast period spanning several years.

Bandwidth Density Reshapes Transmission Economics

Optical networking demand now tracks bandwidth density per fiber more than raw port count, since a single hyperscale interconnect link increasingly carries traffic volume that would have required dozens of legacy transponders just a few years earlier. This density shift is rewriting how vendors design product roadmaps and allocate manufacturing capacity, particularly for the highest-capacity coherent transponders hyperscale interconnect architectures increasingly favor across nearly every deployment scenario.
MARKET CONCENTRATIONCR5 62%Concentrated among a handful of established telecom equipment vendors
AVERAGE SELLING PRICE$8,000-$45,000Coherent transponders priced per port and capacity tier
TOP PRODUCING REGIONEast Asia 38%Volume concentrated among established telecom equipment manufacturing facilities
CAPACITY UTILIZATION75-85%Runs near peak given sustained hyperscale and carrier demand
INPUT COST SHARE40% of COGSOptical components and semiconductor chips dominate total cost
REPLACEMENT CYCLE5-7 YearsNetworks typically refreshed as bandwidth requirements keep steadily escalating
Commercial character has shifted from a largely telecom carrier-driven capital equipment business toward a dual-market dynamic, where hyperscale data center interconnect demand increasingly rivals traditional carrier backbone spending in overall market importance. Vendors unable to serve both customer segments increasingly cede share to rivals with broader product portfolios spanning both markets, since procurement teams increasingly prefer suppliers who understand both sides of the business.
Continued coherent modulation advancement, expanding AI infrastructure buildout, and sustained 5G network densification will shape optical networking demand through the next decade, with vendors solving power efficiency per bit best positioned to capture the largest hyperscale contracts across every major regional market where AI infrastructure and telecom investment continue accelerating well beyond earlier industry forecasts.
"Bandwidth used to be sold by the port. Now it is sold by the watt, since power efficiency determines whether a hyperscale operator can even fit enough capacity into a single rack."
Director, Optical and Telecom Infrastructure Practice · MMA Technology Practice · September 2026

Market Trends

Coherent Optics Push Toward 800G and Beyond

Optical networking vendors are advancing coherent transmission technology toward 800 gigabit and 1.6 terabit per wavelength capacity, driven by hyperscale operators demanding ever-higher bandwidth density per fiber pair to support AI training cluster interconnect requirements. This capacity escalation reflects the reality that a single AI training cluster now generates traffic volume that would have overwhelmed entire regional networks just a few years ago. Several leading vendors have disclosed 1.6 terabit coherent transponder product roadmaps targeting commercial availability within the next two years, a timeline that will further widen the capacity gap versus legacy transmission equipment.
Market Impact: Hyperscale optical spend up 38% yearly
Pluggable Optics Displace Fixed Line Card Architectures

Pluggable coherent optical modules increasingly displace traditional fixed line card architectures, letting network operators upgrade transmission capacity without replacing entire chassis systems. This modularity trend reduces total upgrade cost and deployment timeline considerably compared to legacy fixed-architecture systems that required full system replacement for major capacity increases. Several major telecom equipment vendors have disclosed expanded pluggable optics product lines specifically targeting this architectural shift across both carrier and hyperscale customer segments simultaneously, a shift that has already reshaped how procurement teams evaluate and compare competing vendor bids for future contracts.
Market Impact: Carrier optical spend up 8% yearly

Market Opportunities and Growth Drivers

Hyperscale AI Buildout Drives Coherent Transport Demand

Major cloud operators are deploying AI training clusters requiring dramatically higher interconnect bandwidth between data center facilities than traditional enterprise network architectures ever demanded, directly driving coherent optical transport demand. Several hyperscale operators have disclosed capital expenditure plans exceeding tens of billions of dollars annually dedicated specifically to AI infrastructure buildout, a meaningful share of which flows toward optical interconnect procurement across their global facility footprint. This spending pattern shows no sign of slowing over the coming several years, according to most disclosed capital budgets across the largest cloud operators worldwide.
Market Impact: Component lead times extend 12 weeks

5G Network Densification Sustains Carrier Equipment Demand

Continued 5G network densification across developing and developed markets alike sustains steady carrier equipment demand for optical transport systems connecting base stations to core network infrastructure. Multiple national telecom operators have disclosed continued network densification investment plans extending through the remainder of the decade, directly supporting sustained optical equipment procurement independent of the more volatile hyperscale capital expenditure cycle. This carrier demand provides a stabilizing revenue base for vendors also serving more volatile hyperscale customers simultaneously across their broader combined product portfolio and geographic footprint across every region where each vendor competes.
Market Impact: Quarterly hyperscale orders vary 25%

Market Restraints and Challenges

Optical Component Supply Concentration Creates Cost Risk

Precision optical component and semiconductor chip production remains concentrated among a small number of specialized manufacturers, creating input cost and supply risk whose root cause traces to the highly specialized fabrication equipment and expertise required, which few facilities worldwide can operate at the tolerances coherent optical systems demand. This concentration hands component suppliers meaningful pricing power over equipment vendors. Some larger vendors are pursuing mitigation through vertical integration into component production or qualifying additional second-source component suppliers across multiple geographic regions and across multiple entirely different underlying semiconductor technology platforms and manufacturing processes.
Market Impact: 800G port shipments up 45% yearly

Hyperscale Capital Expenditure Volatility Threatens Demand Stability

Hyperscale operator capital expenditure plans can shift meaningfully between fiscal quarters based on evolving AI infrastructure investment priorities, whose root cause lies in the still-uncertain long-term return profile of massive AI infrastructure spending relative to historical data center investment patterns. The commercial impact creates order volatility for optical equipment vendors heavily dependent on hyperscale customer concentration. Vendors are pursuing mitigation by diversifying their customer base across both hyperscale and telecom carrier segments to reduce their overall single-segment revenue dependency risk across the broader business cycle rather than depending on any single customer type.
Market Impact: Pluggable optics adoption up 38% yearly
4 additional market trends, 4 additional growth drivers, and 4 additional restraints and challenges are covered in the full report. Contact sales@marketmindsadvisory.com to access the complete intelligence.

Segment CAGR and Growth Architecture

The Optical Networking Market segments by transmission technology and application, since hyperscale interconnect, carrier backbone, and metro access network contexts impose distinct capacity, latency, and reliability requirements that shape how buyers specify and purchase optical equipment, rather than by underlying fiber type or geographic deployment location alone, which matters comparatively little to the engineers actually making the purchase decision.
optical-networking-market-market-share-analysis-1790007622051

Coherent Optical Transport for Hyperscale Data Center Interconnect

Coherent optical transport systems for hyperscale data center interconnect carry the highest bandwidth density per fiber pair, using advanced modulation techniques to maximize capacity across expensive long-distance fiber routes connecting geographically distributed AI training facilities. Demand here grows fastest because hyperscale operators are expanding AI infrastructure capital expenditure well beyond prior data center buildout cycles, and each new AI cluster generation demands considerably more interconnect bandwidth than the last. Vendors qualified for these hyperscale contracts increasingly command premium pricing tied to power efficiency and capacity density rather than unit cost alone, a meaningful shift from prior telecom-driven procurement dynamics across the broader industry that has persisted for the better part of a decade.
CAGR 16.0%

5G Fronthaul and Backhaul Transport Systems

5G fronthaul and backhaul transport systems connect base stations to core network infrastructure, carrying the dramatically increased traffic volume that 5G network densification generates compared to prior wireless generations. This segment grows steadily as carriers across developing and developed markets continue deploying additional base station density to meet growing mobile data consumption, sustaining consistent equipment demand independent of the more volatile hyperscale capital expenditure cycle. Vendors with proven carrier-grade reliability and established telecom relationships increasingly win multi-year network densification contracts over newer entrants lacking comparable track records or established, multi-decade relationships with major national carrier customers across the region, relationships built up over decades of consistent, reliable network equipment delivery.
CAGR 11.5%
Full segment breakdown across 6 segments available in the complete report.

Regional Architecture and Country Demand Map

Optical networking demand concentrates wherever telecom infrastructure investment and hyperscale data center construction intersect, with East Asia leading on manufacturing scale and domestic network buildout while North America anchors substantial hyperscale interconnect demand worldwide today across nearly every deployment category, from hyperscale interconnect through carrier backbone infrastructure.

North America

North American demand centers on hyperscale data center interconnect buildout, as cloud operators deploy coherent optical transport systems connecting geographically distributed AI training facilities across the country. Multiple hyperscale operators headquartered in the United States have disclosed capital expenditure plans exceeding tens of billions of dollars annually dedicated to AI infrastructure, a meaningful share of which flows toward optical interconnect procurement. Carrier 5G network densification adds further steady demand across the region's broader telecom infrastructure investment cycle, sustaining orders even as hyperscale spending fluctuates from one fiscal quarter to the next across the entire optical networking industry's supplier and customer base, from equipment vendors through the largest cloud operators and their extensive supply chains.
Share: 27% | CAGR: 10.0% (2026 to 2036)

Western Europe

Western European demand draws on telecom operator network modernization and steady 5G densification investment across Germany, France, and the United Kingdom, though hyperscale data center construction here trails the pace seen in the United States and East Asia. National broadband and 5G coverage target commitments continue driving carrier optical equipment procurement across the region's established telecom infrastructure base. European hyperscale and colocation data center capacity is expanding steadily, though from a considerably smaller overall base than either North America or East Asia currently maintain across their respective hyperscale data center markets and broader cloud infrastructure investment programs currently underway across the continent's largest and most established national economies and their respective national regulators.
Share: 20% | CAGR: 8.0% (2026 to 2036)
Regional intelligence for 5 additional markets available in the complete report: East Asia, South Asia and Pacific, Latin America, Middle East and Africa, Eastern Europe. Contact sales@marketmindsadvisory.com.
optical-networking-market-country-cagr-analysis-1790007622564

Where Optical Vendors Actually Capture Margin

Optical networking vendors capture value beyond baseline port pricing through four commercial mechanisms that reward capacity density and long-term customer relationship depth over one-time equipment sale margin. Power efficiency premium pricing, multi-year carrier framework agreements, software-defined network licensing, and managed service extensions all matter considerably more here than initial port pricing ever really did.

Charging Premium Pricing for Power Efficiency Leadership

Vendors that deliver superior power efficiency per transmitted bit capture premium pricing from hyperscale customers facing real power and cooling constraints within their data center facilities. This efficiency premium typically commands 15 to 25% higher pricing than comparable capacity systems with weaker power efficiency, reflecting the meaningful operational cost savings efficient systems deliver over their operational lifetime. Vendors with proven power efficiency leadership increasingly win hyperscale contracts over competitors offering comparable raw capacity at meaningfully higher power draw and correspondingly higher operational electricity cost over the equipment's entire multi-year service life at typical hyperscale utilization rates.
Market Impact: Efficiency leaders earn 15 to 25% price premiums

Securing Long-Term Multi-Year Carrier Framework Agreements

Vendors that negotiate multi-year framework agreements with telecom carriers lock in predictable revenue tied to disclosed network densification and capacity expansion roadmaps, rather than competing project-by-project against spot market pricing pressure. These framework agreements typically span 3 to 5 years aligned with carrier capital investment cycles, providing vendors the revenue visibility needed to justify manufacturing capacity investment decisions with genuine confidence. This approach favors vendors with dedicated carrier account teams over smaller rivals competing purely on individual project pricing without any forward volume commitment, capacity reservation, or multi-year pricing certainty of any kind.
Market Impact: Framework agreements typically span 3 to 5 years

Licensing Software-Defined Network Management Platform Tools

Vendors that license software-defined network management and orchestration platforms alongside hardware capture recurring software revenue beyond the underlying transmission equipment sale itself. This software layer typically generates 10 to 18% of total contract value annually, compounding meaningfully over the equipment's multi-year operational lifetime and rarely declining even as hardware margins compress over subsequent contract renewal cycles. Vendors with genuinely differentiated network automation capability increasingly retain customers longer than those offering only basic hardware without any accompanying network management and orchestration software layer built into the underlying hardware platform they sell.
Market Impact: Software licensing adds 10 to 18% of revenue

Offering Managed Network Optimization Service Extensions

Vendors offering managed network optimization services, including capacity planning and predictive maintenance monitoring, capture recurring service revenue equal to 12 to 20% of contract value beyond the initial equipment sale. This service layer matters particularly to carriers and hyperscale operators lacking dedicated internal network optimization expertise capable of managing complex multi-vendor optical networks continuously across every shift and time zone their global network operations actually span. Vendors with proven managed service delivery capability increasingly win preferred-vendor status over equipment-only competitors lacking equivalent operational support infrastructure and dedicated round-the-clock network operations center staffing capability at comparable scale and reliability.
Market Impact: Managed services add 12 to 20% of contract value

Who Controls the Margin Pool

Five firms hold roughly 62% of global optical networking revenue, a concentrated market structure reflecting the substantial research and development investment and manufacturing scale required to compete in coherent transmission technology. Huawei and Nokia lead through decades of telecom equipment manufacturing scale and carrier relationship depth, while the gap to challenger vendors remains meaningful on both R&D investment capacity and manufacturing scale, though narrower in specialized hyperscale interconnect segments where nimble specialists compete effectively.
Current competitive activity centers on 800G and 1.6 terabit coherent transponder development, pluggable optics expansion, and power efficiency optimization, as vendors race to meet tightening hyperscale bandwidth density requirements. Component and system vendors increasingly integrate vertically to control both semiconductor and system-level technology, reducing dependence on external suppliers for the most critical performance-determining components across their highest-margin product lines.

Emerging pressure comes from hyperscale operators exploring in-house optical system design for their most specialized interconnect configurations, potentially disintermediating traditional vendors on the highest-volume, highest-margin hyperscale segment over time. Rankings shift fastest in coherent transport, where vendors with genuine power efficiency leadership increasingly out-compete established rivals lacking comparable semiconductor technology investment and vertical integration depth.
optical-networking-market-company-positioning-matrix-1790007623094

Competitive Moat and Risk Dimensions

HUAWEI

Moat: Vertically Integrated Manufacturing Scale

Huawei's vertical integration across semiconductor design, optical component manufacturing, and system assembly gives it cost and supply reliability advantages that competitors sourcing components externally cannot match, particularly for large domestic and international carrier contracts requiring guaranteed delivery schedules at massive volume across multiple simultaneous deployment programs worldwide.
HUAWEI

Risk: Restricted Access to Some Markets

Huawei faces continued restrictions on market access across several countries citing national security concerns, limiting its addressable market despite strong technical capability, and ceding share in those restricted markets to competitors like Nokia and Ciena who face no comparable restrictions in those same politically sensitive markets.
CIENA

Moat: Deep Coherent Optics Specialization

Ciena's exclusive focus on optical networking and coherent transport technology gives it product depth and engineering specialization that diversified telecom equipment vendors extending into optical cannot easily match, particularly around power efficiency and capacity density optimization that hyperscale customers increasingly prioritize above nearly every other purchasing criterion.
CIENA

Risk: Limited Scale Versus Diversified Rivals

Ciena's smaller overall scale relative to diversified telecom equipment giants limits its research and development budget and manufacturing cost advantages, risking share loss in price-sensitive segments to larger rivals able to cross-subsidize optical products against losses from other, larger business lines within their broader portfolio.

Players Tracked

Prominent Players

Huawei
Nokia
Ciena
Infinera
ZTE Corporation

Other Key Players

Cisco Systems
Fujitsu
NEC Corporation
Adtran
Ribbon Communications
Juniper Networks
Coherent Corp
Lumentum Holdings
Marvell Technology
Broadcom
Acacia Communications
II-VI Incorporated
Cambricon Technologies
Innolight Technology
Accelink Technologies

Recent Developments

FEBRUARY 2026

Ciena Announces 1.6 Terabit Coherent Transponder Availability

Ciena announced commercial availability of its 1.6 terabit coherent transponder product line, targeting hyperscale operators requiring the highest available bandwidth density per fiber pair for AI infrastructure interconnect applications across their global facility footprint, a spending pattern most industry forecasters expect to continue through the decade's end.
Signal: Signals vendors are racing to commercialize next-generation capacity well ahead of anticipated future hyperscale demand growth.
SEPTEMBER 2025

Nokia Forms Strategic Partnership With Major Hyperscale Operator

Nokia entered a strategic partnership with a major hyperscale cloud operator covering coherent optical transport deployment across the operator's global data center interconnect network, including committed multi-year capacity expansion milestones tied directly to the operator's disclosed AI infrastructure buildout roadmap through the end of the decade.
Signal: Signals hyperscale operators are increasingly locking in dedicated equipment vendor relationships well ahead of future capacity needs.
MAY 2025

Infinera Acquires Optical Component Manufacturer for Vertical Integration

Infinera completed the acquisition of a specialized optical component manufacturer, adding semiconductor design capability and meaningfully reducing dependence on external suppliers for critical performance-determining components across its entire coherent transport product line and its future product development roadmap going forward into the next several years.
Signal: Signals equipment vendors are increasingly pursuing vertical integration to directly control critical semiconductor technology themselves in-house.

Semiconductor Concentration Drives Cost Exposure

Optical semiconductor chips and precision optical components together account for roughly 40% of optical networking equipment manufacturing cost, sourced primarily from a small number of specialized semiconductor foundries and optical component manufacturers concentrated in East Asia and North America. This dependence on concentrated component supply means most equipment vendors, regardless of their own manufacturing location, compete for the same limited global supply base.
A documented optical semiconductor shortage during 2023 pushed component lead times out to 20 to 26 weeks and raised component prices by roughly 18%, according to industry supply chain reporting referenced in company annual disclosures, as simultaneous hyperscale and 5G buildout programs competed for the same limited specialized fabrication capacity. Several equipment vendors delayed customer deliveries as a direct consequence, straining relationships with hyperscale customers that depend heavily on committed deployment schedules.

Smaller optical equipment vendors face a genuine competitive disadvantage here since they lack the purchase volume needed to secure priority allocation from constrained semiconductor suppliers during shortage periods, unlike larger vertically integrated vendors like Huawei. This dynamic favors companies with internal semiconductor design capability, while smaller specialty vendors pursue long-term supply contracts or partial vertical integration as mitigation against recurring supply volatility.
optical-networking-market-cost-volatility-analysis-1790007623292

Vertical Integration Into Semiconductor Design

Larger optical equipment vendors are pursuing vertical integration into semiconductor design and manufacturing, reducing dependence on external component supply and capturing margin previously paid to third-party chip suppliers, while simultaneously improving supply reliability during periods of industry-wide component shortage and allocation pressure across every major customer segment they currently serve throughout the world today.

Qualifying Multiple Semiconductor Foundry Partners

Equipment vendors are qualifying production across multiple semiconductor foundry partners rather than concentrating sourcing with a single provider, reducing exposure to any one facility's capacity constraints during periods of industry-wide demand pressure and allocation competition across the sector, particularly during simultaneous hyperscale and carrier demand spikes affecting the entire industry-wide supply base at once.

Negotiating Long-Term Component Supply Agreements

Mid-sized equipment vendors are negotiating multi-year component supply agreements with committed volume and pricing terms, trading some short-term flexibility for protection against future price spikes and improved allocation priority during periods of industry-wide supply constraint and component scarcity that regularly disrupt less-prepared competitors' committed delivery schedules and long-standing customer relationships built over many years.

Portfolio Architecture for Margin Defence

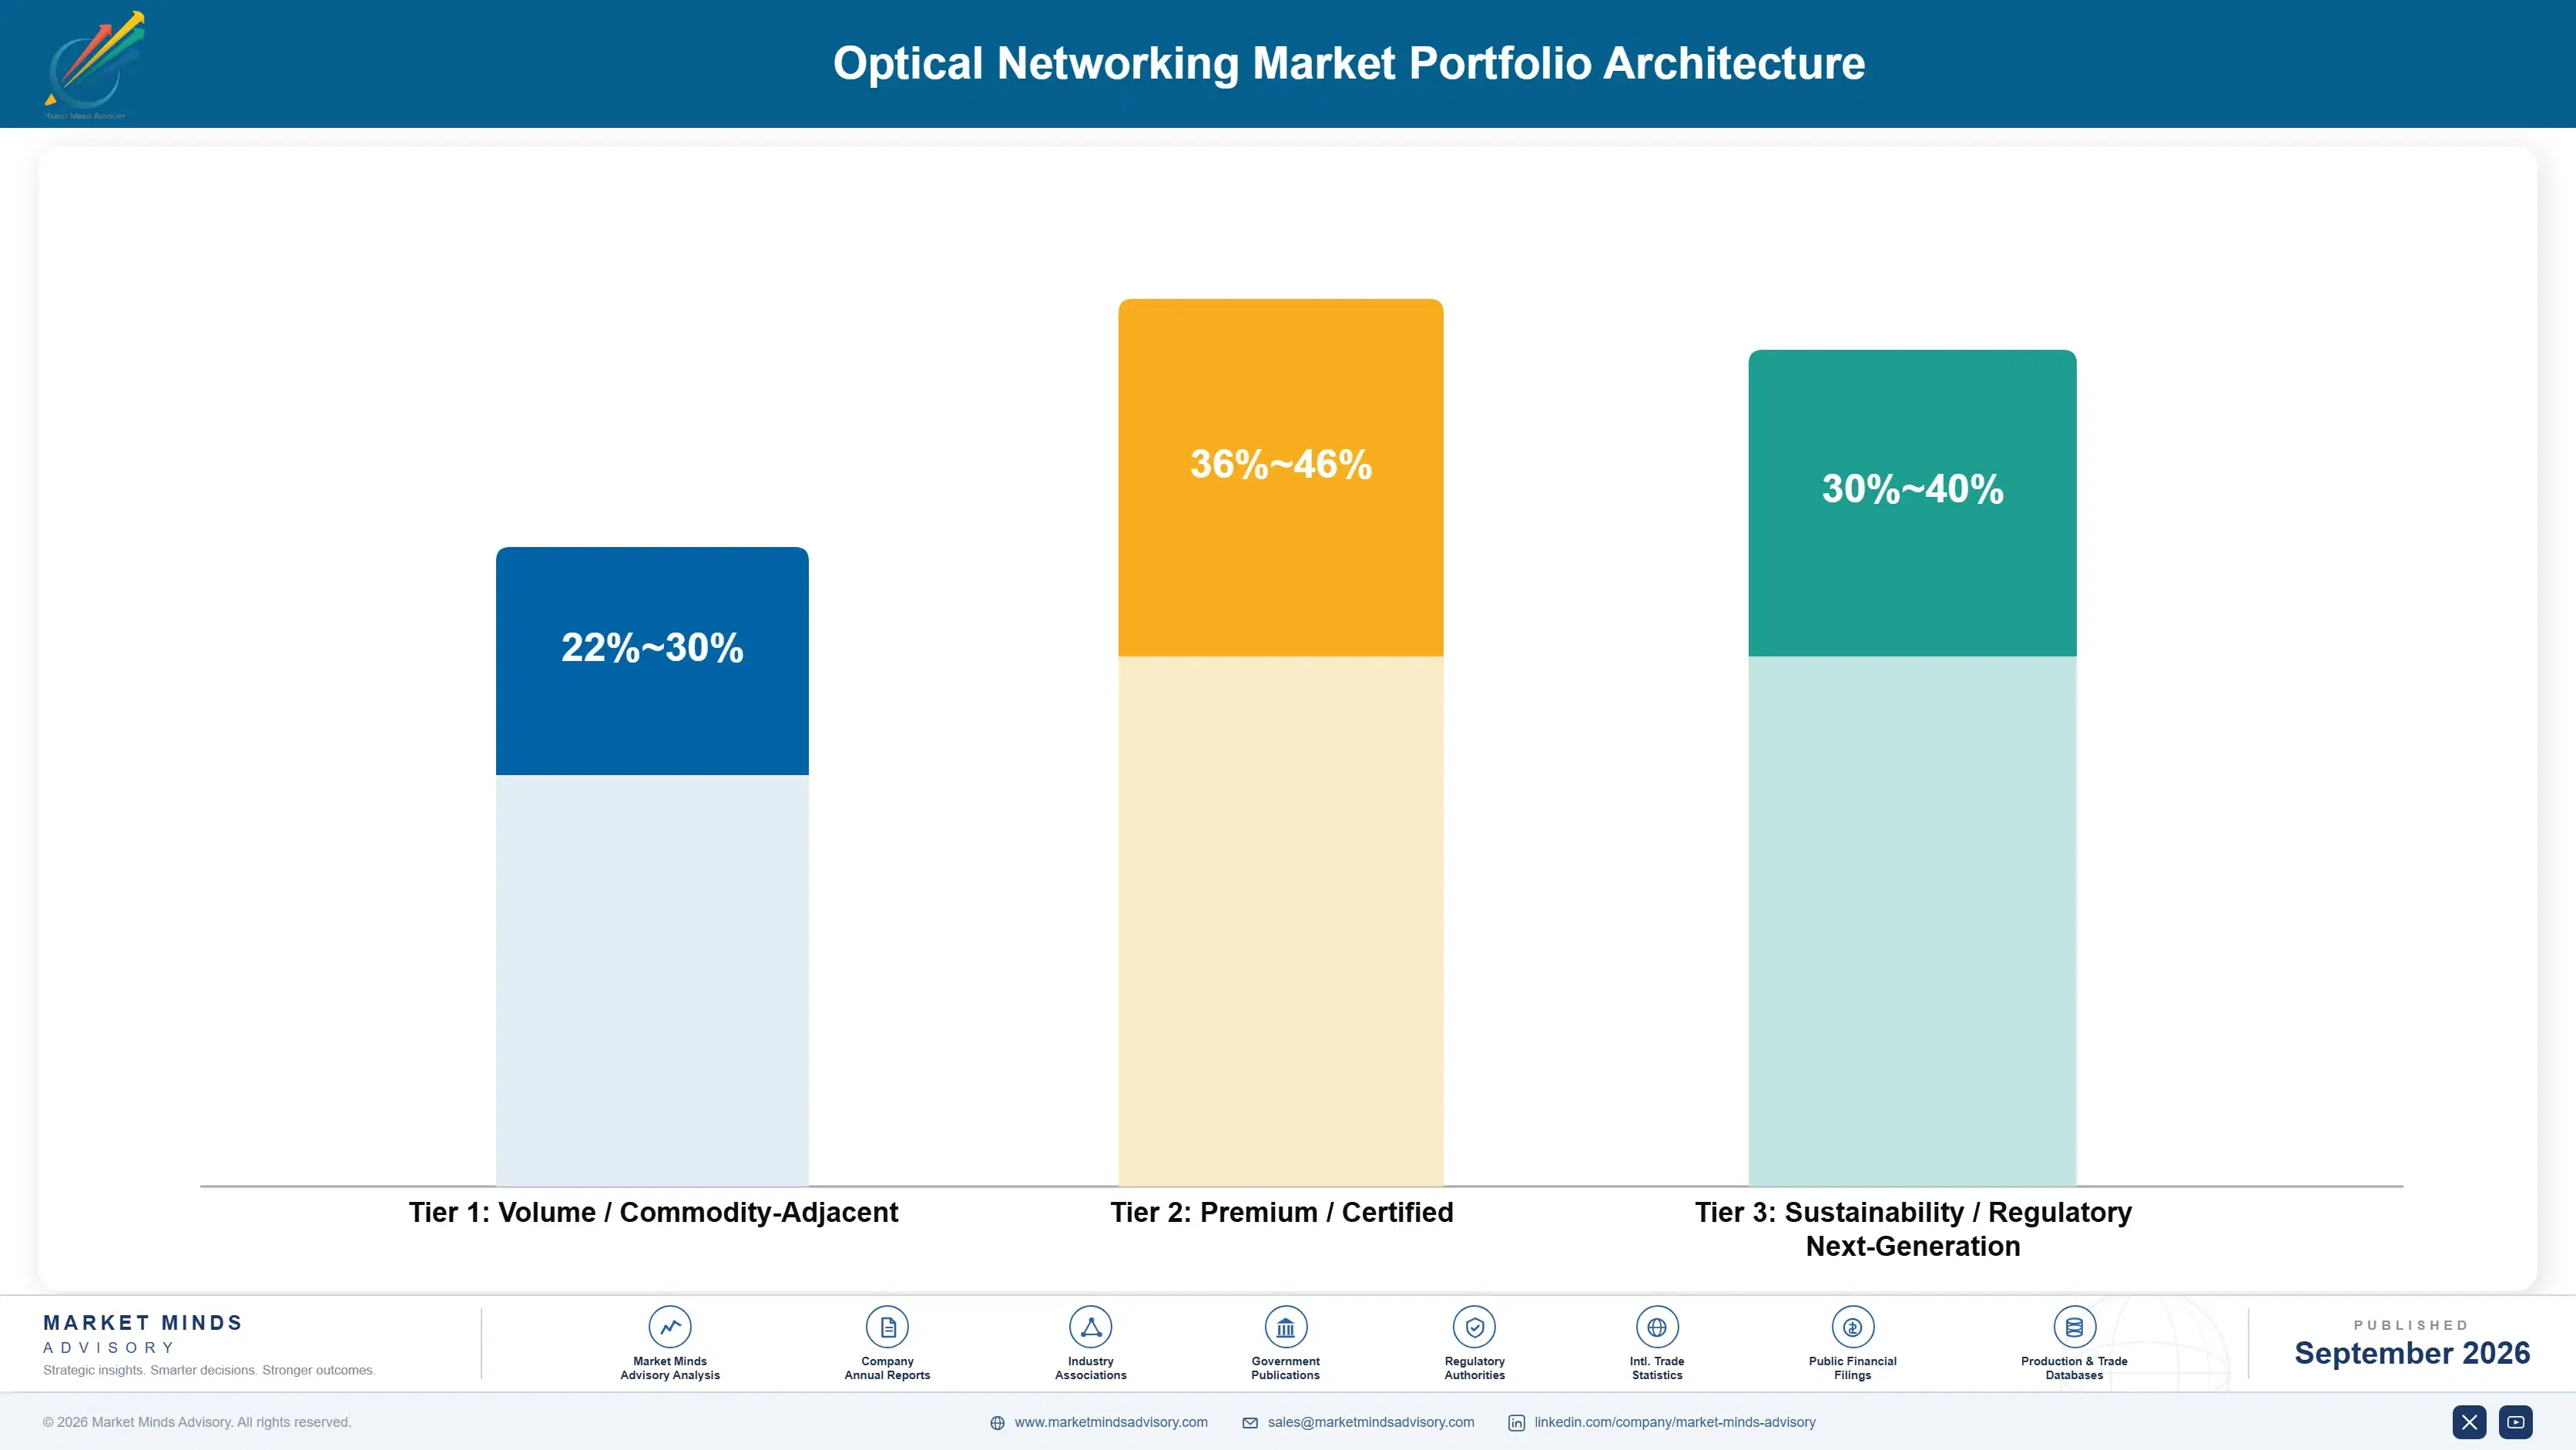
Margin architecture in optical networking splits between commoditized legacy transmission systems and premium coherent transport products. Legacy systems run thin margins given intense competitive bidding among established vendors, while coherent transport for hyperscale interconnect and carrier backbone applications commands substantially richer margins tied to power efficiency and capacity density that only leading vendors with genuine semiconductor design and manufacturing depth can consistently deliver at reliable quality.
Volume carrier equipment sales still generate substantial industry revenue today, but margin economics increasingly favor premium coherent transport as AI infrastructure buildout accelerates well beyond prior data center construction cycles. Vendors positioned only in legacy transmission formats face genuine margin pressure as buyers push pricing down through competitive tenders, forcing many to pursue coherent technology development as a defensive necessity rather than a pure growth opportunity they might otherwise have deferred.

High-value margin pools concentrate in coherent transport for hyperscale interconnect, software-defined network licensing, and managed service extensions, where power efficiency leadership and capacity density command premium pricing that legacy transmission competitors simply cannot match today. Vendors building genuine power efficiency leadership alongside software differentiation increasingly capture the richest margin pools within the entire optical networking industry.

Volume / Commodity-Adjacent

Legacy lower-capacity transmission systems for metro and access networks, bid competitively among established vendors worldwide with limited differentiation beyond delivery speed, unit price, and a basic reliability track record over time.
Gross Margin: 22-30%

Premium / Certified

Coherent transport systems for hyperscale data center interconnect priced for power efficiency and capacity density credentials that only a smaller pool of vendors can consistently deliver at genuine hyperscale production volume and reliability.
Gross Margin: 36-46%

Sustainability / Regulatory / Next-Generation

Software-defined network licensing and managed optimization services positioned ahead of emerging AI cluster architecture standards, commanding premium early-mover pricing before wider competitive entry compresses these margins across the broader industry.
Gross Margin: 30-40%
optical-networking-market-portfolio-architecture-1790007623814

High-value Sub-segments and Strategic Watch-out

Coherent Optical Transport for Hyperscale Data Center Interconnect

The fastest-growing and highest-value segment, combining a 16.0% forecast CAGR with premium margins tied to power efficiency and capacity density. Vendors with proven semiconductor technology capture the richest growth and margin combination across the entire optical networking market today, well ahead of every other product category tracked.
Gross Margin: 38-46%

5G Fronthaul and Backhaul Transport Systems

A high-value segment growing at 11.5% annually, tied to continued global 5G network densification. Margin economics here trail hyperscale interconnect though overall deployment volume remains substantial across most carrier network buildout programs, sustained by continued national broadband and coverage mandate commitments across most developed and emerging markets.
Gross Margin: 28-36%

Legacy Lower-Capacity Metro and Access Transmission Systems

The volume core of the market, generating steady but slower-growing revenue through legacy transmission equipment sales, though continued migration toward coherent technology is slowing overall segment growth toward the market's lower end over the coming forecast period across most developed markets worldwide, particularly in North America and Western Europe.
Gross Margin: 20-26%

Legacy Direct-Detect Transmission Equipment Facing Displacement

A strategic watch-out segment where older direct-detect transmission technology faces gradual displacement from coherent alternatives offering considerably higher capacity per fiber pair across most network tiers, a category facing gradual but steady decline relative to the broader optical networking market's other faster-growing product and technology categories.
Gross Margin: 16-22%

Where Optical Revenue Actually Recurs

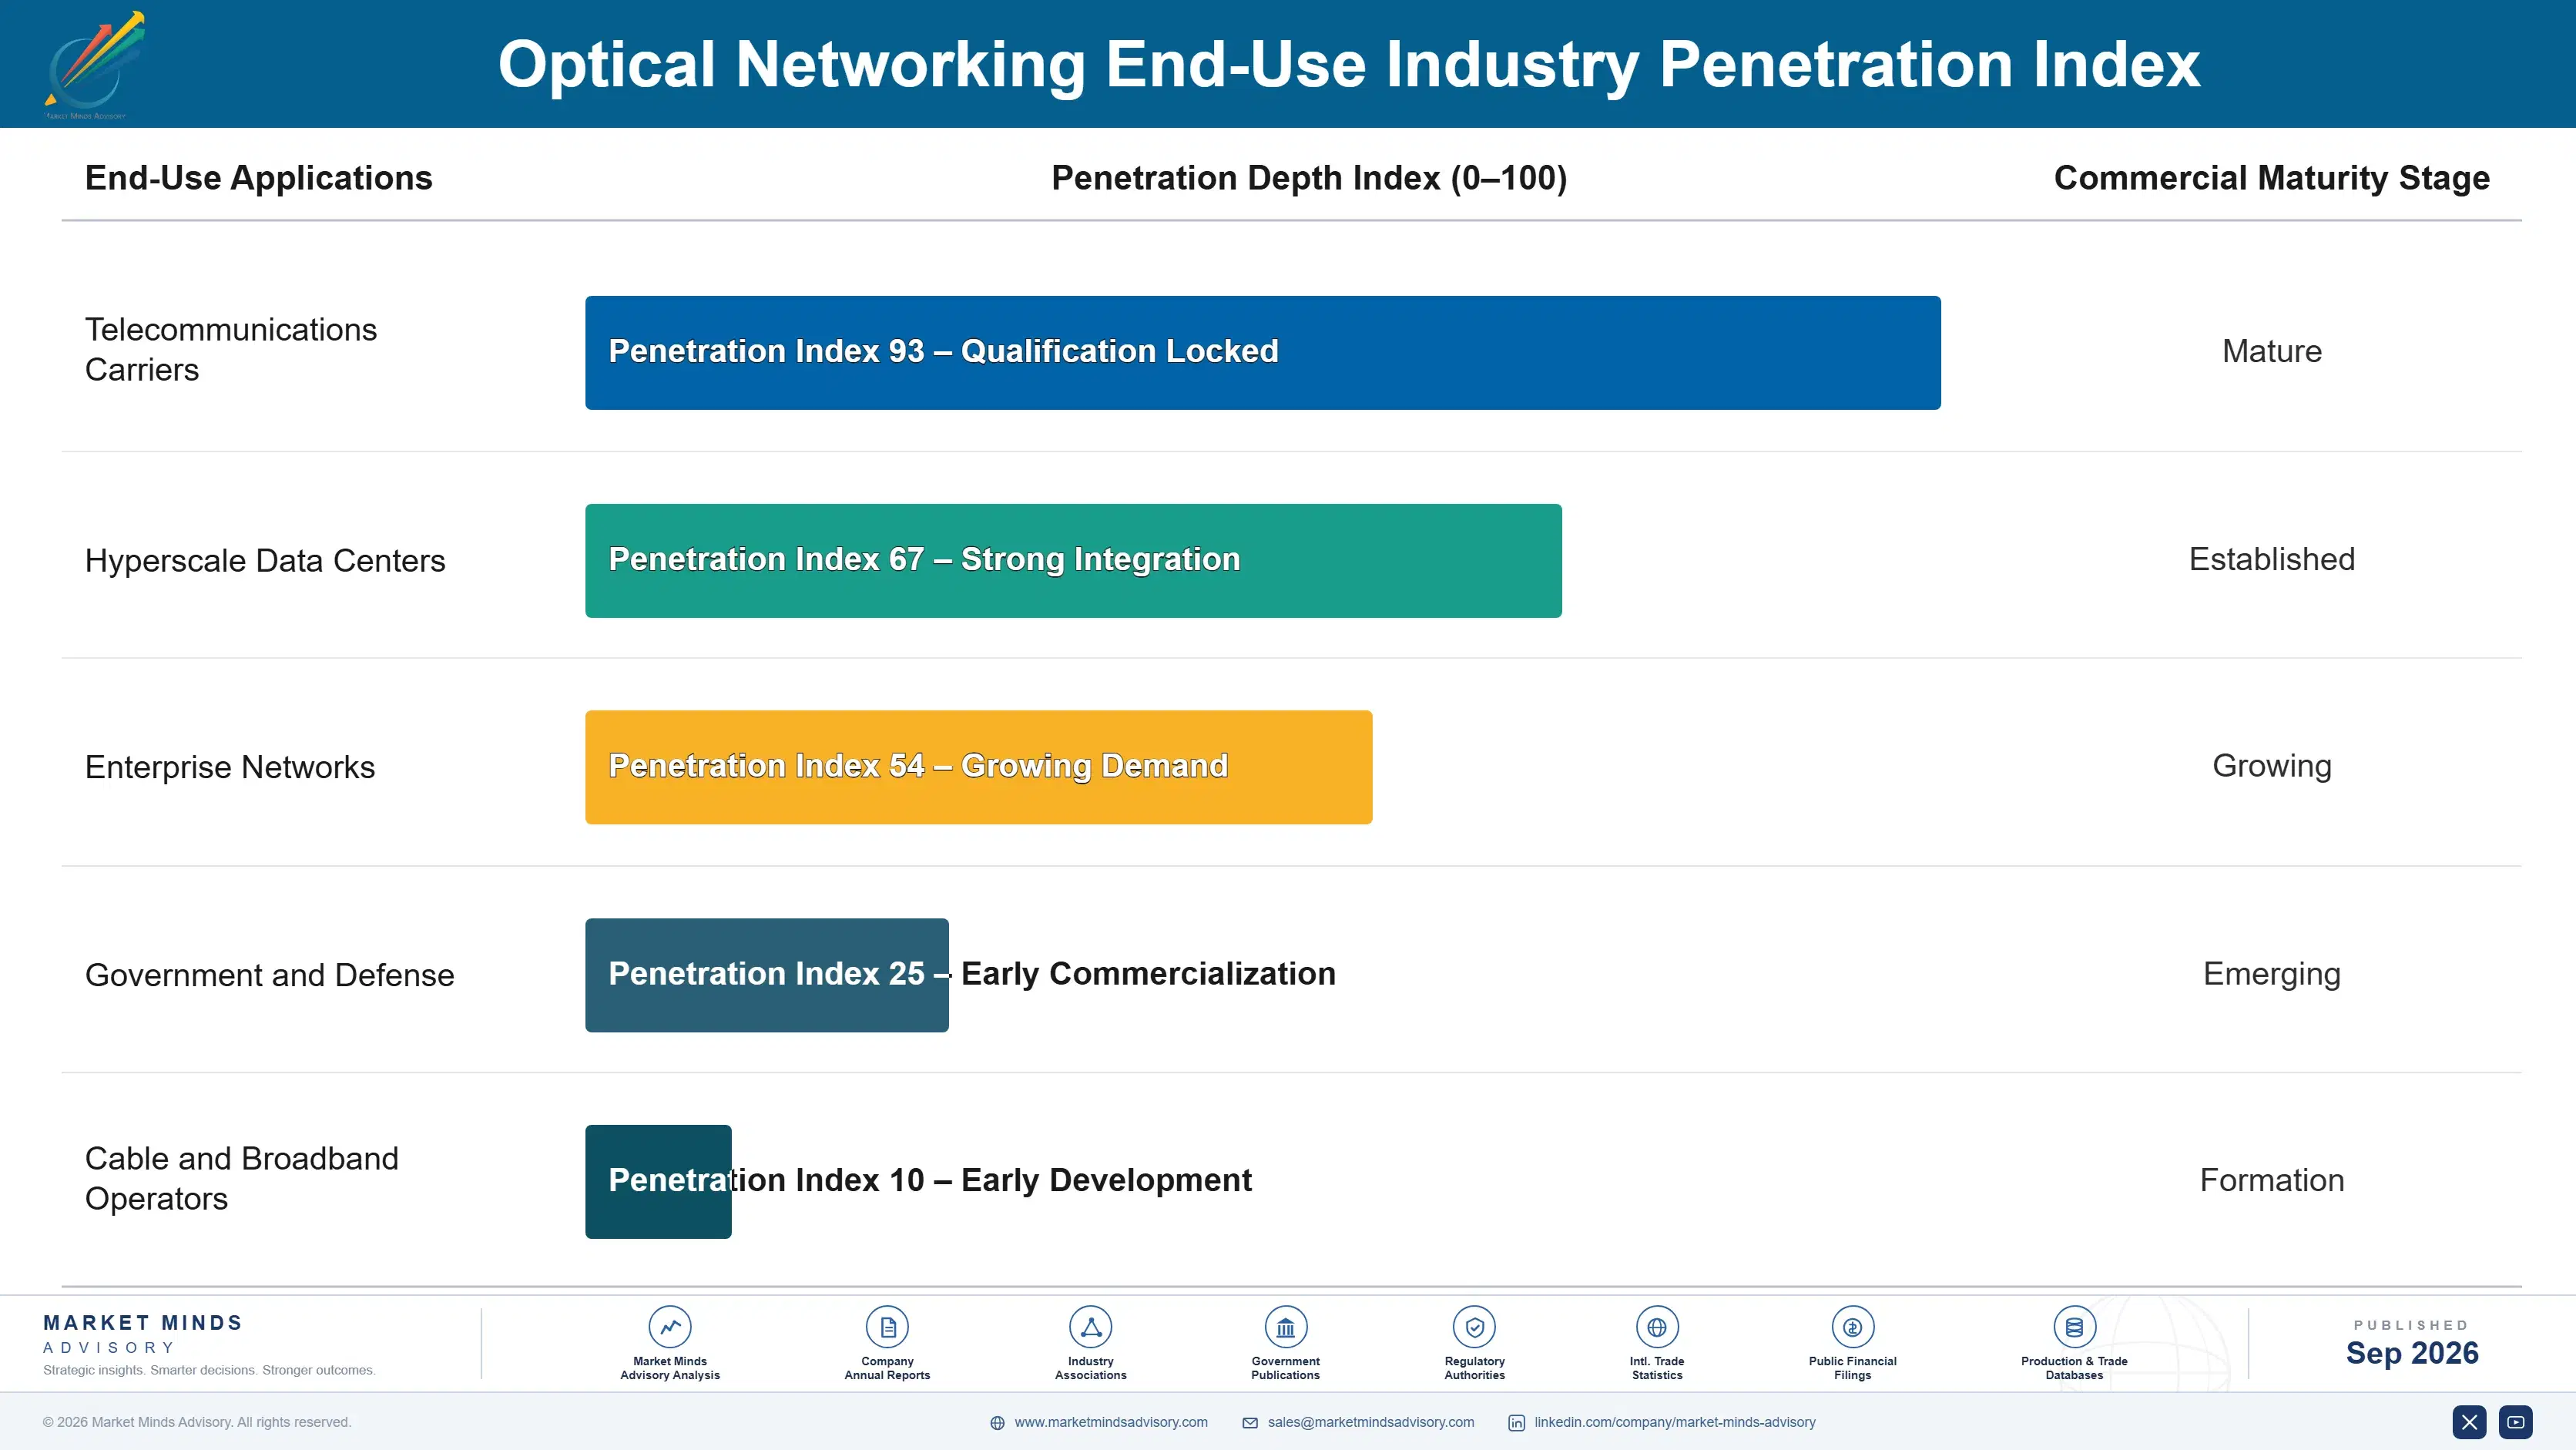
Optical networking revenue builds annuity-like characteristics through multi-year carrier framework agreements and software licensing that follow initial deployment, rather than through one-time equipment sales alone. Carriers and hyperscale customers rarely switch equipment vendors mid-network once initial architecture decisions are made, since replacing an established vendor requires re-certifying interoperability across every deployed component at real cost, schedule risk, and potential network downtime exposure that most customers strongly prefer to avoid.
Adoption stickiness varies meaningfully by end-use vertical: carrier customers show the deepest supplier lock-in, since mission-critical backbone infrastructure cannot tolerate vendor transition risk once operational, while hyperscale customers show comparatively more willingness to multi-source across vendors for competitive leverage and pricing negotiation purposes. Enterprise customers sit in between, with switching costs tied closely to network scale and installed base size.

A generational shift in buyer profile is underway as data center infrastructure and AI capacity planning teams, not just traditional telecom network engineers, increasingly drive optical equipment procurement decisions. These newer buyers evaluate vendors on power efficiency and capacity density metrics rather than pure per-port pricing, reshaping how vendors must position, sell, and structure ongoing account relationships with their largest hyperscale customers.
optical-networking-market-end-use-penetration-index-1790007624304

Where to Compete in Optical Networking

These are among the four positions where our research anticipates prominent divergence between winners and laggards over the coming forecast period. Each is grounded in the demand model, the regulatory perimeter, and the announced capacity pipeline.
01 / POWER EFFICIENCY LEADERSHIP

Invest in efficiency ahead of hyperscale power constraints

Coherent transport for hyperscale interconnect is growing at 16.0% annually, more than sixty percent faster than the market's average pace, yet many mid-tier vendors still compete primarily on raw capacity rather than power efficiency. Vendors that invest in power-efficient semiconductor technology now will capture disproportionate share as hyperscale operators face real power and cooling constraints within their facilities. Waiting until efficiency becomes the dominant selection criterion cedes this position to already-invested competitors that moved first on semiconductor technology investment well ahead of the broader competitive field.
02 / SEMICONDUCTOR VERTICAL INTEGRATION

Pursue vertical integration to control cost and supply risk

Optical semiconductor chips account for roughly 40% of equipment manufacturing cost, and a documented shortage during 2023 pushed lead times out to 26 weeks while raising prices considerably. Equipment vendors without vertical integration face real cost and supply disadvantages against integrated rivals like Huawei that control their own semiconductor production. Mid-sized vendors should pursue partial vertical integration or long-term supply contracts rather than continuing to rely purely on spot market component purchasing during periods of tightening industry-wide semiconductor supply and rising allocation competition.
03 / SOFTWARE REVENUE DEVELOPMENT

Build software licensing revenue beyond hardware margin

Vendors pairing optical hardware with software-defined network management platforms capture revenue that typically reaches 10 to 18% of total contract value annually, well beyond what equipment sales alone generate. Vendors without a genuine software offering face a hard revenue ceiling compared to rivals building recurring platform relationships with their customer base. Firms still selling only hardware should prioritize software development now, before competitors establish deeper, harder-to-displace customer relationships across the exact same hyperscale accounts every competitor in the market is currently targeting.
04 / CARRIER FRAMEWORK AGREEMENTS

Convert deployment contracts into multi-year framework relationships

Integrators that extend initial deployment work into multi-year carrier framework agreements capture revenue visibility tied to disclosed network investment roadmaps rather than competing project-by-project against spot market pricing. These agreements typically span 3 to 5 years aligned with carrier capital investment cycles, providing the confidence needed to justify manufacturing capacity investment. Firms still selling purely transactional contracts should prioritize building these longer-term relationships before rivals establish them first across the same carrier accounts each competing vendor is actively and aggressively pursuing right now.

Engagement Snapshot From the Field

A live engagement with an industry participant carrying material or product regulatory and market exposure ahead of a defining policy shift, showing how our research translates into a defensible multi-year portfolio strategy.
MARKET MINDS ADVISORY · CLIENT ENGAGEMENT SUMMARY
Optical Networking Producer Strategic Portfolio Review and Transition Roadmap 2026·Investment Scenario on Optical Networking Exposure Evaluation 2025-26
CLIENT PROFILE
The client is a global hyperscale cloud operator expanding AI training cluster capacity across multiple continents, with annual data center capital expenditure reportedly exceeding $30 billion (client-reported, unverified by MMA). The operator's network engineering organization sought to diversify its qualified optical equipment supplier base beyond two incumbent vendors that had historically supplied most coherent transport equipment across its global facility footprint.
STRATEGIC CHALLENGE
The client faced growing supply concentration risk after a 2023 semiconductor shortage delayed several planned facility interconnect upgrades by multiple months, exposing the fragility of relying on just two qualified vendors for equipment critical to every new data center connection. Leadership needed an objective framework for evaluating additional vendors without compromising the power efficiency standards their AI cluster architecture required.
MMA APPROACH
MMA conducted a structured vendor capability assessment across eight candidate optical equipment manufacturers, evaluating power efficiency per bit, semiconductor supply resilience, and historical delivery reliability disclosed through vendor interviews. The engagement combined primary interviews with the client's network engineering and procurement teams alongside capability scoring against the client's existing qualification benchmark criteria.
KEY FINDINGS
  1. Only three of eight candidate vendors met the client's power efficiency threshold consistently across multiple product generations reviewed carefully throughout the entire vendor assessment process.
  2. Vendors with vertical semiconductor integration showed meaningfully more stable lead times during simulated shortage scenarios modeled throughout the entire engagement assessment period.
  3. Geographic diversification beyond the client's existing two-vendor base reduced simulated single-source disruption exposure by roughly 42% under the modeled stress testing scenarios applied.
  4. Two candidate vendors offered coherent transponder formats that could reduce the client's per-link power consumption by approximately 18%, lowering total operating cost.
CLIENT PROFILE
The client is a global hyperscale cloud operator expanding AI training cluster capacity across multiple continents, with annual data center capital expenditure reportedly exceeding $30 billion (client-reported, unverified by MMA). The operator's network engineering organization sought to diversify its qualified optical equipment supplier base beyond two incumbent vendors that had historically supplied most coherent transport equipment across its global facility footprint.
STRATEGIC CHALLENGE
The client faced growing supply concentration risk after a 2023 semiconductor shortage delayed several planned facility interconnect upgrades by multiple months, exposing the fragility of relying on just two qualified vendors for equipment critical to every new data center connection. Leadership needed an objective framework for evaluating additional vendors without compromising the power efficiency standards their AI cluster architecture required.
MMA APPROACH
MMA conducted a structured vendor capability assessment across eight candidate optical equipment manufacturers, evaluating power efficiency per bit, semiconductor supply resilience, and historical delivery reliability disclosed through vendor interviews. The engagement combined primary interviews with the client's network engineering and procurement teams alongside capability scoring against the client's existing qualification benchmark criteria.
KEY FINDINGS
  1. Only three of eight candidate vendors met the client's power efficiency threshold consistently across multiple product generations reviewed carefully throughout the entire vendor assessment process.
  2. Vendors with vertical semiconductor integration showed meaningfully more stable lead times during simulated shortage scenarios modeled throughout the entire engagement assessment period.
  3. Geographic diversification beyond the client's existing two-vendor base reduced simulated single-source disruption exposure by roughly 42% under the modeled stress testing scenarios applied.
  4. Two candidate vendors offered coherent transponder formats that could reduce the client's per-link power consumption by approximately 18%, lowering total operating cost.
RECOMMENDED STRATEGY
Phase 1: Phase 1 (Qualification): Formally qualify two additional vendors meeting power efficiency and supply benchmarks within the next two fiscal quarters. Phase 2: Phase 2 (Diversification): Shift 25% of total interconnect equipment procurement volume to newly qualified vendors over the following eighteen months. Phase 3: Phase 3 (Resilience): Negotiate multi-year framework agreements with all qualified vendors, including committed capacity reservation, pricing, and delivery reliability clauses.
OUTCOME
The client qualified two additional vendors within the recommended timeframe and began shifting incremental volume as planned. Internal tracking reportedly showed a 33% reduction in single-supplier concentration risk within twelve months (client-reported, unverified by MMA), alongside improved delivery reliability during a subsequent minor semiconductor supply disruption.

Frequently Asked Questions

Foundational context covering the market sizes, CAGR, scope, country, region and competition that inform every finding below. This section is provided to cover basics and most often pre-purchase conversations, answered from the MMA Primary Research Dataset.

What is the current size of the Optical Networking Market?

The Optical Networking Market reached $22.5 billion in 2025, driven by hyperscale AI infrastructure buildout and continued 5G network densification worldwide across most major markets today.

How large will the Optical Networking Market be by 2036?

The market is projected to reach $61.06 billion by 2036, roughly 2.48 times its 2026 level, as coherent transport becomes standard hyperscale interconnect infrastructure across most global networks.

What is the CAGR for the Optical Networking Market 2026 to 2036?

The market is forecast to grow at a 9.5% compound annual rate between 2026 and 2036, with coherent transport growing considerably faster than legacy transmission categories.

Which segment is growing fastest?

Coherent optical transport for hyperscale data center interconnect leads at 16.0% CAGR, roughly 1.68 times the overall market's average growth pace through the forecast period.

Who are the major companies in the Optical Networking Market?

Huawei, Nokia, Ciena, Infinera, and ZTE Corporation lead the market, together holding roughly 62% of global optical networking revenue across all major product and technology categories.

Which country is growing fastest?

China leads country-level growth at roughly 12.5% CAGR, driven by massive domestic telecom infrastructure investment and rapid hyperscale data center buildout occurring across the country.

Report Segmentation Architecture

The full report scope spans multiple orthogonal segmentation dimensions, with cross-tabulated demand data provided for each dimension pair. Coverage extends further to regional breakdowns, trend trajectories, and the competitive detail needed to support segment-level decision-making.

By Transmission Technology

  • Coherent Optical Transport
  • Wavelength Division Multiplexing
  • Optical Switching
  • Pluggable Optics
  • Direct-Detect Systems
  • Others

By End-Use Industry

  • Telecommunications Carriers
  • Hyperscale Data Centers
  • Enterprise Networks
  • Government and Defense
  • Cable and Broadband Operators

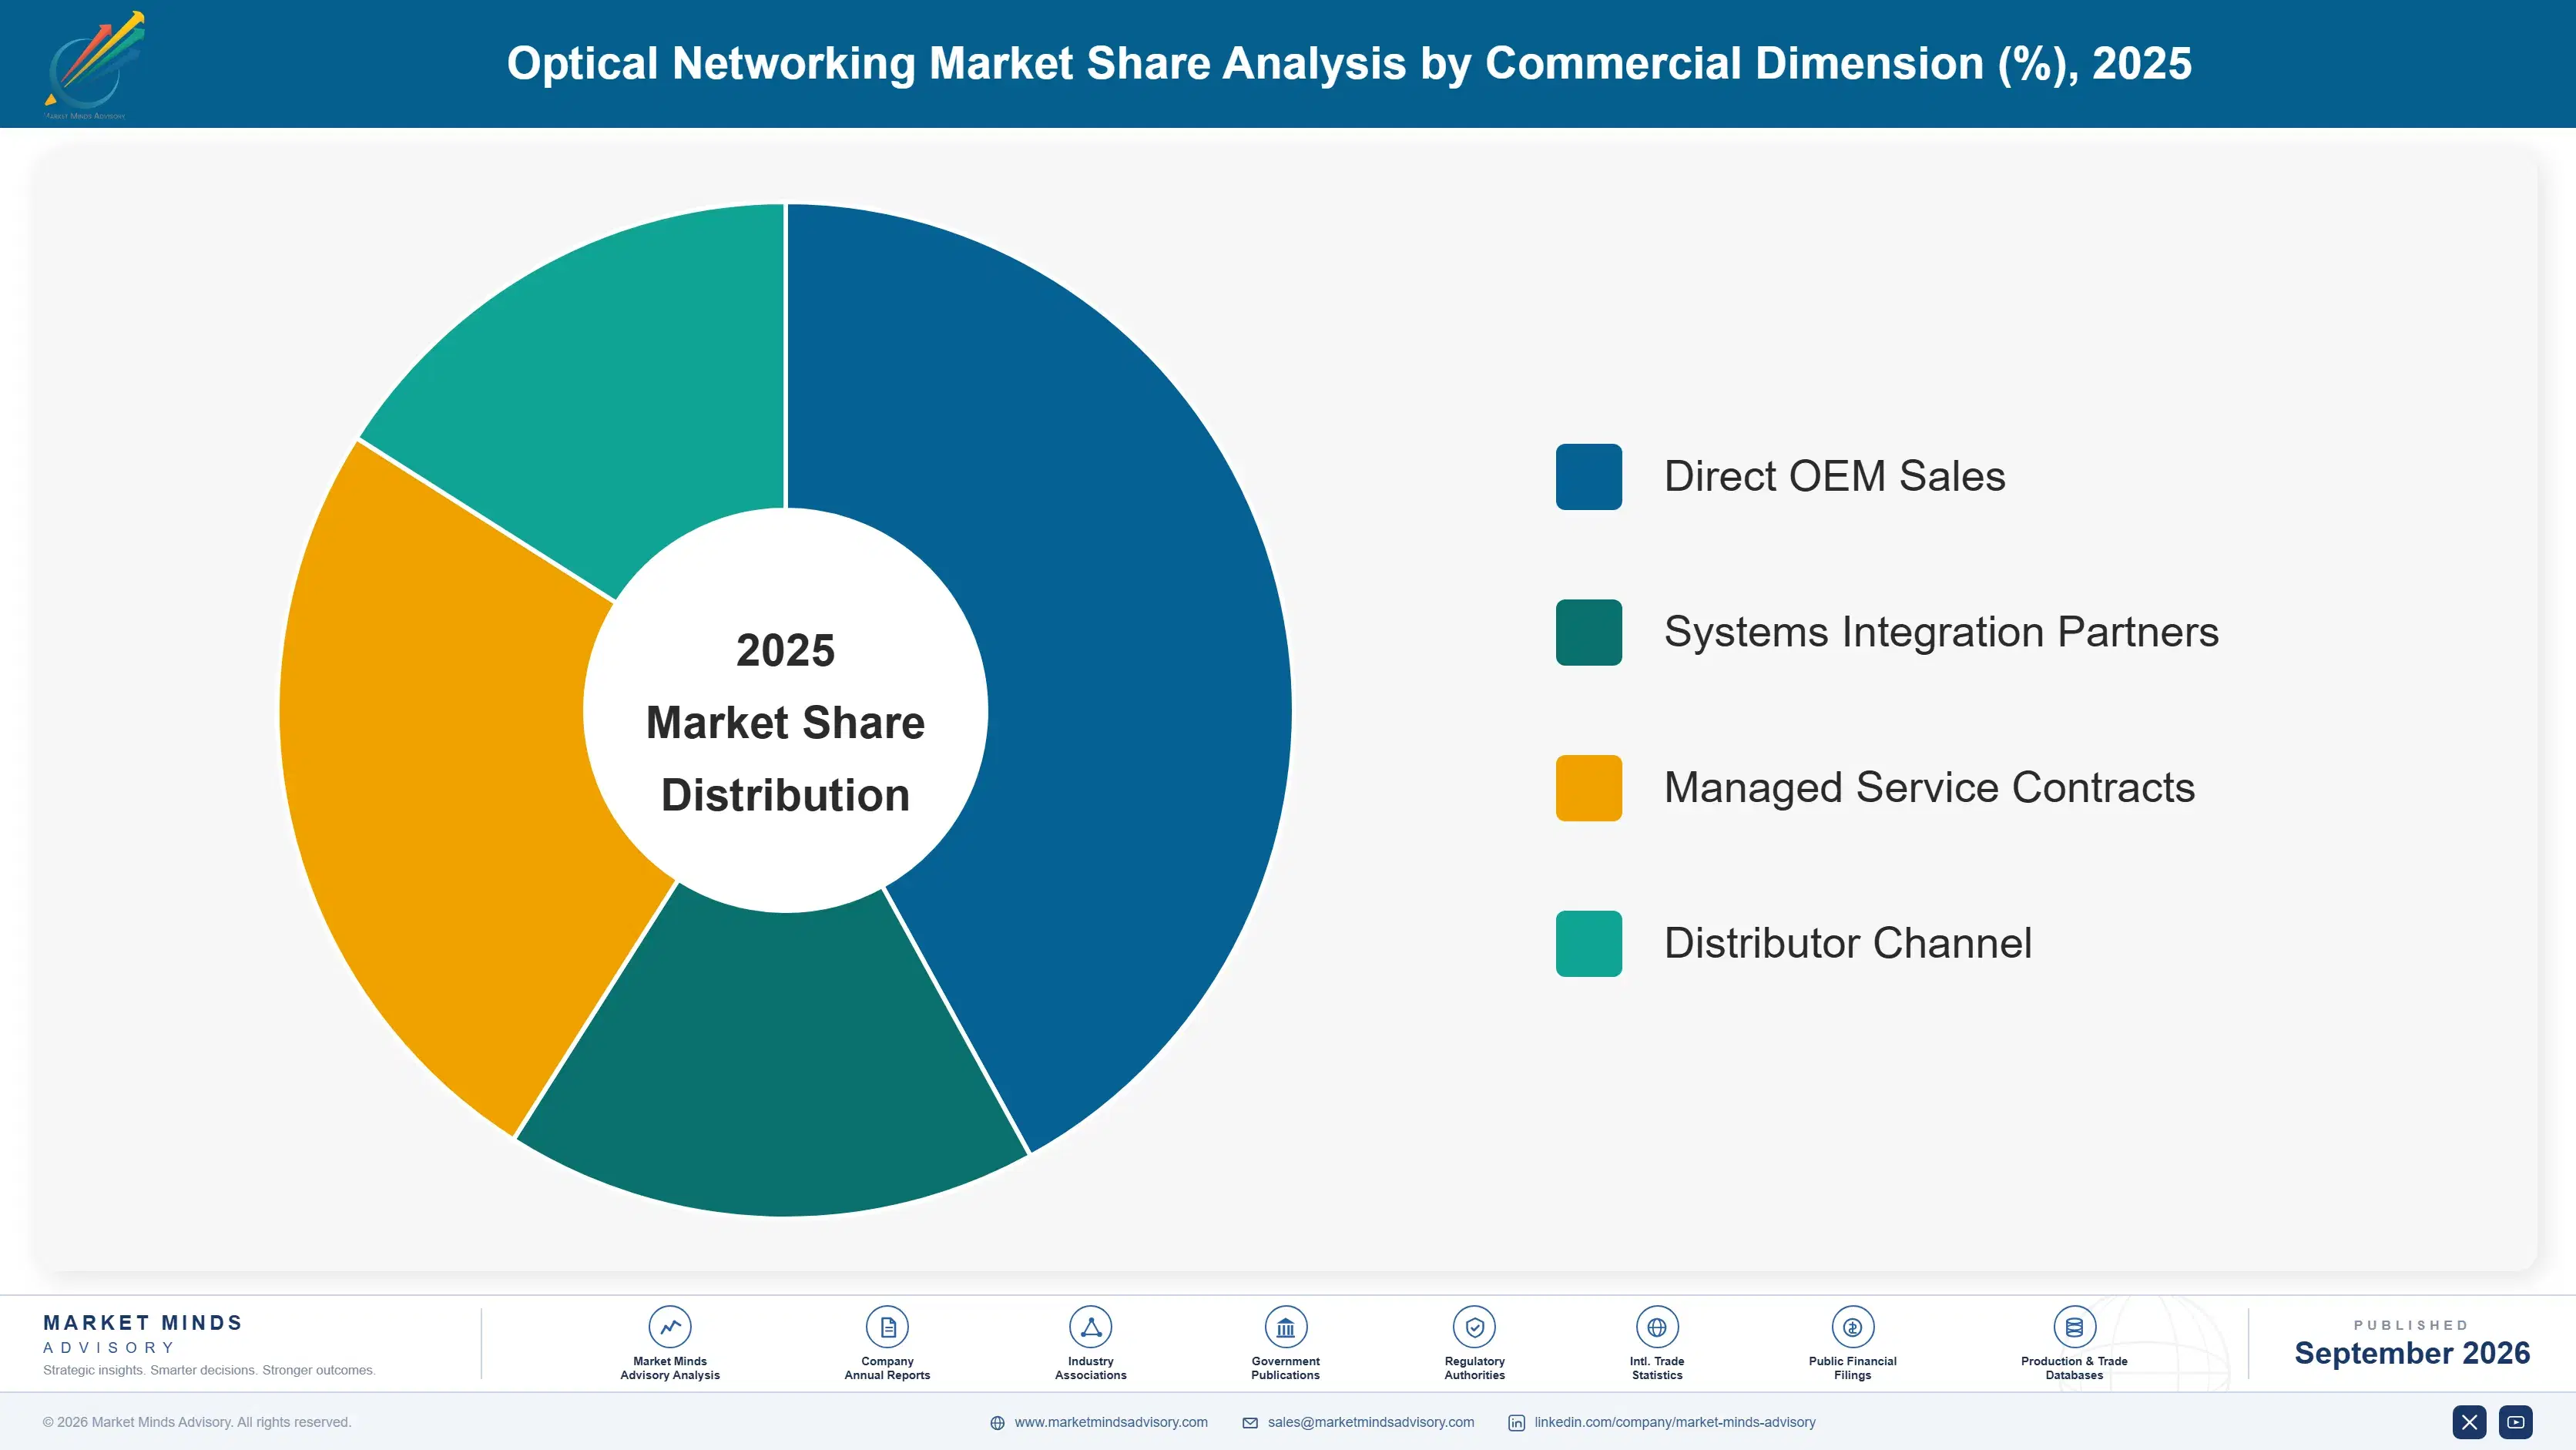
By Commercial Dimension

  • Direct OEM Sales
  • Systems Integration Partners
  • Managed Service Contracts
  • Distributor Channel

By Region

  • North America
  • Western Europe
  • East Asia
  • South Asia and Pacific
  • Latin America
  • Middle East and Africa
  • Eastern Europe

Scope, Methodology, and Coverage

Every figure in this report is reproducible from documented input assumptions. The scope below maps the historical period, the forecast horizon, the segmentation dimensions, and the countries covered, alongside the underlying primary and qualitative methodology.
Historical Period
2020 to 2025
Forecast Period
2026 to 2036
Base Year
2025 (USD billions; MMA Primary Research Dataset, September 2026)
Market Definition
The Optical Networking Market covers transmission equipment, including coherent optical transponders, wavelength division multiplexing systems, and optical switching hardware used to carry high-capacity data traffic across telecom, data center, and enterprise networks. It excludes fiber optic cable manufacturing, passive optical components, and network management software sold separately from transmission hardware.
Quantitative Units
USD billions (current prices); port shipment volume where applicable
Segmentation Dimensions
By Transmission Technology; By End-Use Industry; By Commercial Dimension; By Region
Regions Covered
North America, Western Europe, East Asia, South Asia and Pacific, Latin America, Middle East and Africa, Eastern Europe
Countries Covered
USA, China, Germany, France, UK, Japan, South Korea, India, Australia, Canada, Brazil, Mexico, Indonesia, Vietnam, Thailand, Malaysia, UAE, Saudi Arabia, South Africa, Nigeria, Turkey, Poland, Netherlands, Italy, Spain, Sweden, Switzerland, Argentina, Colombia, Singapore, and additional markets relevant to this sector
Key Companies Profiled
Huawei, Nokia, Ciena, Infinera, ZTE Corporation, Cisco Systems, Fujitsu, NEC Corporation, Adtran, Ribbon Communications, Juniper Networks, Coherent Corp, Lumentum Holdings, Marvell Technology, Broadcom, Acacia Communications, II-VI Incorporated, Cambricon Technologies, Innolight Technology, Accelink Technologies
Quantitative Methodology
Primary survey, n=3,800 respondents, Q4 2025, six countries; demand-side model with trade association cross-validation
Qualitative Methodology
47 expert interviews, Q4 2025; applied to validate demand model assumptions, identify emerging dynamics, and assess competitive positioning
Report Format
PDF and XLSX data workbook (Word format preview document)
Publisher
Market Minds Advisory
Report Code
MMA-2026-TEC-107
Published
September 2026
Contact
sales@marketmindsadvisory.com | www.marketmindsadvisory.com

Purchase the full Optical Networking Market Report (2026 to 2036).

This report delivers a comprehensive analysis of the global Optical Networking Market, covering sizing, segmentation, regional dynamics, and competitive positioning through 2036. It profiles the twenty leading optical equipment manufacturers. The analysis examines coherent transport technology barriers shaping vendor economics, and it quantifies input cost exposure tied to semiconductor supply concentration across the industry's global manufacturing base. Readers gain access to detailed regional demand mechanisms across all seven global regions, alongside forward-looking scenario analysis spanning bull, base, and bear growth cases through the full ten-year 2026 to 2036 forecast period covered in this report.
Ten-year market sizing and forecast model
Twenty-company competitive benchmarking and profiling analysis
Seven-region demand and CAGR breakdown tables
Coherent transport technology barrier and adoption analysis
Input cost and semiconductor supply risk assessment
Revenue lever and margin architecture framework

Built For The People Who Decide

From boardroom strategy to bench-side execution, this report is read cover-to-cover by leaders shaping the next decade of their industry, turning demand scenarios, market dynamics and valuation benchmarks into decisions.
CXOs/ Presidents/ VPs/ Managers
M&A and Corporate Development
Strategy Teams and R&D Heads
Procurement and Product Directors
Regulatory and Compliance Leaders
Investor Relations and Equity Analysts