

Market Minds Advisory
Optical Materials Market

Optical Materials Market: Melt Yield Economics, Infrared Transition and Rare Earth Cost Exposure, 2026 to 2036

Thermal imaging has moved out of defence budgets and into ordinary vehicle safety systems, and the chalcogenide glass melting capacity that this transition requires barely exists outside three companies worldwide.

Lead Analyst

Bilal Shaikh

Published

September 2026

Make Smarter Decisions with Customized Research Insights

Request a free sample report and evaluate market opportunities, growth trends, and competitive dynamics relevant to your business needs.

2025 MARKET VALUE$6.5BMarket Size 2025
2036 FORECAST VALUE$14.9BBase Case , 2026 to 2036
CAGR 2026 TO 20367.8 %Bull 9.0% / Bear 6.5%
INCREMENTAL OPPORTUNITY$7.8BNet 10- year value creation
EXPANSION MULTIPLE2.12x2036 value over 2026 base
Strategic Levers
M&A Pipeline
Regional Outlook
Country Rankings
Competitive Intelligence
Segmental Deep-dive
Call-Us : 91 93563 13602

Executive Snapshot and Market Trajectory

Infrared has become the growth engine and almost nobody can supply it. Thermal imaging has moved out of defence procurement into automotive night vision, industrial condition monitoring and building inspection work, and the chalcogenide glass melting capability that serves all of it sits with very few producers indeed.
Chalcogenide and infrared glass grows at 11.7%, a full 1.50 times the market rate, pulled by uncooled microbolometer camera volumes that germanium optics can no longer supply affordably. East Asia holds 38% of global value, well above the standard regional band, because Japanese producers dominate precision optical glass melting and Chinese producers have scaled aggressively behind them across the entire grade range.
The top five hold 41% of revenue, and the field divides on melting capability rather than on finishing capacity. Glass melt yield averages 62% against optical specification, which means a third of every batch is rejected before any lens is pressed, and that yield gap is where the real cost difference between producers actually lives. Rare earth oxide pricing is the persistent exposure, since high-index formulations depend on lanthanum and gadolinium priced outside anyone's control.
Market Definition
The market covers bulk optical materials supplied for transmissive and reflective optics: precision optical glass, fused silica and quartz optics, chalcogenide and infrared glass, single-crystal materials including sapphire and calcium fluoride, transparent optical ceramics, and high-index optical polymers. It excludes finished lens assemblies and optical modules, optical fibre and preforms, display glass, ophthalmic finished lenses, thin-film coating services, and semiconductor photomask substrates sold as patterned product.
Base Year Value
$6.5B in 2025 (MMA Primary Research Dataset, August 2026)
Forecast Period
2026 to 2036, eleven discrete annual values
CAGR
7.8% base case. Bull 9.0%. Bear 6.5%.
Fastest Growth Segment
Chalcogenide and Infrared Glass: 11.7% CAGR
Fastest Growth Country
China: 10.4% CAGR
Fastest Growth Region
South Asia and Pacific: 10.1% CAGR
Largest Region
East Asia: 38% of 2025 global value
Market Leaders
Hoya, Schott, Ohara, CDGM Glass, Corning. Source: MMA Primary Research Dataset, July 2026.
Primary Survey
n=3,800 procurement and R&D decision-makers, Q4 2025, six countries
Methodology
Demand-side build-up, cross-validated against public data, 47 expert interviews

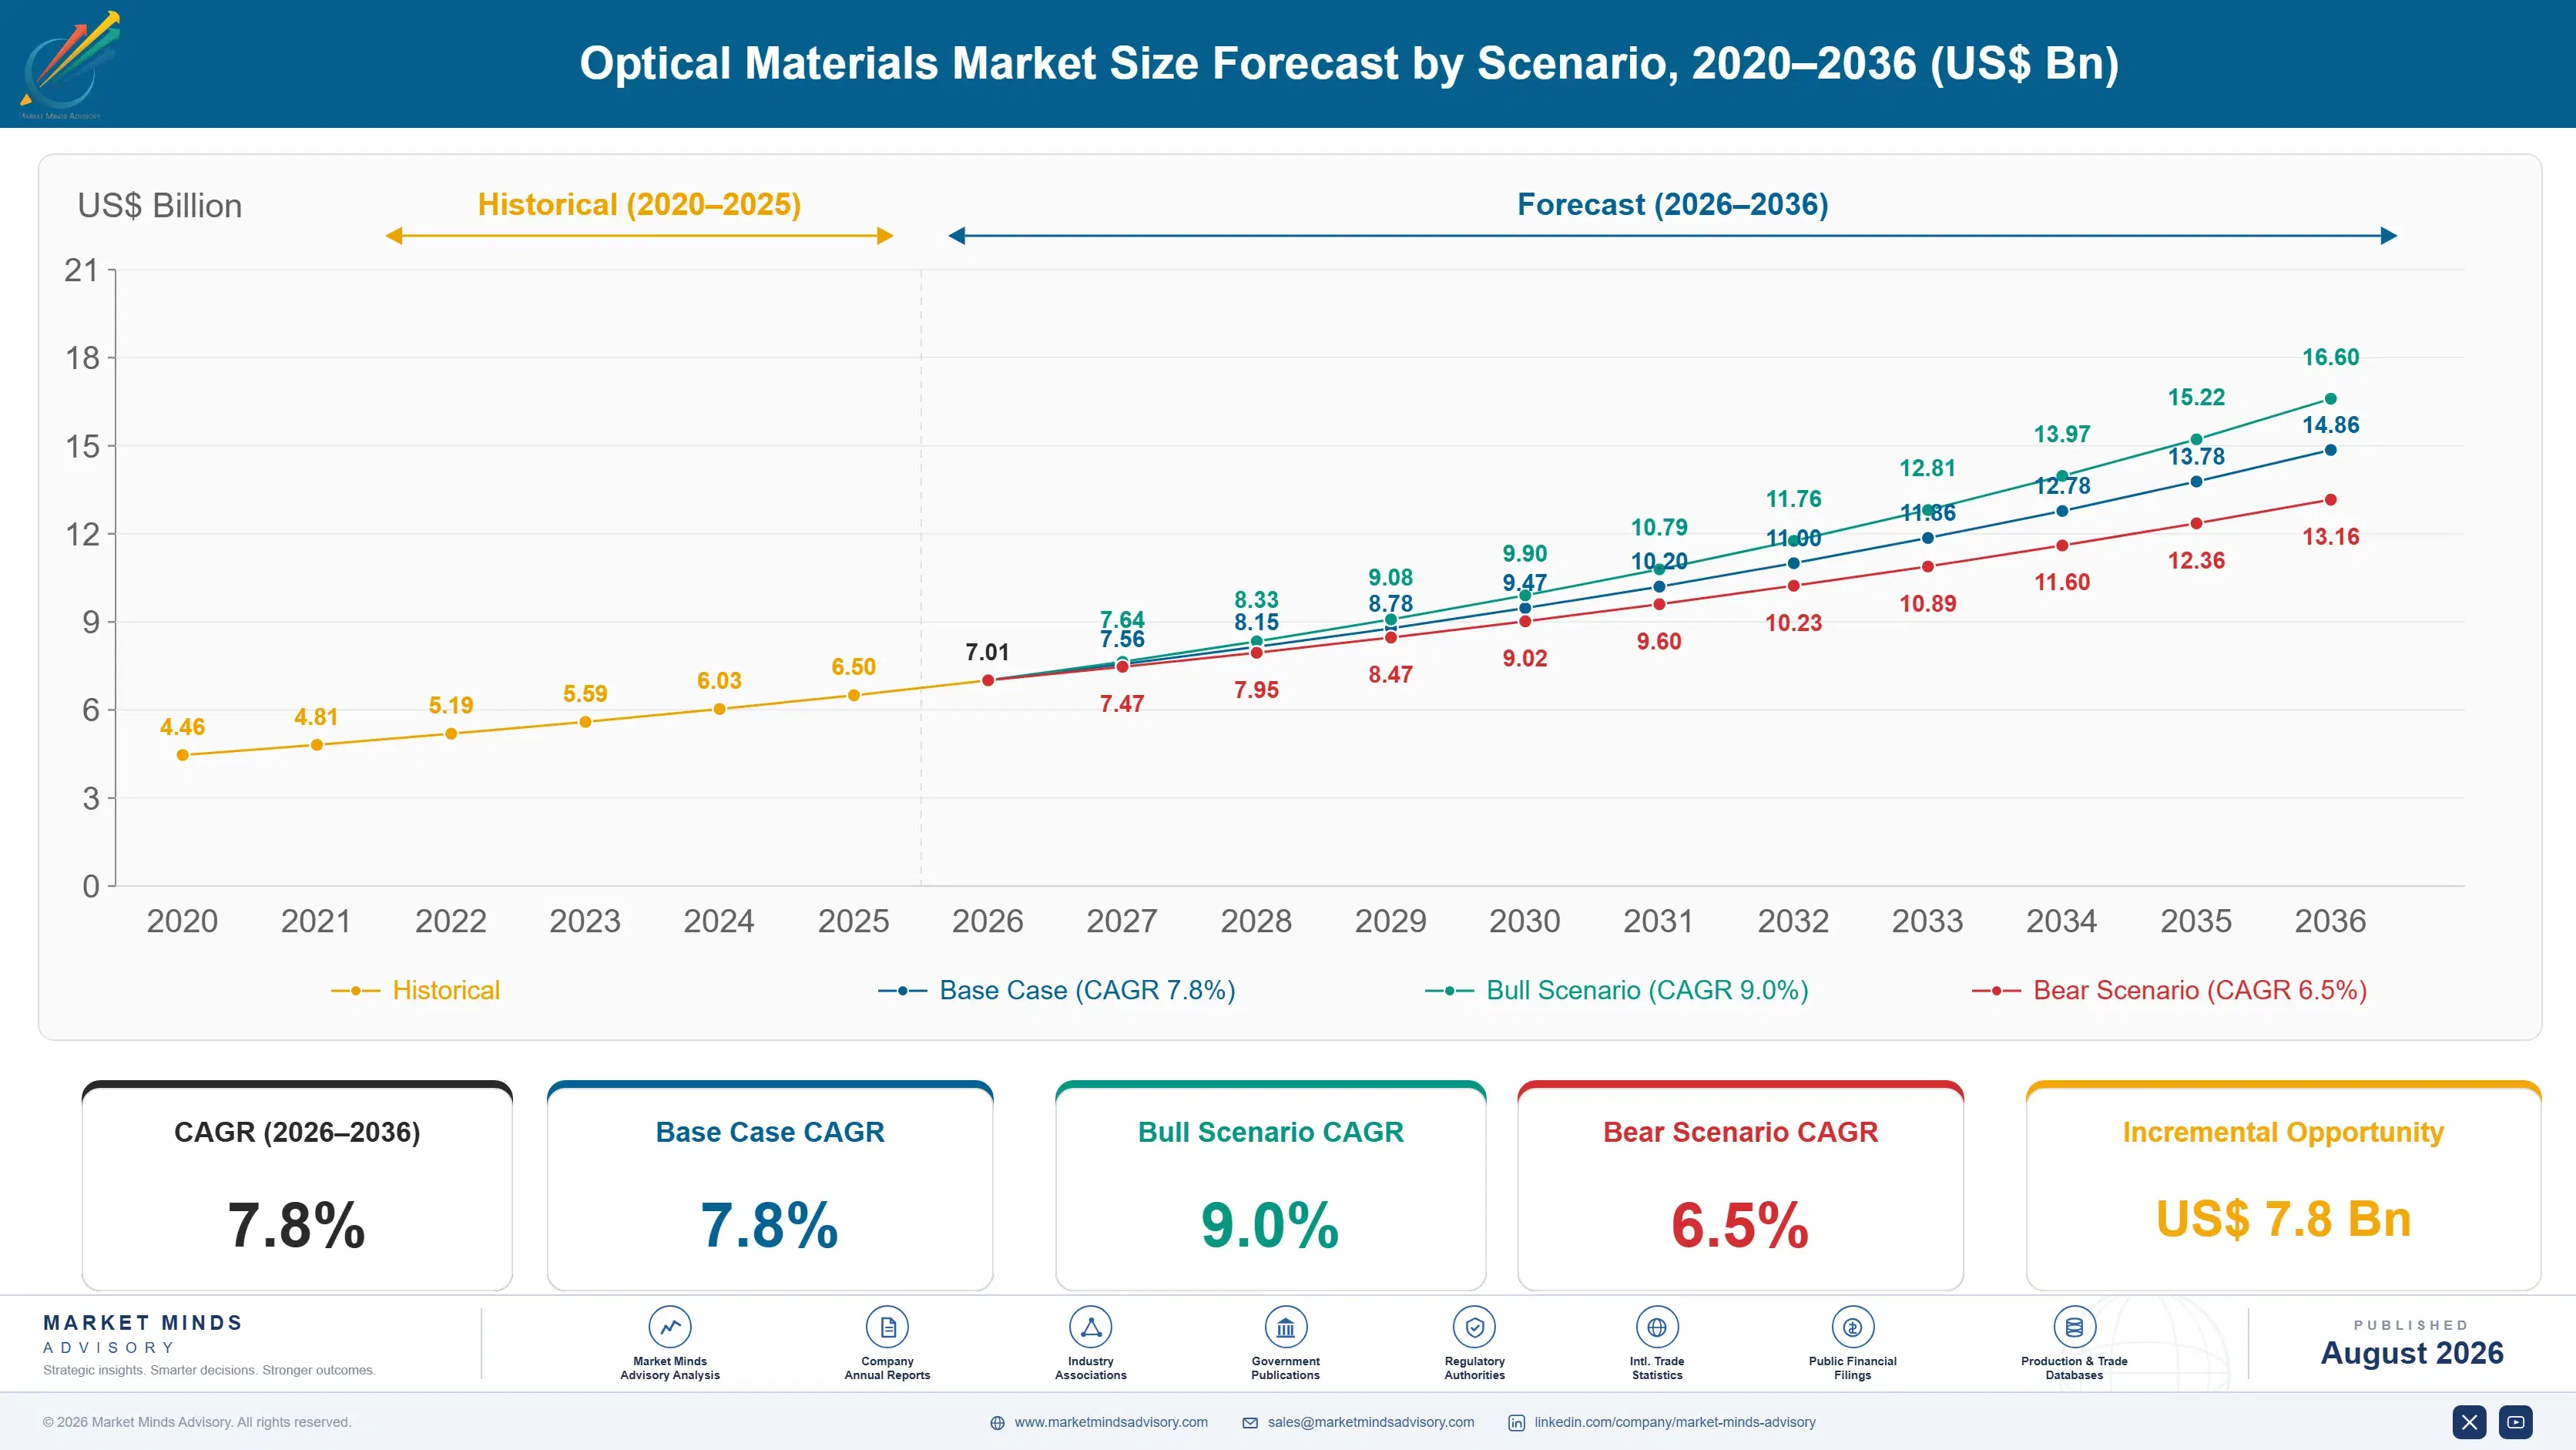
Optical Materials Market Forecast Scenarios

optical-materials-market-trends-size-forecast-scenario-1787311675752
The market compounded at 6.6% between 2020 and 2025, and the mix changed more than the total did. Consumer camera module demand flattened as smartphone optics matured, while automotive sensing, machine vision and thermal imaging all grew quickly. Rare earth oxide pricing spiked through 2021 and 2022, and producers of high-index glass spent two years recovering margin rather than adding capacity.
The 7.8% base case rests on three mechanisms. First, automotive sensing keeps adding optical content per vehicle as camera counts rise and thermal imaging enters mid-range platforms. Second, semiconductor lithography and inspection consume fused silica and calcium fluoride at volumes that track wafer capacity investment rather than consumer cycles. Third, grade mix shifts upward as infrared and high-index materials take share from conventional crown and flint glass in value terms.
The bull case at 9.0% assumes automotive thermal imaging adoption accelerates on regulatory pressure for pedestrian detection at night, which would multiply chalcogenide demand very quickly. The bear case at 6.5% assumes a semiconductor capital spending pause of the kind that followed 2022, combined with rare earth oxide pricing staying elevated enough to slow high-index glass adoption across cost-sensitive consumer optics.

Why Melt Yield Decides Cost Position

Optical materials look like a glass business and behave like a yield business. Melting a borosilicate or lanthanum-bearing formulation is understood chemistry. Producing it with refractive index held to five decimal places, no striae, no inclusions and consistent dispersion across a whole melt is what separates producers.
TOP FIVE CONCENTRATION41%Combined position of the five largest optical material producers
AVERAGE SELLING PRICE$185 per kilogramTypical realised price across glass and crystal grades
TOP PRODUCING COUNTRY SHARE34%Japanese share of global precision optical glass output
MELT YIELD RATE62%Share of melted glass meeting optical specification without rejection
RARE EARTH INPUT SHARE27% of COGSRare earth and specialty oxide share of total production cost
QUALIFICATION CYCLE22 monthsMedian time from sample glass to full production release
Melt yield averaging 62% is the number that explains this industry's cost structure. A third of every batch never reaches specification, and rejected glass is not recoverable as optical material because remelting reintroduces the contamination that caused the rejection in the first place. Producers with tighter yields carry a cost advantage that no amount of downstream efficiency offsets, and that yield depends on furnace design, refractory selection and melting practice accumulated across decades rather than on recent capital.
Infrared changes the competitive geometry entirely. Chalcogenide glasses transmit in the eight to twelve micron band where germanium has traditionally been used, and they mould rather than requiring diamond turning, which cuts finished optic cost by roughly two thirds. That has opened thermal imaging to automotive and industrial volumes germanium pricing had closed off. Very few producers hold melting and moulding capability together, and those that do allocate output rather than quoting against each other.
"The most valuable asset in an optical glass plant is a furnace somebody built in 1978 and a melting recipe nobody has written down properly. Competitors can buy the same raw oxides and the same tank design and still lose fifteen points of yield. That is why this industry consolidates through acquisition rather than through greenfield capacity."
Principal Analyst, Photonic and Optical Materials Practice · MMA Chemicals and M

Market Trends

Moulded Chalcogenide Optics Displace Diamond-Turned Germanium

Germanium has been the default long-wave infrared material for decades, but it must be diamond turned rather than moulded and its price moves with a thin, geopolitically exposed supply chain. Chalcogenide glasses transmit in the same band and can be precision moulded, cutting finished optic cost by roughly 65% at volume. Automotive thermal imaging programmes have adopted them almost universally wherever cost matters more than the last few percent of transmission. Roughly 44% of new long-wave infrared optic designs released during 2025 specified moulded chalcogenide rather than germanium, against almost none five years earlier.
Market Impact: Serves under 6 qualified suppliers

Automotive Sensing Raises Optical Content Per Vehicle

Camera counts on new vehicles have risen from two or three to between eight and twelve as surround view, driver monitoring and forward sensing all became standard rather than optional extras. Each camera carries a lens stack, and higher-end platforms add thermal imaging on top of that. Optical material content per vehicle has roughly tripled since 2019 in value terms. The demand differs from consumer optics in that automotive qualification takes years and then holds for a platform life, which suits producers with certification depth and penalises those competing purely on unit cost.
Market Impact: Grows installed systems 9% annually

Market Opportunities and Growth Drivers

Semiconductor Lithography Sustains Fused Silica Demand

Deep ultraviolet lithography and wafer inspection optics require synthetic fused silica and calcium fluoride at purity levels that almost nothing else in industry demands, and each new fabrication facility consumes substantial volumes across both the tools themselves and their replacement spares. Global wafer fabrication equipment spending has grown strongly since 2021 on capacity localisation programmes across the United States, Japan and Europe. That demand is lumpy and heavily concentrated among very few tool builders, but the qualified supplier list runs to a handful of names worldwide and pricing reflects that scarcity accordingly.
Market Impact: Exposes 27% of production cost

Machine Vision Growth Adds Industrial Optic Volume

Industrial machine vision installations have expanded steadily with factory automation, quality inspection and logistics sorting work, and each installed system consumes precision optics held to tighter tolerances than consumer imaging ever accepts. Installed vision system counts have grown at around 9% annually since 2021 across automotive, electronics and food processing plants. Optical requirements here favour glass over polymer because thermal stability genuinely matters in factory environments. The demand is fragmented across many integrators rather than concentrated, which makes it considerably steadier than either automotive or semiconductor volume through any downturn.
Market Impact: Rejects 38% of melted glass

Market Restraints and Challenges

Rare Earth Oxide Pricing Sits Outside Producer Control

High-index and low-dispersion glass formulations depend on lanthanum, gadolinium and niobium oxides, which together account for 27% of cost of goods and price against a supply chain concentrated in very few countries. The root cause is geological and political rather than commercial: substitution generally means accepting materially worse optical performance. Commercially this exposes producers to input movement they cannot hedge in any liquid market. Participants are responding through multi-year oxide supply agreements, through reformulation toward lower rare earth content, and by qualifying non-Chinese oxide sources at premium cost despite the qualification burden involved.
Market Impact: Cuts finished optic cost 65%

Melt Yield Losses Cap Effective Production Capacity

Average melt yield against optical specification runs 62%, so nameplate melting capacity substantially overstates actual saleable output. The root cause is that index, dispersion, striae and inclusion requirements must all be met simultaneously across a whole melt, and a single refractory particle ruins the entire batch. Rejected optical glass cannot be recovered as optical material. Commercially this means capacity expansion delivers far less than the brochure suggests. Participants are addressing it with continuous rather than batch melting on high-volume formulations, and with in-melt monitoring that catches deviation before a batch is committed.
Market Impact: Triples optical content per 1 vehic
4 additional market trends, 2 additional growth drivers, and 3 additional restraints and challenges are covered in the full report. Contact sales@marketmindsadvisory.com to access the complete intelligence.

Segment CAGR and Growth Architecture

Segmentation follows material class, meaning the underlying optical material family and the melting, growth or moulding route that produces it. That single dimension determines transmission range, achievable tolerance, the capital equipment required and which customers a producer can serve at all, and it is how this whole industry genuinely organises itself commercially and technically.
optical-materials-market-trends-market-share-analysis-1787311676289

Chalcogenide and Infrared Glass

The fastest segment at 11.7%, a full 1.50 times the market rate, covering arsenic, germanium and selenium bearing glasses that transmit across the mid-wave and long-wave infrared bands. Demand comes from automotive thermal imaging, industrial condition monitoring, building inspection and gas sensing, all of which need the eight to twelve micron window at costs germanium cannot reach. Precision moulding rather than diamond turning is what makes the economics work at all, cutting finished optic cost by roughly 65% at volume. Very few producers hold melting and moulding capability together, and those that do allocate output rather than competing on price with anyone. Arsenic content restrictions across Europe complicate the highest-transmission compositions considerably.
CAGR 11.7%

Single-Crystal Optical Materials

Growing at 10.1% annually on sapphire, calcium fluoride, yttrium aluminium garnet and related crystals grown slowly from melt rather than formed as glass. Semiconductor lithography optics, high-power laser components, ruggedised windows and scintillation detectors drive the demand, and each of those applications specifies a crystal orientation and defect density that only a handful of growers can hold reliably. Boule growth here is slow, capital intensive and highly yield sensitive, which keeps supply tight and pricing firm through the cycles that hurt conventional glass producers badly. Customer positions here are unusually durable, because requalifying a crystal supplier means requalifying the whole optical assembly built around it, which no tool builder undertakes casually.
CAGR 10.1%
Full segment breakdown across 6 segments available in the complete report.

Regional Architecture and Country Demand Map

East Asia leads decisively on precision melting capacity rather than on end demand alone. South Asia and Pacific grows fastest of all as Indian and Southeast Asian camera module assembly scales up. North America holds the semiconductor and defence optic positions that no other region can serve.

East Asia

Thirty-eight percent of global value sits here. Note: this exceeds the standard regional band because Japanese producers dominate precision optical glass melting worldwide, holding roughly 34% of global output on their own, and Chinese producers have scaled aggressively behind them across the whole grade range. Japanese melting practice remains the benchmark on yield and index consistency, built on furnaces and recipes refined over decades. Chinese producers compete on cost in standard crown and flint grades and are now moving upward into high-index formulations. Growth of 9.0% reflects camera module assembly, automotive sensing and domestic semiconductor investment together. Korean demand is smaller but growing steadily on both display and sensing optics.
Share: 38% | CAGR: 9.0% (2026 to 2036)

North America

Twenty-four percent of global value, weighted toward semiconductor lithography optics, defence infrared systems and scientific instrumentation rather than volume consumer optics. Synthetic fused silica and calcium fluoride production for deep ultraviolet lithography is a genuine domestic strength, and defence procurement rules make domestic supply a requirement rather than a preference for infrared and laser materials. Growth of 7.2% tracks semiconductor capital spending and defence budgets far more than any consumer cycle. Consumer camera module assembly happens almost entirely offshore, so bulk glass for that application arrives as finished optics rather than as raw material. Defence infrared demand alone supports several domestic producers that no purely commercial market would ever sustain.
Share: 24% | CAGR: 7.2% (2026 to 2036)
Regional intelligence for 5 additional markets available in the complete report: Western Europe, South Asia and Pacific, Latin America, Middle East and Africa, Eastern Europe. Contact sales@marketmindsadvisory.com.
optical-materials-market-trends-country-cagr-analysis-1787311676808

Where Optical Margin Actually Accumulates

Four commercial moves separate the producers earning specification margins from those merely selling glass by the kilogram. Each depends on holding something a customer cannot obtain by switching supplier: melt yield discipline, chalcogenide moulding capability, secured rare earth oxide supply, or the automotive and defence qualifications that take years rather than capital to assemble properly.

Attack Melt Yield Before Adding Melting Capacity

Average melt yield runs 62% against optical specification, so a producer lifting yield by ten points gains more saleable output than a fifteen percent capacity expansion delivers, at a fraction of the capital. In-melt monitoring, refractory upgrades and continuous melting on high-volume formulations together cost $8 million to $18 million per tank. Yield improvement also lowers unit cost across every grade rather than only the incremental tonnes. Producers who expand nameplate capacity without first addressing yield discover that a third of the new investment produces cullet rather than saleable optical glass.
Market Impact: Gains 10 points of saleable melt yi

Combine Chalcogenide Melting With Precision Moulding

Selling chalcogenide glass as bulk material captures a fraction of the value available from selling moulded infrared optics, because moulding is what makes the germanium substitution economics work at all. Producers holding both realise roughly 2.4 times the revenue per kilogram of glass melted. Moulding capability costs $15 million to $28 million including tooling and metrology, and it takes about two years to qualify with automotive customers. Very few producers hold both halves, which is precisely why those that do allocate their output rather than competing for orders at all.
Market Impact: Realises roughly 2.4 times revenue

Contract Rare Earth Oxide Supply Across Origins

Lanthanum, gadolinium and niobium oxides account for 27% of cost of goods and price against a supply chain concentrated in very few countries, with no liquid hedge available anywhere. Producers holding multi-year agreements across Chinese and non-Chinese sources pay premiums of nine to fourteen percent over spot but hold formulation continuity through disruptions that force competitors into reformulation. Reformulating a qualified optical glass means requalifying every single customer using it, and that cost runs vastly beyond anything the oxide premium will ever amount to. Continuity, not price, is what these agreements actually buy.
Market Impact: Avoids requalification across 100%

Build Automotive And Defence Qualification Depth

Automotive optical qualification runs 22 months and then holds for a platform life of six to eight years, while defence infrared qualification is slower still and often carries domestic-supply requirements that exclude competitors outright. Producers with both hold demand that consumer optics volatility cannot touch. The investment required is documentation systems, metrology capability and patience rather than melting capacity, and it typically runs under $6 million in total. Positions won this way survive price competition entirely, because the customer cannot switch without reopening a homologation package that it has no intention of touching.
Market Impact: Locks platform demand for up to 8 y

Who Controls the Margin Pool

Concentration is moderate at 41% for the top five, measured on optical material revenue across all participants, and the ranking shifts depending on whether glass, crystal or infrared material is counted. Hoya leads on precision optical glass breadth combined with melting yield, and the gap to the second tier is widest in melting practice rather than in installed tank capacity.
Competition runs on three dimensions. Melt yield and index consistency matter most in precision glass, where customers requalify slowly and value batch reproducibility above nominal specification. Infrared capability decides access to the fastest-growing pool, and very few producers hold melting and moulding together. Price competition is intense but confined to standard crown and flint grades, where Chinese producers compete hard and where differentiation is effectively unavailable to anyone.

Two pressures are building. Chinese producers have moved beyond standard grades into high-index and infrared formulations, and several now hold specifications unavailable from the country five years ago. Meanwhile automotive customers are consolidating optical purchasing across platforms, which concentrates volume on fewer qualified suppliers and raises the value of certification depth. Rankings shift where Chinese melting capability meets automotive qualification requirements, since neither alone is sufficient.
optical-materials-market-trends-company-positioning-matrix-1787311677329

Competitive Moat and Risk Dimensions

HOYA

Moat: Highest melt yield across formulations

Decades of melting practice across a very wide glass catalogue give the company yield rates competitors have repeatedly failed to match, and yield is the cost structure in this business. Customers requalify slowly and value index reproducibility across batches above nominal data sheet performance, which rewards accumulated melting knowledge over recent capital.
HOYA

Risk: Consumer optics volume exposure

A meaningful share of volume still serves camera module and consumer imaging programmes where unit growth has flattened and Chinese material competes hard on cost. Automotive and semiconductor demand is growing but cannot absorb consumer softness at current mix. The company's breadth cushions pricing without protecting the underlying volume base.
SCHOTT

Moat: Deepest specialty and infrared range

A catalogue spanning precision glass, infrared material and specialty formulations for lithography, medical and defence applications lets the company follow a customer across requirements without that customer qualifying elsewhere. German metrology and documentation depth also satisfies automotive and defence buyers who audit process rather than product.
SCHOTT

Risk: European cost and regulatory base

German manufacturing carries energy and compliance costs Asian competitors do not face, and REACH restrictions on arsenic-bearing chalcogenide formulations complicate exactly the segment growing fastest. Arsenic-free compositions cost transmission performance. Neither problem has a solution available inside the existing manufacturing footprint on any reasonable timeline.

Players Tracked

Prominent Players

Hoya
Schott
Ohara
CDGM Glass
Corning

Other Key Players

Nikon
Sumita Optical Glass
Canon Optron
Coherent
Umicore
LightPath Technologies
Crystran
Shin-Etsu Chemical
Tokuyama
Nippon Electric Glass
Rochester Precision Optics
Materion
Isuzu Glass
AGC
Sunny Optical Technology

Recent Developments

MARCH 2025

LightPath expands moulded chalcogenide infrared optic capacity

Additional chalcogenide melting and precision moulding capacity entered commercial service at an existing site, aimed at automotive thermal imaging programmes that had been unable to source moulded long-wave infrared optics in anything close to the volumes their production schedules actually required across the preceding two years.
Signal: Moulding capability rather than glass melt
JULY 2025

Ohara commissions continuous melting line for high-index glass

A continuous rather than batch melting line for the company's high-index optical formulations entered commercial service in Japan, targeting the yield improvement that batch melting simply cannot deliver on high-volume grades and reducing the rare earth oxide waste that every rejected batch of high-index glass represents.
Signal: Yield improvement is now being pursued ahe
NOVEMBER 2025

Schott secures multi-origin rare earth oxide supply agreement

Multi-year rare earth oxide supply agreements spanning both Chinese and non-Chinese sources were concluded to underpin the company's high-index glass production, reflecting how formulation continuity has become more valuable than input cost given what requalifying an already-qualified optical glass costs every single customer using it.
Signal: Oxide origin diversity is now treated as f

What Drives Optical Material Cost

Rare earth and specialty oxides account for roughly 27% of cost of goods, principally lanthanum, gadolinium, niobium and tantalum compounds sourced from a supply chain concentrated in very few countries. Energy for melting and annealing contributes 21%, high because optical glass demands long thermal cycles. Platinum crucible and refractory consumption adds 12%, and yield loss effectively multiplies all of it.
The 2021 to 2022 rare earth episode showed how exposed high-index formulations are. Lanthanum and gadolinium oxide pricing rose sharply as Chinese export quotas tightened and downstream magnet demand competed for the same feedstock. European and Japanese producers absorbed most of the increase inside annual customer contracts, and Schott annual reporting documented substantial raw material cost pressure. Producers of standard crown and flint grades were barely affected at all.

The competitive disadvantage mechanism runs through yield, not purchase price. A producer melting at 55% yield consumes far more oxide per saleable kilogram than one melting at 70%, so the same input price hits the two very differently. That gap can reach $35 per kilogram of finished glass on high-index grades. Geography compounds it, since European producers pay Western energy prices for the long annealing cycles optical glass unavoidably requires.
optical-materials-market-trends-cost-volatility-analysis-1787311677524

Index high-index glass contracts to oxide benchmarks

Annual price fixing against continuously moving rare earth oxide is the largest single source of margin damage on high-index formulations. Producers now negotiate indexation clauses referencing published lanthanum, gadolinium and niobium oxide benchmarks, typically with a quarterly reset and a collar limiting total movement to ten percent in either direction across any given contract year.

Recover platinum and reprocess rejected optical cullet

Platinum crucible loss and rejected glass together represent real value walking out of the plant. Systematic platinum recovery plus reprocessing rejected cullet into non-optical applications recovers roughly three percentage points of cost of goods, at a retrofit cost near $4 million per melting facility and with payback landing comfortably inside three years at current platinum pricing.

Shift annealing energy toward recovered heat

Optical annealing demands long, slow thermal cycles and most of that heat currently leaves as exhaust. Heat recovery across annealing lehrs costs roughly $5 million per facility and cuts energy cost of goods by around four percentage points, with payback under four years at European industrial power prices and considerably faster where carbon costs apply.

Portfolio Architecture for Margin Defence

Margin architecture tracks qualification burden and melting difficulty together. Standard crown and flint glass sold into general imaging and illumination runs at gross margins in the low twenties, competing against every producer with a tank. Infrared, crystal and lithography-grade materials earn two to three times that.
The volume-versus-premium tension is severe because melting tanks cannot be idled economically. Standard grades provide the continuous load that keeps a tank at temperature and a workforce employed, yet they are exactly where Chinese competition bites hardest. Producers who abandon them find that specialty volumes alone cannot fill a melting facility, and a partially loaded tank costs almost as much to run as a full one. That physical constraint shapes portfolio decisions more than margin analysis does.

Value concentrates where the customer cannot verify performance without rebuilding its own assembly. Lithography-grade fused silica and calcium fluoride sit at the top: a tool builder must requalify an entire optical column to change supplier. Moulded infrared optics sit alongside them on automotive qualification logic. Standard imaging glass sits at the other extreme, where a certificate of index and dispersion tells the buyer everything and pricing compresses toward oxide cost.

Volume / Commodity-Adjacent

Standard crown and flint optical glass supplied into general imaging, illumination and consumer optics. Specifications are widely published, supplier choice is broad, and buyers move on delivered cost. This volume exists mainly to keep melting tanks continuously loaded and thermally stable.
Gross Margin: 19-26%

Premium / Certified

High-index and low-dispersion glass plus fused silica supplied into automotive sensing, machine vision and medical optics. Index reproducibility across batches and automotive certification depth hold the pricing. Range reflects the spread between machine vision and automotive platform requirements.
Gross Margin: 30-42%

Sustainability / Regulatory / Next-Generation

Chalcogenide infrared glass, moulded infrared optics, single-crystal materials and lithography-grade fused silica and calcium fluoride. Melting and growth capability that competitors cannot replicate, rather than the underlying chemistry, justifies the pricing achieved here.
Gross Margin: 44-62%
optical-materials-market-trends-portfolio-architecture-1787311678017

High-value Sub-segments and Strategic Watch-out

Moulded Infrared Optics

High value on genuinely high growth at 11.7%, and the only pool where suppliers currently allocate rather than quote. Holding melting and moulding capability together is what keeps the field small, and automotive qualification then locks those positions in place for a full vehicle platform life.
Gross Margin: 48-62%

Lithography-Grade Materials

Excellent margins on demand tied to semiconductor capital spending rather than consumer cycles. Requalifying a supplier means requalifying an entire optical column, so positions last for tool generations, though the underlying capital spending itself moves in steps rather than in anything like a smooth trend.
Gross Margin: 46-60%

Standard Imaging Glass

The thermal and financial backbone of every melting facility, necessary because a tank cannot be partially loaded economically, yet earning gross margins around twenty percent. Chinese producers compete this pool down hard and the published glass catalogue leaves a producer nowhere at all to differentiate itself.
Gross Margin: 19-26%

High-Index Automotive Glass

The strategic watch-out sitting in this portfolio. Automotive qualification does make these positions genuinely durable, but these formulations depend on rare earth oxides priced entirely outside any producer's control, and a sustained oxide increase cannot be passed through inside fixed platform pricing agreed years earlier.
Gross Margin: 30-42%

How This Demand Actually Repeats

Optical material demand behaves as an annuity attached to a qualified optical design. Once a glass type is specified into a lens stack, a lithography column or a thermal camera, it ships against that design for its production life, because changing it means recomputing and requalifying the whole optical prescription.
Stickiness varies sharply by end use. Lithography and defence optics are the tightest, held by qualification that extends to the finished tool or weapon system and by domestic-supply requirements in the defence case. Automotive sensing sits close behind, locked for a platform life of six to eight years. Medical endoscopy work is moderately sticky, with buyers holding qualified glass but reviewing it at product refresh. Consumer imaging is barely sticky, with module assemblers switching on delivered cost between catalogue-equivalent glasses.

Buyer profiles have changed considerably. Glass selection once sat with optical designers choosing from a published catalogue on index and dispersion alone. It now involves supply security, sustainability and regulatory functions asking about oxide origin, arsenic content and melting facility audits. Producers whose commercial approach still leads with catalogue data find themselves talking to buyers for whom the data sheet was settled months earlier and everything else remains open.
optical-materials-market-trends-end-use-penetration-index-1787311678503

Where To Commit Capital

These are among the four positions where our research anticipates prominent divergence between winners and laggards over the coming forecast period. Each is grounded in the demand model, the regulatory perimeter, and the announced capacity pipeline.
01 / MELT YIELD DISCIPLINE

Fix the yield before buying another tank

Average melt yield against optical specification runs 62%, which means a third of every batch becomes cullet rather than saleable glass and the oxide inside it is simply wasted. Lifting yield by ten points delivers more saleable output than a fifteen percent capacity expansion does, and at a small fraction of the capital committed. Producers who expand nameplate without first addressing yield discover that a third of the new investment goes on producing rejected glass exactly as the old capacity did.
02 / INFRARED CAPABILITY INTEGRATION

Melting alone captures too little infrared value

Chalcogenide glass sold as bulk material captures a fraction of what moulded infrared optics realise, because moulding is precisely what makes the germanium substitution economics work for automotive volumes. Producers holding both capabilities realise roughly 2.4 times the revenue per kilogram of glass melted. Moulding capability costs between $15 million and $28 million and takes roughly two years to qualify with automotive customers, and the sheer shortage of integrated producers is why current output gets allocated rather than quoted against competitors.
03 / OXIDE SUPPLY CONTINUITY

Formulation continuity beats input cost saving

Rare earth oxides represent 27% of cost of goods with no liquid hedge available anywhere, and reformulating an already-qualified optical glass means requalifying every single customer currently using it. Multi-origin oxide supply agreements cost premiums of nine to fourteen percent over the prevailing spot pricing. Against the cost of requalification right across an entire customer base, that premium is close to trivial, and the producers who signed such agreements before 2023 are visibly better positioned than those who did not.
04 / CERTIFICATION PORTFOLIO DEPTH

Automotive and defence demand ignores consumer cycles

Automotive optical qualification runs 22 months and then holds for a platform life of six to eight years, while defence infrared work adds domestic-supply requirements that exclude most foreign competitors outright. Producers holding both carry a demand base that consumer optics softness simply cannot touch. The investment required is documentation, metrology and patience rather than any melting capacity at all, and it typically runs under $6 million, which makes it comfortably the cheapest diversification available to any established producer today.

Engagement Snapshot From the Field

A live engagement with an industry participant carrying material or product regulatory and market exposure ahead of a defining policy shift, showing how our research translates into a defensible multi-year portfolio strategy.
MARKET MINDS ADVISORY · CLIENT ENGAGEMENT SUMMARY
Optical Materials Producer Strategic Portfolio Review and Transition Roadmap 2026·Investment Scenario on Optical Materials Exposure Evaluation 2025-26
CLIENT PROFILE
A listed Asian precision optical glass producer with annual revenue near $260 million (client-reported, unverified by MMA), operating four melting tanks and a pressing operation at a single site. Roughly 69% of volume sat in standard crown and flint grades sold into consumer camera module assembly, with a modest high-index position, no infrared capability and melt yield running below the industry average.
STRATEGIC CHALLENGE
Consumer camera module demand had flattened while Chinese competitors cut standard grade pricing, and the company's melt yield of 54% left it permanently uncompetitive on cost. The board wanted to know whether capital was better spent on yield improvement, on high-index expansion, or on entering chalcogenide infrared where growth was clearly strongest.
MMA APPROACH
MMA modelled yield improvement economics tank by tank, assessed the capital and qualification timeline for chalcogenide melting and moulding, and benchmarked competitor yield performance and infrared capability across Japan, China and Europe. Findings were tested against 47 expert interviews covering automotive optical qualification practice, infrared camera design requirements and rare earth oxide supply arrangements.
KEY FINDINGS
  1. Lifting melt yield from 54% toward 66% would deliver more saleable output than the planned fifth tank, at roughly a quarter of the capital the tank required.
  2. Chalcogenide entry without moulding capability would capture only about 40% of available infrared value, since bulk glass sales miss the substitution economics entirely.
  3. Standard grade volumes could not be abandoned without dropping tank loading below the point where thermal stability and unit cost both deteriorated sharply across every grade.
  4. Automotive qualification, which the company had never attempted, would take 22 months but then hold platform demand for six to eight years regardless of consumer cycle softness.
CLIENT PROFILE
A listed Asian precision optical glass producer with annual revenue near $260 million (client-reported, unverified by MMA), operating four melting tanks and a pressing operation at a single site. Roughly 69% of volume sat in standard crown and flint grades sold into consumer camera module assembly, with a modest high-index position, no infrared capability and melt yield running below the industry average.
STRATEGIC CHALLENGE
Consumer camera module demand had flattened while Chinese competitors cut standard grade pricing, and the company's melt yield of 54% left it permanently uncompetitive on cost. The board wanted to know whether capital was better spent on yield improvement, on high-index expansion, or on entering chalcogenide infrared where growth was clearly strongest.
MMA APPROACH
MMA modelled yield improvement economics tank by tank, assessed the capital and qualification timeline for chalcogenide melting and moulding, and benchmarked competitor yield performance and infrared capability across Japan, China and Europe. Findings were tested against 47 expert interviews covering automotive optical qualification practice, infrared camera design requirements and rare earth oxide supply arrangements.
KEY FINDINGS
  1. Lifting melt yield from 54% toward 66% would deliver more saleable output than the planned fifth tank, at roughly a quarter of the capital the tank required.
  2. Chalcogenide entry without moulding capability would capture only about 40% of available infrared value, since bulk glass sales miss the substitution economics entirely.
  3. Standard grade volumes could not be abandoned without dropping tank loading below the point where thermal stability and unit cost both deteriorated sharply across every grade.
  4. Automotive qualification, which the company had never attempted, would take 22 months but then hold platform demand for six to eight years regardless of consumer cycle softness.
RECOMMENDED STRATEGY
Phase 1: Phase one: cancel the fifth tank and redirect that capital into in-melt monitoring, refractory upgrades and continuous melting on the two highest-volume formulations. Phase 2: Phase two: enter chalcogenide with melting and moulding together rather than sequentially, accepting the longer timeline for the substantially larger value capture. Phase 3: Phase three: begin automotive qualification on high-index grades in parallel, building the documentation and metrology depth that platform demand requires.
OUTCOME
The client cancelled the planned tank and lifted melt yield to 63% within fourteen months, reporting unit cost reduction of roughly 11% across all grades (client-reported, unverified by MMA). Chalcogenide melting and moulding capital was approved together rather than in sequence, and the first automotive qualification programme entered its second phase on schedule.

Frequently Asked Questions

Foundational context covering the market sizes, CAGR, scope, country, region and competition that inform every finding below. This section is provided to cover basics and most often pre-purchase conversations, answered from the MMA Primary Research Dataset.

What is the current size of the Optical Materials Market?

The market was worth $6.5 billion in 2025 and is forecast to reach $7.01 billion in 2026. This covers bulk optical materials rather than finished lens assemblies or optical modules.

How large will the Optical Materials Market be by 2036?

MMA forecasts $14.86 billion by 2036, an expansion multiple of 2.12 times the 2026 base. That represents $7.85 billion of incremental value across the forecast period.

What is the CAGR for the Optical Materials Market 2026 to 2036?

The base case compound annual growth rate is 7.8%, with a bull case of 9.0% and a bear case of 6.5%. Historical growth from 2020 to 2025 ran at 6.6%.

Which segment is growing fastest?

Chalcogenide and infrared glass at 11.7%, a full 1.50 times the market rate. Automotive thermal imaging and industrial condition monitoring drive most of that demand.

Who are the major companies in the Optical Materials Market?

Hoya, Schott, Ohara, CDGM Glass and Corning lead, holding 41% of revenue between them. Fifteen further producers hold meaningful positions across specific material classes and regions.

Which country is growing fastest?

China at 10.4%, as domestic producers move from standard grades into high-index and infrared formulations. Camera module assembly and automotive sensing both pull that demand upward.

Report Segmentation Architecture

The full report scope spans multiple orthogonal segmentation dimensions, with cross-tabulated demand data provided for each dimension pair. Coverage extends further to regional breakdowns, trend trajectories, and the competitive detail needed to support segment-level decision-making.

By Material Class

  • Chalcogenide and Infrared Glass
  • Single-Crystal Optical Materials
  • Transparent Optical Ceramics
  • High-Index Optical Polymers
  • Fused Silica and Quartz Optics
  • Precision Crown and Flint Optical Glass

By End-Use Industry

  • Automotive Sensing and Thermal Imaging
  • Semiconductor Lithography and Inspection
  • Defence and Aerospace Optics
  • Industrial Machine Vision
  • Medical Imaging and Endoscopy
  • Consumer Camera and Imaging Modules

By Commercial Dimension

  • Bulk Material Supply to Optics Fabricators
  • Moulded Optic Supply to System Integrators
  • Direct Supply to Automotive Tier-One Suppliers
  • Catalogue and Distributor Sales
  • Custom Melt and Development Programmes

By Region

  • North America
  • Western Europe
  • East Asia
  • South Asia and Pacific
  • Latin America
  • Middle East and Africa
  • Eastern Europe

Scope, Methodology, and Coverage

Every figure in this report is reproducible from documented input assumptions. The scope below maps the historical period, the forecast horizon, the segmentation dimensions, and the countries covered, alongside the underlying primary and qualitative methodology.
Historical Period
2020 to 2025
Forecast Period
2026 to 2036
Base Year
2025 (USD billions; MMA Primary Research Dataset, August 2026)
Market Definition
This report covers bulk optical materials supplied for transmissive and reflective optics, spanning precision crown and flint optical glass, fused silica and quartz optics, chalcogenide and infrared glass, single-crystal materials including sapphire and calcium fluoride, transparent optical ceramics and high-index optical polymers. Coverage includes moulded infrared optics where the material producer also performs the moulding. Finished lens assemblies and optical modules, optical fibre and preforms, display glass, ophthalmic finished lenses, thin-film coating services and patterned photomask substrates are excluded from scope.
Quantitative Units
USD billions at producer realised prices; volume in tonnes of saleable optical material; melt yield and gross margin percentages by tier.
Segmentation Dimensions
Material class, end-use industry, commercial dimension, region.
Regions Covered
North America, Western Europe, East Asia, South Asia and Pacific, Latin America, Middle East and Africa, Eastern Europe
Countries Covered
Japan, China, South Korea, Taiwan, India, Vietnam, Thailand, Australia, United States, Canada, Mexico, Germany, France, United Kingdom, Netherlands, Brazil, Poland, Czechia, Israel, Turkey.
Key Companies Profiled
Hoya, Schott, Ohara, CDGM Glass, Corning, Nikon, Sumita Optical Glass, Coherent, LightPath Technologies, Umicore, and ten further producers.
Quantitative Methodology
Primary survey, n=3,800 respondents, Q4 2025, six countries; demand-side model with trade association cross-validation
Qualitative Methodology
47 expert interviews, Q4 2025; applied to validate demand model assumptions, identify emerging dynamics, and assess competitive positioning
Report Format
PDF and XLSX data workbook (Word format preview document)
Publisher
Market Minds Advisory
Report Code
MMA-2026-CHM-739
Published
August 2026
Contact
sales@marketmindsadvisory.com | www.marketmindsadvisory.com

Purchase the full Optical Materials Market Report (2026 to 2036).

The full report sets out ten-year forecasts for bulk optical materials by material class, end-use industry and commercial model across seven regions. It quantifies melt yield performance and its cost consequences producer by producer, and models chalcogenide capacity against committed automotive thermal imaging programme demand through 2032. Competitive assessment covers twenty producers on a consistent revenue basis, separating melting capability from moulding and finishing capacity. Rare earth oxide exposure is modelled by formulation family, with reformulation and requalification costs quantified. Findings draw on a quantitative survey of 3,800 respondents across six countries and 47 expert interviews conducted during the fourth quarter of 2025.
Ten-year forecasts by material class and region
Melt yield performance quantified producer by producer
Chalcogenide capacity mapped against automotive programme demand
Twenty-producer assessment on consistent revenue basis
Rare earth oxide exposure modelled by formulation family
Margin architecture across three commercial portfolio tiers

Built For The People Who Decide

From boardroom strategy to bench-side execution, this report is read cover-to-cover by leaders shaping the next decade of their industry, turning demand scenarios, market dynamics and valuation benchmarks into decisions.
CXOs/ Presidents/ VPs/ Managers
M&A and Corporate Development
Strategy Teams and R&D Heads
Procurement and Product Directors
Regulatory and Compliance Leaders
Investor Relations and Equity Analysts