Market Minds Advisory
Optical Imaging Market

Optical Imaging Market: Adaptive Optics Pushes Resolution Beyond Prior Diagnostic Thresholds

Adaptive optics and OCT-angiography systems now push diagnostic resolution past prior clinical thresholds, retinal screening expansion accelerates volume demand, and manufacturers without AI-assisted image interpretation software lose specialist purchasing consideration regardless of hardware quality.

Lead Analyst

Alice Ballenger

Published

September 2026

Make Smarter Decisions with Customized Research Insights

Request a free sample report and evaluate market opportunities, growth trends, and competitive dynamics relevant to your business needs.

2025 MARKET VALUE$4.2BMarket Size 2025
2036 FORECAST VALUE$10.4BBase Case , 2026 to 2036
CAGR 2026 TO 20368.6 %Bull 9.8% / Bear 7.4%
INCREMENTAL OPPORTUNITY$5.8BNet 10- year value creation
EXPANSION MULTIPLE2.28x2036 value over 2026 base
Strategic Levers
M&A Pipeline
Regional Outlook
Country Rankings
Competitive Intelligence
Segmental Deep-dive
Call-Us : 91 93563 13602

Executive Snapshot and Market Trajectory

Adaptive optics and OCT-angiography platforms now resolve retinal and corneal structures that earlier optical imaging systems could not reliably detect, and specialist purchasing committees increasingly treat resolution depth as the deciding purchase factor over sticker price alone across most procurement decisions made this year and next.
Optical coherence tomography angiography leads growth at 12.8%, roughly 1.49 times the overall market rate, as ophthalmologists shift from structural imaging alone toward combined structural and vascular assessment during a single patient visit rather than scheduling separate follow-up appointments weeks apart under older diagnostic workflows. East Asia now holds the largest regional share, driven by expanding national screening programs and rapidly scaling domestic manufacturing capacity across several leading countries in the region.
Competitive intensity concentrates around 71% held by five manufacturers, since regulatory clearance timelines and optical engineering expertise limit new entrant credibility relative to more fragmented device categories elsewhere in medical technology overall today. AI-assisted interpretation software is becoming the primary purchasing differentiator ahead of raw hardware resolution specifications alone, reshaping how procurement committees evaluate competing platforms during formal tender evaluations across most major hospital and clinic markets.
Market Definition
This report covers the global market for optical imaging systems used in diagnostic and clinical applications, spanning optical coherence tomography, fundus imaging, confocal microscopy, fluorescence imaging, adaptive optics, and photoacoustic imaging platforms. It excludes conventional radiographic, ultrasound, and MRI imaging modalities that do not rely on optical or photonic detection principles.
Base Year Value
$4.2B in 2025 (MMA Primary Research Dataset, August 2026)
Forecast Period
2026 to 2036, eleven discrete annual values
CAGR
8.6% base case. Bull 9.8%. Bear 7.4%.
Fastest Growth Segment
Adaptive Optics Imaging Systems: 13.0% CAGR
Fastest Growth Country
China: 11.2% CAGR
Fastest Growth Region
South Asia and Pacific: 10.8% CAGR
Largest Region
East Asia: 28% of 2025 global value
Market Leaders
Carl Zeiss Meditec, Topcon Corporation, Heidelberg Engineering, Nidek Co., Optos plc. Source: MMA Analysis, July 2026.
Primary Survey
n=3,800 procurement and R&D decision-makers, Q4 2025, six countries
Methodology
Demand-side build-up, cross-validated against public data, 47 expert interviews

Optical Imaging Market Forecast Scenarios

optical-imaging-market-size-forecast-scenario-1787304306953
Optical imaging demand grew steadily between 2020 and 2025 as OCT adoption expanded well beyond tertiary ophthalmology centers into general optometry practice and primary care screening settings nationwide, with the historical growth rate running somewhat below the coming decade's pace as digital screening infrastructure matures across most developed and several emerging healthcare systems worldwide today.
The base case assumes continued screening program expansion, AI-assisted interpretation software adoption, and steady replacement cycle demand from aging installed OCT and fundus camera bases across established markets worldwide. National retinal screening programs across East Asia and growing diabetic retinopathy screening mandates across multiple regions sustain unit volume even as average selling prices compress modestly through the forecast period as manufacturer competition intensifies and procurement committees negotiate harder on multi-unit hospital system orders.
The bull case centers on adaptive optics reaching cost parity with conventional OCT platforms sooner than expected, pulling forward premium replacement demand across specialist ophthalmology practices. The bear case centers on reimbursement tightening for routine screening imaging in cost-constrained health systems, which would slow volume growth across public procurement channels significantly and delay planned capital equipment purchases.

AI Interpretation Reshapes Optical Imaging Procurement

Optical imaging sits at the intersection of hardware precision and software intelligence, since resolution improvements alone no longer justify premium pricing without accompanying interpretation tools that reduce clinician reading time meaningfully. Manufacturers converging both capabilities into a single integrated platform are winning tender evaluations that hardware-only competitors increasingly lose despite comparable optical specifications on paper, a shift reshaping procurement criteria a
MARKET CONCENTRATION (CR5)71%Top five manufacturers hold combined global market revenue share
AVERAGE SELLING PRICE$38,000Typical premium OCT-angiography system price point per unit
TOP PRODUCING COUNTRY SHARE34%Japan leads global optical imaging system manufacturing output
INSTALLED BASE AGE7.2 yearsAverage age of hospital fundus camera fleets currently
TRADE INTENSITY58%Share of total units sold across export markets
SOFTWARE ATTACH RATE62%Systems now bundled with AI interpretation software at purchase
Commercial character favors manufacturers with direct hospital system relationships over those relying solely on independent distributors, since large multi-site health systems increasingly standardize equipment purchasing across their full network rather than negotiating site by site. Screening program contracts with national health authorities have become a meaningful revenue channel distinct from traditional capital equipment sales to individual clinics, and one that rewards manufacturers with proven population-scale deployment experience.
The next decade will be shaped by regulatory pathways for AI-assisted diagnostic claims, reimbursement policy for routine screening imaging, and the pace at which adaptive optics manufacturing costs decline toward mainstream affordability. Manufacturers positioned across all three forces simultaneously will capture disproportionate share as the category matures beyond its current specialist-only positioning toward broader primary care adoption.
"Resolution used to sell the system. Now the software reading the image sells it, and manufacturers still pitching pixel counts are losing tenders to platforms that also cut clinician reading time in half."
Director, Ophthalmic and Diagnostic Imaging Practice · MMA Medical Devices / Dia

Market Trends

AI-Assisted Interpretation Software Becomes Standard Bundled Feature

Manufacturers increasingly bundle AI-assisted interpretation software directly into new optical imaging platforms rather than selling it as a separate add-on module, since procurement committees now weigh diagnostic assistance capability as heavily as raw optical resolution during tender evaluations. Roughly 62% of new premium OCT systems shipped in 2025 included bundled interpretation software at initial purchase, up sharply from a much smaller share five years earlier, as regulatory clearances for AI-assisted diagnostic claims expanded across multiple jurisdictions and manufacturers raced to avoid losing tenders to competitors offering the combined bundled package.
Market Impact: Screening mandates cover 45 million

OCT-Angiography Displaces Standalone Fluorescein Angiography Procedures

OCT-angiography increasingly replaces traditional dye-based fluorescein angiography for routine vascular assessment, since it requires no injectable contrast agent and produces comparable diagnostic detail in a fraction of the examination time required previously under older workflows. Ophthalmology practices report OCT-angiography now accounts for roughly 45% of vascular imaging procedures in leading markets, up from a negligible base just five years ago, as clinicians increasingly favor the non-invasive workflow for both routine screening and pre-surgical assessment across most major hospital systems and specialist retina clinics currently upgrading their diagnostic imaging suites nationwide.
Market Impact: Replacement cycle affects 7.2-year-

Market Opportunities and Growth Drivers

National Diabetic Retinopathy Screening Mandates Expand Coverage

Government health agencies across multiple countries have expanded mandatory diabetic retinopathy screening programs for diabetic patients, directly driving fundus camera and OCT procurement at primary care and community health facilities that previously referred patients to specialist centers. China's national screening program alone now covers over 45 million diabetic patients annually, according to China MIIT-aligned health infrastructure reporting, requiring thousands of additional imaging units across township and community health centers. Similar mandates are expanding across South Asia and parts of Latin America, sustaining unit volume even as average selling prices compress under public procurement pressure.
Market Impact: Premium systems cost 5x conventiona

Aging Installed Base Drives Replacement Cycle Demand

A substantial share of hospital and clinic OCT and fundus imaging systems installed during the initial adoption wave a decade ago are now approaching typical replacement age, creating a sustained baseline replacement cycle independent of new screening program expansion. Average installed base age now runs at 7.2 years, and manufacturers report replacement purchases increasingly favor newer AI-integrated platforms over like-for-like hardware swaps, since replacement decisions now bundle software upgrade value into the purchasing justification presented to hospital capital committees evaluating competing budget priorities each fiscal year across most major health systems.
Market Impact: Coverage gaps affect 30% of volume

Market Restraints and Challenges

High Capital Cost Limits Community Clinic Adoption

Premium OCT-angiography and adaptive optics systems carry capital costs well beyond what small independent optometry practices and rural community clinics can justify against realistic patient volume, limiting adoption to hospital systems and larger specialist networks. The root cause is manufacturing complexity: precision optical components and specialized detector arrays keep production costs high relative to conventional imaging equipment. Financing programs and equipment leasing arrangements are expanding to bridge this gap, with several manufacturers now offering subscription-based access models that convert capital expenditure into predictable monthly operating costs for smaller practices previously priced out entirely.
Market Impact: AI bundling reaches 62% share

Reimbursement Uncertainty Slows Routine Screening Imaging Adoption

Reimbursement policy for routine optical screening imaging remains inconsistent across health systems, with some payers covering only diagnostic imaging tied to a confirmed condition rather than preventive screening itself, creating hesitation among clinics considering new equipment purchases. The root cause traces to screening imaging's relatively recent clinical adoption, which has outpaced formal payer coverage policy updates in several major markets. Manufacturers and specialty societies are jointly lobbying payers with outcomes data demonstrating that early detection reduces downstream treatment costs, gradually shifting coverage decisions in several markets toward broader preventive screening reimbursement over the past two years.
Market Impact: OCT-angiography reaches 45% of proc
4 additional market trends, 3 additional growth drivers, and 3 additional restraints and challenges are covered in the full report. Contact sales@marketmindsadvisory.com to access the complete intelligence.

Segment CAGR and Growth Architecture

Optical imaging segmentation follows underlying imaging technology rather than clinical application alone, since the same manufacturer base develops distinct optical and detection architectures across each category tracked. Six segments span optical coherence tomography, fundus imaging, confocal microscopy, fluorescence and molecular imaging, adaptive optics, and photoacoustic imaging, each requiring distinct optical engineering and regulatory clearance pathways.
optical-imaging-market-market-share-analysis-1787304307501

Adaptive Optics Imaging Systems

Adaptive optics imaging systems are growing fastest as ophthalmologists and vision researchers adopt cellular-level retinal resolution previously achievable only in laboratory settings, now becoming commercially viable for specialist clinical use across leading academic centers worldwide today. Academic medical centers and leading research hospitals are driving early adoption, since adaptive optics platforms currently justify their premium pricing primarily through research and early-diagnosis applications rather than routine screening volume. Manufacturers achieving meaningful cost reduction in adaptive optics hardware are positioned to capture the next wave of demand as the technology migrates from specialized research applications toward broader specialist clinical deployment across leading ophthalmology practices in North America, Western Europe, and East Asia.
CAGR 13.0%

Fluorescence and Molecular Optical Imaging

Fluorescence and molecular optical imaging grows second-fastest, driven by expanding oncology and neurology research applications that require visualization of specific molecular markers rather than structural anatomy alone across most research institutions and pharmaceutical laboratories worldwide today. Pharmaceutical companies increasingly use fluorescence imaging platforms during clinical trials to validate drug targeting and biodistribution, creating a growing commercial customer base beyond traditional hospital and clinic purchasers across the broader life sciences sector. Manufacturers with validated molecular probe partnerships are capturing disproportionate share of this research-driven demand, since customers increasingly evaluate platforms based on compatible probe chemistry availability rather than optical hardware specifications alone, reshaping competitive dynamics across this specialized imaging category significantly.
CAGR 11.5%
Full segment breakdown across 6 segments available in the complete report.

Regional Architecture and Country Demand Map

East Asia leads global revenue share, reflecting concentrated optical device manufacturing and the world's largest national retinal screening rollout, while North America and Western Europe retain premium pricing power through specialist ophthalmology infrastructure and earlier regulatory clearance for AI-assisted diagnostic claims across most major markets.

North America

North America commands premium pricing power built on concentrated specialist ophthalmology infrastructure and the earliest regulatory clearances for AI-assisted diagnostic interpretation claims among all tracked markets worldwide today. The United States drives most regional revenue, supported by large multi-site hospital systems that standardize equipment purchasing across their networks and increasingly bundle interpretation software into procurement decisions from the outset. Academic medical centers continue to adopt adaptive optics and research-grade platforms ahead of most other regions, sustaining premium segment demand even as routine screening imaging growth moderates somewhat across most established metropolitan markets. Canada contributes smaller but steady public health system procurement volume tied to national screening initiatives launched in recent years.
Share: 26% | CAGR: 8.2% (2026 to 2036)

Western Europe

Western Europe combines cautious national health system procurement with steady replacement cycle demand across its largest member states and established ophthalmology networks nationwide and internationally today and going forward. Germany, France, and the United Kingdom drive most regional revenue, since national formulary and reimbursement bodies there move deliberately on new imaging technology coverage decisions relative to faster-moving markets elsewhere in the world. Generic component sourcing and slower AI software reimbursement approval keep average selling prices below North American levels for comparable platforms across most therapeutic categories tracked. Injectable-adjacent specialist procedures and cross-border referral networks sustain steady demand even as overall regional growth trails the global average by a modest but persistent margin.
Share: 20% | CAGR: 7.0% (2026 to 2036)
Regional intelligence for 5 additional markets available in the complete report: East Asia, South Asia and Pacific, Latin America, Middle East and Africa, Eastern Europe. Contact sales@marketmindsadvisory.com.
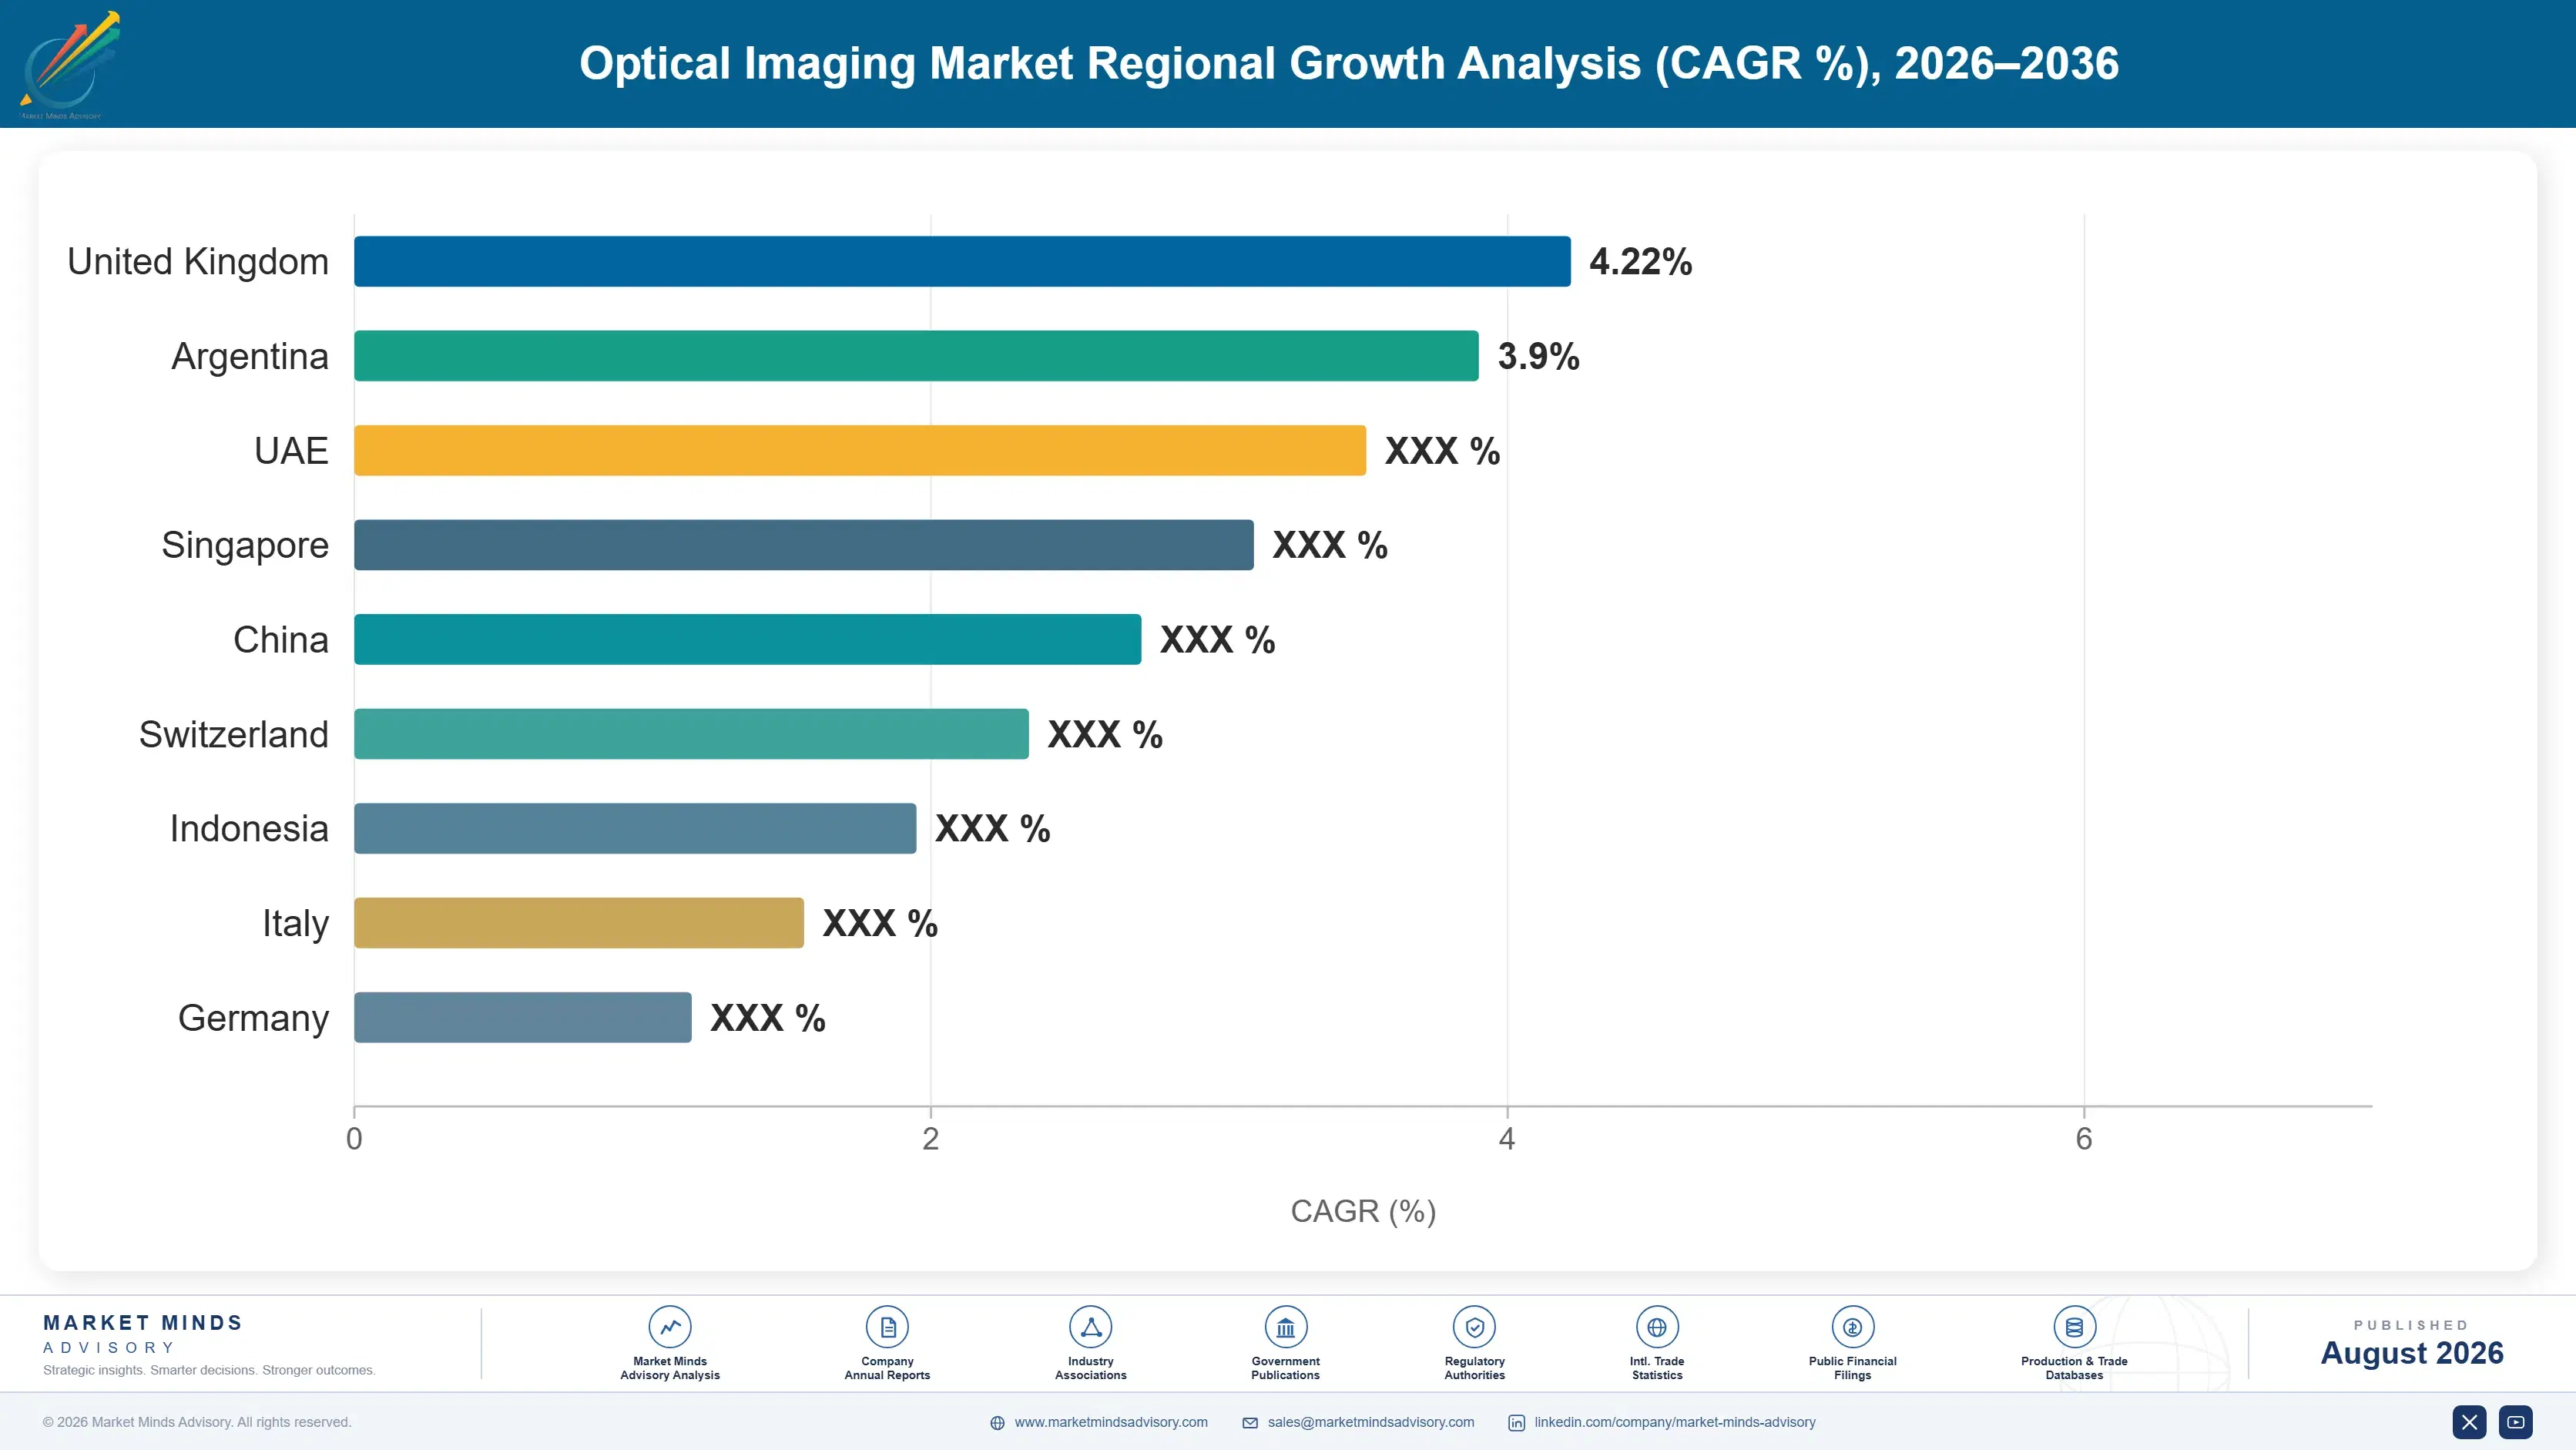
optical-imaging-market-country-cagr-analysis-1787304308028

Software Integration Drives Premium Pricing Tiers

Revenue growth concentrates around four commercial mechanisms rewarding manufacturers who move fastest on software integration, screening program partnerships, and manufacturing cost reduction efforts across most major markets today. Hardware-only differentiation is losing pricing power as optical resolution improvements plateau, pushing manufacturers toward software bundling, service contracts, and public procurement relationships that sustain premium positioning.

Bundle AI Interpretation Software Into Core Platforms

Manufacturers bundling AI-assisted interpretation software directly into hardware platforms rather than selling separate licenses capture higher realized revenue per unit and win more tender evaluations against hardware-only competitors. Bundled systems now command a 22% price premium over comparable hardware-only platforms, according to recent tender data across major markets, since procurement committees increasingly value reduced clinician reading time as a quantifiable operational benefit. Manufacturers without validated interpretation software face mounting pressure to either license third-party algorithms or develop internal capability quickly, since the bundling trend is accelerating faster than most standalone software vendors can independently scale distribution.
Market Impact: Bundled systems command 22% pricing

Secure National Screening Program Procurement Contracts

Manufacturers securing multi-year national screening program contracts capture predictable high-volume revenue that insulates them from cyclical hospital capital spending fluctuations affecting competitors reliant on individual clinic sales. China's national diabetic retinopathy screening program alone now represents demand for more than 20,000 imaging units annually, and manufacturers with established government relationships are winning disproportionate share of these large-scale tenders. Building government procurement relationships requires sustained local presence and regulatory relationship investment, but the resulting contract revenue tends to persist across multiple budget cycles once a manufacturer becomes an approved national supplier.
Market Impact: Screening program contracts add 20,

Reduce Adaptive Optics Manufacturing Costs Toward Mainstream Pricing

Manufacturers investing in adaptive optics component cost reduction are positioned to capture the category's next growth wave as pricing approaches levels accessible to mainstream specialist ophthalmology practices rather than only research institutions. Component costs for adaptive optics systems have declined an estimated 18% over the past three years as production volume scales and detector technology matures, narrowing the price gap with conventional premium OCT platforms. Manufacturers achieving further cost reduction fastest will capture disproportionate share of the anticipated transition from research-only deployment toward broader specialist clinical adoption over the coming several years.
Market Impact: Component costs have declined 18% o

Expand Service Contract Attach Rates Across Installed Base

Manufacturers expanding multi-year service and calibration contract attach rates capture recurring revenue that partially offsets cyclical hardware sales volatility tied to hospital capital budget cycles across most major markets. Service contract attach rates now reach approximately 55% of the installed base among leading manufacturers, up from a much lower share a decade ago, as hospitals increasingly value guaranteed uptime and calibration accuracy for diagnostic-grade equipment. Manufacturers with the strongest field service networks are converting this attach rate advantage into durable recurring revenue that smooths quarterly performance relative to competitors dependent primarily on new unit sales.
Market Impact: Service contracts now cover 55% of

Who Controls the Margin Pool

Five manufacturers hold 71% combined share on a global revenue basis, a concentration level reflecting regulatory clearance barriers and optical engineering expertise that keep new entrants scarce relative to more fragmented device categories. Carl Zeiss Meditec leads the field by a meaningful margin, its combined OCT and surgical ophthalmology portfolio giving it broader hospital relationships than Topcon, the nearest challenger, whose strength concentrates more heavily in fundus imaging and op
Current competitive activity centers on AI interpretation software integration, national screening program tender participation, and adaptive optics cost reduction rather than price competition on conventional OCT hardware alone. Manufacturers are racing to secure regulatory clearance for AI-assisted diagnostic claims, since procurement committees increasingly condition purchasing decisions on validated software capability. Distribution partnerships with regional optometry chains now shape access economics across many mid-tier markets.

Emerging pressure comes from Chinese domestic manufacturers scaling production for national screening tenders, and from specialized software companies pursuing standalone AI interpretation licensing that could eventually decouple software value from proprietary hardware platforms. Rankings shift most where screening program contract wins occur, since a single large national tender can meaningfully reorder near-term revenue share among competitors of otherwise comparable technical capability.
optical-imaging-market-company-positioning-matrix-1787304308548

Competitive Moat and Risk Dimensions

CARL ZEISS MEDITEC AG

Moat: Integrated Surgical and Diagnostic Portfolio

Carl Zeiss Meditec pairs its diagnostic OCT platforms with surgical ophthalmology equipment, giving it broader hospital system relationships than competitors focused on diagnostics alone. This integration lets Zeiss bundle diagnostic and surgical purchasing conversations within the same account relationship, reinforcing its lead in large hospital system tenders where consolidated vendor relationships increasingly matter more than individual product specifications.
CARL ZEISS MEDITEC AG

Risk: Premium Pricing Exposure Risk

Zeiss's premium pricing strategy leaves it more exposed than lower-cost competitors when public procurement tenders prioritize unit cost over integrated capability, particularly across price-sensitive national screening programs in emerging markets. If screening program volume continues shifting toward cost-optimized domestic manufacturers, Zeiss's premium positioning could face growing pressure in exactly the segment driving the fastest unit volume growth industry-wide.
TOPCON CORPORATION

Moat: Fundus Imaging Channel Depth

Topcon maintains the deepest distribution relationships across independent optometry practices worldwide, a channel that Zeiss and other hospital-focused competitors have historically under-invested in relative to their acute care relationships. This optometry channel depth gives Topcon disproportionate access to the community screening volume that national diabetic retinopathy programs increasingly route through primary and optometric care settings rather than hospital-based ophthalmology departments.
TOPCON CORPORATION

Risk: Adaptive Optics Development Lag

Topcon has moved more slowly into adaptive optics and molecular imaging platforms than several smaller specialized competitors, leaving a capability gap in the fastest-growing premium segments of the market. If adaptive optics adoption accelerates faster than Topcon's internal development timeline allows, the company risks ceding early leadership in next-generation platforms to research-focused competitors already commercializing comparable technology.

Players Tracked

Prominent Players

Carl Zeiss Meditec AG
Topcon Corporation
Heidelberg Engineering GmbH
Nidek Co., Ltd.
Optos plc

Other Key Players

Canon Inc.
Nikon Corporation
Kowa Company Ltd.
CenterVue S.p.A.
Optovue, Inc.
Michelson Diagnostics Ltd.
Thorlabs, Inc.
Leica Microsystems GmbH
Bruker Corporation
Notal Vision, Inc.
Volk Optical, Inc.
Welch Allyn, Inc.
Luneau Technology (Visionix)
iCare Finland Oy
Imagine Eyes SAS

Recent Developments

FEBRUARY 2026

Zeiss Integrates AI Vascular Analysis Into OCT-Angiography

Carl Zeiss Meditec announced expanded AI-assisted interpretation software capability integrated directly into its flagship OCT-angiography platform, targeting faster regulatory clearance across multiple jurisdictions. The launch adds automated vascular density measurement alongside existing structural analysis tools, reducing clinician reading time for combined structural and vascular assessment procedures.
Signal: Signals hardware manufacturers now treat i
SEPTEMBER 2025

Topcon Wins National Community Screening Supply Agreement

Topcon Corporation signed a multi-year supply agreement with a national health ministry to provide fundus imaging systems across newly established community screening centers, expanding its national screening program presence significantly. The agreement covers equipment, training, and multi-year maintenance service across several hundred planned facility installations nationwide.
Signal: Signals national screening program contrac
MAY 2025

Heidelberg Licenses Adaptive Optics Imaging Technology

Heidelberg Engineering and a specialized adaptive optics research firm announced a technology licensing agreement covering cellular-resolution retinal imaging components, aimed at accelerating commercial adaptive optics platform development. The partnership combines Heidelberg's existing OCT manufacturing scale with the partner's specialized optical component expertise and intellectual property.
Signal: Signals established manufacturers increasi

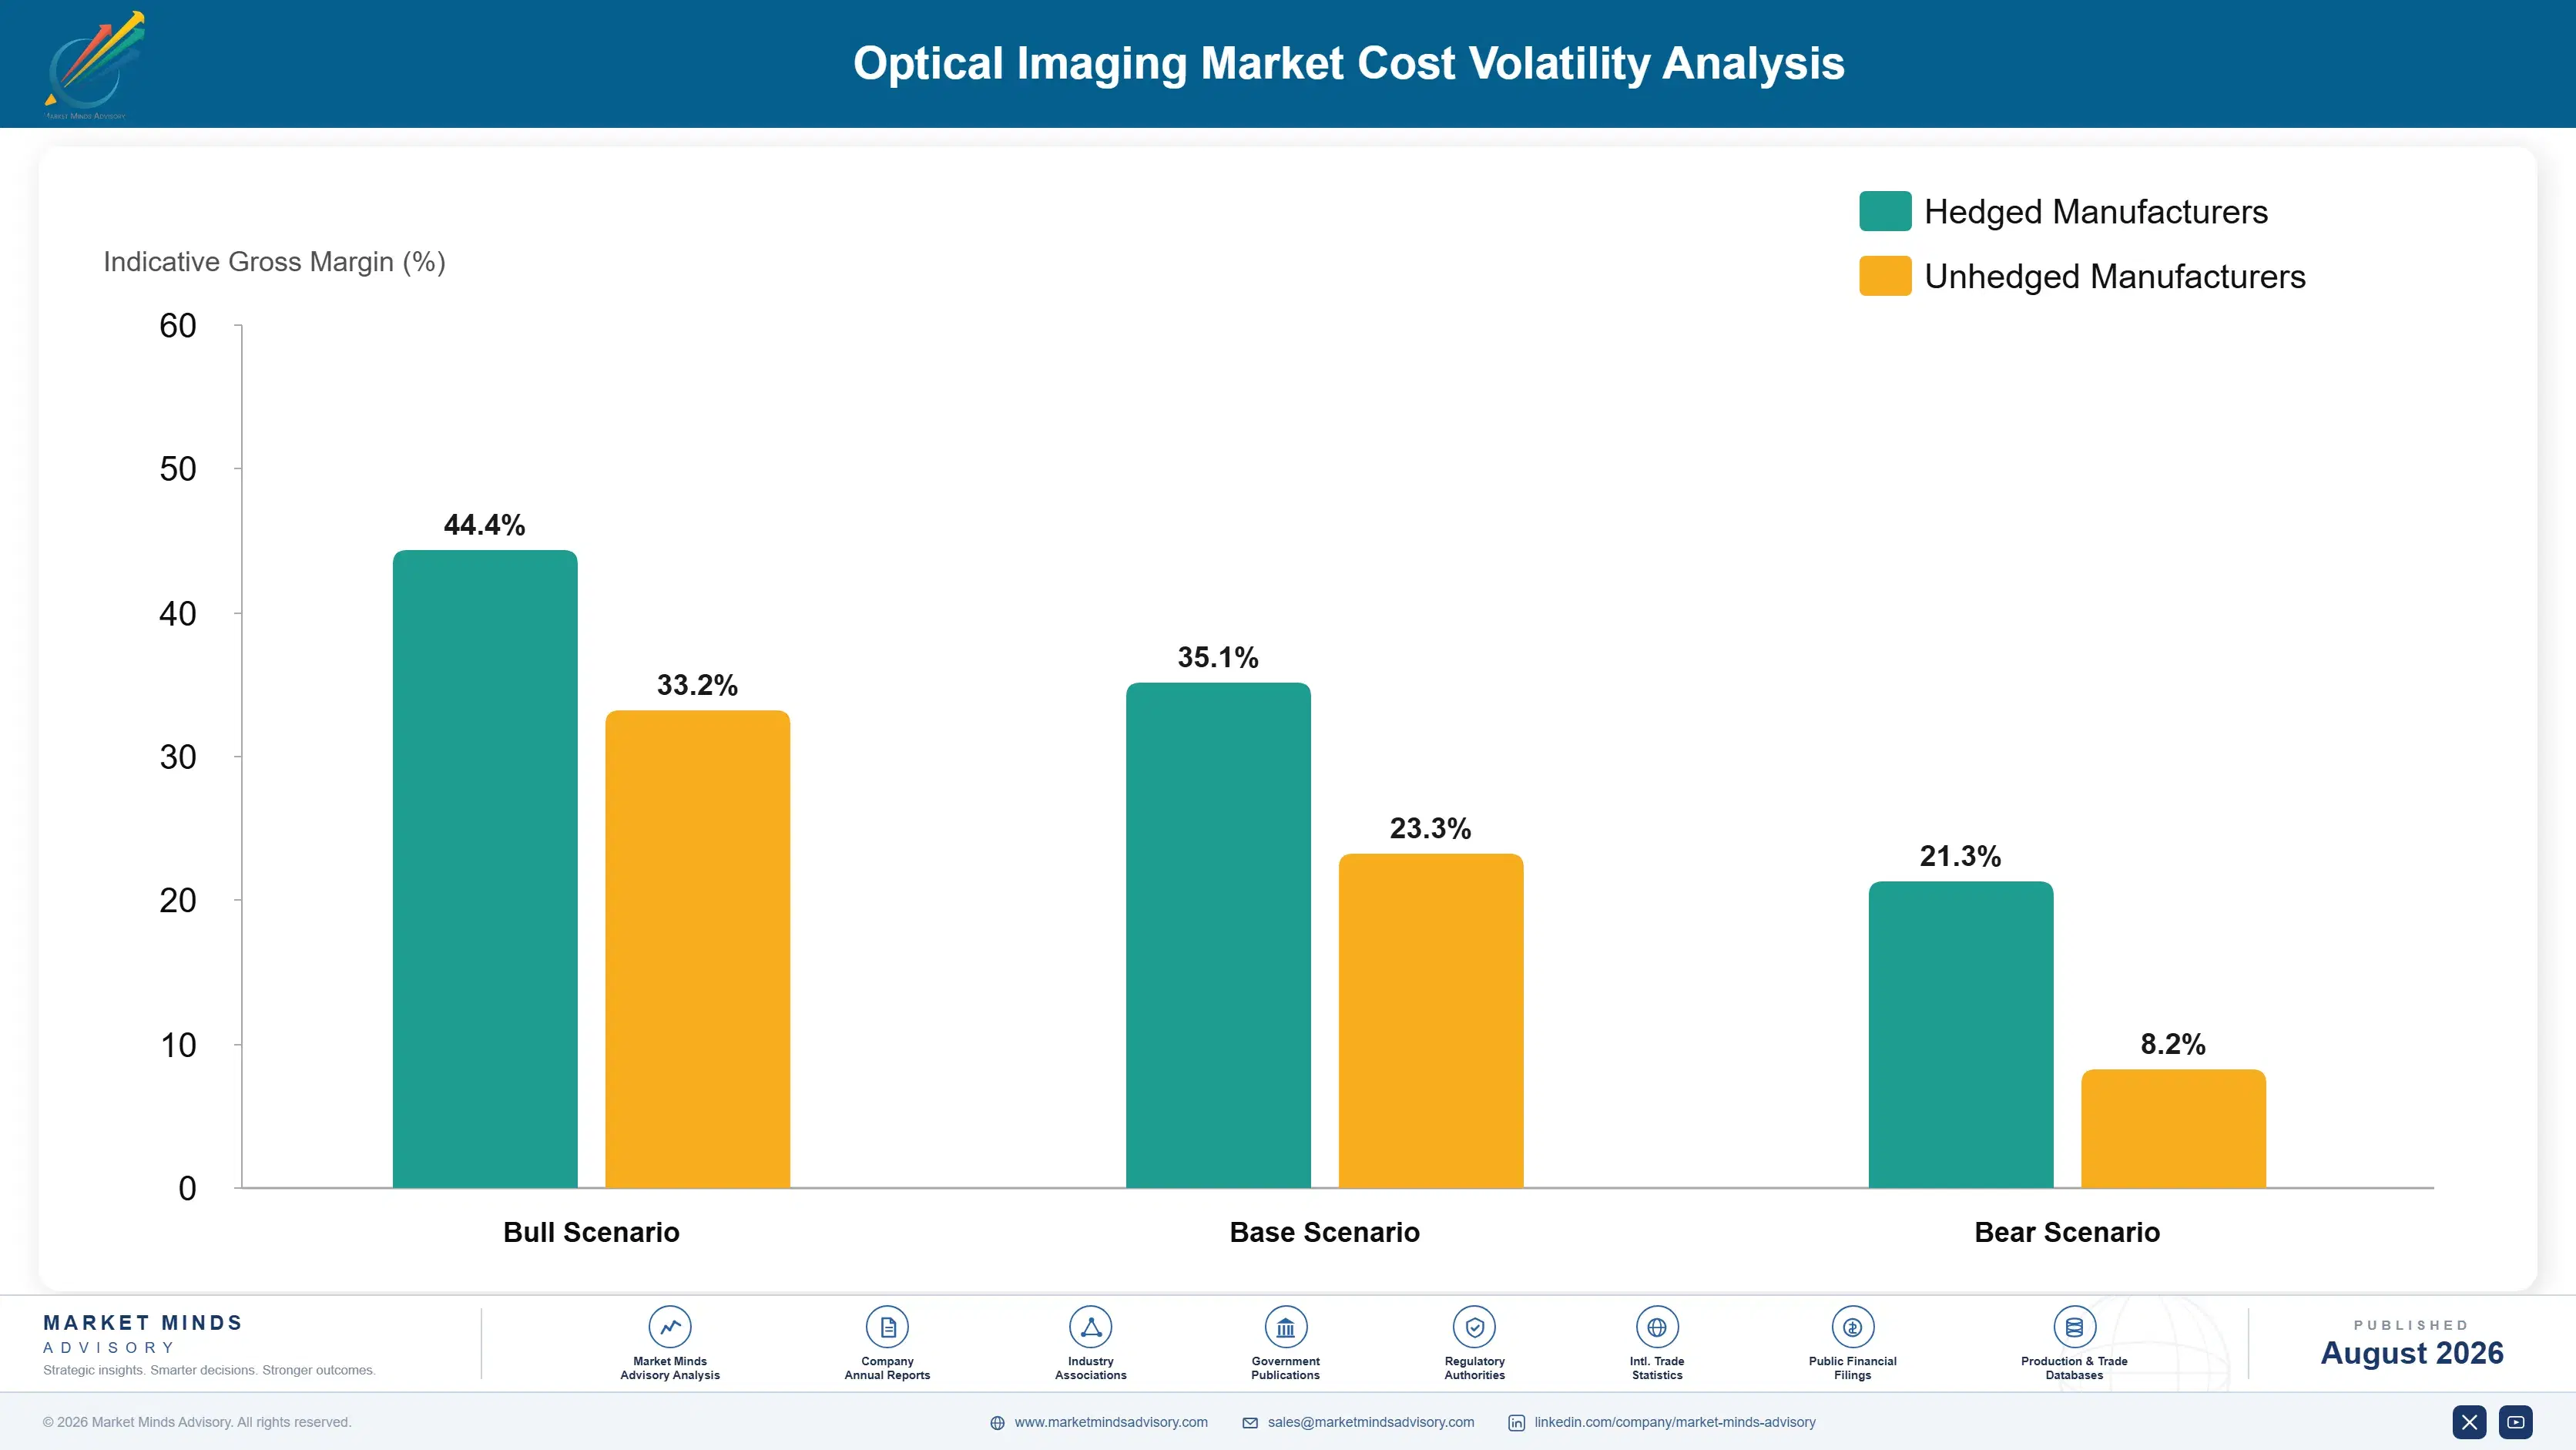
Precision Optics Sourcing Shapes Margin Structure

Precision optical components, including lenses, detector arrays, and light source modules, account for roughly 40% of cost of goods sold across optical imaging systems, with a further 15% attributable to electronics and software integration. Most precision optical component manufacturing concentrates in Japan and Germany, while detector arrays increasingly source from specialized semiconductor fabricators in East Asia.
Global semiconductor supply disruption pushed detector array costs up an estimated 15% during 2023, according to EIA-adjacent electronics component trade data covering optical sensor imports, before easing through 2024 as fabrication capacity expanded. Precision lens grinding capacity, concentrated among a small number of specialized German and Japanese suppliers, remains a persistent bottleneck according to recent company annual report disclosures citing extended lead times for premium optical assemblies.

Larger manufacturers with vertically integrated optical component production absorb input cost volatility more easily than smaller specialized competitors dependent on third-party component suppliers for critical optical assemblies used across most premium platforms. Manufacturers serving price-sensitive national screening programs face the sharpest exposure, since multi-year fixed-price government contracts leave little room to pass through component cost increases once agreements are signed and locked in place.
optical-imaging-market-cost-volatility-analysis-1787304308747

Qualify Secondary Detector Array Suppliers

Manufacturers increasingly qualify secondary detector array suppliers across multiple East Asian semiconductor fabricators, reducing exposure to any single supplier's capacity constraints or regulatory disruption entirely. This dual-sourcing approach adds modest qualification cost upfront but has measurably reduced supply interruption incidents for manufacturers who adopted it early, ahead of recent semiconductor shortages affecting the industry.

Vertically Integrate Precision Lens Grinding Capacity

Larger manufacturers are investing directly in in-house precision lens grinding capacity rather than relying entirely on the small pool of specialized German and Japanese suppliers, reducing exposure to external lead time constraints. This vertical integration requires substantial upfront capital investment but has already shortened lead times for manufacturers pursuing it ahead of broader industry adoption.

Structure Multi-Year Component Pricing Agreements

Manufacturers serving government screening programs increasingly negotiate multi-year component pricing agreements with key suppliers that mirror the multi-year government contracts they themselves sign, aligning cost and revenue timing more closely. This reduces margin compression risk from mismatched contract cycles, though it requires suppliers willing to accept longer-term price certainty over spot-market flexibility and volume guarantees.

Portfolio Architecture for Margin Defence

Portfolio economics split across three tiers defined by resolution capability and software integration depth rather than imaging modality alone. Volume conventional fundus cameras and entry-level OCT systems carry moderate margins driven by steady multi-manufacturer competition, while premium AI-integrated OCT-angiography and adaptive optics platforms command materially wider margins, reflecting software differentiation and specialist clinical positioning that commodity hardware competitors cann
Volume and premium tiers pull manufacturer strategy in different directions, since national screening program procurement rewards manufacturers who can supply enormous unit volume at competitive per-unit cost, while specialist ophthalmology markets reward manufacturers who can demonstrate diagnostic differentiation through validated software and resolution advantages. Few manufacturers compete credibly across both tiers, since the manufacturing scale, software investment, and commercial infrastructure required for each differ substantially.

High-value margin pools concentrate almost entirely in adaptive optics, molecular imaging, and AI-integrated OCT-angiography categories serving specialist ophthalmology and research institutions in North America, Western Europe, and leading East Asian academic centers. Volume tiers generate the overwhelming majority of unit count but a comparatively modest share of total industry profit pool, a divergence that continues widening as software differentiation accelerates faster than hardware pricing pressure eases.

Volume / Commodity-Adjacent

Entry-level fundus cameras and conventional OCT systems sold predominantly through national screening programs and general optometry practices, competing largely on unit price and reliable field service support across most regions.
Gross Margin: 20-32%

Premium / Certified

Premium AI-integrated OCT-angiography and confocal microscopy platforms sold through specialist ophthalmology and hospital channels, commanding meaningfully wider margins through validated software and diagnostic differentiation capability that competitors cannot easily match.
Gross Margin: 42-55%

Sustainability / Regulatory / Next-Generation

Adaptive optics, molecular fluorescence imaging, and photoacoustic imaging platforms still concentrated in research and early clinical deployment, priced at the category's highest premium levels given limited near-term competitive alternatives available.
Gross Margin: 55-68%
optical-imaging-market-portfolio-architecture-1787304309253

Replacement Cycles Anchor Recurring Equipment Demand

Optical imaging revenue functions on a replacement-cycle annuity model rather than a purely one-time capital sale, since installed systems require periodic hardware refresh and increasingly, ongoing software subscription renewal as interpretation algorithms improve. This recurring dynamic underpins manufacturer willingness to invest in service networks and software platforms, since retained accounts generate predictable multi-year revenue regardless of which specific hardware generation a custom
Adoption depth varies meaningfully by end-use vertical, running deepest in academic medical centers and large hospital systems that standardize equipment across their full network, and shallowest in small independent optometry practices still operating older single-modality systems. Screening program stickiness proves particularly strong once government agencies establish a preferred supplier relationship, with switching rates to competing manufacturers remaining low across most established national programs tracked.

Buyer profiles are shifting generationally as younger ophthalmologists trained on AI-assisted interpretation tools increasingly expect software capability as a baseline requirement rather than a premium upgrade option. Procurement committees report this generational preference is accelerating purchasing decisions toward integrated software platforms faster than reimbursement policy has formally adjusted, pulling software-inclusive purchasing decisions earlier into typical equipment replacement cycles.
optical-imaging-market-end-use-penetration-index-1787304309753

Where MMA Sees the Advantage

These are among the four positions where our research anticipates prominent divergence between winners and laggards over the coming forecast period. Each is grounded in the demand model, the regulatory perimeter, and the announced capacity pipeline.
01 / SOFTWARE INTEGRATION PRIORITY

Prioritize AI Software Integration Over Incremental Hardware Gains

Manufacturers chasing marginal resolution improvements are losing tender evaluations to competitors who bundled validated AI interpretation software into comparable hardware platforms instead of pursuing incremental optical gains alone across most product categories and clinical settings tracked. Procurement data now shows committees default to whichever manufacturer demonstrably reduces clinician reading time, not whichever offers the sharpest resolution specification on paper today. MMA sees software capability, not incremental hardware improvement, as the clearer near-term differentiator through the current ten-year forecast window ahead.
02 / SCREENING PROGRAM POSITIONING

Build National Screening Relationships Before Competitors Lock Them In

National screening program contracts built early tend to persist through subsequent budget cycles, giving first movers durable government relationship advantages that later entrants find genuinely costly to displace once agreements are formally in place and renewed regularly. Manufacturers waiting for screening markets to mature before engaging health ministries are ceding this relationship advantage to faster-moving competitors already embedded in multi-year procurement negotiations across several regions and program tiers. MMA views screening-program positioning as a multi-year strategic asset worth pursuing immediately.
03 / ADAPTIVE OPTICS COST REDUCTION

Invest in Adaptive Optics Manufacturing Scale Now

Manufacturers that reduce adaptive optics component costs fastest will capture the category's next growth wave as pricing approaches mainstream specialist affordability rather than remaining confined to research-only deployment indefinitely across most current markets and institutions. Competitors delaying manufacturing scale investment risk ceding this transition entirely to whichever manufacturer reaches cost parity with conventional premium OCT platforms first, a timing advantage that compounds meaningfully once achieved. MMA sees this cost curve as the clearest strategic inflection point ahead for the category.
04 / DISTRIBUTION CHANNEL DEPTH

Strengthen Optometry Channel Depth Alongside Hospital Relationships

Manufacturers concentrating exclusively on hospital system relationships risk missing the community screening volume increasingly routed through optometry and primary care channels as national programs expand access beyond specialist centers nationwide and internationally each passing year. Topcon's optometry channel depth illustrates how this distribution advantage compounds as screening programs mature and shift volume toward primary care settings over time across multiple regions and program types. MMA recommends building comparable channel depth rather than relying solely on hospital account relationships going forward.

Engagement Snapshot From the Field

A live engagement with an industry participant carrying material or product regulatory and market exposure ahead of a defining policy shift, showing how our research translates into a defensible multi-year portfolio strategy.
MARKET MINDS ADVISORY · CLIENT ENGAGEMENT SUMMARY
Optical Imaging Producer Strategic Portfolio Review and Transition Roadmap 2026·Investment Scenario on Optical Imaging Exposure Evaluation 2025-26
CLIENT PROFILE
The client operates a regional hospital network in Southeast Asia serving eighteen facilities across three provinces, with reported annual diagnostic imaging capital budget of approximately 12 million US dollars (client-reported, unverified by MMA) allocated across radiology, cardiology, and ophthalmology equipment categories. The organization sought to standardize optical imaging procurement across its ophthalmology departments but lacked comparative vendor performance data to guide the sourcing decision.
STRATEGIC CHALLENGE
Leadership needed to determine which OCT and fundus imaging vendor would deliver the strongest total cost of ownership across eighteen facilities with varying patient volume, while ensuring AI interpretation software compatibility with the network's existing electronic health record system integration requirements across every facility involved in the upcoming procurement cycle.
MMA APPROACH
MMA combined its primary survey dataset with expert interviews across regional ophthalmologists and procurement officers to benchmark vendor total cost of ownership, service response times, and software integration compatibility across five leading manufacturers competing for the contract. The engagement produced facility-tier-specific recommendations rather than a single network-wide vendor selection decision.
KEY FINDINGS
  1. Total cost of ownership varied by up to 28% across competing vendors once service contracts and software licensing were included, not just initial hardware purchase price.
  2. Two of eighteen facilities had patient volume low enough that premium AI-integrated systems would not achieve reasonable utilization within a five-year payback window.
  3. The network's existing electronic health record system was fully compatible with only three of five evaluated vendors, narrowing the realistic shortlist considerably.
  4. Regional service response times varied significantly by vendor, with two manufacturers unable to guarantee 48-hour on-site repair across all eighteen facility locations.
CLIENT PROFILE
The client operates a regional hospital network in Southeast Asia serving eighteen facilities across three provinces, with reported annual diagnostic imaging capital budget of approximately 12 million US dollars (client-reported, unverified by MMA) allocated across radiology, cardiology, and ophthalmology equipment categories. The organization sought to standardize optical imaging procurement across its ophthalmology departments but lacked comparative vendor performance data to guide the sourcing decision.
STRATEGIC CHALLENGE
Leadership needed to determine which OCT and fundus imaging vendor would deliver the strongest total cost of ownership across eighteen facilities with varying patient volume, while ensuring AI interpretation software compatibility with the network's existing electronic health record system integration requirements across every facility involved in the upcoming procurement cycle.
MMA APPROACH
MMA combined its primary survey dataset with expert interviews across regional ophthalmologists and procurement officers to benchmark vendor total cost of ownership, service response times, and software integration compatibility across five leading manufacturers competing for the contract. The engagement produced facility-tier-specific recommendations rather than a single network-wide vendor selection decision.
KEY FINDINGS
  1. Total cost of ownership varied by up to 28% across competing vendors once service contracts and software licensing were included, not just initial hardware purchase price.
  2. Two of eighteen facilities had patient volume low enough that premium AI-integrated systems would not achieve reasonable utilization within a five-year payback window.
  3. The network's existing electronic health record system was fully compatible with only three of five evaluated vendors, narrowing the realistic shortlist considerably.
  4. Regional service response times varied significantly by vendor, with two manufacturers unable to guarantee 48-hour on-site repair across all eighteen facility locations.
RECOMMENDED STRATEGY
Phase 1: Phase 1 (Months 1-2): Shortlist vendors based on electronic health record compatibility and validated regional service response time commitments made. Phase 2: Phase 2 (Months 3-5): Negotiate network-wide pricing and multi-year service agreements with the two highest-scoring vendors identified in Phase 1. Phase 3: Phase 3 (Months 6-12): Deploy premium systems at high-volume facilities first, reserving mid-tier hardware for the two lower-volume locations identified.
OUTCOME
The network selected its two top-scoring vendors, reporting a 21% reduction in projected five-year total cost of ownership compared to its original single-vendor shortlist (client-reported, unverified by MMA). The phased deployment approach avoided over-provisioning premium systems at lower-volume facilities that would not have achieved adequate utilization.

Frequently Asked Questions

Foundational context covering the market sizes, CAGR, scope, country, region and competition that inform every finding below. This section is provided to cover basics and most often pre-purchase conversations, answered from the MMA Primary Research Dataset.

What is the current size of the Optical Imaging Market?

The global optical imaging market was valued at approximately 4.2 billion US dollars in 2025. This figure spans OCT, fundus imaging, confocal microscopy, fluorescence imaging, adaptive optics, and photoacoustic imaging systems across all tracked regions.

How large will the Optical Imaging Market be by 2036?

The optical imaging market is projected to reach approximately 10.4 billion US dollars by 2036, up from 4.56 billion in 2026. This represents a 2.28 times expansion over the ten-year forecast period.

What is the CAGR for the Optical Imaging Market 2026 to 2036?

The market is forecast to grow at an 8.6% compound annual growth rate between 2026 and 2036. Bull and bear scenarios range from 9.8% to 7.4%, reflecting AI software adoption pace uncertainty.

Which segment is growing fastest?

Adaptive optics imaging systems are the fastest-growing segment, expanding at 13.0% annually, roughly 1.51 times the overall market rate. Research institutions and leading specialist practices are driving early cellular-resolution retinal imaging adoption.

Who are the major companies in the Optical Imaging Market?

Leading companies include Carl Zeiss Meditec, Topcon Corporation, Heidelberg Engineering, Nidek, and Optos. These five manufacturers collectively hold 71% combined share on a global revenue basis.

Which country is growing fastest?

China is the fastest-growing country market, expanding at 11.2% annually as its national diabetic retinopathy screening program continues scaling across township and community health centers. This growth reflects volume expansion under public procurement.

Report Segmentation Architecture

The full report scope spans multiple orthogonal segmentation dimensions, with cross-tabulated demand data provided for each dimension pair. Coverage extends further to regional breakdowns, trend trajectories, and the competitive detail needed to support segment-level decision-making.

By Primary Market Dimension

  • Optical Coherence Tomography (OCT)
  • Fundus Imaging and Retinal Cameras
  • Confocal Laser Scanning Microscopy
  • Fluorescence and Molecular Imaging
  • Adaptive Optics Imaging Systems
  • Photoacoustic Imaging Systems

By End-Use Industry

  • Hospitals and Academic Medical Centers
  • Ophthalmology and Optometry Clinics
  • Research Institutions and Pharmaceutical Laboratories
  • Public Health Screening Programs
  • Ambulatory Surgical Centers

By Commercial Dimension

  • Direct Hospital System Sales
  • Independent Optometry Distribution Channel
  • Government and Public Procurement Tenders
  • Research and Academic Institutional Sales

By Region

  • North America
  • Western Europe
  • East Asia
  • South Asia and Pacific
  • Latin America
  • Middle East and Africa
  • Eastern Europe

Scope, Methodology, and Coverage

Every figure in this report is reproducible from documented input assumptions. The scope below maps the historical period, the forecast horizon, the segmentation dimensions, and the countries covered, alongside the underlying primary and qualitative methodology.
Historical Period
2020 to 2025
Forecast Period
2026 to 2036
Base Year
2025 (USD billions; MMA Primary Research Dataset, August 2026)
Market Definition
This report covers the global market for optical imaging systems used in diagnostic and clinical applications, spanning optical coherence tomography, fundus imaging, confocal microscopy, fluorescence imaging, adaptive optics, and photoacoustic imaging platforms. It excludes conventional radiographic, ultrasound, and MRI imaging modalities that do not rely on optical or photonic detection principles.
Quantitative Units
USD billions (current prices); installed unit base and average selling price where applicable
Segmentation Dimensions
By Primary Market Dimension; By End-Use Industry; By Commercial Dimension; By Region
Regions Covered
North America, Western Europe, East Asia, South Asia and Pacific, Latin America, Middle East and Africa, Eastern Europe
Countries Covered
USA, China, Germany, France, UK, Japan, South Korea, India, Australia, Canada, Brazil, Mexico, Indonesia, Vietnam, Thailand, Malaysia, UAE, Saudi Arabia, South Africa, Nigeria, Turkey, Poland, Netherlands, Italy, Spain, Sweden, Switzerland, Argentina, Colombia, Singapore, and additional markets relevant to this sector
Key Companies Profiled
Carl Zeiss Meditec AG; Topcon Corporation; Heidelberg Engineering GmbH; Nidek Co., Ltd.; Optos plc; Canon Inc.; Nikon Corporation; Kowa Company Ltd.; CenterVue S.p.A.; Optovue, Inc.; Michelson Diagnostics Ltd.; Thorlabs, Inc.; Leica Microsystems GmbH; Bruker Corporation; Notal Vision, Inc.; Volk Optical, Inc.; Welch Allyn, Inc.; Luneau Technology (Visionix); iCare Finland Oy; Imagine Eyes SAS
Quantitative Methodology
Primary survey, n=3,800 respondents, Q4 2025, six countries; demand-side model with trade association cross-validation
Qualitative Methodology
47 expert interviews, Q4 2025; applied to validate demand model assumptions, identify emerging dynamics, and assess competitive positioning
Report Format
PDF and XLSX data workbook (Word format preview document)
Publisher
Market Minds Advisory
Report Code
MMA-2026-MED-509
Published
August 2026
Contact
sales@marketmindsadvisory.com | www.marketmindsadvisory.com

Purchase the full Optical Imaging Market Report (2026 to 2036).

This report delivers a complete assessment of the global optical imaging market, covering OCT, fundus imaging, confocal microscopy, fluorescence imaging, adaptive optics, and photoacoustic platforms across all seven MMA-tracked regions through 2036. It combines primary survey data from 3,800 respondents with 47 expert interviews across ophthalmologists, procurement officers, and manufacturers to quantify segment, regional, and competitive dynamics. Readers receive detailed sizing, forecast scenarios, and margin analysis across three commercial tiers. The report also profiles twenty companies and includes a full competitive assessment of moat and risk positioning across the five leading manufacturers.
Ten-Year Forecast Across Three Growth Scenarios
Seven-Region Market Sizing With Country-Level Detail
Twenty Company Competitive Profiles and Benchmarking
Segment-Level Growth Analysis Across Six Categories
Input Cost and Supply Chain Risk Assessment
Portfolio Margin Architecture Across Three Tiers

Built For The People Who Decide

From boardroom strategy to bench-side execution, this report is read cover-to-cover by leaders shaping the next decade of their industry, turning demand scenarios, market dynamics and valuation benchmarks into decisions.
CXOs/ Presidents/ VPs/ Managers
M&A and Corporate Development
Strategy Teams and R&D Heads
Procurement and Product Directors
Regulatory and Compliance Leaders
Investor Relations and Equity Analysts