Market Minds Advisory
Optical Communication and Networking Market

Optical Communication and Networking Market: Optical Communication and Networking Market. AI Data Centers Redraw Transceiver Demand

AI training clusters are consuming optical transceivers at a pace telecom carriers never approached, forcing suppliers to treat data center interconnect as the primary demand driver rather than a secondary application of legacy telecom optics.

Lead Analyst

Published

September 2026

Make Smarter Decisions with Customized Research Insights

Request a free sample report and evaluate market opportunities, growth trends, and competitive dynamics relevant to your business needs.

2025 MARKET VALUE$22.5BMarket Size 2025
2036 FORECAST VALUE$61.7BBase Case , 2026 to 2036
CAGR 2026 TO 20369.6 %Bull 10.8% / Bear 8.4%
INCREMENTAL OPPORTUNITY$37.0BNet 10- year value creation
EXPANSION MULTIPLE2.50x2036 value over 2026 base
Strategic Levers
M&A Pipeline
Regional Outlook
Country Rankings
Competitive Intelligence
Segmental Deep-dive
Call-Us : 91 93563 13602

Executive Snapshot and Market Trajectory.

Optical communication equipment has moved from a specialized telecom backbone component to critical data center infrastructure as AI training clusters demand interconnect bandwidth that copper cabling cannot deliver at scale. Data center operators now specify optical transceiver density before finalizing rack architecture.
Optical transceivers and modules are growing fastest as AI data center interconnect demand accelerates beyond what traditional telecom deployment ever required, while coherent optical transport systems consolidate a separate but adjacent revenue line concentrated in North America's dense hyperscale data center base and East Asia's expanding telecom infrastructure investment. Data center operators increasingly demand documented signal integrity performance. That requirement barely existed as a standard procurement criterion five years ago.
Large network equipment vendors compete against a handful of specialized optical component manufacturers now bundling transceivers into broader data center interconnect platforms, and rising demand for measurable signal integrity is starting to separate suppliers with genuine field-proven high-volume production from those still selling on theoretical bandwidth specifications alone. Suppliers that document concrete signal performance are winning larger multi-year hyperscaler contracts that smaller unproven competitors increasingly cannot match on credibility in this consolidating category today.
Market Definition
This report defines the Optical Communication and Networking Market as optical transceivers, fiber optic cabling, and switching equipment that transmit data using light signals for telecom and data center applications. It excludes copper-based networking equipment and wireless radio frequency communication systems.
Base Year Value
$22.5B in 2025 (MMA Primary Research Dataset, September 2026)
Forecast Period
2026 to 2036, eleven discrete annual values
CAGR
9.6% base case. Bull 10.8%. Bear 8.4%.
Fastest Growth Segment
Optical Transceivers and Modules: 15.8% CAGR
Fastest Growth Country
India: 12.6% CAGR
Fastest Growth Region
South Asia and Pacific: 11.7% CAGR
Largest Region
North America: 30% of 2025 global value
Market Leaders
Ciena Corporation, Infinera, Nokia, Huawei Technologies, and Cisco Systems. Source: MMA Analysis based on company disclosures and shipped transceiver unit estimates.
Primary Survey
n=3,800 procurement and R&D decision-makers, Q4 2025, six countries
Methodology
Demand-side build-up, cross-validated against public data, 47 expert interviews

Optical Communication and Networking Market Forecast Scenarios

optical-communication-and-networking-market-size-forecast-scenario-1789993777761
Between 2020 and 2025 the market accelerated as data center interconnect demand began outpacing traditional telecom deployment volume, expanding at roughly 8.7% annually as transceiver manufacturers proved they could scale production fast enough to meet hyperscaler procurement volume that legacy telecom demand cycles never required. Several major hyperscale operators standardized on high-density optical interconnect during this period.
MMA's base case assumes 9.6% annual growth through 2036, anchored to three mechanisms: expanding AI training cluster deployment requiring optical interconnect bandwidth that copper cabling cannot support at comparable density, rising telecom carrier investment in coherent optical transport to handle growing consumer data consumption, and steady improvement in transceiver manufacturing yield enabling higher production volume at lower unit cost. Suppliers that can demonstrate documented signal integrity across multiple deployment scales are winning larger hyperscaler accounts that smaller single-application competitors increasingly cannot compete for.
The bull case rests on AI training cluster buildout accelerating faster than currently planned across additional hyperscale operators. The bear case centers on data center capital spending pullbacks during economic downturns delaying planned interconnect upgrades already budgeted. That risk is most acute for suppliers concentrated heavily on discretionary hyperscale deployments rather than steady telecom carrier replacement cycles.

From Telecom Backbone to Data Center Lifeline

Optical communication equipment began as a specialized long-haul telecom backbone technology valued mainly for distance transmission capability rather than genuine density optimization. Suppliers have since layered on higher data rate transceivers, coherent transport modulation, and compact form factors for dense rack deployment, turning a telecom-specific technology into a design-critical data center component that determines whether an AI cluster can move data fast enough to keep processors busy.
AVERAGE TRANSCEIVER DATA RATE800GbpsTypical throughput per transceiver deployed in new interconnect builds
SIGNAL INTEGRITY YIELD RATE93%Typical share of manufactured transceivers meeting quality specifications
TOP PRODUCING COUNTRY SHARE27%United States share of global optical networking equipment revenue
DATA CENTER INTERCONNECT SHARE44%Share of optical transceiver shipments now serving data center applications
AVERAGE PRODUCT LIFECYCLE5 yearsTypical duration a transceiver generation remains in active production
OPTICAL COMPONENT COST SHARE36%Share of transceiver cost tied to laser and photodiode components
Pricing now varies sharply by data rate and deployment density. Basic lower-speed telecom-grade transceivers command modest per-unit pricing, while high-density AI cluster interconnect modules command premium pricing that scales with documented signal integrity testing across dense rack configurations. Data center operators increasingly accept higher per-unit costs after a signal degradation incident convinces engineering that integrity depth is genuinely worth paying for.
Large network equipment companies are acquiring specialized optical component manufacturers rather than building comparable laser and photodiode expertise in-house, buying manufacturing know-how and existing hyperscaler relationships rather than production capacity alone. That acquisition pattern is starting to squeeze independent boutique suppliers that lack the scale to invest in comparable manufacturing infrastructure their larger competitors now offer as a standard feature.
"Nobody switches transceiver suppliers over a datasheet comparison. They switch after an AI training run stalls because a link kept dropping packets under real load."
Director, Optical Networking and Data Center Infrastructure Practice · MMA Technology Practice · September 2026

Market Trends

AI Training Clusters Drive Unprecedented Transceiver Demand

Hyperscale AI training cluster operators are increasingly deploying optical interconnect at densities that traditional telecom deployment cycles never approached, fundamentally reshaping transceiver manufacturer production priorities across the industry. This shift accelerated sharply once several major hyperscalers publicly disclosed interconnect bandwidth requirements for next-generation AI training clusters. Roughly 44% of optical transceiver shipments now serve data center applications, up meaningfully from a smaller share just a few years ago. Suppliers lacking high-volume manufacturing capacity increasingly lose hyperscaler contracts to competitors with proven, documented production scale across every major hyperscaler qualification cycle available.
Market Impact: AI interconnect demand grew 22% yearly

Coherent Optical Transport Expands Beyond Long-Haul Networks

Telecom carriers and data center operators are increasingly deploying coherent optical transport technology in shorter-distance applications previously served by simpler direct-detect transceivers, extending coherent technology's addressable market considerably across the industry. This shift reflects growing recognition that coherent transport delivers meaningfully better spectral efficiency as bandwidth demand continues rising across every network segment. Suppliers lacking coherent technology capability increasingly lose bids to platforms that can demonstrate superior spectral efficiency. Roughly 27% of new metro network deployments now specify coherent transport, a pace that continues accelerating each year across major carrier markets.
Market Impact: Telecom carrier orders rose 7% yearly

Market Opportunities and Growth Drivers

AI Data Center Buildout Expands Interconnect Demand

Hyperscale operators continue building AI training clusters requiring interconnect bandwidth that scales considerably faster than traditional enterprise data center deployment ever demanded, creating meaningful new demand for high-density optical modules. Hyperscalers increasingly qualify multiple transceiver suppliers per data center to reduce single-source supply risk, a diversification pattern that expands the addressable supplier base beyond incumbent relationships. Suppliers with demonstrated production scale credentials increasingly capture design wins across multiple hyperscaler accounts simultaneously rather than single contracts. Some suppliers now maintain dedicated hyperscaler account teams purely to serve this growing qualification demand.
Market Impact: adds 36% to optical component cost

Telecom Carrier Network Upgrades Drive Steady Demand

Telecom carriers continue upgrading metro and long-haul networks to handle growing consumer video streaming and mobile data consumption that legacy network capacity cannot support without meaningful bandwidth expansion. Carriers increasingly recognize that coherent optical transport delivers capacity upgrades without requiring costly new fiber deployment across existing routes. Suppliers serving this segment report meaningfully steadier contract growth than those focused purely on volatile hyperscale data center demand cycles. Several suppliers have hired dedicated telecom carrier account teams purely to serve this steady demand across major network upgrade programs. across every region.
Market Impact: cuts product cycles by 8 months

Market Restraints and Challenges

Laser Component Manufacturing Limits Production Scale

Specialized laser and photodiode components required for high-speed optical transceivers remain difficult to manufacture at the precision and volume hyperscale demand now requires, creating a genuine barrier to rapid capacity expansion. The root cause is that laser component manufacturing requires specialized semiconductor fabrication expertise concentrated among a small number of suppliers globally. The commercial impact is that roughly 36% of transceiver production cost now goes toward optical components rather than assembly and testing directly. Some suppliers are responding by investing in vertically integrated laser fabrication to reduce dependence on external component suppliers.
Market Impact: 44% of shipments serve data centers

Rapid Data Rate Generational Shifts Strain Supplier Roadmaps

Data rate requirements for AI interconnect continue advancing faster than typical telecom equipment refresh cycles, forcing suppliers to compress product development timelines considerably to avoid shipping outdated technology. The root cause is that AI training cluster architectures evolve faster than traditional telecom standards bodies typically finalize new specifications through consensus processes. The commercial impact is that suppliers face pressure to ship next-generation products before fully validating long-term reliability under sustained production conditions. Some suppliers are responding by running accelerated qualification testing programs specifically to compress validation timelines without compromising reliability standards.
Market Impact: 27% of deployments specify coherent transport
3 additional market trends, 4 additional growth drivers, and 2 additional restraints and challenges are covered in the full report. Contact sales@marketmindsadvisory.com to access the complete intelligence.

Segment CAGR and Growth Architecture

Optical communication equipment segments by product function rather than end-use application, since a single network deployment typically combines transceivers, cabling, and switching equipment together as complementary infrastructure layers rather than as complete substitutes for one another. Optical transceivers and modules are the fastest growing category as AI data center interconnect demand accelerates across the industry.
optical-communication-and-networking-market-market-share-analysis-1789993778330

Optical Transceivers and Modules

This segment covers pluggable optical modules that convert electrical signals into light for transmission across fiber optic cabling within data centers and telecom networks. Demand is concentrated among hyperscale data center operators deploying AI training clusters where interconnect bandwidth requirements exceed what copper cabling can support at comparable density. Vendors in this segment differentiate on data rate scaling to meet rising bandwidth demand, manufacturing yield consistency at high production volume, and power efficiency critical for dense rack deployment. Growth here outpaces every other segment because AI training cluster buildout is accelerating simultaneously across nearly every major hyperscale operator worldwide. Vendors without this capability increasingly struggle to win the largest hyperscaler qualifications available.
CAGR 15.8%

Coherent Optical Transport Systems

This segment covers transport equipment that uses coherent modulation techniques to maximize data capacity across existing fiber infrastructure without requiring new fiber deployment. Demand comes from telecom carriers and data center operators seeking capacity upgrades on already-installed fiber routes where physical fiber expansion carries considerable cost and permitting delays. Vendors compete on spectral efficiency maximizing capacity per fiber strand, distance reach supporting long-haul and metro applications, and integration depth with existing network management systems already deployed. Growth here trails the transceiver segment but remains well above the broader market average as coherent technology adoption spreads into shorter-distance applications. Enterprise buyers increasingly evaluate spectral efficiency above nominal bandwidth specifications alone. today.
CAGR 12.4%
Full segment breakdown across 7 segments available in the complete report.

Regional Architecture and Country Demand Map

North America leads on the dense concentration of hyperscale AI data centers and network equipment vendor headquarters, while South Asia and Pacific grows fastest as India's expanding telecom infrastructure investment continues steadily scaling rapidly across its growing digital economy nationwide and well beyond that too.

North America

The United States hosts the largest concentration of hyperscale AI data center operators and network equipment vendor headquarters worldwide, anchored by dense clusters of cloud infrastructure providers demanding documented signal integrity before approving new interconnect suppliers. Domestic suppliers built their initial customer base almost entirely from local hyperscaler and telecom carrier relationships before expanding internationally, giving them a home-market advantage in renewal rates and manufacturing relationship depth. Canada contributes a smaller but growing share, anchored by its own data center and telecom infrastructure investment. Domestic suppliers increasingly bundle coherent transport directly into broader network platform subscriptions, reinforcing their position against smaller standalone competitors. Investment in domestic interconnect capacity continues expanding across several major data center clusters.
Share: 30% | CAGR: 10.3% (2026 to 2036)

Western Europe

Germany, the United Kingdom, and France together account for most regional demand, driven by dense telecom carrier bases investing in coherent transport to handle growing consumer data consumption across the European Union's single market. Compliance requirements under European telecommunications frameworks shape network equipment certification protocols more directly here than in markets with lighter regulatory obligations, pushing suppliers toward rigorous documentation practices. Adoption of high-density transceiver deployment trails North America by roughly a year on average, reflecting more conservative data center procurement cycles among established European operators. Growth remains solid even so, as AI infrastructure investment spreads across the continent. Several carriers are investing in unified network reporting to meet rising compliance expectations.
Share: 20% | CAGR: 8.2% (2026 to 2036)
Regional intelligence for 5 additional markets available in the complete report: East Asia, South Asia and Pacific, Latin America, Middle East and Africa, Eastern Europe. Contact sales@marketmindsadvisory.com.
optical-communication-and-networking-market-country-cagr-analysis-1789993778860

Where Suppliers Capture More Hyperscaler Revenue

Suppliers are finding revenue growth less in one-time transceiver sales and more in ongoing signal integrity and network management subscriptions, since hyperscalers who already trust a supplier with sensitive interconnect reliability data are genuinely and quite unusually reluctant to switch providers even when a competitor offers meaningfully lower pricing elsewhere across the entire broader market.

Documented Signal Integrity Certification Service Programs

Suppliers are offering paid signal integrity testing services that generate documented performance data hyperscalers can present during their own reliability audits, turning what was previously an informal quality claim into a billable certification service. Hyperscalers preparing for internal capacity planning reviews increasingly require this documentation before finalizing a supplier relationship. Early adopters report attach rates around 25% among hyperscaler accounts within the first year of launch, concentrated among operators facing their own downstream reliability pressure. Renewal rates among certified accounts consistently exceed the broader customer base. These certifications typically remain valid across two to three renewal cycles.
Market Impact: adds roughly 25% attach rate among hyperscaler accounts

High-Density Interconnect Upgrade Pathway Service Programs

Suppliers increasingly design upgrade paths that convert standard telecom-grade customers into high-density AI interconnect relationships after demonstrating measurable bandwidth improvement on a customer's own cluster architecture during a trial deployment. These high-density deployments now command roughly 52% higher unit pricing and represent the fastest-growing revenue segment within existing customer relationships across the supplier's book of business. Roughly one in three customers who trial high-density interconnect retain it permanently rather than reverting. Application engineers also generate valuable customer insight suppliers use to identify candidates. Retention on these upgraded accounts runs meaningfully higher than standard tiers.
Market Impact: high-density upgrades now command roughly 52% higher pricing

White-Label Optical Module Licensing Partnership Programs

Some suppliers now license their proprietary optical module design and manufacturing technology directly to system integrators building custom interconnect platforms, a distribution channel that bypasses direct transceiver sales entirely. Early licensing deals report margins roughly 20 percentage points higher than comparable direct sales contracts, since the underlying design development cost is already covered by the supplier's own platform investment. System integrators value gaining proven module capability without building comparable expertise in-house. Suppliers increasingly treat this licensing channel as a genuine second business line. These agreements typically span multiple years across a supplier's full customer base.
Market Impact: module licensing revenue now grows roughly 18% yearly

Multi-Site Hyperscaler Fleet Consolidation Agreement Programs

Large hyperscalers running dozens of data centers across multiple regions need supply agreements that guarantee consistent transceiver quality and delivery schedules across every site while still accommodating design changes on individual data center generations. Suppliers offering this multi-site consistency charge substantial premiums over single-site pricing, since the quality control infrastructure required to guarantee consistency across sites is considerably higher than most competitors have built well at scale. Customers adopting multi-site agreements increase average contract value by roughly 46% compared to single-site arrangements. These agreements typically span multiple years across a customer's full site footprint.
Market Impact: increases contract value by roughly 46% per site

Who Controls the Margin Pool

The Optical Communication and Networking Market shows moderate to high concentration, with the top five suppliers, evaluated on shipped transceiver unit volume, holding roughly 54% combined share. Ciena Corporation and Infinera lead on coherent transport manufacturing scale and telecom carrier relationship depth respectively, but the gap to Nokia has narrowed sharply as it bundles transceivers into existing carrier network relationships customers never intended to procure separately. That shift alone is reshaping how hyperscalers evaluate suppliers.
Current competitive activity centers on high-density AI interconnect manufacturing scale-up, with nearly every supplier racing to build production lines capable of supplying hyperscaler demand rather than legacy telecom order volumes only. Suppliers are also investing heavily in coherent transport technology, since carriers increasingly treat spectral efficiency as a baseline procurement requirement rather than an optional feature.

Emerging pressure comes from Chinese optical component manufacturers extending into premium high-density interconnect categories, a fast-moving competitive threat established Western incumbents were genuinely slow to anticipate. Rankings could shift meaningfully over the next several years if large network equipment vendors continue absorbing independent optical component manufacturers through acquisition, particularly among mid-market hyperscalers unwilling to manage multiple supplier relationships simultaneously.
optical-communication-and-networking-market-company-positioning-matrix-1789993779390

Competitive Moat and Risk Dimensions

CIENA CORPORATION

Moat: Deepest Coherent Transport Manufacturing

Ciena built dedicated high-volume coherent transport manufacturing capacity over decades of continuous telecom infrastructure investment, creating throughput capability that newer entrants cannot replicate quickly without comparable capital commitment. Large telecom carriers already qualified on Ciena systems are reluctant to requalify a new supplier mid-program. Retention among its largest carrier accounts consistently outperforms newer entrants.
CIENA CORPORATION

Risk: Slower Hyperscale Market Entry

Ciena's telecom carrier heritage carries less direct hyperscaler sales relationship depth than competitors built primarily around data center customers, which keeps it winning carrier infrastructure contracts while struggling to compete for the fastest-growing hyperscale interconnect business across every regional market. Enterprise buyers increasingly weigh this tradeoff when comparing suppliers directly.
HUAWEI TECHNOLOGIES

Moat: Rapidly Scaling Domestic Capacity

Huawei has expanded optical component manufacturing capacity faster than most competitors over the past several years, backed by substantial domestic government support that gives it capital access advantages foreign competitors operating in China cannot match on comparable terms or timelines. Retention among its largest domestic accounts consistently outperforms newer entrants.
HUAWEI TECHNOLOGIES

Risk: Restricted Access to Western Markets

Huawei's optical networking business faces continued export restrictions and security concerns in several Western markets, limiting its addressable customer base among hyperscalers and carriers required to avoid certain foreign network equipment vendors under national security regulations across multiple jurisdictions. Investors increasingly weigh this restriction risk when comparing supplier growth prospects.

Players Tracked

Prominent Players

Ciena Corporation
Infinera
Nokia
Huawei Technologies
Cisco Systems

Other Key Players

Coherent Corp
Lumentum Holdings
II-VI Incorporated
Broadcom
Marvell Technology
Innolight
Eoptolink Technology
Source Photonics
Accelink Technologies
Applied Optoelectronics
ADVA Optical Networking
Fujitsu Network Communications
ZTE Corporation
NEC Corporation
Juniper Networks

Recent Developments

MARCH 2026

Ciena Corporation acquired a smaller optical component startup to accelerate its high-density interconnect roadmap, adding manufacturing capacity that would otherwise have taken its engineering team well over a year to build natively from scratch. The deal closed for an undisclosed sum and integrates fully within two quarters.
Signal: Coherent transport vendors are increasingly buying manufacturing depth instead of slowly building it out fully internally.
SEPTEMBER 2025

Infinera expanded its production capacity with a new high-density transceiver line aimed squarely at hyperscale AI interconnect customers, a segment it had previously served only through limited-capacity legacy production lines. The expansion followed extensive customer demand signals gathered across several large accounts. Financial terms were not disclosed.
Signal: Optical suppliers are expanding high-density capacity to meet growing hyperscaler demand across every major world region.
MAY 2025

Nokia signed a multi-year supply agreement with a major hyperscale cloud provider to serve as its preferred optical transceiver vendor across twelve data center regions worldwide, formalizing a relationship that previously existed only informally between the two companies for several years beforehand. Financial terms remain undisclosed publicly.
Signal: Hyperscale cloud providers are formalizing preferred vendor arrangements to standardize interconnect quality fleet-wide entirely and now.

Optical Component and Talent Cost Exposure

Laser and photodiode optical components typically represent roughly 36% of a transceiver supplier's production cost, since achieving reliable high-speed signal transmission demands considerably more precision manufacturing than standard electronic components ever required. Skilled photonics engineers capable of designing and validating optical modules are the second largest input, sourced primarily from North American and East Asian labor markets.
A major optical component supplier's 2025 laser fabrication capacity shortage, documented in the company's annual report, forced several smaller transceiver manufacturers to delay production by roughly two months, temporarily slowing shipment schedules for affected hyperscaler programs. Larger manufacturers with pre-negotiated volume contracts largely avoided the disruption entirely, widening the competitive gap. The episode pushed several affected manufacturers to diversify component sourcing across additional suppliers going forward.

Smaller transceiver manufacturers without volume purchasing power face materially higher per-unit component costs than the largest three manufacturers, a disadvantage that compounds over time as scale advantages widen with each product generation. Manufacturers headquartered in regions with larger photonics talent pools, including the United States and Taiwan, hold a durable talent advantage over competitors based primarily in regions where combined optical and semiconductor expertise remains genuinely scarce.
optical-communication-and-networking-market-cost-volatility-analysis-1789993779587

Diversified Multi-Supplier Component Sourcing Agreements

Larger manufacturers are qualifying secondary optical component suppliers to reduce exposure to any single supplier's pricing changes or capacity constraints during periods of tight availability. This diversification adds modest qualification cost upfront but meaningfully shortens recovery time during future component shortages. These qualification programs typically span several months per additional supplier. across every affected component category.

Long-Term Volume Purchase Commitments

Manufacturers with sufficient scale are negotiating multi-year component purchase agreements that lock in favorable pricing ahead of demand spikes across the photonics supply chain. Smaller manufacturers lacking this leverage remain more exposed to spot market price swings during periods of tight component availability. These agreements typically span two to three years across major suppliers.

In-House Laser Fabrication Capability Investment

Some manufacturers are investing in in-house laser fabrication capability to reduce dependence on external suppliers for critical optical components. This investment requires meaningful upfront capital but reduces long-term exposure to third-party pricing and availability fluctuations. Manufacturers pursuing this expect payback within roughly three years of sustained volume growth. across their global manufacturing facilities entirely.

Portfolio Architecture for Margin Defence

Optical networking suppliers run distinctly different margin economics across their product tiers, with basic telecom-grade transceivers sold at competitive pricing against a growing field of Chinese entrants, while high-density AI interconnect and coherent transport tiers carry meaningfully higher gross margins that reflect real manufacturing engineering complexity rather than brand premium alone, a gap that keeps widening as hyperscale demand grows.
The tension between volume and premium tiers is intensifying as high-density interconnect requirements spread beyond the largest hyperscalers who adopted AI clusters earliest, pulling mid-market data center operators toward bandwidth capability that used to be reserved for the largest AI training deployments exclusively. Suppliers that cannot differentiate premium tiers beyond basic telecom-grade transceivers are seeing commoditization pressure spread upward through the market faster than most anticipated. That commoditization pressure is only becoming more pronounced with time.

High-value margin pools concentrate around high-density AI interconnect, coherent transport, and multi-site hyperscaler consolidation agreements, all of which combine deep engineering investment with genuine switching-cost lock-in once a data center's interconnect architecture lives permanently inside the supplier's platform. Basic telecom-grade transceivers generate steady but increasingly thin margins that continue eroding as Chinese manufacturers multiply capacity. That divergence deepens with every new product generation.

Basic telecom-grade transceivers sold to smaller carriers and less demanding network applications, priced competitively against numerous Chinese entrants with minimal switching friction for cost-conscious customers. with minimal upfront investment required.
Gross Margin

High-density AI interconnect modules, documented signal integrity certification, and coherent transport technology sold primarily to hyperscalers preparing for capacity planning reviews and AI cluster expansion. across every major deployment scale.
Gross Margin

Multi-site consolidation agreements, white-label module licensing, and emerging next-generation data rate capability aimed at customers managing evolving bandwidth demands that continue rising year over year. and downstream infrastructure needs today.
Gross Margin
optical-communication-and-networking-market-portfolio-architecture-1789993780098

High-value Sub-segments and Strategic Watch-out

Optical Transceivers and Modules

The highest-value, highest-growth segment as AI training cluster deployment accelerates across major hyperscalers, requiring manufacturing scale that legacy telecom-only production was never designed to support at this level. forcing rapid vendor re-engineering across nearly every established supplier today. globally. across every product category. today entirely.

Coherent Optical Transport Systems

High-value with more moderate growth, driven by carrier bandwidth expansion rather than new market expansion, sold primarily as a premium add-on to existing network infrastructure already committed to the platform. and its downstream network product roadmap ahead. for the foreseeable future ahead. and beyond that window.

Fiber Optic Cable Infrastructure

The volume core of the market, serving standard network buildout needs with reliable but less differentiated performance, generating steady but thinner margins than the premium transceiver tiers above it. across virtually every geography and carrier type served. worldwide right now. for every carrier type. today.

Passive Optical Network (PON) Equipment

A strategic watch-out as integrated platform vendors bundle access network capability into core subscriptions and threaten to compress standalone PON equipment margins from below, particularly among smaller carriers. to reduce total integration cost over time. over the long run for every carrier. for every equipment segment.

Interconnect Contracts as Cluster Annuities

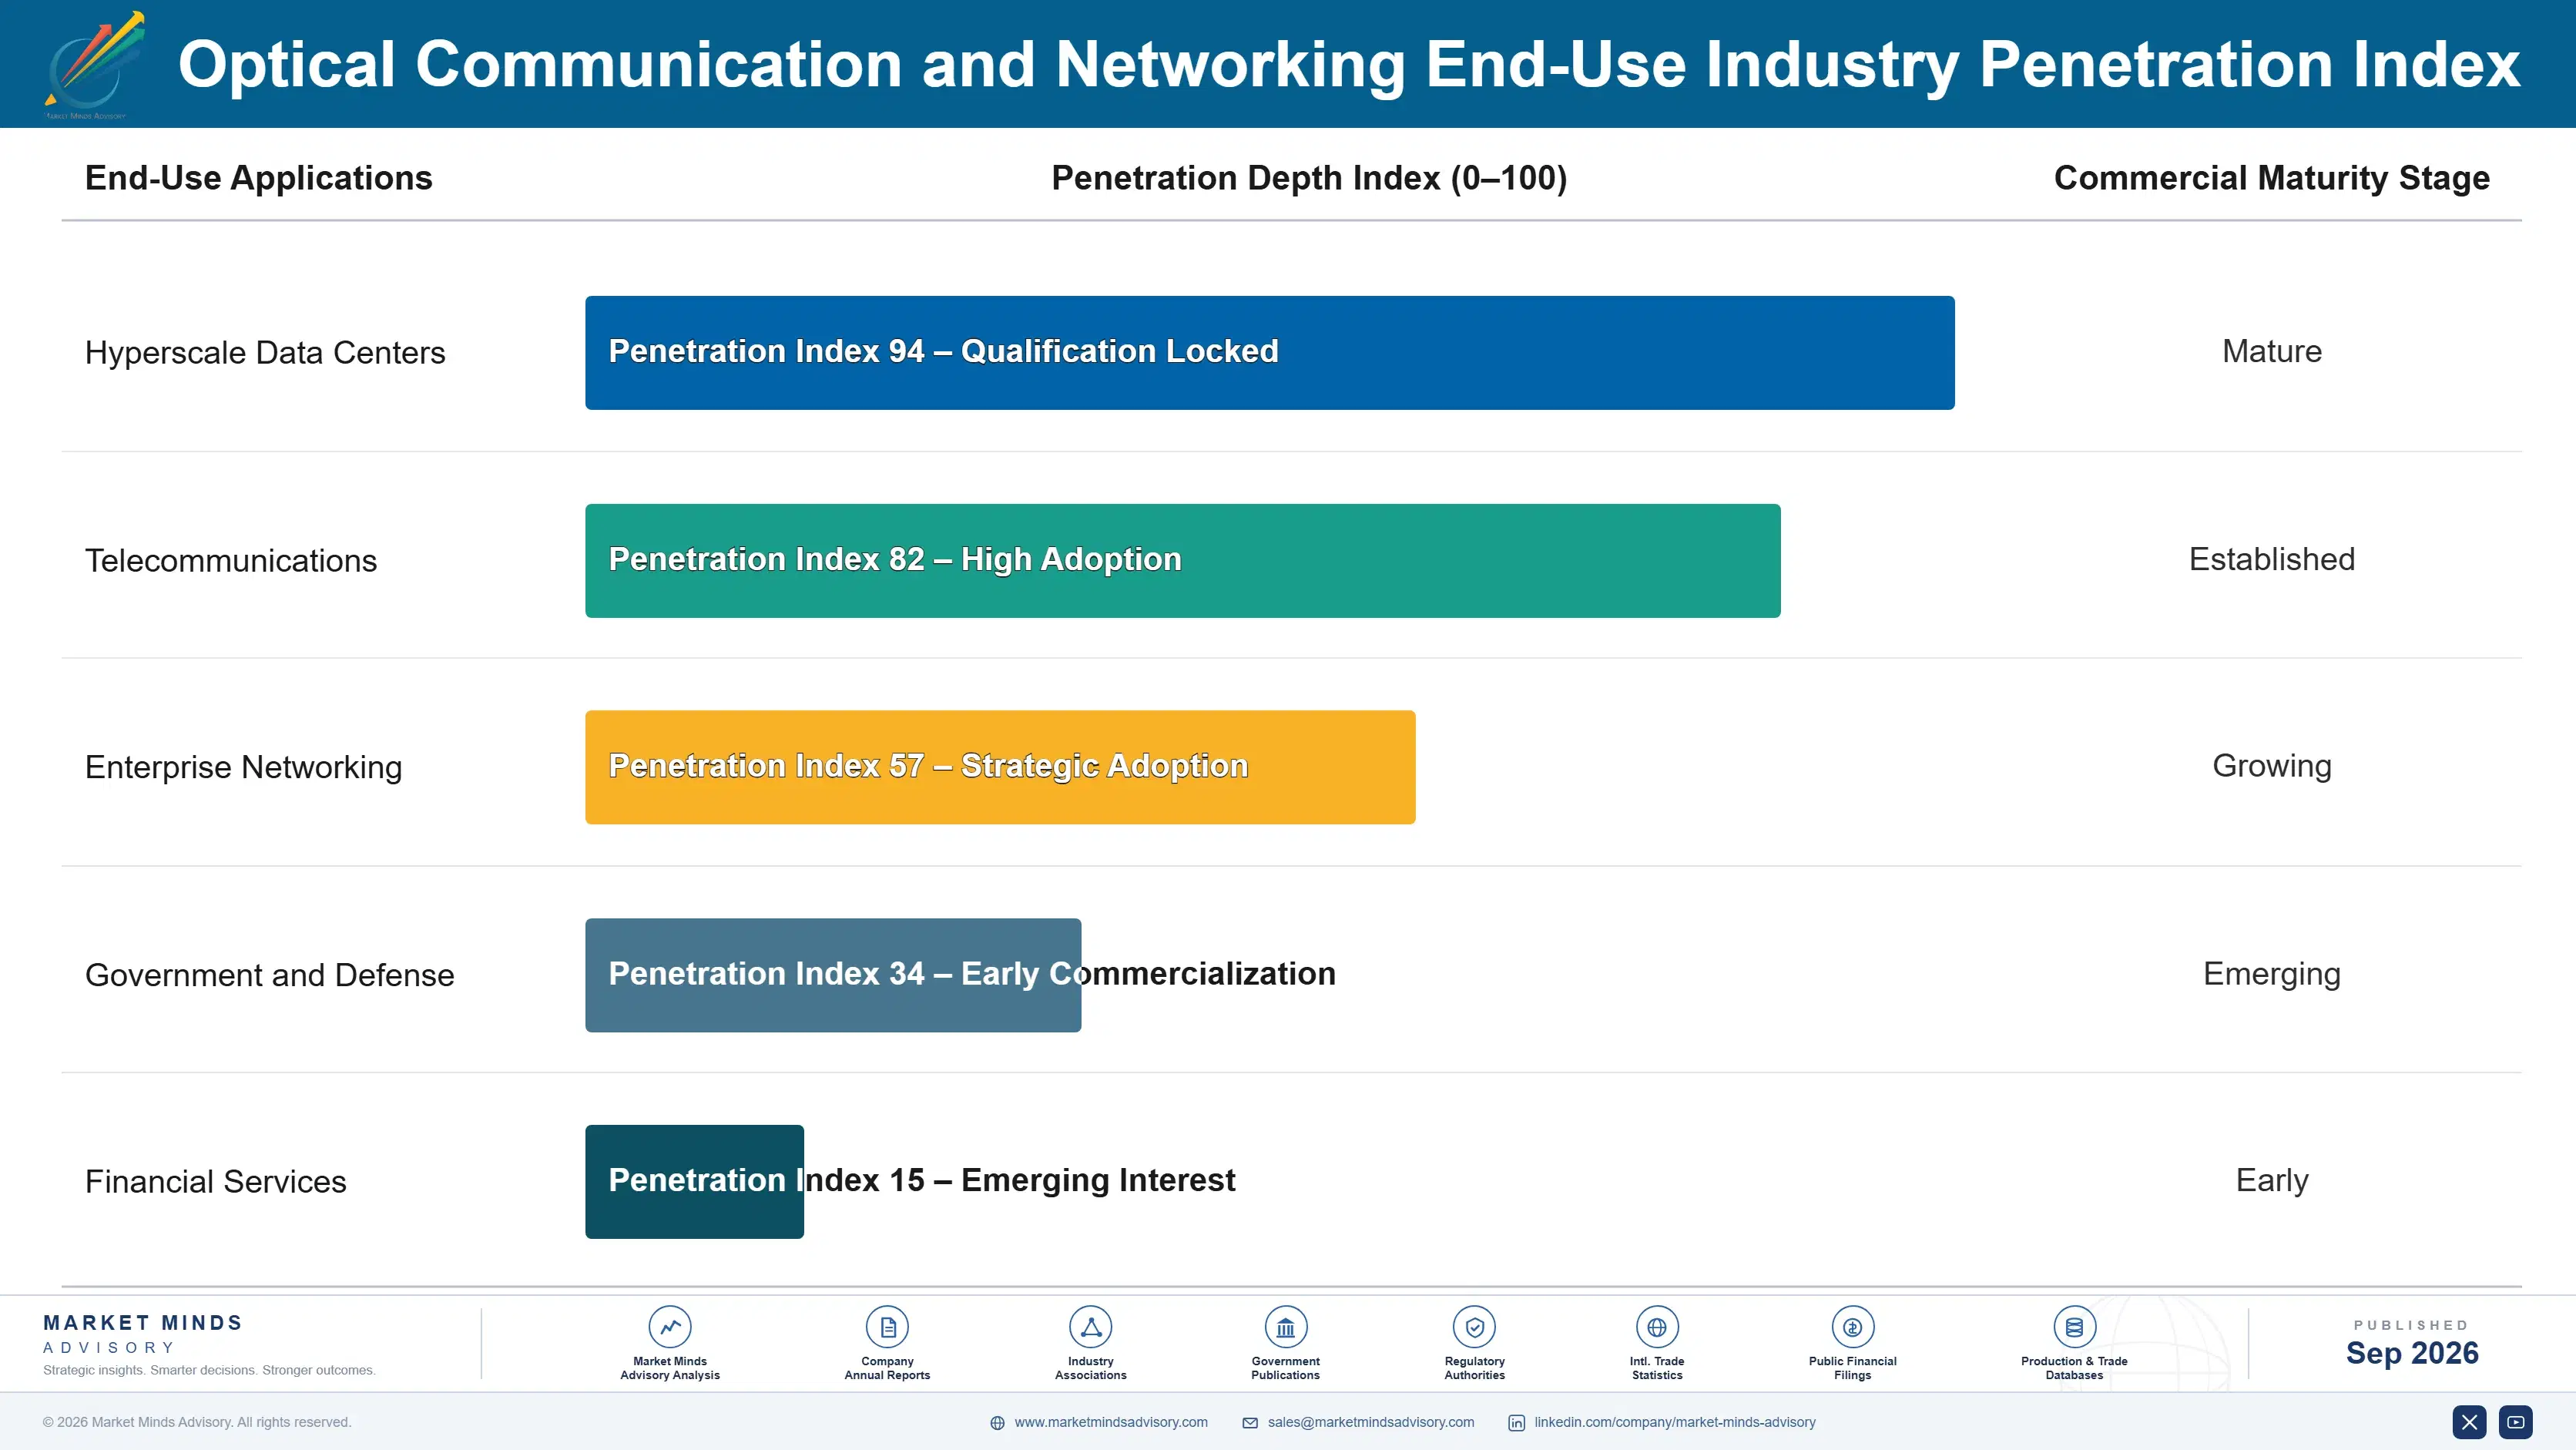
Optical networking contracts behave like annuities once a data center architecture is qualified, since a hyperscaler's cluster topology and cabling infrastructure become dependent on the supplier's transceiver specifications within months of deployment. Switching suppliers means requalifying an entirely new interconnect standard across every rack already in production, a cost that keeps gross renewal rates well above eighty-five percent across the category even when competitors offer meaningfully lower list pricing.
Adoption depth varies considerably by end-use vertical. Hyperscale AI training operators show the deepest platform dependency, since cluster performance requires consistent, high-frequency interconnect upgrades that reinforce supplier preference with each new generation. Traditional telecom carriers adopt more gradually but at higher per-contract value, where network reliability and long equipment lifecycles matter more than raw speed, giving suppliers a long runway of incremental upgrade adoption.

Buyer profiles are shifting generationally as network architects who grew up specifying copper and basic fiber connections give way to a cohort fluent in high-density optical interconnect design from the start of their careers. That newer generation evaluates optical suppliers more like AI infrastructure partners than commodity component vendors, weighing signal integrity and manufacturing scale alongside traditional cost criteria when making procurement decisions.
optical-communication-and-networking-market-end-use-penetration-index-1789993780584

Where MMA Sees the Advantage

These are among the four positions where our research anticipates prominent divergence between winners and laggards over the coming forecast period. Each is grounded in the demand model, the regulatory perimeter, and the announced capacity pipeline.
01 / HIGH-DENSITY MANUFACTURING SCALE

Build hyperscale production capacity before demand outpaces supply

Suppliers that invest early in high-volume transceiver manufacturing capacity hold a durable edge as AI training cluster deployment accelerates simultaneously across nearly every major hyperscaler today and going forward. This capability is genuinely difficult to build quickly, which is exactly why suppliers without it are losing hyperscaler contracts to specialists with proven production throughput today. MMA expects this gap to widen considerably further before it narrows, rewarding suppliers willing to invest in capacity now rather than waiting until it becomes urgent later.
02 / SIGNAL INTEGRITY CERTIFICATION

Bundle documented signal integrity data as a premium tier

Hyperscalers preparing for capacity planning reviews pay considerably more for suppliers that provide documented signal integrity data than for suppliers offering basic transceivers without validation testing, and that gap is only growing wider with each passing budget cycle. That willingness to pay is not yet fully priced into most suppliers' current pricing structures across the category today. Real margin is being left on the table for any supplier willing to formalize this documentation into a distinct, clearly marketed service tier.
03 / MULTI-SITE HYPERSCALER EXPANSION

Target hyperscalers seeking a single consolidated supplier

Large hyperscalers running data centers across dozens of sites represent the highest-value expansion opportunity in the category, since few competitors have built genuinely convincing cross-site consistency at truly meaningful scale today across every region they serve. This complexity is exactly why multi-site consolidation agreements command considerably higher contract values than single-site arrangements ever could realistically achieve. MMA sees this segment as considerably underserved relative to its genuine commercial value, and expects competition here to intensify quite markedly across every account.
04 / CHINESE MANUFACTURER ENCROACHMENT RISK

Watch Chinese manufacturers scale into premium categories

Chinese optical component manufacturers extending into premium high-density interconnect categories pose the clearest competitive threat to established Western suppliers over the next several years, particularly among hyperscalers genuinely unwilling to depend on a single geographic supplier base at meaningful scale today. Incumbent suppliers that fail to differentiate meaningfully beyond basic manufacturing capability risk losing exactly the accounts that fund their growth today and well into tomorrow. MMA expects this competitive pressure to intensify rather than fade anytime soon at all.

Engagement Snapshot From the Field

A live engagement with an industry participant carrying material or product regulatory and market exposure ahead of a defining policy shift, showing how our research translates into a defensible multi-year portfolio strategy.
MARKET MINDS ADVISORY · CLIENT ENGAGEMENT SUMMARY
Optical Communication and Networking Producer Strategic Portfolio Review and Transition Roadmap 2026·Investment Scenario on Optical Communication and Networking Exposure Evaluation 2025-26
CLIENT PROFILE
The client is a mid-size cloud infrastructure provider building its first dedicated AI training cluster, having previously relied entirely on standard telecom-grade transceivers for conventional enterprise cloud workloads. Engineering leadership had no prior experience evaluating high-density interconnect vendors and faced a fixed cluster launch date tied to a major customer contract that could not be delayed without significant financial penalty.
STRATEGIC CHALLENGE
Engineering leadership needed to select a high-density interconnect vendor capable of meeting AI cluster bandwidth requirements within a compressed timeline without deep internal photonics expertise to evaluate competing signal integrity claims independently. A wrong choice risked delaying cluster deployment and the associated customer contract by months. Board members were also concerned about the financial exposure from missing the committed launch schedule entirely.
MMA APPROACH
MMA analysts benchmarked five leading optical transceiver vendors against a consistent commercially relevant basis covering documented signal integrity data, manufacturing capacity, and integration timeline for comparable AI cluster deployments. Analysts also interviewed reference cloud providers directly to validate vendor marketing claims independently before finalizing a recommendation. This cross-referencing surfaced meaningful discrepancies between vendor-reported manufacturing capacity and what comparable providers had actually experienced.
KEY FINDINGS
  1. Only two of the five evaluated vendors had a verified manufacturing capacity that was sufficient to meet the client's required cluster deployment timeline.
  2. Signal integrity data varied enormously across vendors, with the strongest candidate offering documented error rates consistently well below broader industry averages. overall.
  3. Vendor pricing models diverged sharply between flat per-unit pricing and tiered volume discount structures, with volume discounts proving more cost-effective at the client's target scale.
  4. Two vendors lacked prior experience with the client's specific rack architecture, requiring considerable additional integration testing before either could be approved. promptly.
CLIENT PROFILE
The client is a mid-size cloud infrastructure provider building its first dedicated AI training cluster, having previously relied entirely on standard telecom-grade transceivers for conventional enterprise cloud workloads. Engineering leadership had no prior experience evaluating high-density interconnect vendors and faced a fixed cluster launch date tied to a major customer contract that could not be delayed without significant financial penalty.
STRATEGIC CHALLENGE
Engineering leadership needed to select a high-density interconnect vendor capable of meeting AI cluster bandwidth requirements within a compressed timeline without deep internal photonics expertise to evaluate competing signal integrity claims independently. A wrong choice risked delaying cluster deployment and the associated customer contract by months. Board members were also concerned about the financial exposure from missing the committed launch schedule entirely.
MMA APPROACH
MMA analysts benchmarked five leading optical transceiver vendors against a consistent commercially relevant basis covering documented signal integrity data, manufacturing capacity, and integration timeline for comparable AI cluster deployments. Analysts also interviewed reference cloud providers directly to validate vendor marketing claims independently before finalizing a recommendation. This cross-referencing surfaced meaningful discrepancies between vendor-reported manufacturing capacity and what comparable providers had actually experienced.
KEY FINDINGS
  1. Only two of the five evaluated vendors had a verified manufacturing capacity that was sufficient to meet the client's required cluster deployment timeline.
  2. Signal integrity data varied enormously across vendors, with the strongest candidate offering documented error rates consistently well below broader industry averages. overall.
  3. Vendor pricing models diverged sharply between flat per-unit pricing and tiered volume discount structures, with volume discounts proving more cost-effective at the client's target scale.
  4. Two vendors lacked prior experience with the client's specific rack architecture, requiring considerable additional integration testing before either could be approved. promptly.
RECOMMENDED STRATEGY
Phase 1: Select the vendor with the strongest verified manufacturing capacity and negotiate a tiered volume discount pricing structure immediately going forward. Phase 2: Begin integration testing immediately on a pilot rack cluster before committing to the full data center-wide rollout that was originally planned. Phase 3: Require weekly production status reporting through the manufacturing process to catch delays before they affect the planned launch date entirely.
OUTCOME
The provider selected its preferred vendor and completed cluster deployment within the required timeline, launching its AI training capacity on schedule with the major customer contract intact. Leadership credited the independent vendor comparison with avoiding a costly delay that would have triggered contract penalties (client-reported, unverified by MMA).

Frequently Asked Questions

Foundational context covering the market sizes, CAGR, scope, country, region and competition that inform every finding below. This section is provided to cover basics and most often pre-purchase conversations, answered from the MMA Primary Research Dataset.

What is the current size of the Optical Communication and Networking Market?

The Optical Communication and Networking Market reached approximately $22.5 billion in 2025. This figure covers optical transceivers, fiber optic cabling, and switching equipment for telecom and data center applications.

How large will the Optical Communication and Networking Market be by 2036?

MMA projects the market will reach approximately $61.67 billion by 2036 under the base case scenario. That represents roughly two and a half times its 2026 starting value over the forecast period.

What is the CAGR for the Optical Communication and Networking Market 2026 to 2036?

The base case CAGR is 9.6% across the 2026 to 2036 forecast period. Bull and bear scenarios range from roughly 8.4% to 10.8% depending on AI data center buildout pace.

Which segment is growing fastest?

Optical Transceivers and Modules is growing fastest at a 15.8% CAGR, roughly 1.65 times the overall market rate. Demand is concentrated among hyperscale operators deploying AI training clusters.

Who are the major companies in the Optical Communication and Networking Market?

Ciena Corporation, Infinera, Nokia, Huawei Technologies, and Cisco Systems are the five leading suppliers evaluated on shipped transceiver volume. The top five hold roughly 54% combined share.

Which country is growing fastest?

India is growing fastest at a 12.6% CAGR, driven by its rapidly expanding telecom infrastructure investment under national digital economy initiatives across the entire country.

Report Segmentation Architecture

The full report scope spans multiple orthogonal segmentation dimensions, with cross-tabulated demand data provided for each dimension pair. Coverage extends further to regional breakdowns, trend trajectories, and the competitive detail needed to support segment-level decision-making.

By Primary Market Dimension

  • Optical Transceivers and Modules
  • Fiber Optic Cable Infrastructure
  • Optical Switching and Routing Equipment
  • Coherent Optical Transport Systems
  • Passive Optical Network (PON) Equipment
  • Optical Network Management Software

By End-Use Industry

  • Hyperscale Data Centers
  • Telecommunications
  • Enterprise Networking
  • Government and Defense
  • Financial Services

By Commercial Dimension

  • Hyperscale Cloud Operators
  • Telecom Carriers
  • Direct Sales Channel
  • System Integrator Channel

By Region

  • North America
  • Western Europe
  • East Asia
  • South Asia and Pacific
  • Latin America
  • Middle East and Africa
  • Eastern Europe

Scope, Methodology, and Coverage

Every figure in this report is reproducible from documented input assumptions. The scope below maps the historical period, the forecast horizon, the segmentation dimensions, and the countries covered, alongside the underlying primary and qualitative methodology.
Historical Period
2020 to 2025
Forecast Period
2026 to 2036
Base Year
2025 (USD billions; MMA Primary Research Dataset, September 2026)
Market Definition
This report defines the Optical Communication and Networking Market as optical transceivers, fiber optic cabling, and switching equipment that transmit data using light signals for telecom and data center applications. It excludes copper-based networking equipment and wireless radio frequency communication systems.
Quantitative Units
USD billions, percentage CAGR
Segmentation Dimensions
By Primary Market Dimension, By End-Use Industry, By Commercial Dimension, By Region
Regions Covered
North America, Western Europe, East Asia, South Asia and Pacific, Latin America, Middle East and Africa, Eastern Europe
Countries Covered
United States, Canada, Germany, United Kingdom, France, China, Japan, South Korea, India, Australia, Brazil, Mexico, Saudi Arabia, United Arab Emirates, South Africa, Poland
Key Companies Profiled
Ciena Corporation, Infinera, Nokia, Huawei Technologies, Cisco Systems, and 15 additional named competitors
Quantitative Methodology
Primary survey, n=3,800 respondents, Q4 2025, six countries; demand-side model with trade association cross-validation
Qualitative Methodology
47 expert interviews, Q4 2025; applied to validate demand model assumptions, identify emerging dynamics, and assess competitive positioning
Report Format
PDF and XLSX data workbook (Word format preview document)
Publisher
Market Minds Advisory
Report Code
MMA-2026-TEC-249
Published
September 2026
Contact
sales@marketmindsadvisory.com | www.marketmindsadvisory.com

Purchase the full Optical Communication and Networking Market Report (2026 to 2036).

This report provides a comprehensive analysis of the global Optical Communication and Networking Market through 2036, covering market sizing and segmentation trends. It maps regional demand patterns across all seven major world regions and examines competitive dynamics among leading optical networking suppliers. The analysis also covers input cost exposure and revenue diversification strategies available to market participants. It draws on primary survey data from 3,800 respondents and 47 expert interviews conducted in the fourth quarter of 2025. Readers gain a structured view of where AI interconnect adoption is heading and which commercial strategies are working.
Detailed market sizing and ten-year forecast
Segment-level growth and market share analysis
Regional demand and competitive intensity mapping
Profiles of twenty leading optical networking suppliers
Revenue diversification and pricing strategy insights
Primary survey and expert interview data

Built For The People Who Decide

From boardroom strategy to bench-side execution, this report is read cover-to-cover by leaders shaping the next decade of their industry, turning demand scenarios, market dynamics and valuation benchmarks into decisions.
CXOs/ Presidents/ VPs/ Managers
M&A and Corporate Development
Strategy Teams and R&D Heads
Procurement and Product Directors
Regulatory and Compliance Leaders
Investor Relations and Equity Analysts