Market Minds Advisory
Open Cycle Aeroderivative Gas Turbine Market

Open Cycle Aeroderivative Gas Turbine Market: Open Cycle Aeroderivative Gas Turbine Market: Nine Minutes Is The Product

Nine minutes to full load is the whole product. Everything else about these machines is a compromise accepted to get there, including the price per kilowatt that everybody complains about.

Lead Analyst

Published

September 2026

Make Smarter Decisions with Customized Research Insights

Request a free sample report and evaluate market opportunities, growth trends, and competitive dynamics relevant to your business needs.

2025 MARKET VALUE$6.4BMarket Size 2025
2036 FORECAST VALUE$14.9BBase Case , 2026 to 2036
CAGR 2026 TO 20368.0 %Bull 9.2% / Bear 6.8%
INCREMENTAL OPPORTUNITY$8.0BNet 10- year value creation
EXPANSION MULTIPLE2.16x2036 value over 2026 base
Strategic Levers
M&A Pipeline
Regional Outlook
Country Rankings
Competitive Intelligence
Segmental Deep-dive
Call-Us : 91 93563 13602

Executive Snapshot and Market Trajectory.

These machines cost 1.7 times a heavy duty frame per kilowatt and nobody buying one cares. They reach full load in nine minutes against thirty for the alternative, and on a grid where the evening ramp arrives on a schedule that gap is the entire commercial argument.
The above 70 megawatt high-efficiency class grows at 12.0%, half again the market rate of 8.0%, because reaching 44% efficiency in simple cycle removes the usual reason for adding a steam bottoming cycle nobody has time to start. Middle East and Africa holds 26% of demand, far outside its usual band, on liquefaction mechanical drive, Gulf peaking capacity and mobile emergency power across the continent. Three unrelated applications happen to sit in one region.
Concentration is extreme at 78% of ordered megawatts, because building a gas generator derived from a jet engine requires an aero engine business behind it and there are very few of those. The maintenance model matters as much as the machine: the core is swapped in three days and overhauled at a depot, which turns a multi-week outage into a logistics problem. Availability is sold as much as output.
Market Definition
The open cycle aeroderivative gas turbine market covers gas turbines derived from aircraft engine cores operating without a steam bottoming cycle, supplied for power generation and mechanical drive duty, spanning sub-fifteen megawatt units, fifteen to forty megawatt units, forty to seventy megawatt units, above seventy megawatt high-efficiency units, mechanical drive configurations, and mobile trailer-mounted packages. Scope is measured as ordered megawatt value including the packaged unit and initial installation. Excluded are heavy duty frame gas turbines, combined cycle plant including steam turbines and heat recovery equipment, aircraft propulsion engines, marine propulsion turbines, and long-term service agreements sold separately.
Base Year Value
$6.4B in 2025 (MMA Primary Research Dataset, September 2026)
Forecast Period
2026 to 2036, eleven discrete annual values
CAGR
8.0% base case. Bull 9.2%. Bear 6.8%.
Fastest Growth Segment
Above Seventy Megawatt High-Efficiency Class: 12.0% CAGR
Fastest Growth Country
India: 10.2% CAGR
Fastest Growth Region
South Asia and Pacific: 10.2% CAGR
Largest Region
Middle East and Africa: 26% of 2025 global value
Market Leaders
GE Vernova, Siemens Energy, Baker Hughes, Mitsubishi Power Aero and Kawasaki Heavy Industries. Source: MMA Analysis, July 2026.
Primary Survey
n=3,800 procurement and R&D decision-makers, Q4 2025, six countries
Methodology
Demand-side build-up, cross-validated against public data, 47 expert interviews

Open Cycle Aeroderivative Gas Turbine Market Forecast Scenarios

open-cycle-aeroderivative-gas-turbine-market-size-forecast-scenario-1788255502538
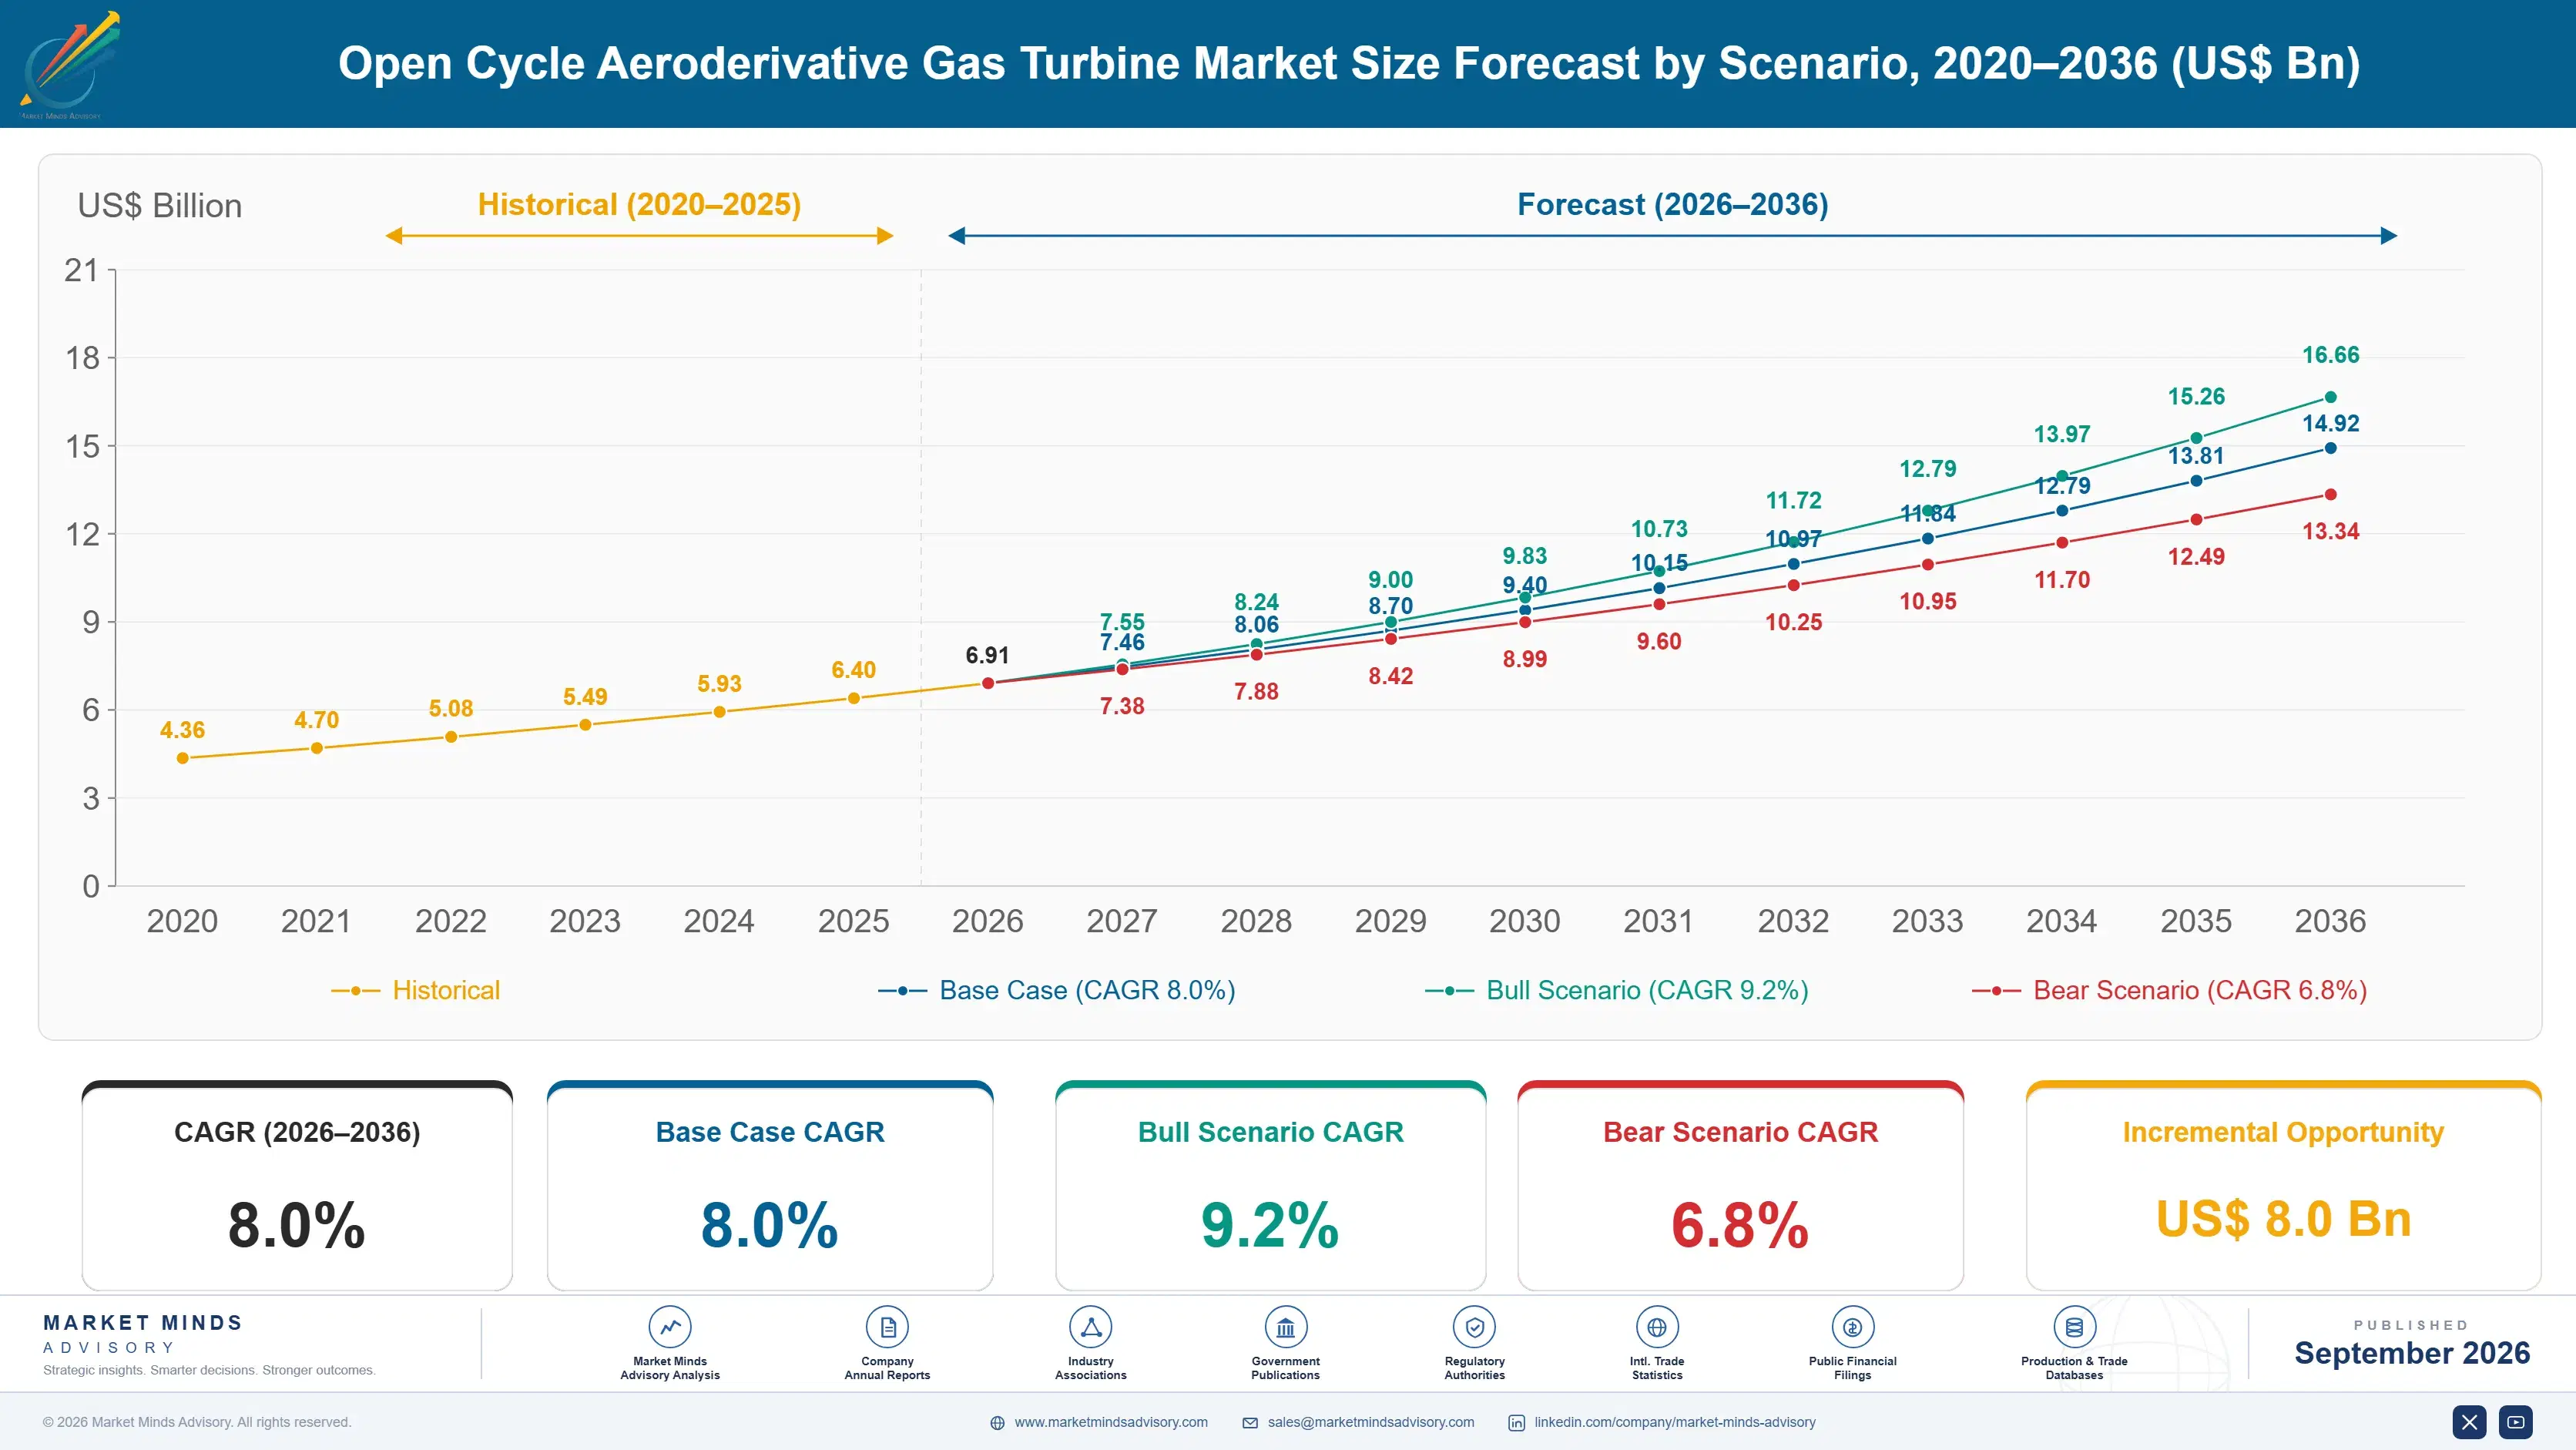
Between 2020 and 2025 orders compounded at 6.6% and the composition changed more than the total did. Baseload and mid-merit gas ordering fell away as renewables displaced running hours, while peaking and grid support demand rose in every market where variable generation reached meaningful penetration. Mechanical drive orders followed liquefaction investment decisions rather than any power market logic at all.
The 8.0% base case rests on three mechanisms. Renewable penetration keeps creating evening ramps that require capacity reaching full load in minutes rather than in half an hour, and that requirement is arriving in more grids each year. Liquefaction capacity under construction commits mechanical drive orders years ahead. And African and Middle Eastern mobile power demand continues where grid capacity has not kept pace with load. None of the three depends on gas prices being low.
The bull case at 9.2% turns on capacity markets pricing fast start explicitly rather than treating all dispatchable megawatts alike, which would reprice these machines against the frame alternatives they compete with. The bear case at 6.8% is storage: batteries beat a turbine comprehensively on the first hour of any ramp, and every duration extension in battery economics moves the crossover point further out.

Start Time Beats Efficiency

A buyer comparing capital cost per kilowatt will never order one of these. They run 1.7 times the cost of an equivalent frame machine and cost more per running hour to maintain. What they do is reach full output in nine minutes from standby, and where the evening ramp is a daily event, arriving in time beats arriving cheaply. Procurement evaluations rarely capture that at all.
TOP FIVE CONCENTRATION78%Share of ordered megawatts held by five manufacturers
START TO FULL LOAD9 minutesTime from cold standby to rated output delivery
SIMPLE CYCLE EFFICIENCY44%Fuel converted to electricity without any bottoming cycle
CORE SWAP TIME3 daysOutage duration when the core is exchanged rather than overhauled
CAPITAL COST PREMIUM1.7 timesCost per kilowatt against a comparable heavy duty machine
ANNUAL OPERATING HOURS1,100 hoursTypical running time for a peaking installation each year
Efficiency in simple cycle used to be the compromise and it largely is not any more. High-efficiency machines reach around 44% with no steam cycle behind them, available in minutes rather than hours. That removes any reason a peaking asset would carry a bottoming cycle, since a steam turbine cannot start on the timescale this duty requires. That was the last technical argument against them.
The maintenance model is a genuine part of the product and it is rarely described that way. The gas generator lifts out and is replaced in about three days from a lease pool while the removed core goes to a depot, which converts a multi-week in-situ outage into logistics. Operators buying peaking capacity are buying availability rather than megawatt hours. Almost nobody sells the product that way.
"Every procurement evaluation I see still leads with dollars per kilowatt and every operator who has lived through a summer ramp knows that is the wrong number. What you are buying is being at full load before the price spikes, and there is no other machine that does it."
Director, Power Generation Equipment Practice · MMA Energy Practice · September 2026

Market Trends

Renewable ramps made start time a procurement criterion

Grids with substantial solar penetration face an evening ramp arriving on a predictable daily schedule at a rate that heavy duty machines taking half an hour to reach load simply cannot follow, and system operators have begun specifying start capability rather than treating dispatchable megawatts as interchangeable. A machine at full output in nine minutes captures pricing that a slower unit misses entirely. That reframing is worth more to these manufacturers than any efficiency improvement, and it is arriving in more markets each year as variable generation shares rise. Rules move this market.
Market Impact: Swaps a core in 3 days
Simple cycle efficiency removed the bottoming cycle argument

High-efficiency aeroderivative machines now convert around 44% of fuel to electricity without any steam cycle, which approaches what combined cycle plant delivers overall while remaining available in minutes rather than hours. For peaking and grid support duty a steam bottoming cycle was never usable anyway, because it cannot start on the timescale the application requires. That closes the efficiency gap that once justified heavier and slower plant. The above seventy megawatt class grows at 12.0% against a market rate of 8.0% on precisely that logic. The compromise that defined these machines has quietly gone.
Market Impact: Drives 26% of regional demand

Market Opportunities and Growth Drivers

Core exchange converts outages into logistics

The gas generator can be lifted out and replaced from a lease pool in around three days while the removed core travels to a depot for overhaul, which turns what would be a multi-week in-situ outage on a frame machine into a scheduled exchange. Availability follows directly, and for peaking capacity that runs perhaps 1,100 hours a year the ability to be ready when required matters far more than the total. Operators are effectively buying an availability guarantee, and the machine architecture is what makes that guarantee possible. Availability is the product.
Market Impact: Loses below 1 hour duration

Liquefaction mechanical drive orders arrive in blocks

Gas liquefaction trains use aeroderivative machines to drive refrigerant compressors, where power density, part-load flexibility and maintainability all matter more than they do in a fixed power station. Those orders arrive as blocks committed years ahead when a liquefaction project reaches financial close, which makes them visible and lumpy rather than incremental. Middle East and Africa takes 26% of category demand substantially on this basis alongside peaking. The application has nothing to do with electricity markets and it moves on a completely separate cycle. Nobody selling into utilities sees that pipeline at all.
Market Impact: Costs 1.7 times a frame machine

Market Restraints and Challenges

Batteries win the first hour comprehensively

Battery storage responds in milliseconds against nine minutes, requires no fuel, no emissions permit and no water, and it beats an aeroderivative on any duty measured in the first hour of a ramp without argument. The root cause is that the two technologies are genuinely different products competing for the same procurement line, and one is better at short duration. Commercial impact is a shrinking application window as battery duration economics improve. Participants are responding by emphasising sustained output, fuel flexibility, hybrid configurations pairing both technologies, and duties measured in hours rather than minutes.
Market Impact: Reaches full load in 9 minutes

Capital cost is genuinely higher and buyers notice

These machines cost around 1.7 times a comparable heavy duty frame per kilowatt, and procurement processes evaluating capital cost per installed megawatt reach the wrong conclusion in every case where the buyer has not been through a capacity event. The root cause is that aero derived hardware carries aerospace manufacturing costs into an industrial application. Commercial impact is losing evaluations to slower machines that will not meet the duty. Mitigation runs through lifetime cost modelling, availability guarantees, capacity market revenue analysis and demonstrating what a missed ramp actually costs an operator.
Market Impact: Achieves 44% without steam cycle
3 additional market trends, 4 additional growth drivers, and 2 additional restraints and challenges are covered in the full report. Contact sales@marketmindsadvisory.com to access the complete intelligence.

Segment CAGR and Growth Architecture

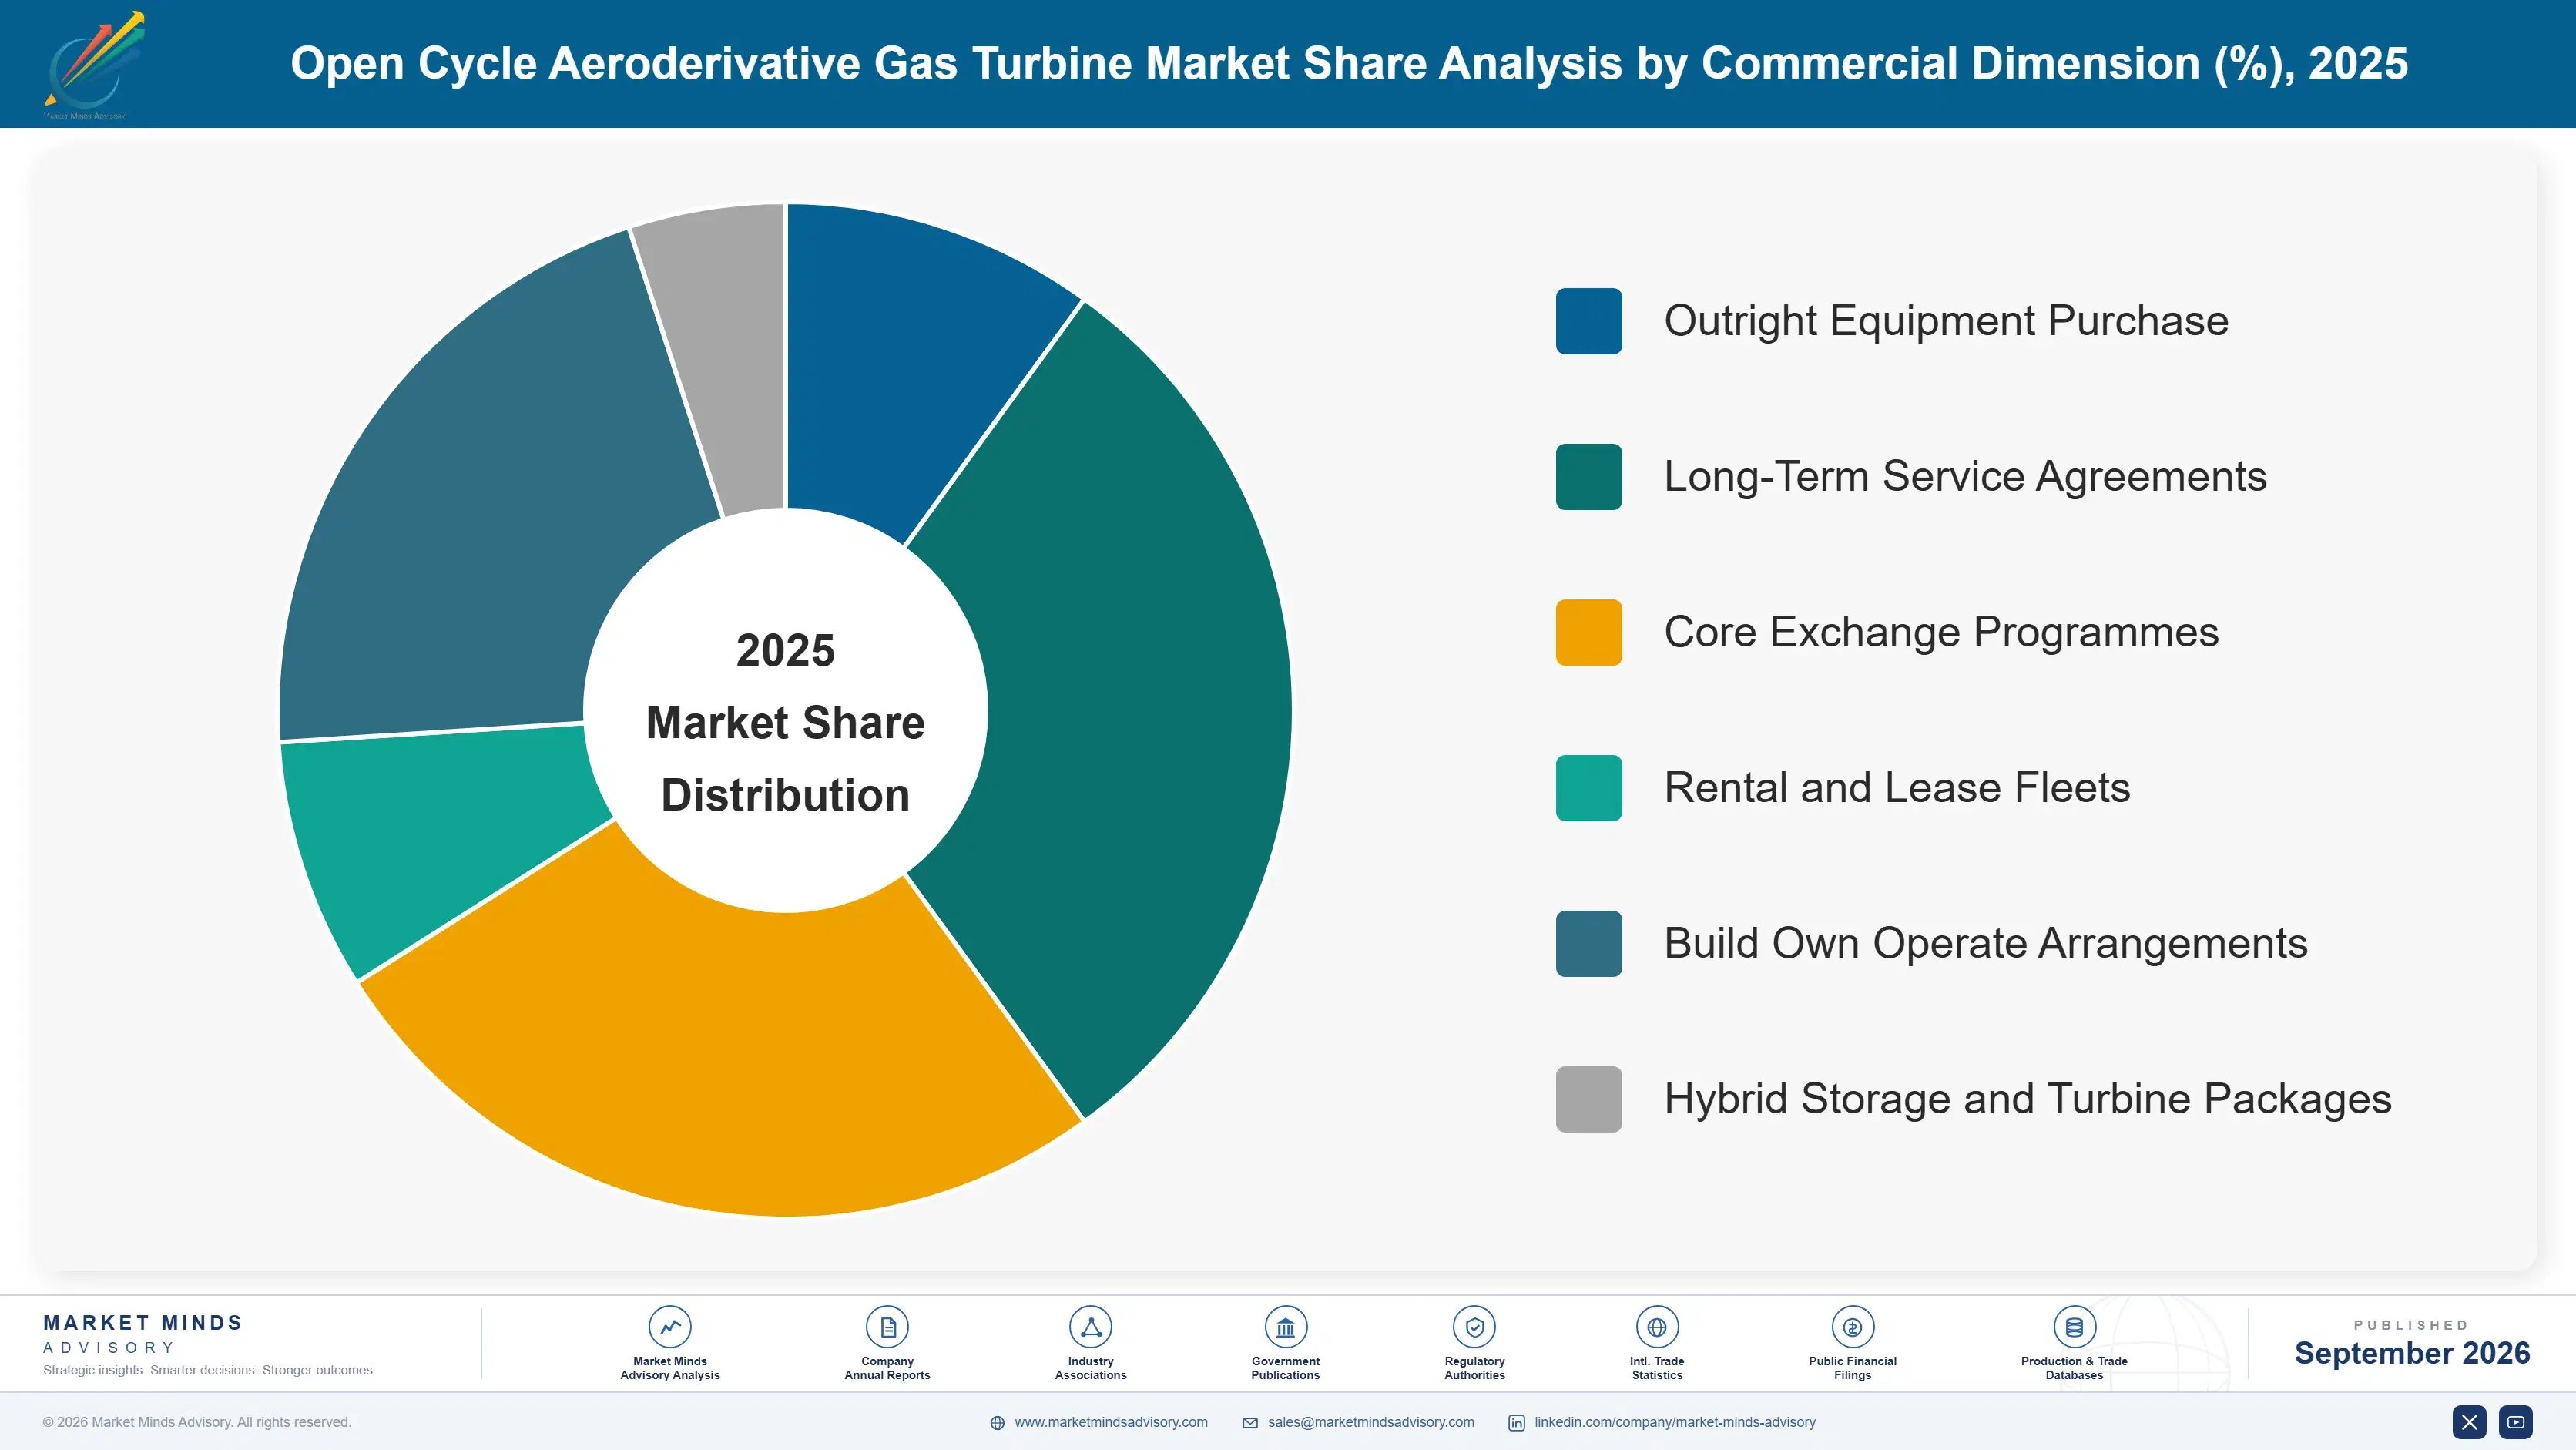
Segmentation follows output class, the dimension on which application, efficiency and unit economics all move together. The smaller classes carry industrial, offshore and distributed duty at modest volumes. The large high-efficiency class and mobile packages carry the growth, because one answers grid ramps and the other answers capacity that has to arrive somewhere quickly.
open-cycle-aeroderivative-gas-turbine-market-market-share-analysis-1788255503093

Above Seventy Megawatt High-Efficiency Class

The above seventy megawatt high-efficiency class grows at 12.0%, half again the market rate of 8.0%, and it exists because two requirements that used to conflict stopped conflicting. Reaching around 44% efficiency in simple cycle means a peaking asset no longer sacrifices fuel economy for start capability, and a steam bottoming cycle was never usable on this duty because it cannot start inside the window the application demands. These are the machines system operators specify when they write start time into a capacity procurement rather than treating dispatchable megawatts as interchangeable. Unit prices are high and the buyers are utilities and independent producers evaluating against capacity revenue rather than against fuel cost.
CAGR 12.0%

Mobile and Trailer-Mounted Packages

Mobile and trailer-mounted packages at 10.2% serve a completely different buyer from everything else in this category, which is somebody who needs power at a location within weeks rather than capacity in a market within years. Emergency grid support, mining and industrial sites awaiting connection, disaster response and interim capacity during plant outages all buy on availability and deployment speed with capital cost barely entering the discussion. African and Middle Eastern demand dominates, frequently through rental fleets rather than outright purchase. Fuel flexibility matters disproportionately here, because a unit deployed at short notice takes whatever fuel the site can actually supply it with. Deployment speed rather than efficiency decides every one of these sales.
CAGR 10.2%
Full segment breakdown across 6 segments available in the complete report.

Regional Architecture and Country Demand Map

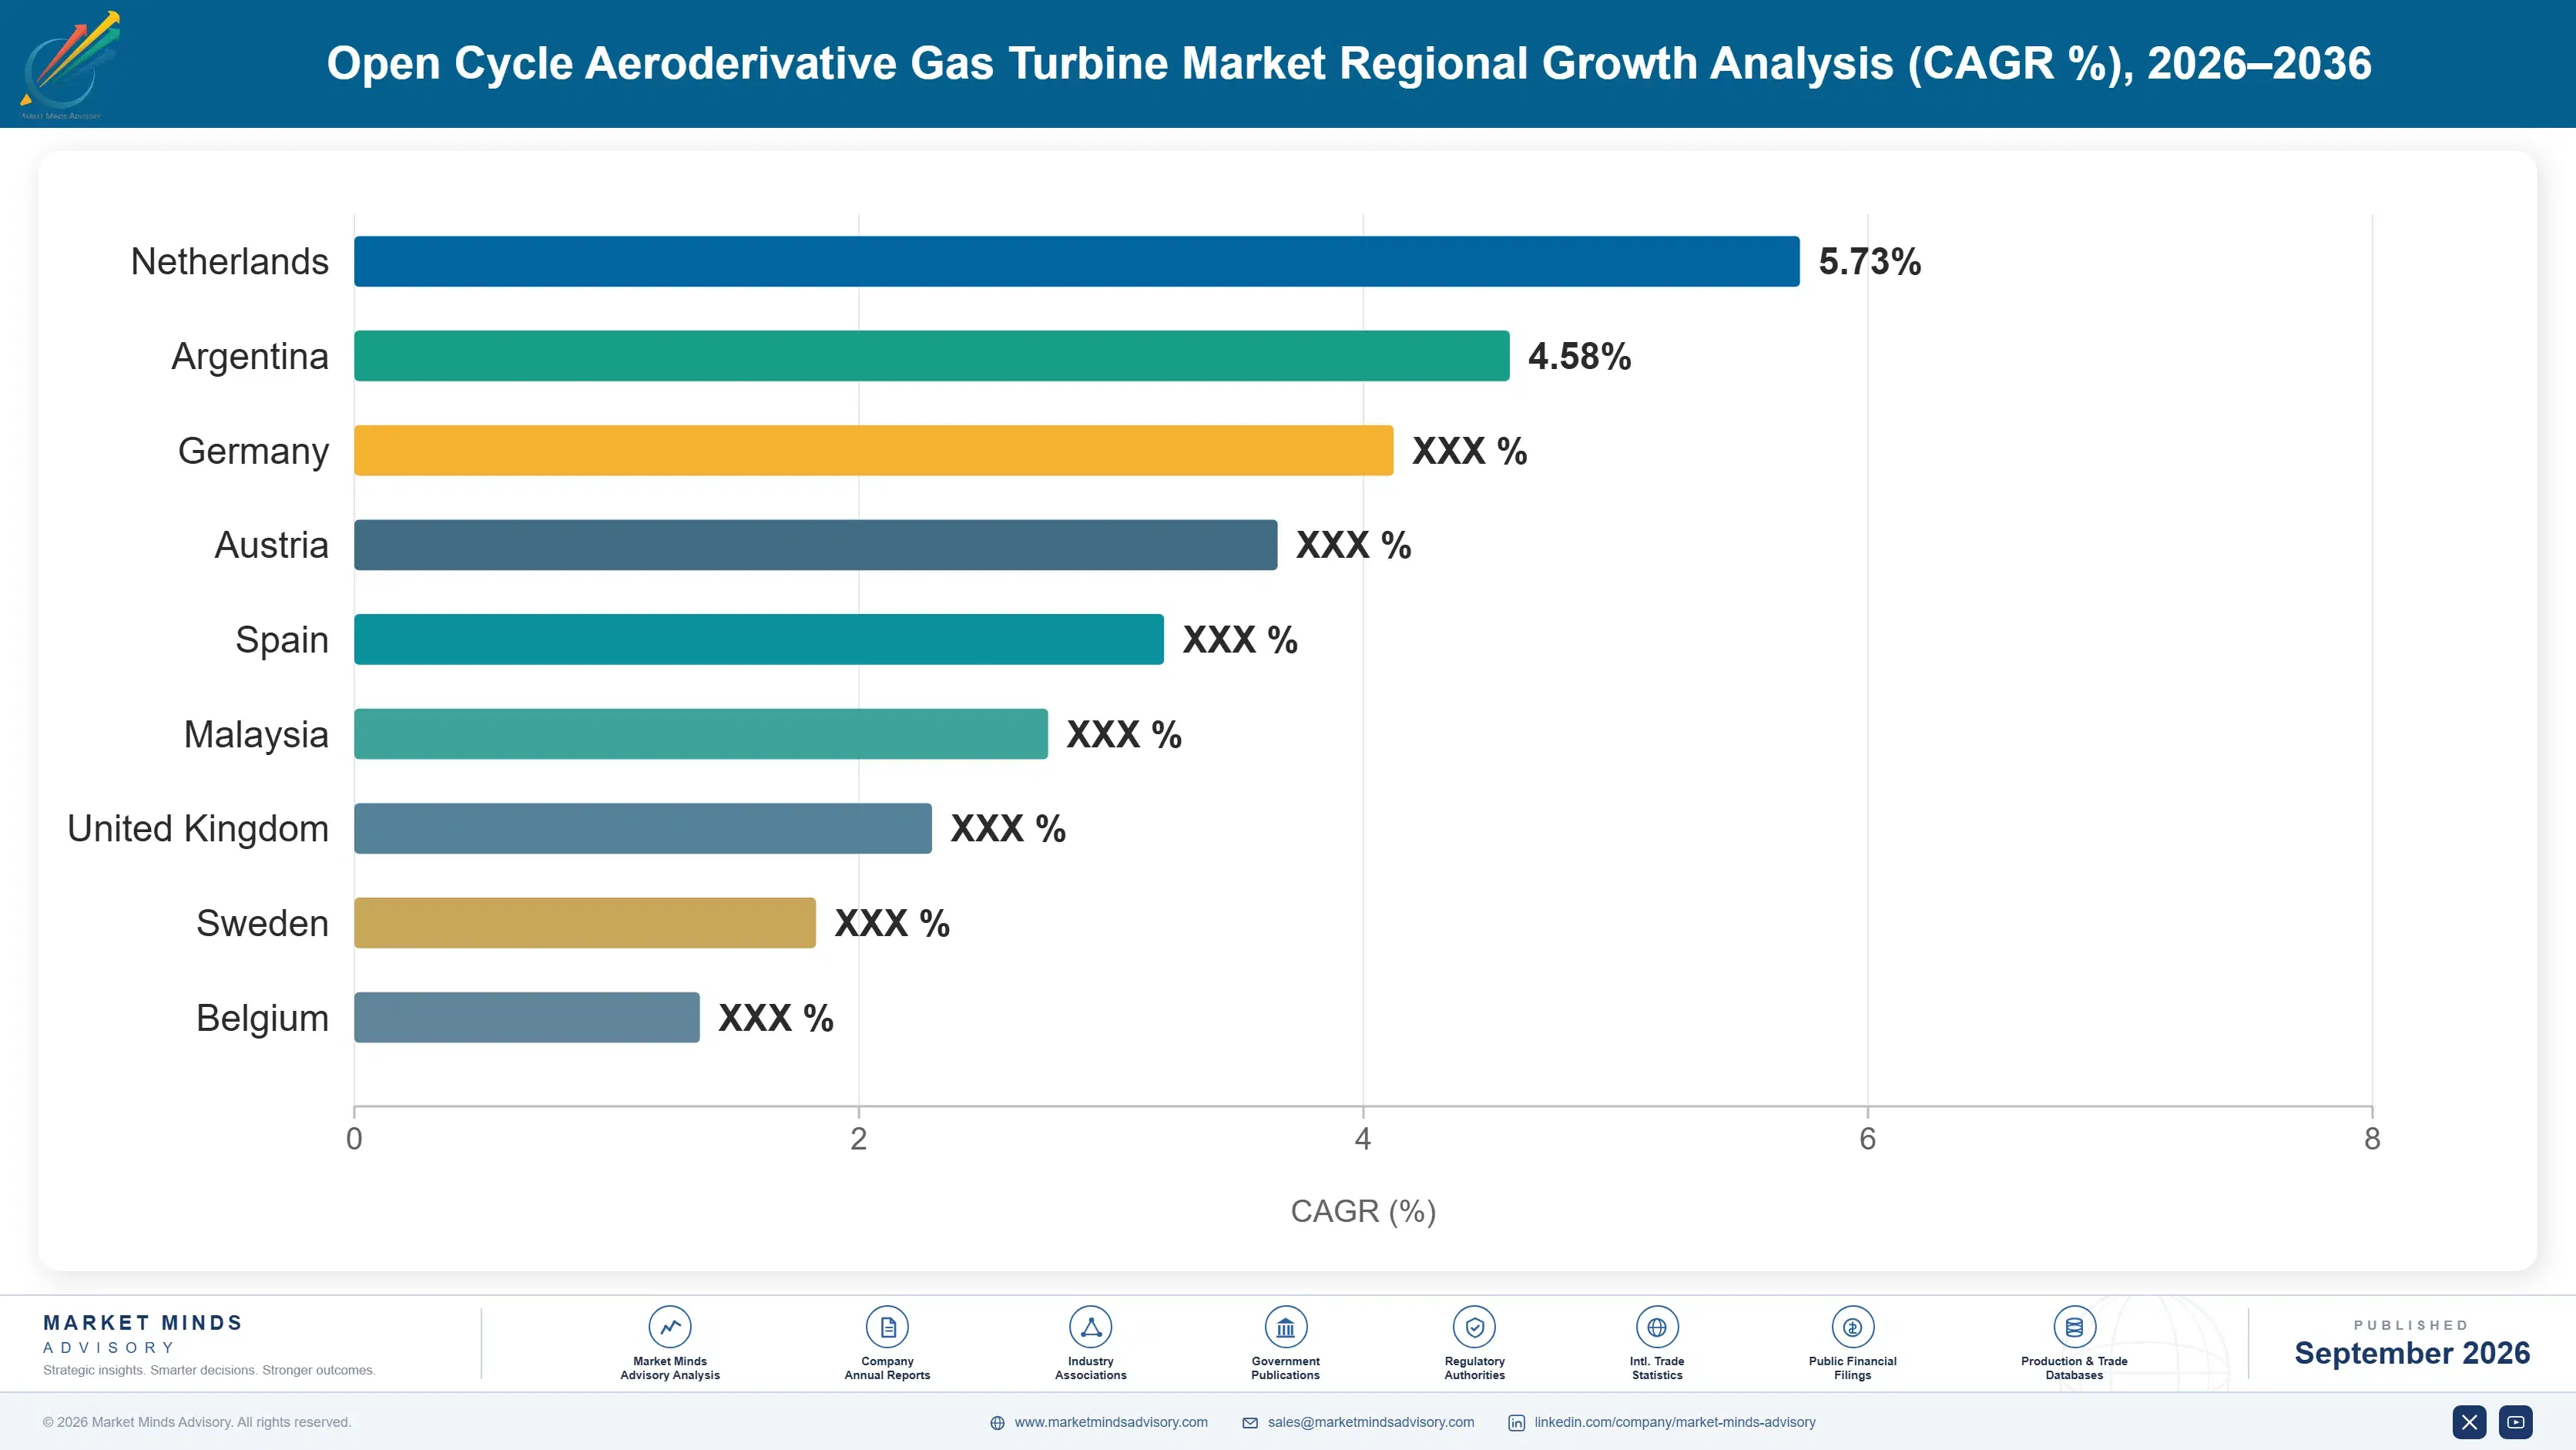
Middle East and Africa takes 26%, far outside its usual band, on liquefaction mechanical drive, Gulf peaking and mobile power. Western Europe sits well below band on limited gas ordering. Applications rather than economies decide this map, and three unrelated ones happen to concentrate in a single region.

Middle East and Africa

A 26% share far outside the usual band comes from three applications that share a region and nothing else. Gulf liquefaction trains use these machines to drive refrigerant compressors, and orders arrive in blocks when projects reach financial close. Separately, Gulf peaking capacity handles summer cooling load that arrives on a daily schedule no slower machine can follow. Across Africa, mobile and trailer-mounted units supply emergency and interim power where grid capacity has not kept pace with load, frequently through rental fleets rather than outright purchase. Nigerian, Egyptian and Iraqi demand for rapid deployment capacity is substantial and largely invisible in conventional power market analysis. Three demand cycles, one regional line.
Share: 26% | CAGR: 8.4% (2026 to 2036)

North America

Grid ramps rather than baseload define this region and the specification has changed accordingly. Californian and Texan systems face evening ramps that heavy duty machines cannot follow, and capacity procurement in those markets increasingly recognises start capability explicitly rather than treating dispatchable megawatts as equivalent. Gulf Coast liquefaction adds substantial mechanical drive ordering alongside. Battery storage competes directly and wins the shortest duration applications here faster than anywhere else, which pushes the turbine argument toward sustained output. Growth at 8.6% reflects a market where the technical case is well understood and the competition from storage is most advanced. Storage is furthest advanced here and it is taking the shortest duty permanently, which pushes the turbine argument toward sustained output.
Share: 23% | CAGR: 8.6% (2026 to 2036)
Regional intelligence for 5 additional markets available in the complete report: Western Europe, East Asia, South Asia and Pacific, Latin America, Eastern Europe. Contact sales@marketmindsadvisory.com.
open-cycle-aeroderivative-gas-turbine-market-country-cagr-analysis-1788255503621

Four Moves On How Buyers Evaluate

None of these four is about improving the machine, because the engineering is mature and derived from aero programmes that took decades and billions to develop. Each works on how the purchase gets evaluated, since a buyer comparing dollars per kilowatt will never reach the right answer here. All four are about evaluation rather than engineering.

Get start time into the procurement specification

A machine at full load in 9 minutes against thirty for a frame alternative is worth a great deal to a system facing a daily evening ramp, and nothing at all in a procurement that treats dispatchable megawatts as interchangeable. Working with system operators and regulators to have start capability specified rather than assumed changes the field before any bid is submitted. It costs technical engagement with people who do not buy anything. Manufacturers pursuing individual tenders instead are competing on the one metric they lose. It is the one metric they lose on.
Market Impact: Specifies a 9 minute start capability requirement upfront

Sell availability rather than megawatt hours

A peaking asset runs perhaps 1,100 hours a year and earns from being ready rather than from running, which makes availability the product and the core exchange model the mechanism that delivers it. Swapping a gas generator in 3 days from a lease pool against a multi-week in-situ overhaul is a genuine architectural advantage that competitors using frame machines cannot match. Presenting it as an availability guarantee with commercial consequences reaches the operator's revenue model directly. Most proposals still describe the maintenance interval instead. Maintenance intervals are not an availability guarantee.
Market Impact: Guarantees availability right across all 1,100 annual hours

Model the hybrid rather than fight the battery

Batteries beat these machines comprehensively below 1 hour of duration and lose beyond 4, which makes them complements far more often than substitutes on any realistic duty profile. A manufacturer proposing a hybrid configuration where storage covers the instantaneous response and the turbine covers sustained output is answering the whole requirement rather than half of it. That reframing wins evaluations where a turbine alone would lose to storage on responsiveness. Almost every proposal in this sector still positions against batteries rather than alongside them. Half an answer loses to a whole one.
Market Impact: Covers duty beyond 4 hours of sustained output

Follow liquefaction financial closes, not power markets

Mechanical drive orders arrive in blocks when liquefaction projects reach financial close, on a cycle entirely separate from electricity market conditions, and those decisions are visible years ahead to anybody tracking project development rather than power procurement. Middle East and Africa takes 26% of demand substantially on that basis. A manufacturer organised around utility sales cycles misses a pipeline that is published, dated and unrelated to anything happening in a power market. Very few sales organisations track both properly. The pipeline is published, dated and largely ignored by this sector.
Market Impact: Tracks order blocks worth fully 26% of demand

Who Controls the Margin Pool

CR5 stands at 78% of ordered megawatts, which is the only comparable basis since these units sit inside far larger energy and industrial reporting for every manufacturer. Concentration is extreme because a gas generator derived from an aircraft engine requires an aero engine programme behind it, and the number of organisations in the world with that capability is genuinely very small. Very few organisations in the world hold that capability.
Competition runs on start capability, service network reach and installed fleet position. Start capability decides whether a machine meets the duty at all in fast response applications. Service reach decides whether core exchange is practical in a given geography, which is a logistics question rather than a technical one. Fleet position decides aftermarket revenue that exceeds the original equipment margin considerably. Aftermarket revenue exceeds the original equipment margin considerably.

Rankings will move on how procurement evolves rather than on any engineering advance, because these machines lose evaluations that ignore start time and win the ones that specify it. Storage is taking the shortest duration applications permanently. The pressure comes from a competing technology and from evaluation methodology at once, which is a difficult combination to answer with better hardware.
open-cycle-aeroderivative-gas-turbine-market-company-positioning-matrix-1788255504143

Competitive Moat and Risk Dimensions

GE VERNOVA

Moat: Aero derivation and fleet scale

Direct derivation from a large commercial aero engine programme provides core technology, manufacturing scale and continuing development funded by a business far larger than the industrial application could support alone. The installed fleet then generates aftermarket revenue and service network density that reinforce each other. Nobody builds this capability from a standing start at any price.
GE VERNOVA

Risk: Storage taking short duration duty

Battery storage wins comprehensively below an hour of duration and its economics keep extending, which removes applications permanently rather than competitively. Fleet scale offers no defence against a technology that does the job differently. Positioning toward sustained output and hybrid configurations is the available response and it concedes ground that was profitable.
SIEMENS ENERGY

Moat: Industrial and mechanical drive breadth

A range spanning aeroderivative and heavy duty machines lets the group propose whichever architecture actually fits a duty rather than defending one, which matters in evaluations where the buyer has not decided what it needs. Mechanical drive experience across liquefaction and pipeline applications adds a second demand cycle. Breadth of that kind is difficult to assemble and expensive to maintain.
SIEMENS ENERGY

Risk: Internal competition between architectures

Offering both aeroderivative and heavy duty machines means every fast start sale potentially displaces a frame machine the group would rather sell, and sales organisations resolve that tension inconsistently. A single architecture competitor has no such conflict and argues its case without hesitation. Breadth creates optionality and it also creates an internal argument before every proposal.

Players Tracked

Prominent Players

GE Vernova
Siemens Energy
Baker Hughes
Mitsubishi Power Aero
Kawasaki Heavy Industries

Other Key Players

Solar Turbines
MAN Energy Solutions
Ansaldo Energia
Rolls-Royce
Pratt and Whitney
Wartsila
Zorya-Mashproekt
PROENERGY
Sulzer
Chromalloy
MTU Aero Engines
IHI Corporation
Doosan Enerbility
Harbin Electric
Aggreko

Recent Developments

FEBRUARY 2025

Capacity market recognised start time in procurement rules

A capacity procurement process introduced explicit recognition of start capability rather than treating all dispatchable megawatts as equivalent, which changed how fast starting machines were evaluated against slower alternatives. Aeroderivative bids that had previously lost on capital cost per kilowatt became competitive within a single procurement round.
Signal: A single rule change did more for these machines than a decade of engineering improvement had.
JUNE 2025

Liquefaction project committed mechanical drive turbine block

A liquefaction project reaching financial close committed a block order of aeroderivative machines for refrigerant compressor drive, on a decision timeline entirely separate from any electricity market condition. The order had been visible to anybody tracking project development for several years before it was placed.
Signal: The mechanical drive pipeline is published and dated, and most sales organisations do not follow it.
OCTOBER 2025

Hybrid storage and turbine configuration won grid support tender

A grid support procurement was awarded to a configuration pairing battery storage for instantaneous response with aeroderivative turbines for sustained output, rather than to either technology alone. The combination answered the full duty profile, where each element on its own covered only part of it.
Signal: The battery is a complement more often than a competitor, and hardly any proposal says so.

Alloys, Castings And Aero Supply

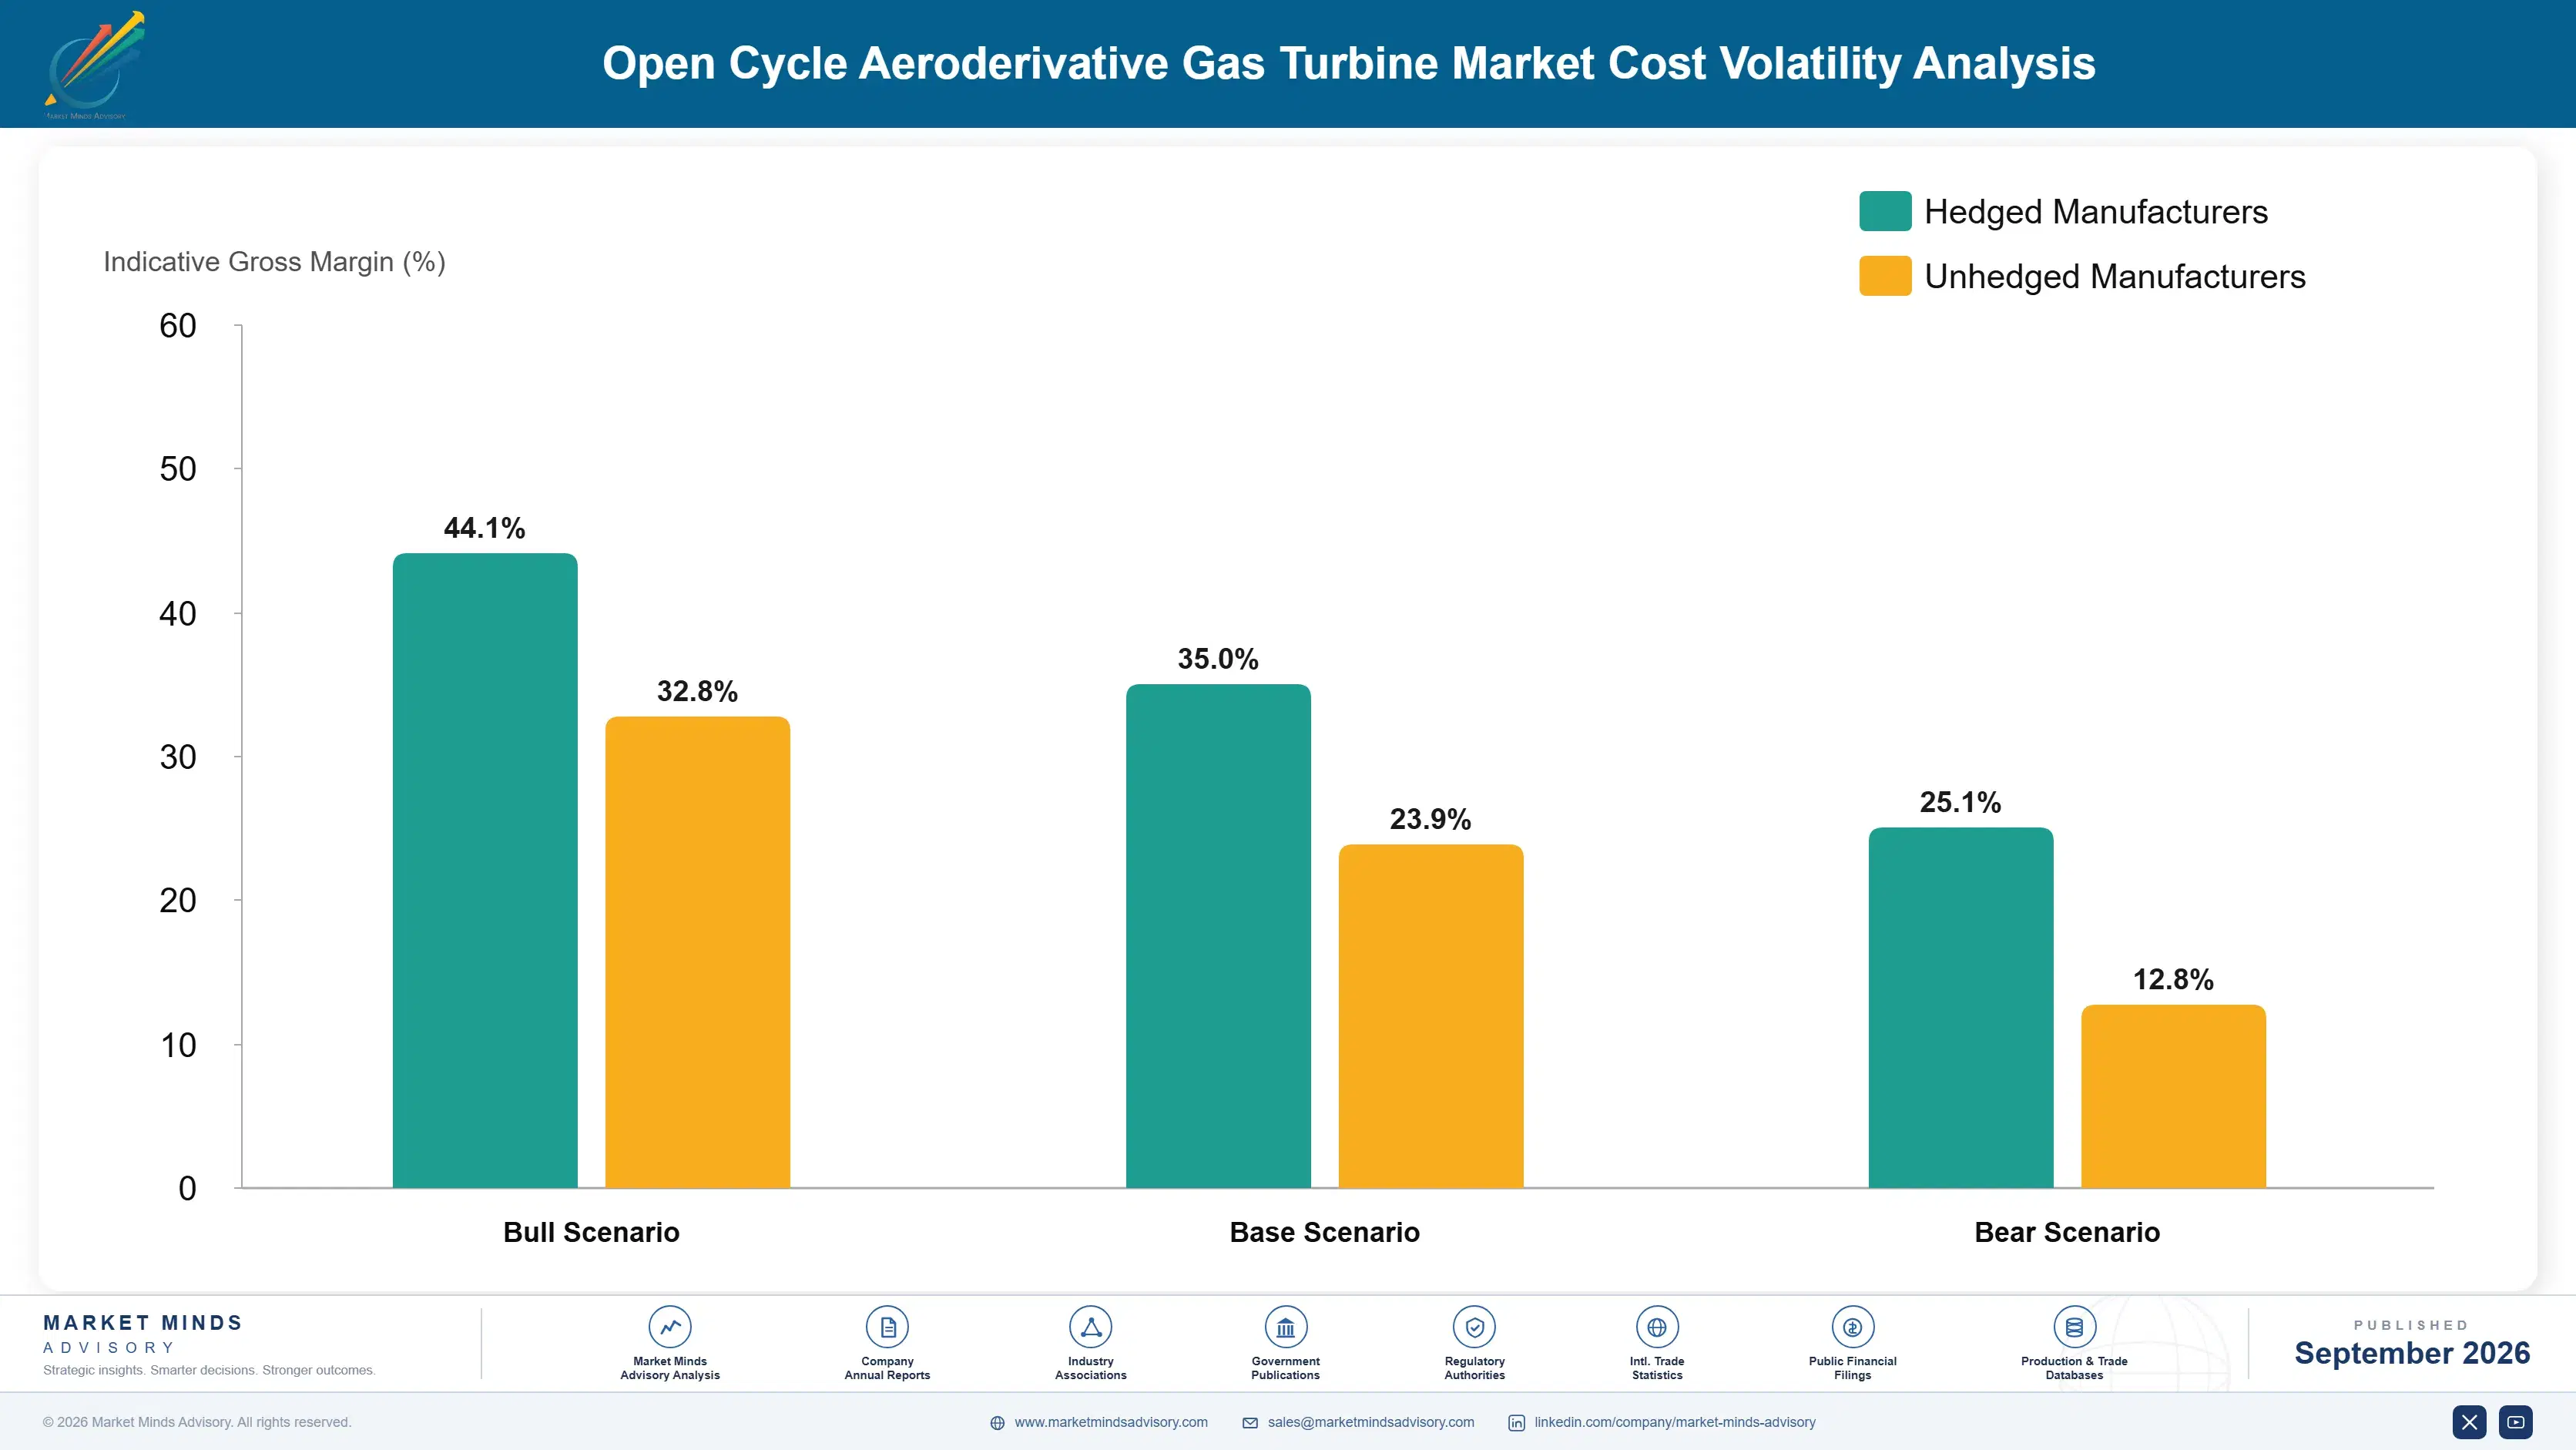
Nickel superalloy hot section components account for roughly 34% of manufacturing cost, precision castings and machining around 22%, and control systems with packaging a further 18%. The supply chain is shared with commercial aero engine production, which means these components compete for capacity against aircraft programmes ordering in far larger volumes and paying comparable prices for the same parts.
Nickel and aerospace alloy pricing through recent years moved on aircraft production recovery rather than on anything happening in power generation, and US Geological Survey mineral commodity reporting recorded the underlying metal movement. Manufacturers with allocated capacity inside their own aero supply chains protected delivery and cost. Those buying castings on open aerospace terms faced both extended lead times and pricing set by a market with considerably deeper pockets than power generation.

The disadvantage falls on supply chain position rather than on purchasing skill. A manufacturer whose industrial turbine business sits inside a group producing aero engines holds allocation that an independent industrial builder simply cannot obtain when aircraft production is strong. No commercial arrangement replaces being part of the programme that the castings foundry actually prioritises. That position explains most of the delivery performance difference visible across this category.
open-cycle-aeroderivative-gas-turbine-market-cost-volatility-analysis-1788255504338

Secure casting allocation ahead of aero cycles

Hot section castings are shared with commercial aero engine production and allocation follows aircraft build rates rather than power generation demand, which leaves industrial orders competing for capacity they do not control. Long-term allocation agreements cost volume commitment and protect delivery when aircraft production strengthens. Manufacturers without them quote lead times their supply chain will not honour.

Standardise packaging across output classes

Control systems, enclosures and auxiliaries make up 18% of cost and are frequently engineered per project despite the underlying requirements varying far less than the proposals suggest. A standard packaging range across output classes raises batch volumes and shortens delivery on the scope that most often slips. It costs some configuration flexibility and returns on every unit shipped.

Build the core exchange pool before the fleet needs it

Core exchange in 3 days depends on lease pool gas generators being available in the right region, and a pool built after a fleet has grown arrives too late to support the availability guarantees already sold. Pool capital is modest against the service revenue it protects. Manufacturers selling availability without the pool behind it are promising something logistics cannot deliver.

Portfolio Architecture for Margin Defence

Margin here follows the aftermarket rather than the machine, which every manufacturer knows and few proposals reflect. Original equipment is priced competitively against frame alternatives that look cheaper on capital cost, while parts, core exchange and long-term service agreements across a twenty year fleet life earn considerably more in total. Participants managing by installed fleet rather than by order intake run a different business.
Volume and premium pull against each other through the fleet rather than the factory. The smaller output classes sell in numbers into industrial and offshore duty at modest margins, and every unit placed adds to the fleet that generates aftermarket revenue for decades afterwards. Pursuing only the large high-efficiency machines produces fewer installations and a thinner service base beneath them.

High-value pools sit in the large high-efficiency class, in core exchange service and in hybrid configurations with storage that almost nobody is proposing properly. The third is the most available: pairing a battery for instantaneous response with turbines for sustained output answers a full duty profile that either technology alone covers only partially, and it wins evaluations a turbine alone loses.

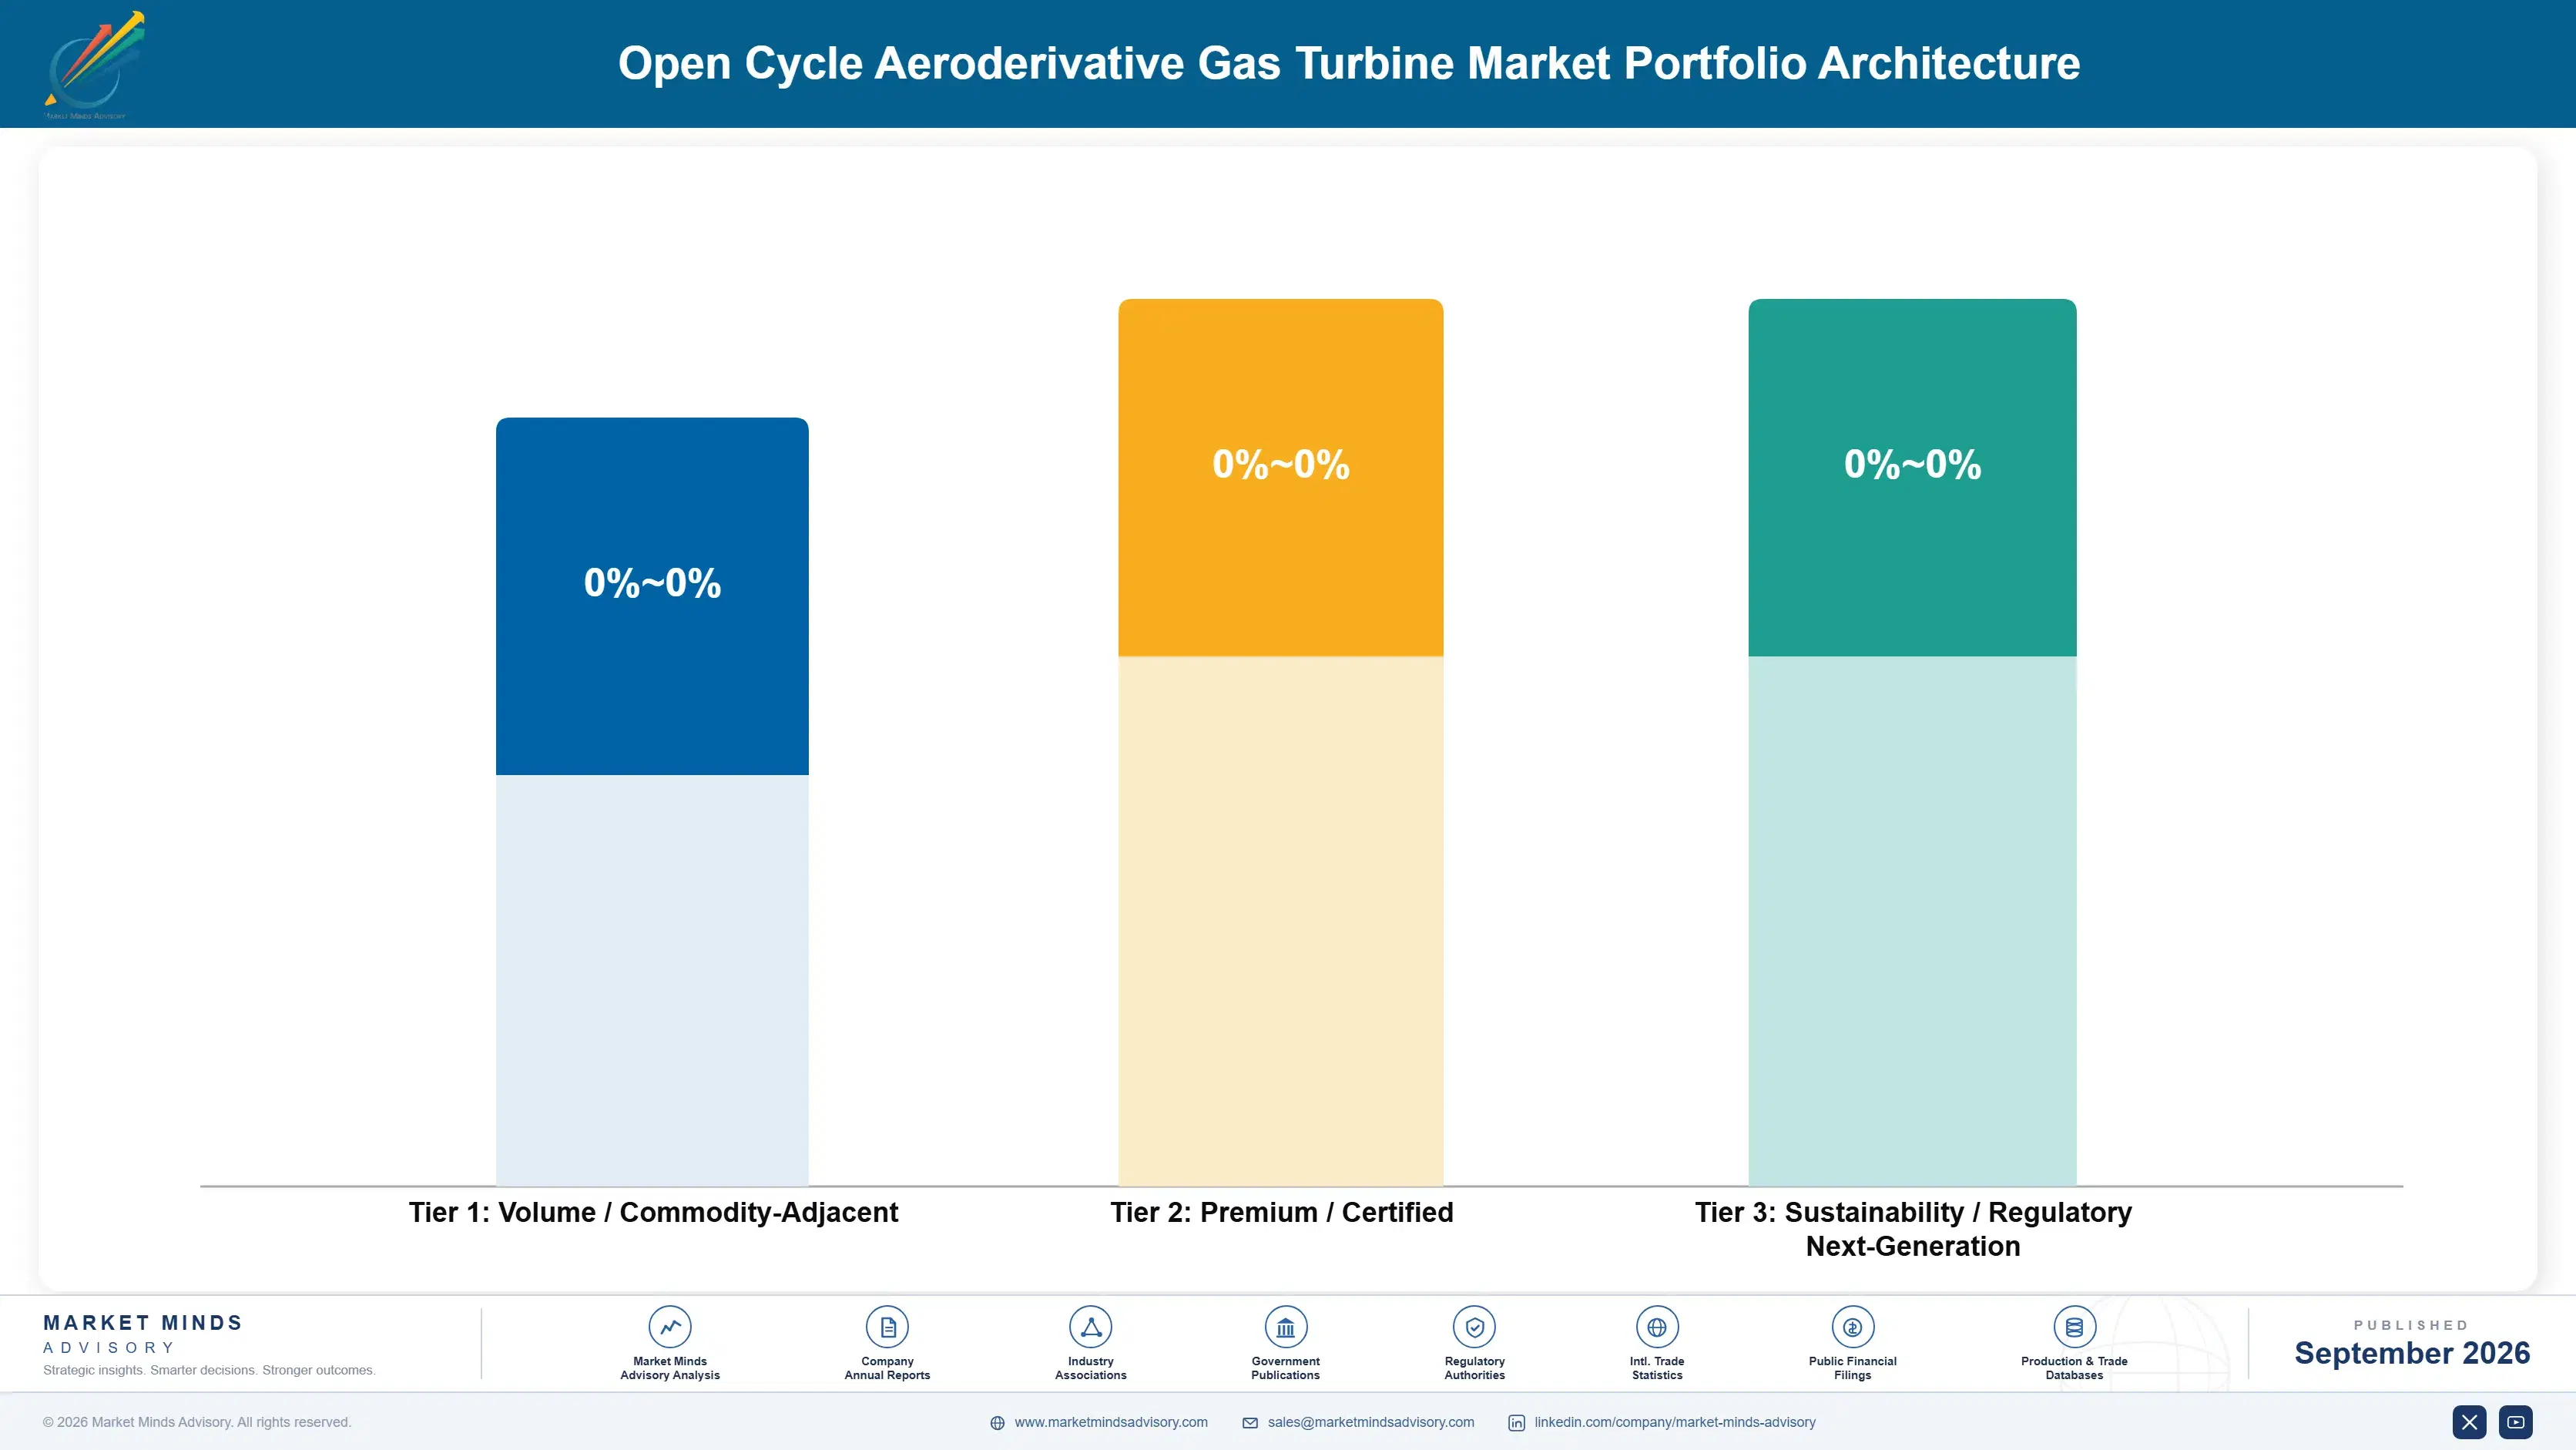
Volume / Commodity-Adjacent

Smaller output class machines sold into industrial, offshore and distributed duty against reciprocating engines and frame alternatives on capital cost. Competition is direct and price sensitive. The 8 point spread reflects whether a long-term service agreement is attached at order.
Gross Margin: 12 to 20%

Premium / Certified

Large high-efficiency machines specified where start capability is written into the procurement rather than assumed away. Start time rather than capital cost supports the price entirely. The 8 point spread reflects whether the buyer earns capacity revenue that values fast response.
Gross Margin: 24 to 32%

Sustainability / Regulatory / Next-Generation

Core exchange service, long-term availability agreements and hybrid configurations combining storage with turbines. Margins are high because the fleet is captive and alternatives are limited. The 18 point spread separates parts and exchange revenue from full availability guarantee contracts.
Gross Margin: 34 to 52%
open-cycle-aeroderivative-gas-turbine-market-portfolio-architecture-1788255504837

High-value Sub-segments and Strategic Watch-out

Above Seventy Megawatt High-Efficiency Class

High value and high growth at 12.0%. Reaching 44% in simple cycle removes the efficiency compromise that once justified slower and heavier plant for this duty. The 8 point spread reflects whether start capability is specified in the procurement or has to be argued for.
Gross Margin: 28 to 36%

Mobile and Trailer-Mounted Packages

High value with strong growth at 10.2%. Buyers need power at a specific location within weeks, and capital cost barely enters the discussion at all. The 8 point spread reflects whether units are sold outright or deployed through a rental fleet arrangement. Rental dominates in several regions.
Gross Margin: 26 to 34%

Fifteen to Forty Megawatt Class

The volume core. It earns modestly and every unit placed adds to the installed fleet generating aftermarket revenue across two decades afterwards. The 8 point spread reflects whether a service agreement is signed at order, which decides these economics more than the machine does. Service decides.
Gross Margin: 14 to 22%

Sub-Fifteen Megawatt Class

The strategic watch-out. Reciprocating engines compete directly at this scale on capital cost and part load efficiency, and they win on both in most applications. The 18 point spread separates offshore and weight-critical duty from general industrial applications competing purely on price. Reciprocating engines win here.
Gross Margin: 8 to 26%

Twenty Years Of Parts

The annuity here runs for the fleet life and it dwarfs the original sale. A machine installed today consumes parts, core exchanges and service across roughly twenty years, and the manufacturer holds that revenue effectively uncontested because the hot section components are proprietary and the exchange pool belongs to whoever built the fleet. Order intake is the entry ticket and the aftermarket is the business.
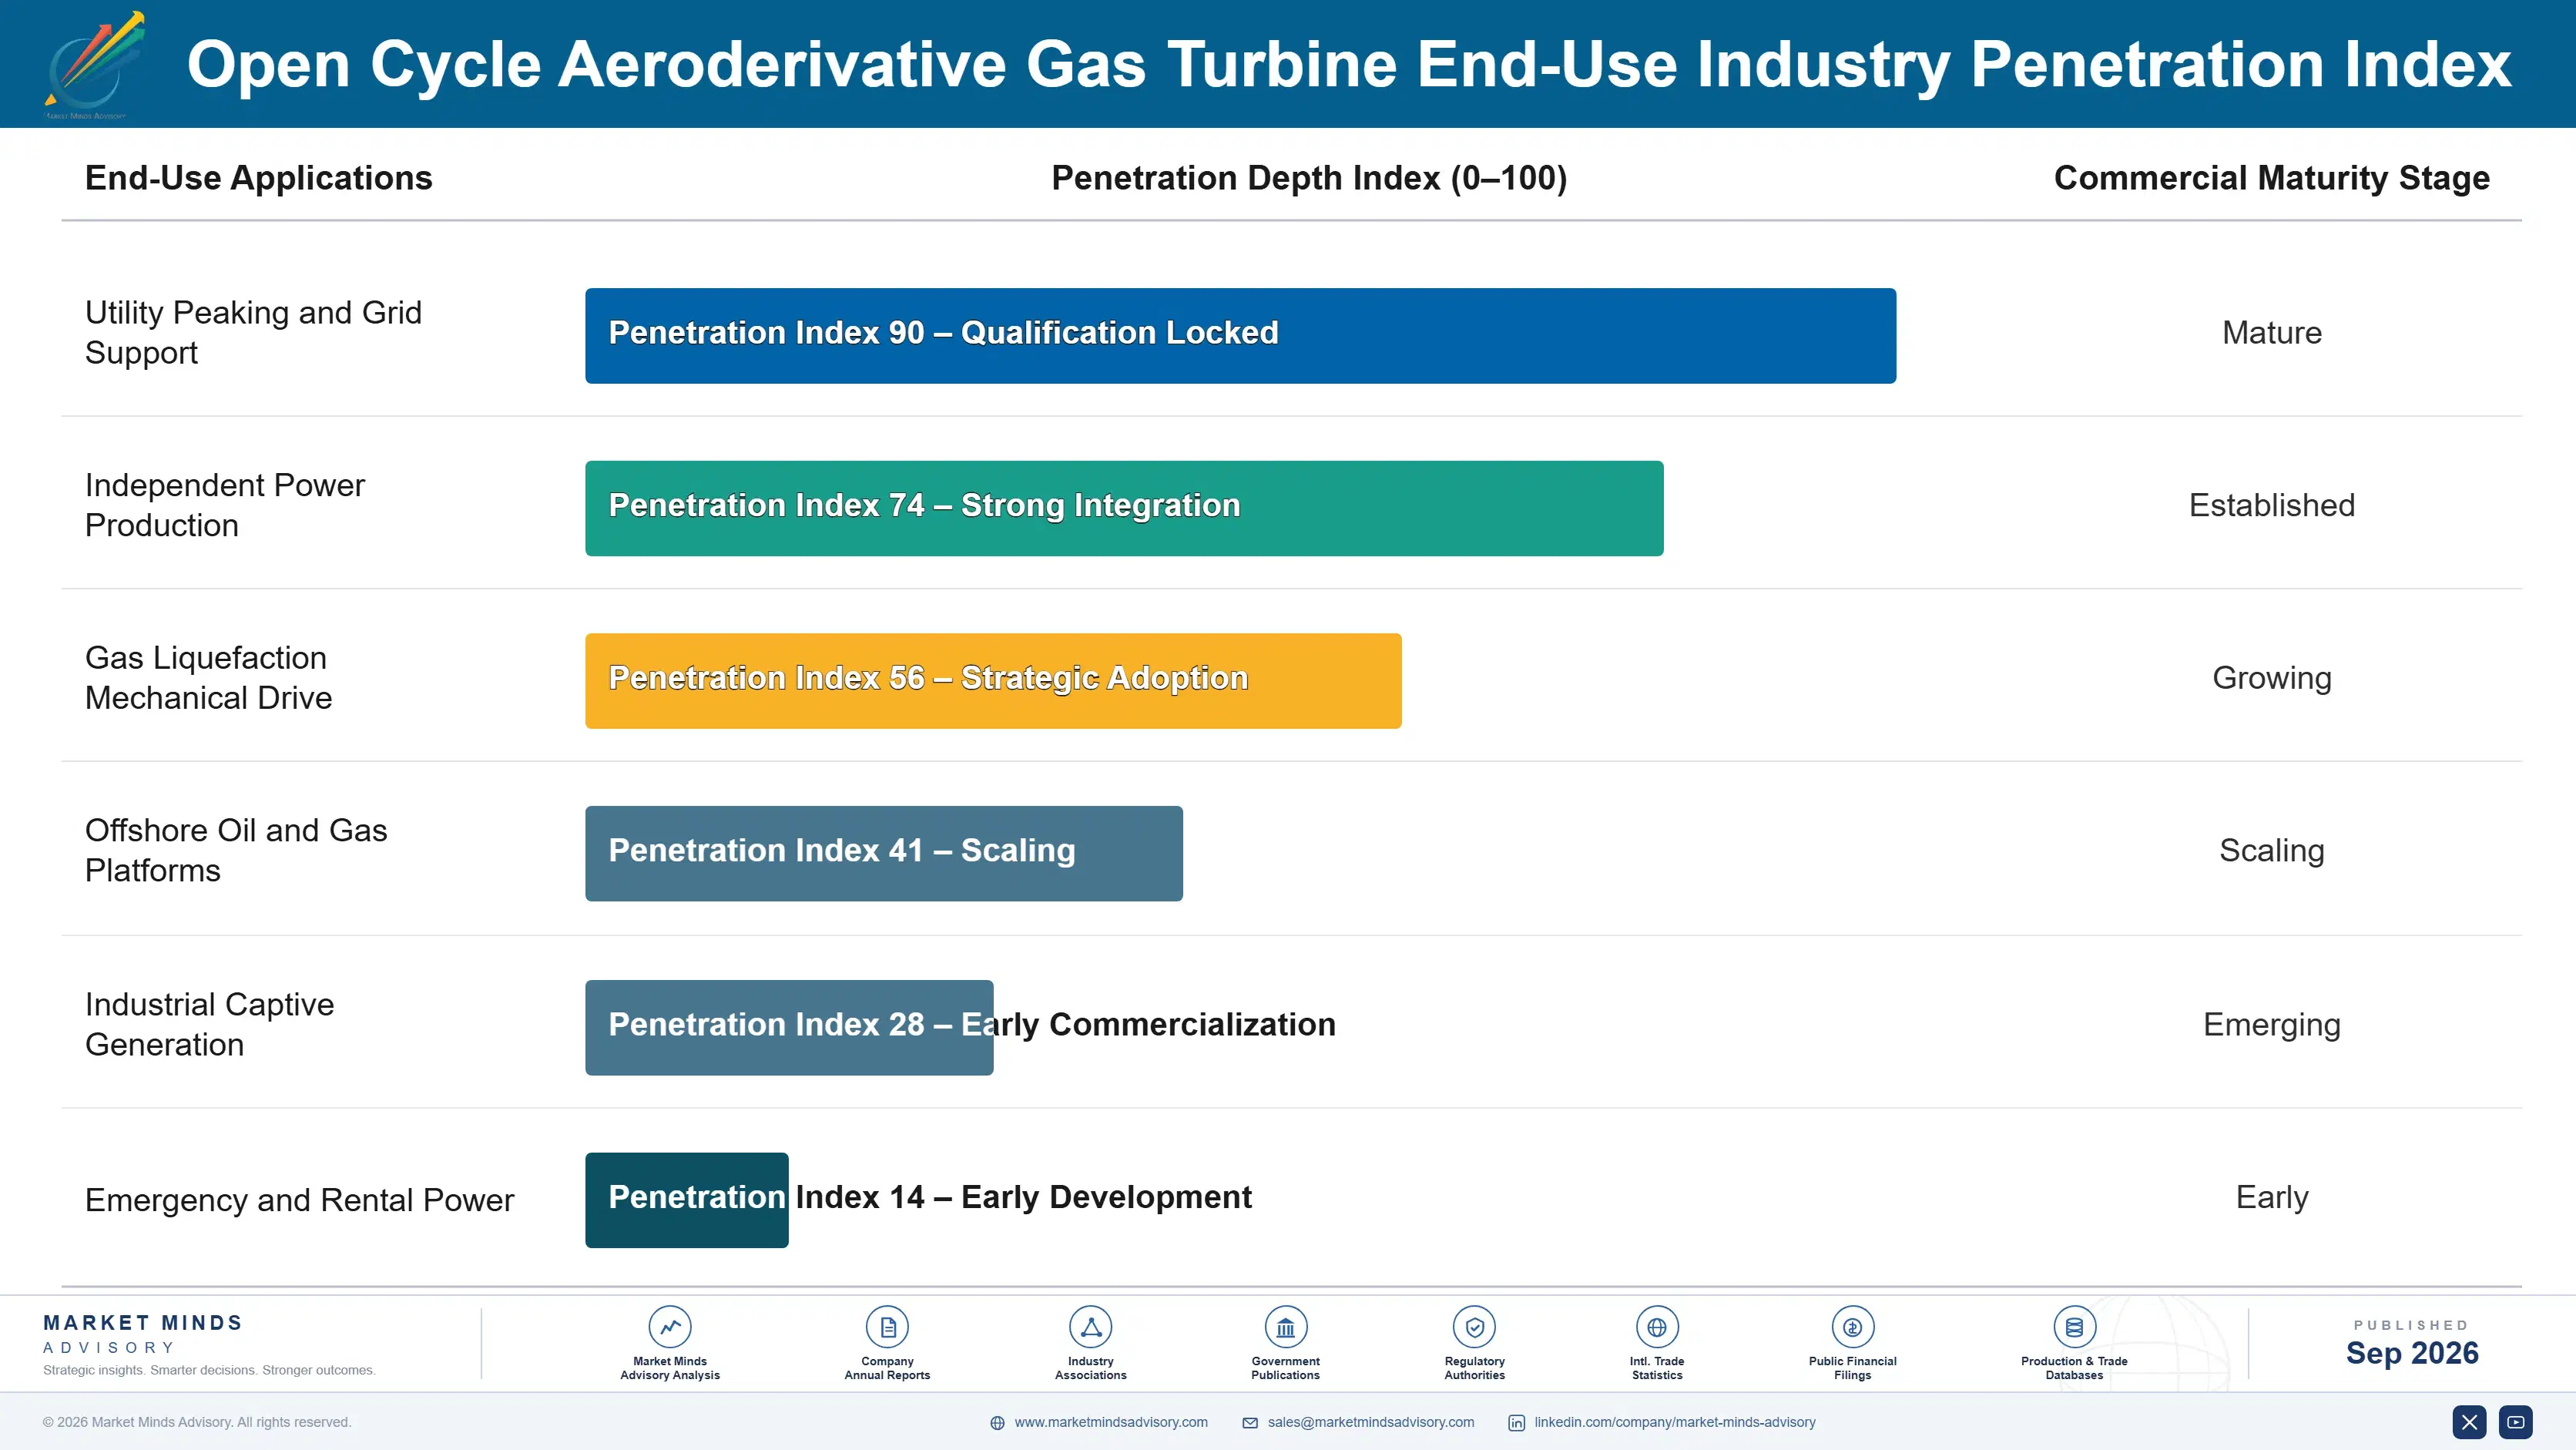
Stickiness varies enormously by service agreement rather than by machine. An operator on a long-term availability agreement is committed for the term and beyond it, since the exchange pool and parts supply sit with one party. An operator buying parts transactionally can use third-party overhaul providers for some components and does. That difference is settled at order and is worth more than the equipment margin.

Buyer profiles have shifted from plant engineers toward market analysts and portfolio managers, and the proposals have not caught up. A plant engineer compared heat rate and maintenance intervals. A portfolio manager asks what the machine earns in a capacity market that values fast response and what a missed ramp costs. That second conversation decides the order and it is not answered by a performance specification.
open-cycle-aeroderivative-gas-turbine-market-end-use-penetration-index-1788255505333

How These Machines Get Ordered

These are among the four positions where our research anticipates prominent divergence between winners and laggards over the coming forecast period. Each is grounded in the demand model, the regulatory perimeter, and the announced capacity pipeline.
01 / PROCUREMENT RULE SHAPING

Change the specification before the tender exists

A machine reaching full load in 9 minutes against thirty for a frame alternative is worth a great deal to a system facing a predictable daily evening ramp, and worth precisely nothing in a procurement treating all dispatchable megawatts as interchangeable with each other. Working with system operators and regulators so that start capability is specified rather than assumed changes the competitive field before any bid document exists. It costs technical engagement with people who never buy anything, and manufacturers chasing individual tenders compete on the metric they lose.
02 / AVAILABILITY GUARANTEE SELLING

Sell being ready, not being efficient

A peaking asset runs perhaps 1,100 hours a year and earns from being available when required rather than from accumulating running hours, which makes availability the actual product and core exchange the mechanism delivering it. Swapping a gas generator in 3 days from a lease pool against a multi-week in-situ overhaul is a genuine architectural advantage that frame machine competitors cannot replicate at all. Presenting that as a commercial availability guarantee reaches the operator's revenue model, and most proposals still describe maintenance intervals.
03 / HYBRID CONFIGURATION PROPOSALS

Put the battery in your own proposal

Batteries beat these machines comprehensively below an hour of duration and lose beyond four hours, which makes the two technologies complements far more often than substitutes across any realistic duty profile a buyer actually faces. A manufacturer proposing a hybrid where storage covers instantaneous response and turbines cover sustained output answers the whole requirement rather than half of it, and wins evaluations a turbine alone would lose outright. Almost every proposal in this sector still positions against storage rather than alongside it.
04 / MECHANICAL DRIVE PIPELINE

Follow the liquefaction closes, not the utilities

Mechanical drive orders arrive as blocks when liquefaction projects reach financial close, on a cycle that has nothing whatever to do with electricity market conditions or capacity procurement timetables anywhere. Those decisions are visible years ahead to anybody tracking project development instead of power purchasing, and Middle East and Africa takes 26% of category demand substantially on that basis. A sales organisation built entirely around utility procurement cycles misses a pipeline that is published, dated and completely separate from it.

Engagement Snapshot From the Field

A live engagement with an industry participant carrying material or product regulatory and market exposure ahead of a defining policy shift, showing how our research translates into a defensible multi-year portfolio strategy.
MARKET MINDS ADVISORY · CLIENT ENGAGEMENT SUMMARY
Open Cycle Aeroderivative Gas Turbine Producer Strategic Portfolio Review and Transition Roadmap 2026·Investment Scenario on Open Cycle Aeroderivative Gas Turbine Exposure Evaluation 2025-26
CLIENT PROFILE
A gas turbine manufacturer supplying aeroderivative machines into power generation and mechanical drive applications across four continents, with annual ordered megawatt value in the low billions of dollars and a win rate in competitive power tenders that had declined for three consecutive years (client-reported, unverified by MMA). Technical performance was not in question anywhere. Discounting had become routine.
STRATEGIC CHALLENGE
The client was losing tenders to heavy duty machines that could not meet the stated duty, on evaluations dominated by capital cost per kilowatt, and had responded by discounting, which won some orders at unacceptable margins. Management wanted to understand whether the evaluation itself could be influenced rather than simply endured.
MMA APPROACH
MMA reconstructed every competitive power tender across four years, separating those where start capability appeared in the specification from those where it did not, and comparing outcomes. Forty-seven expert interviews with system operators, regulators, utility procurement teams and independent producers established how those specifications were actually written and by whom.
KEY FINDINGS
  1. The client won 71% of tenders where start capability was specified and 12% of those where it was not, on essentially identical machines.
  2. Specifications were drafted by system operators and consultants months before tender, and the client had engaged with none of them at any point.
  3. Storage had taken every application under 2 hours of duration across the period, and the client had bid against it rather than proposing hybrid configurations.
  4. Mechanical drive orders from liquefaction closes were visible years ahead and the client's sales organisation tracked utility procurement cycles and nothing else at all.
CLIENT PROFILE
A gas turbine manufacturer supplying aeroderivative machines into power generation and mechanical drive applications across four continents, with annual ordered megawatt value in the low billions of dollars and a win rate in competitive power tenders that had declined for three consecutive years (client-reported, unverified by MMA). Technical performance was not in question anywhere. Discounting had become routine.
STRATEGIC CHALLENGE
The client was losing tenders to heavy duty machines that could not meet the stated duty, on evaluations dominated by capital cost per kilowatt, and had responded by discounting, which won some orders at unacceptable margins. Management wanted to understand whether the evaluation itself could be influenced rather than simply endured.
MMA APPROACH
MMA reconstructed every competitive power tender across four years, separating those where start capability appeared in the specification from those where it did not, and comparing outcomes. Forty-seven expert interviews with system operators, regulators, utility procurement teams and independent producers established how those specifications were actually written and by whom.
KEY FINDINGS
  1. The client won 71% of tenders where start capability was specified and 12% of those where it was not, on essentially identical machines.
  2. Specifications were drafted by system operators and consultants months before tender, and the client had engaged with none of them at any point.
  3. Storage had taken every application under 2 hours of duration across the period, and the client had bid against it rather than proposing hybrid configurations.
  4. Mechanical drive orders from liquefaction closes were visible years ahead and the client's sales organisation tracked utility procurement cycles and nothing else at all.
RECOMMENDED STRATEGY
Phase 1: Phase one: engage system operators and specification consultants directly, since procurement rules rather than tenders decide these outcomes months earlier. Phase 2: Phase two: propose hybrid storage and turbine configurations rather than bidding against batteries on the applications a turbine alone reliably loses. Phase 3: Phase three: track liquefaction project development as a separate pipeline, since those orders move on a cycle unrelated to power markets.
OUTCOME
Within six quarters start capability appeared in three procurement specifications the client had engaged with, and it won two of them at full margin (client-reported, unverified by MMA). Two hybrid proposals were submitted and one was awarded. Discounting on power tenders was substantially reduced. Liquefaction pipeline tracking has begun.

Frequently Asked Questions

Foundational context covering the market sizes, CAGR, scope, country, region and competition that inform every finding below. This section is provided to cover basics and most often pre-purchase conversations, answered from the MMA Primary Research Dataset.

What is the current size of the Open Cycle Aeroderivative Gas Turbine Market?

The global open cycle aeroderivative gas turbine market was valued at USD 6.4 billion in 2025, covering aircraft-derived turbines for power and mechanical drive. The 2026 figure reaches USD 6.91 billion.

How large will the Open Cycle Aeroderivative Gas Turbine Market be by 2036?

MMA forecasts USD 14.92 billion by 2036, an increase of USD 8.01 billion over the 2026 base. That represents an expansion multiple of 2.16 times across the forecast period.

What is the CAGR for the Open Cycle Aeroderivative Gas Turbine Market 2026 to 2036?

The base case compound annual growth rate is 8.0%, with a bull case at 9.2% and a bear case at 6.8%. Historical growth between 2020 and 2025 ran at 6.6%.

Which segment is growing fastest?

The above seventy megawatt high-efficiency class grows at 12.0%, half again the market rate of 8.0%, because 44% simple cycle efficiency removes the bottoming cycle argument. Mobile packages follow at 10.2%.

Who are the major companies in the Open Cycle Aeroderivative Gas Turbine Market?

GE Vernova, Siemens Energy, Baker Hughes, Mitsubishi Power Aero and Kawasaki Heavy Industries lead on ordered megawatts, with combined CR5 of 78%. Concentration reflects how few aero engine programmes exist.

Which country is growing fastest?

India grows fastest at 10.2%, on severe peaking requirements as solar capacity has outpaced the balancing capability behind it. South Asia and Pacific leads regionally at 10.2%.

Report Segmentation Architecture

The full report scope spans multiple orthogonal segmentation dimensions, with cross-tabulated demand data provided for each dimension pair. Coverage extends further to regional breakdowns, trend trajectories, and the competitive detail needed to support segment-level decision-making.

By Output Class

  • Sub-Fifteen Megawatt Class
  • Fifteen to Forty Megawatt Class
  • Forty to Seventy Megawatt Class
  • Above Seventy Megawatt High-Efficiency Class
  • Mechanical Drive Configurations
  • Mobile and Trailer-Mounted Packages

By End-Use Industry

  • Utility Peaking and Grid Support
  • Independent Power Production
  • Gas Liquefaction Mechanical Drive
  • Offshore Oil and Gas Platforms
  • Industrial Captive Generation
  • Emergency and Rental Power

By Commercial Dimension

  • Outright Equipment Purchase
  • Long-Term Service Agreements
  • Core Exchange Programmes
  • Rental and Lease Fleets
  • Build Own Operate Arrangements
  • Hybrid Storage and Turbine Packages

By Region

  • North America
  • Western Europe
  • East Asia
  • South Asia and Pacific
  • Latin America
  • Middle East and Africa
  • Eastern Europe

Scope, Methodology, and Coverage

Every figure in this report is reproducible from documented input assumptions. The scope below maps the historical period, the forecast horizon, the segmentation dimensions, and the countries covered, alongside the underlying primary and qualitative methodology.
Historical Period
2020 to 2025
Forecast Period
2026 to 2036
Base Year
2025 (USD billions; MMA Primary Research Dataset, September 2026)
Market Definition
The open cycle aeroderivative gas turbine market covers gas turbines derived from aircraft engine cores operating without a steam bottoming cycle, supplied for power generation and mechanical drive duty, spanning sub-fifteen megawatt units, fifteen to forty megawatt units, forty to seventy megawatt units, above seventy megawatt high-efficiency units, mechanical drive configurations, and mobile trailer-mounted packages. Scope is measured as ordered megawatt value including the packaged unit and initial installation. Excluded are heavy duty frame gas turbines, combined cycle plant including steam turbines and heat recovery equipment, aircraft propulsion engines, marine propulsion turbines, and long-term service agreements sold separately.
Quantitative Units
USD billion, 2025 base year, 2026 to 2036 forecast period
Segmentation Dimensions
Output class, end-use application, commercial model, region
Regions Covered
North America, Western Europe, East Asia, South Asia and Pacific, Latin America, Middle East and Africa, Eastern Europe
Countries Covered
United States, Canada, United Kingdom, Netherlands, Italy, Poland, Romania, Kazakhstan, China, Japan, South Korea, India, Australia, Brazil, Argentina, Saudi Arabia, Qatar, Nigeria
Key Companies Profiled
20 companies across turbine manufacturers, service providers and rental fleet operators
Quantitative Methodology
Primary survey, n=3,800 respondents, Q4 2025, six countries; demand-side model with trade association cross-validation
Qualitative Methodology
47 expert interviews, Q4 2025; applied to validate demand model assumptions, identify emerging dynamics, and assess competitive positioning
Report Format
PDF and XLSX data workbook (Word format preview document)
Publisher
Market Minds Advisory
Report Code
MMA-2026-ENE-401
Published
September 2026
Contact
sales@marketmindsadvisory.com | www.marketmindsadvisory.com

Purchase the full Open Cycle Aeroderivative Gas Turbine Market Report (2026 to 2036).

The full MMA report on the open cycle aeroderivative gas turbine market runs to detailed output class and regional models across the 2026 to 2036 forecast period, with cost benchmarks separated by hot section content and packaging scope. It profiles 20 companies on a consistent ordered megawatt basis, covering turbine manufacturers, service providers and rental fleet operators. Procurement specifications are analysed by market to identify where start capability is recognised explicitly. Regional chapters cover the seven MMA regions with country-level detail on the eighteen markets surveyed. Primary research draws on a quantitative survey of 3,800 respondents across six countries and 47 expert interviews conducted in Q4 2025.
Cost benchmarks by hot section content and packaging scope
Procurement specifications analysed for explicit start capability recognition
Aftermarket revenue modelled across twenty year installed fleet lives
Twenty company profiles on consistent ordered megawatt basis
Storage competition mapped against duty duration and application type
Seven regional chapters with eighteen country detail tables

Built For The People Who Decide

From boardroom strategy to bench-side execution, this report is read cover-to-cover by leaders shaping the next decade of their industry, turning demand scenarios, market dynamics and valuation benchmarks into decisions.
CXOs/ Presidents/ VPs/ Managers
M&A and Corporate Development
Strategy Teams and R&D Heads
Procurement and Product Directors
Regulatory and Compliance Leaders
Investor Relations and Equity Analysts