Market Minds Advisory
Opacifying Cosmetic Products Market

Opacifying Cosmetic Products Market: Opacifying Cosmetic Products Market: Restricted Chemistries, Replacement Economics and Transparent Repositioning, 2026 to 2036

This ingredient class exists so that shampoo does not look like water. Two of its three workhorse chemistries are now being withdrawn for reasons entirely unrelated to whether they work.

Lead Analyst

Published

September 2026

Make Smarter Decisions with Customized Research Insights

Request a free sample report and evaluate market opportunities, growth trends, and competitive dynamics relevant to your business needs.

2025 MARKET VALUE$1.6BMarket Size 2025
2036 FORECAST VALUE$2.9BBase Case , 2026 to 2036
CAGR 2026 TO 20365.6 %Bull 6.8% / Bear 4.4%
INCREMENTAL OPPORTUNITY$1.2BNet 10- year value creation
EXPANSION MULTIPLE1.71x2036 value over 2026 base
Strategic Levers
M&A Pipeline
Regional Outlook
Country Rankings
Competitive Intelligence
Segmental Deep-dive
Call-Us : 91 93563 13602

Executive Snapshot and Market Trajectory.

Opacity is a purely aesthetic function. Consumers read a pearly white lotion as rich and a clear one as watery, and this entire ingredient class exists to satisfy that association. Around 39% of formulations still use chemistries facing regulatory withdrawal for reasons unconnected to performance.
Bio-based starch and cellulose opacifiers grow at 8.4%, half again the market rate of 5.6%, because synthetic polymer opacifiers are caught by microplastics restrictions and titanium dioxide carries reputational exposure that spread from food regulation. Wax and fatty alcohol systems follow at 6.9%. East Asia holds 33% of ingredient revenue, above the usual band. Suppliers closing the covering power gap take specifications immediately, since formulators are choosing now. Nobody switches for performance reasons here.
Replacement is expensive and worse. Natural alternatives cost roughly 2.7 times what they displace and deliver 34% less covering power per unit, so formulators use more of a dearer material to achieve the same appearance. About 17% of brands have concluded the sensible answer is to remove opacity altogether. That decision eliminates the ingredient spending rather than redirecting it toward any alternative chemistry at all. Clear formulation is simply cheaper.
Market Definition
This market covers opacifying and pearlising agents supplied for cosmetic and personal care formulation, including titanium dioxide based opacifiers, synthetic polymer opacifiers, mineral and mica based opacifiers, bio-based starch and cellulose opacifiers, wax and fatty alcohol opacifiers, and silica and silicate opacifiers. It excludes colour pigments and dyes, sunscreen filters, thickeners and rheology modifiers sold for viscosity alone, finished cosmetic products, and opacifiers supplied to paint, coatings, or plastics applications.
Base Year Value
$1.6B in 2025 (MMA Primary Research Dataset, September 2026)
Forecast Period
2026 to 2036, eleven discrete annual values
CAGR
5.6% base case. Bull 6.8%. Bear 4.4%.
Fastest Growth Segment
Bio-Based Starch And Cellulose Opacifiers: 8.4% CAGR
Fastest Growth Country
India: 9.6% CAGR
Fastest Growth Region
South Asia and Pacific: 7.6% CAGR
Largest Region
East Asia: 33% of 2025 global value
Market Leaders
BASF, Croda, Dow, Clariant, and Ashland lead the field. Source: MMA Primary Research Dataset, July 2026.
Primary Survey
n=3,800 procurement and R&D decision-makers, Q4 2025, six countries
Methodology
Demand-side build-up, cross-validated against public data, 47 expert interviews

Opacifying Cosmetic Products Market Forecast Scenarios

opacifying-cosmetic-products-market-size-forecast-scenario-1790012719454
Between 2020 and 2025 this market was rewritten by regulation rather than by any change in what formulators wanted. Microplastics restrictions caught the synthetic polymer particles that had been the default opacifier for rinse-off products, and titanium dioxide acquired reputational exposure through food regulation that spilled into personal care. Historical growth of 4.2% covers volume decline against rising value per kilogram.
The base case at 5.6% rests on three mechanisms. Bio-based alternatives replace restricted chemistries at roughly 2.7 times the price, which lifts value even as tonnage falls. Reformulation itself generates repeat specification work as brands move ranges across markets on different timetables. And personal care manufacturing continues expanding across Asia, where volume growth partly offsets what regulated markets are removing. None of the three rests on opacity becoming more useful.
The bull case at 6.8% depends on bio-based opacity performance improving enough to close the 34% covering power gap, which would let formulators switch without increasing use levels. The bear case at 4.4% is transparent repositioning spreading: 17% of brands have already removed opacity rather than replacing it, and that decision eliminates the ingredient spend entirely rather than redirecting it anywhere.

An Aesthetic Under Regulatory Pressure

Nothing in this category does anything for the skin or hair. Opacifiers make a formulation look rich rather than watery, because consumers associate a pearly white lotion with substance and a clear one with dilution. That is a perception rather than a property, and an entire ingredient class with real cost and real regulatory exposure exists to satisfy it. Removing it is technically straightforward and commercially frightening, which is why so few brands have tried.
TOP FIVE CONCENTRATION43%Share of ingredient revenue held by the leading suppliers
RESTRICTED CHEMISTRY SHARE39%Formulations still using opacifiers facing regulatory withdrawal somewhere
BIO-BASED COST PREMIUM2.7xPrice of natural alternatives against the synthetic polymers replaced
OPACITY PER UNIT LOSS34%Reduction in covering power when switching to natural alternatives
AVERAGE INGREDIENT PRICEUSD 8.40Delivered price per kilogram averaged across opacifier chemistries
TRANSPARENT REFORMULATION RATE17%Brands removing opacity entirely rather than replacing the ingredient
Two of the three workhorse chemistries are under pressure at once. Synthetic polymer opacifiers are synthetic microparticles caught by microplastics restrictions with rinse-off phase-outs running through this decade. Titanium dioxide acquired reputational exposure through food regulation that spread into personal care regardless of the different exposure route. Around 39% of formulations still contain something facing withdrawal somewhere.
Replacement is genuinely worse and genuinely dearer. Bio-based starch and cellulose alternatives cost roughly 2.7 times the polymers they displace and deliver 34% less covering power per unit, so formulators use more of an expensive material to reach the same appearance. That arithmetic is why 17% of brands concluded the honest answer was to stop opacifying at all.
"Somebody should say plainly that this whole function is cosmetic in the literal sense. It exists so shampoo does not look like water. The brands that had the confidence to go clear and call it purity solved a regulatory problem, a cost problem, and a positioning problem in one decision."
Practice Director, Specialty Ingredients and Personal Care Chemicals · MMA Chemicals and Materials Practice · September 2026

Market Trends

Microplastics Restriction Removes The Default Chemistry

Synthetic polymer opacifiers are microparticles of exactly the kind European restrictions target, and rinse-off phase-outs run through this decade on a published timetable rather than a proposed one. That removes the chemistry formulators had defaulted to for decades in shampoos, conditioners, and washes. Around 39% of formulations still contain something facing withdrawal somewhere, and the reformulation work involved is generating specification demand that flatters what is genuinely a shrinking function. Phase-out dates are published rather than proposed, so the timetable is known and the decision cannot be deferred indefinitely. Reformulation work flatters a genuinely shrinking function.
Market Impact: Country grows at 9.6%
Bio-Based Replacements Cost More And Cover Less

Starch, cellulose, and mineral alternatives deliver 34% less covering power per unit at roughly 2.7 times the price, which means formulators use more of a dearer material to achieve an identical appearance. They also affect viscosity and stability in ways the polymers did not, which extends development timelines. Suppliers closing the covering power gap take share immediately, because the switching decision is being made across ranges right now rather than eventually. Development timelines lengthen accordingly, and brands facing fixed deadlines have very little room to absorb that. Suppliers closing that gap take share immediately.
Market Impact: Region holds 33% of revenue

Market Opportunities and Growth Drivers

Reformulation Generates Repeat Specification Work Continuously

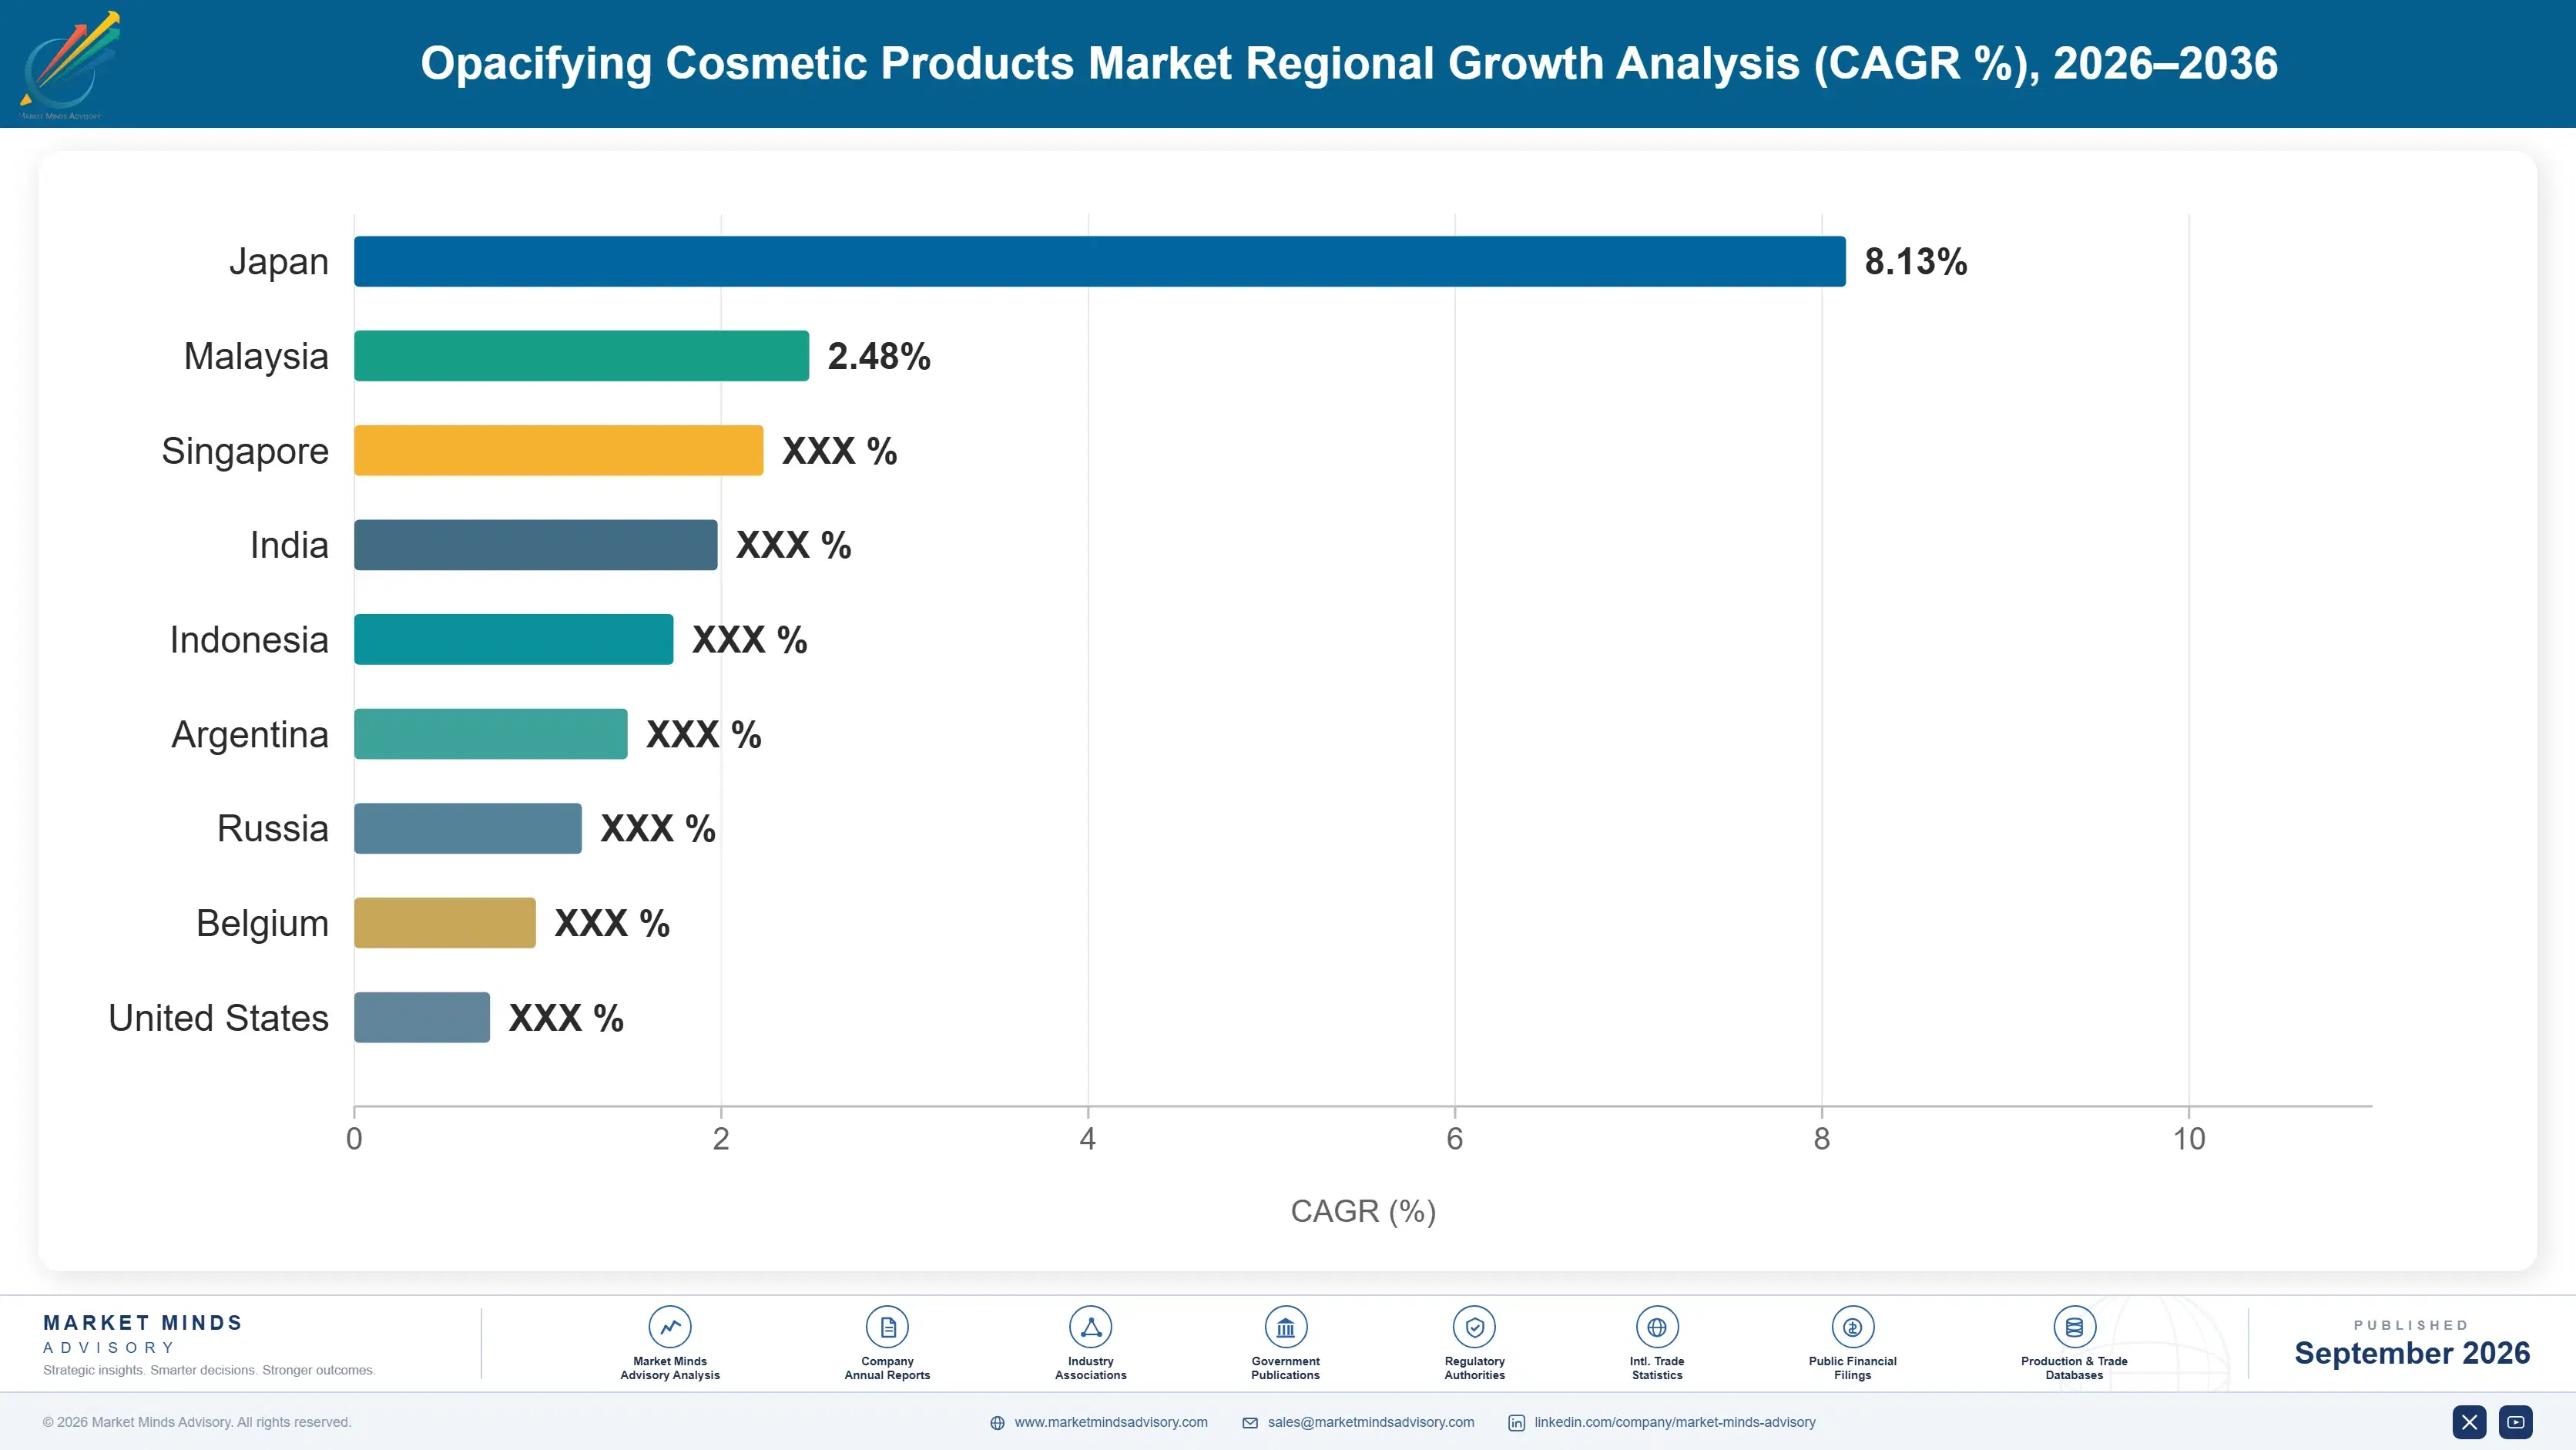
Brands move ranges across markets on different regulatory timetables, which means the same product family is reformulated several times rather than once, and each pass requires supplier support, stability testing, and fresh documentation. Indian growth of 9.6% leads every country covered, driven by personal care manufacturing expansion alongside contract manufacturers reformulating for export customers facing European deadlines rather than domestic ones. Each pass requires supplier support, stability testing, and fresh documentation, which turns one substitution into several separate commercial opportunities for whoever holds the account. One substitution becomes several commercial events.
Market Impact: Removes 17% of demand

Asian Personal Care Manufacture Keeps Expanding

Volume growth in personal care manufacturing across China, India, and Southeast Asia partly offsets what regulated markets are removing, since those markets face lighter restrictions and consumers there associate opacity with quality as strongly as anywhere. East Asia holds 33% of ingredient revenue on manufacturing concentration alone. Suppliers serving both regions must maintain restricted and compliant chemistries simultaneously, which complicates production planning considerably. Consumers there associate opacity with quality as strongly as anywhere, so the aesthetic driver has not weakened at all outside regulated markets. Parallel chemistries complicate production planning considerably.
Market Impact: Covering power falls 34%

Market Restraints and Challenges

Transparent Repositioning Eliminates The Spend Entirely

Around 17% of brands have removed opacity rather than replacing it, and the root cause is arithmetic: natural alternatives cost 2.7 times more and cover 34% less, which makes clear formulation the cheaper answer once somebody questions whether opacity was needed. Commercially this destroys ingredient demand rather than redirecting it. Suppliers respond by improving covering power, by pricing transition support, and by supplying pearlising effects that clear formats can still carry. Clear formulation is cheaper once anybody questions whether opacity was ever needed at all. Demand disappears rather than moving elsewhere.
Market Impact: Affects 39% of formulations

Performance Gap Extends Development Timelines Substantially

Bio-based opacifiers deliver 34% less covering power and interact with viscosity and stability differently from the polymers they replace, and the root cause is that particle geometry and refractive behaviour differ fundamentally between the chemistries. Commercially this lengthens reformulation projects and consumes formulator time brands had not budgeted. Suppliers respond with pre-validated replacement systems, application laboratories that do the work for customers, and starting formulations published openly. Particle geometry and refractive behaviour differ fundamentally, which no amount of use level adjustment fully compensates for. Brands facing fixed deadlines cannot absorb that.
Market Impact: Costs 2.7 times more
3 additional market trends, 4 additional growth drivers, and 2 additional restraints and challenges are covered in the full report. Contact sales@marketmindsadvisory.com to access the complete intelligence.

Segment CAGR and Growth Architecture

Segmentation follows opacifier chemistry. Six categories cover the market: titanium dioxide based opacifiers, synthetic polymer opacifiers, mineral and mica based opacifiers, bio-based starch and cellulose opacifiers, wax and fatty alcohol opacifiers, and silica and silicate opacifiers. Application support and regulatory documentation are counted within the chemistry they accompany rather than separately. Toll manufacture sits within the chemistry produced.
opacifying-cosmetic-products-market-market-share-analysis-1790012720045

Bio-Based Starch And Cellulose Opacifiers

Bio-based opacifiers grow at 8.4%, half again the market rate of 5.6%, because the chemistries they replace are being withdrawn rather than because they perform better. Starch and cellulose particles deliver 34% less covering power at roughly 2.7 times the price, so formulators use more of a dearer material for an identical visual result. They also behave differently in viscosity and stability, which extends development work considerably. Suppliers who close the covering power gap will take share immediately, since switching decisions are being made across ranges at this moment rather than eventually. The window for taking position is measured in quarters rather than years. Switching decisions are being made across whole ranges at this moment.
CAGR 8.4%

Wax And Fatty Alcohol Opacifiers

Wax and fatty alcohol systems grow at 6.9% as the pragmatic replacement route for formulators who want an established chemistry rather than a novel one. Glycol distearate and related materials have opacified cleansers for decades, carry no microplastics exposure, and behave predictably in the formulations brands already run. They contribute to viscosity as well as opacity, which formulators can exploit rather than compensate for. Cost sits between the restricted polymers and the bio-based alternatives, which makes this the route chosen where budget rather than positioning drives the decision. Formulators know these materials well, which shortens development considerably against any novel chemistry. Cost sits between the restricted polymers and the bio-based alternatives, which suits budget-led decisions.
CAGR 6.9%
Full segment breakdown across 6 segments available in the complete report.

Regional Architecture and Country Demand Map

Regional shares follow personal care manufacturing location rather than where finished products are sold, and regulatory timetables differ enough to change what each region buys. Three regions sit outside the standard bands for reasons named below. Manufacture and consumption sit in different places from finished demand.

East Asia

At 33% this region sits above the standard band, and the justification is manufacturing concentration: China produces more personal care product than any other region and consumes opacifiers accordingly, while Japanese and Korean formulation houses set aesthetic standards other markets follow. Restrictions are lighter than in Europe, so restricted chemistries remain in wider use here. Growth of 6.6% exceeds the world rate. Suppliers serving both this region and Europe must maintain parallel chemistries, which complicates production planning considerably. Consumers here associate opacity with quality as strongly as anywhere, so the aesthetic driver behind the whole category has not weakened at all. Restrictions are lighter than in Europe, so restricted chemistries remain in wider use across the region.
Share: 33% | CAGR: 6.6% (2026 to 2036)

Western Europe

Regulatory pressure originates here, with microplastics restrictions on synthetic polymer particles running to published phase-out dates and titanium dioxide carrying reputational exposure that spread from food regulation. Reformulation activity is consequently the most intense anywhere. Growth of 4.1% is the slowest of the seven regions, because value per kilogram rises while tonnage falls and the two largely offset. Transparent repositioning is also furthest advanced here, which removes demand rather than redirecting it. Transparent repositioning is furthest advanced here, which removes ingredient demand rather than redirecting it toward any compliant alternative chemistry. Reformulation activity is the most intense anywhere, and microplastics restrictions run to published phase-out dates rather than proposals. Titanium dioxide carries reputational exposure that spread from food regulation.
Share: 24% | CAGR: 4.1% (2026 to 2036)
Regional intelligence for 5 additional markets available in the complete report: North America, South Asia and Pacific, Latin America, Middle East and Africa, Eastern Europe. Contact sales@marketmindsadvisory.com.
opacifying-cosmetic-products-market-country-cagr-analysis-1790012720578

Where Suppliers Win Reformulation Work

Four commercial moves separate suppliers capturing the reformulation wave from those defending chemistries on withdrawal timetables. Each recognises that customers are choosing replacements right now, and that whoever removes the most work from a formulator wins the specification. Sustainability positioning alone secures very little here, since every alternative claims it. Every alternative claims it now.

Close The Covering Power Gap First

Bio-based alternatives deliver 34% less opacity per unit, which forces higher use levels of a material already costing 2.7 times more and makes the whole switch harder to justify internally. Suppliers narrowing that gap win 3.4 times more replacement specifications than those competing on sustainability credentials alone. Formulators are making these decisions now rather than eventually, so the window for taking position is measured in quarters rather than years. Use levels rather than headline price decide the total formulation cost customers actually pay. Formulators choose now, not eventually. Quarters, not years, decide it.
Market Impact: Wins 3.4 times more replacement specifications than rivals

Supply Validated Replacement Systems Not Ingredients

Bio-based particles interact with viscosity and stability differently, which consumes formulator time nobody budgeted and lengthens projects considerably. Suppliers providing pre-validated replacement systems with published starting formulations shorten customer development by 38 to 52% and win specifications competitors lose on technical support alone. The application laboratory work costs real money and it is what converts an ingredient offer into a specification the customer can actually implement. Whoever removes the most work from a formulator wins the specification, whatever the price comparison shows. Datasheets alone lose these awards. Implementation beats specification here.
Market Impact: Shortens customer development work by 38 to 52%

Sell Pearlising Effects Into Clear Formats

Around 17% of brands have removed opacity rather than replacing it, which eliminates ingredient demand rather than redirecting it anywhere useful. Suppliers offering suspended pearlising and visual effects that clear formulations can still carry retain 2.6 times more of those accounts than those treating transparency as lost business. The brand keeps a visual signal, the supplier keeps a specification, and neither has to defend a chemistry facing withdrawal. Treating transparency as lost business concedes an account that could have been retained. A visual signal survives without opacity. Neither party loses anything.
Market Impact: Retains 2.6 times more of converted brand accounts

Maintain Parallel Chemistries Across Regulatory Timetables

European restrictions bind on published dates while Asian markets face lighter requirements, and brands move ranges across markets on different schedules rather than all at once. Suppliers maintaining both restricted and compliant chemistries capture 2.9 times more of a customer's global range than those who withdrew early on principle. It complicates production planning and it keeps the supplier present through every stage of a transition running over several years. Withdrawing early on principle looks decisive and cedes the transition to somebody willing to stay. Transitions run for several years. Presence throughout is the point.
Market Impact: Captures 2.9 times more of a customer range

Who Controls the Margin Pool

Concentration is moderate. Five suppliers hold 43% of ingredient revenue, measured consistently on that basis across all participants, and the field mixes large specialty chemical groups with starch and cellulose producers entering from food and industrial applications. Those entrants bring raw material positions the incumbents lack and rarely bring the application support formulators need.
Competition currently turns on three things: covering power per unit against the restricted chemistries being replaced, application laboratory support that removes work from the customer's formulator, and regulatory documentation covering multiple jurisdictions on different timetables. Price matters at the margin and decides considerably less than support does during a reformulation. Raw material access matters where cost decides, and it secures nothing where the customer needs a working formulation delivered against a regulatory deadline.

Pressure comes from two directions. Starch and cellulose producers enter with cost advantages from adjacent industries. Meanwhile transparent repositioning removes demand entirely from a growing minority of ranges. Rankings will shift toward suppliers who close the performance gap and supply working systems, since neither raw material access nor sustainability positioning alone secures a specification. Material-only suppliers hold the weakest position here.
opacifying-cosmetic-products-market-company-positioning-matrix-1790012721101

Competitive Moat and Risk Dimensions

BASF

Moat: Breadth Across Replacement Chemistries

Holding restricted, mineral, wax, and bio-based opacifier chemistries together lets the company serve a customer through an entire transition rather than at one stage of it, and brands moving ranges across markets on different timetables value that continuity highly. Competitors offering one replacement route must displace an incumbent at every step.
BASF

Risk: Legacy Chemistry Revenue Decline

A meaningful share of revenue sits in chemistries facing published withdrawal dates in the region where regulation is tightest, and that decline is scheduled rather than uncertain. Replacing it with bio-based volumes means competing against starch producers whose raw material positions were built for entirely different industries.
CRODA

Moat: Application Support And Formulation

Application laboratory capability that hands formulators working starting formulations rather than ingredient specifications removes exactly the work reformulation creates, and that is what decides specifications during a transition. Competitors supplying materials without support lose to it consistently, whatever the underlying price comparison suggests. Support decides these awards.
CRODA

Risk: Cost Position Against Entrants

Starch and cellulose producers entering from food and industrial applications carry raw material cost positions built at a completely different scale, and they price accordingly where customers weigh cost above support. Defending margin means keeping the technical service advantage visible in every account it serves.

Players Tracked

Prominent Players

BASF
Croda
Dow
Clariant
Ashland

Other Key Players

Evonik
Lubrizol
Innospec
Stepan
Nouryon
Sasol
Kao Chemicals
Nikkol
Seppic
Roquette
Agrana
Cargill
Merck KGaA
Sun Chemical
Ingredion

Recent Developments

JANUARY 2026

Croda Releases Bio-Based Opacifier Matching Synthetic Covering Power

Croda released a cellulose-derived opacifier engineered to match the covering power of the synthetic polymers being withdrawn, addressing the use level penalty that had made bio-based replacement expensive for formulators. Use levels rather than headline price determine what a substitution actually costs a customer, which the company priced against directly.
Signal: Closing the performance gap decides specifications more than sustainability positioning ever has. Use levels decide cost.
SEPTEMBER 2025

BASF Acquires Starch Based Specialty Ingredient Manufacturer For Raw Access

BASF completed an acquisition of a starch based specialty ingredient manufacturer, obtaining raw material positions built for food applications that competitors entering personal care from adjacent industries already held. Agricultural feedstock positions built at food industry scale price differently from anything a specialty chemical group assembles independently.
Signal: Incumbents are buying agricultural raw material access that entrants brought with them. Scale came from elsewhere.
MAY 2025

Clariant Signs Reformulation Transition Agreement With Personal Care Manufacturer

Clariant entered a multi-year supply agreement covering a personal care manufacturer's transition away from restricted opacifiers, spanning several markets on different regulatory timetables with no acquisition involved. Markets bind on different dates, so the customer needed one supplier able to serve both restricted and compliant requirements throughout.
Signal: Transitions run for years across markets, which rewards suppliers holding several chemistries at once. Continuity matters most here.

What Opacifiers Cost To Supply

Three input groups dominate cost. Raw material feedstock runs 34% to 42% of cost of goods sold, spanning mineral, petrochemical, and increasingly agricultural sources with quite different price behaviour. Processing and particle engineering take 26% to 34%, since opacity depends on particle size and refractive behaviour more than chemistry. Regulatory documentation and safety substantiation add 20% to 28%, which is unusually high for a specialty ingredient.
Compliance costs rose sharply through 2024 and 2025 as European microplastics restrictions took effect and suppliers documented alternatives across multiple jurisdictions, and several described the additional regulatory and application expense in their annual reports for those years. European Commission publications set the phase-out dates that determine when each customer must switch, which concentrates reformulation demand into defined windows rather than spreading it. Demand concentrates into defined reformulation windows.

The competitive disadvantage mechanism runs through application support rather than raw material cost. A supplier offering an ingredient without a working starting formulation leaves the formulator to solve viscosity and stability problems the substitution creates, and that work decides the specification. Exposure varies sharply by supplier type: specialty houses carry application laboratories, while producers entering from food or industrial markets frequently do not.
opacifying-cosmetic-products-market-cost-volatility-analysis-1790012721298

Fund Application Laboratories Rather Than Sales Coverage

Reformulation creates viscosity and stability problems the customer's formulator must solve, and whoever solves them wins the specification regardless of price comparison. Application capability costs more than sales headcount and converts an ingredient offer into something a customer can implement immediately, which is what decides awards during a transition window. Transition windows are short and unforgiving.

Engineer Particle Geometry Before Changing Chemistry

Opacity depends on particle size distribution and refractive behaviour rather than on chemical identity, and much of the covering power gap in bio-based alternatives reflects geometry rather than material limits. Engineering the particle rather than accepting what the feedstock delivers narrows the use level penalty that makes replacement expensive. Feedstock limits explain less than most assume.

Document Compliance Across Jurisdictions Simultaneously

Brands move ranges across markets on different regulatory timetables, and a supplier documented in one jurisdiction cannot serve the rest of the range. Preparing substantiation for several jurisdictions at once costs more upfront and captures the whole transition rather than a single market's worth of it. Single-market documentation wins a fraction of the range.

Portfolio Architecture for Margin Defence

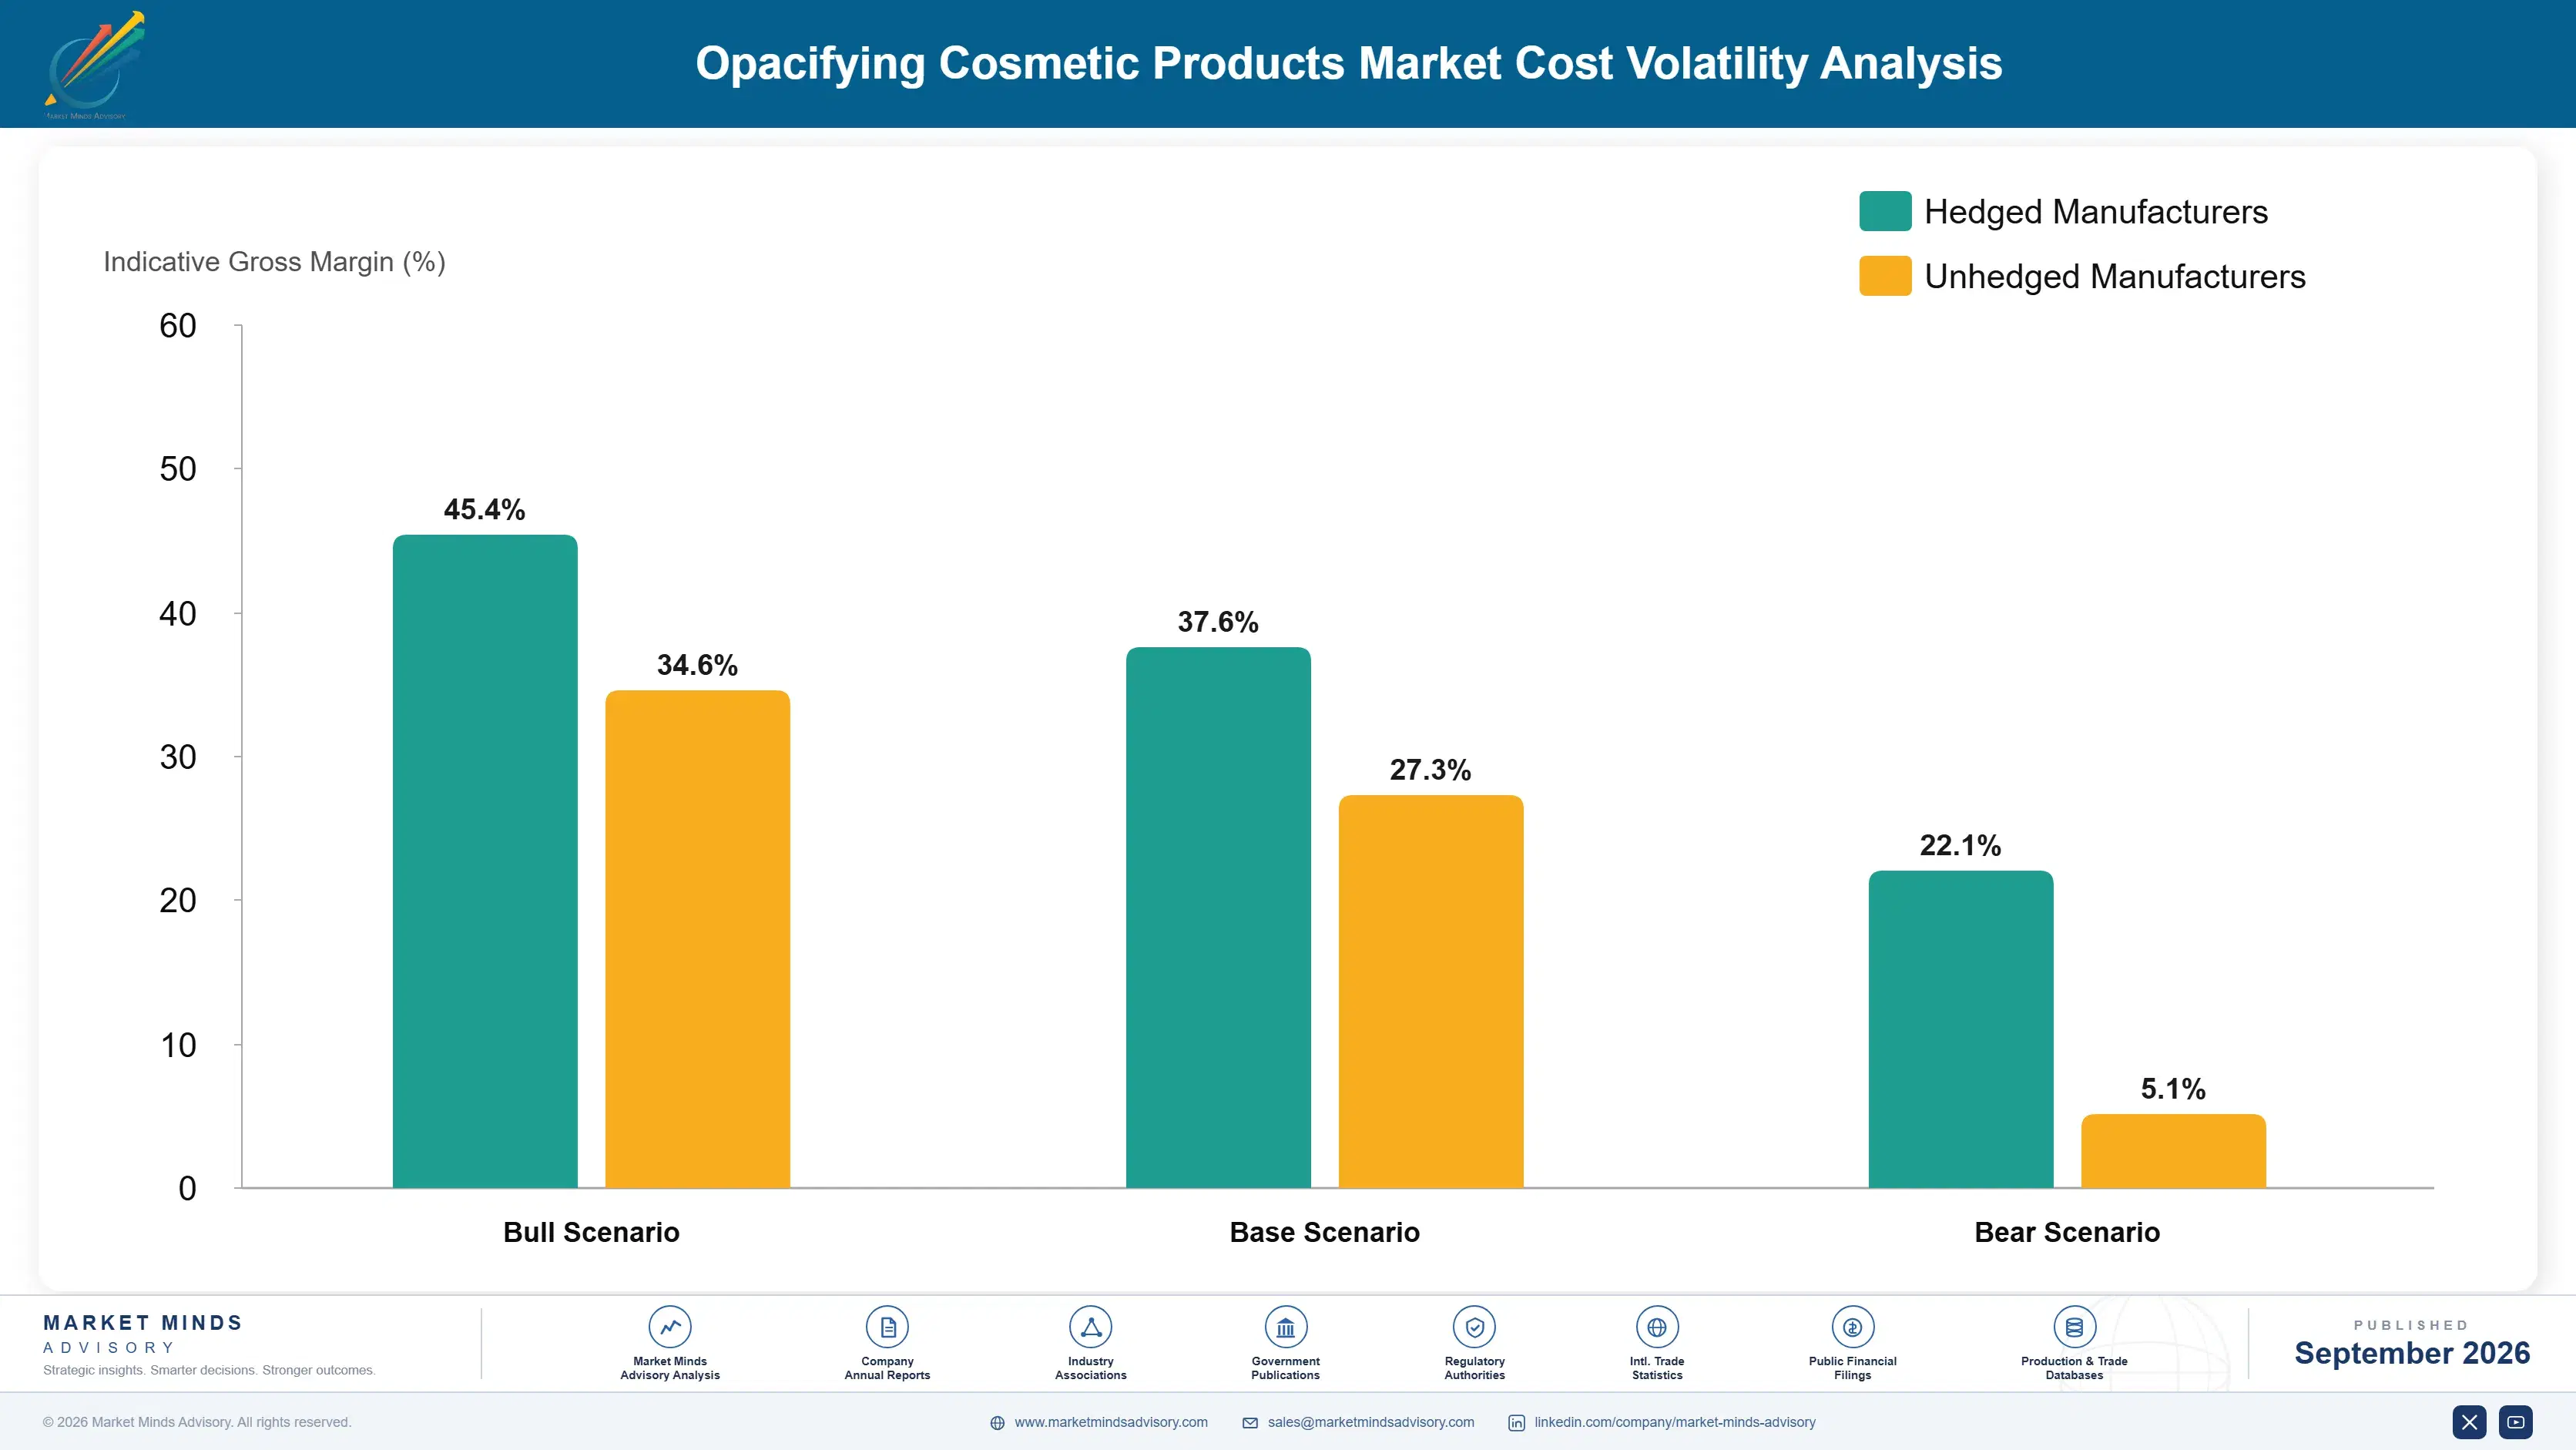
Margin follows how much work the supplier removes from the customer. Commodity mineral and wax opacifiers are close to pass-through, since formulators know how to use them and price decides. Silica and mica systems earn moderately. Validated bio-based replacement systems earn most, because the customer is buying a solved formulation problem rather than a material, and that is what a transition actually requires. Work removed from the customer rather than chemistry decides this hierarchy.
The tension between volume and premium runs through where the customer sits in the transition. A manufacturer in a lightly regulated market buys the cheapest adequate opacifier and switches supplier on price. A brand facing a published phase-out date across several markets buys support, documentation, and continuity, and does not treat the material as interchangeable at all.

High-value pools concentrate where compliance is compulsory and timing is fixed: European rinse-off ranges under microplastics phase-out, global brands harmonising across jurisdictions, and contract manufacturers reformulating for export customers. Where regulation does not bind, opacifiers are a commodity and buyers compare price per kilogram like any other bulk ingredient. Price per kilogram decides those.

Volume / Commodity-Adjacent

Established mineral and wax opacifiers sold into markets where regulation does not bind and formulators already know how to use them. The ten-point range reflects feedstock position and manufacturing scale rather than any technical difference between suppliers.
Gross Margin: 20% to 30%

Premium / Certified

Silica, mica, and engineered mineral systems where particle geometry rather than chemistry determines performance and application support influences the specification. The twelve-point range separates suppliers with application laboratories from those supplying materials with a datasheet alone.
Gross Margin: 34% to 46%

Sustainability / Regulatory / Next-Generation

Validated bio-based replacement systems supplied with starting formulations and multi-jurisdiction documentation for brands facing published phase-out dates. The fourteen-point range reflects how completely each supplier closes the covering power gap customers must otherwise absorb.
Gross Margin: 48% to 62%
opacifying-cosmetic-products-market-portfolio-architecture-1790012721807

High-value Sub-segments and Strategic Watch-out

Validated Bio-Based Systems

Highest value and fastest growth at 8.4%, sold as solved formulation problems rather than as materials to customers facing fixed phase-out dates. The fourteen-point range reflects how far each supplier has closed the covering power gap against restricted chemistries. Deadlines are published rather than proposed.
Gross Margin: 50% to 64%

Clear Format Pearlising Effects

Emerging value retaining accounts that removed opacity entirely, which would otherwise eliminate the specification rather than redirect it. The fourteen-point range reflects visual effect quality, since a poor suspension in a clear base is immediately visible. Otherwise the specification disappears entirely. Suspension quality decides adoption here.
Gross Margin: 44% to 58%

Wax And Fatty Alcohol Systems

Volume core chosen where budget rather than positioning drives replacement, using established chemistry with no microplastics exposure. The twelve-point range reflects feedstock position, since these materials are widely available from several suppliers at comparable quality. Formulators already know how to use them. Several suppliers offer comparable quality.
Gross Margin: 32% to 44%

Restricted Polymer Opacifiers

The strategic watch-out. Phase-out dates are published rather than proposed, demand declines on a schedule nobody controls, and remaining volume sits in markets that will eventually follow. The ten-point range reflects scale and nothing defensible. Other markets will eventually follow Europe. Decline follows a published schedule.
Gross Margin: 18% to 28%

How This Demand Repeats

Ingredient demand recurs with the customer's production volume, which makes it steady until a formulation changes and then abruptly not. Reformulation is therefore both the opportunity and the risk in this market: a supplier winning the replacement specification holds the volume for years, and one losing it loses everything at once rather than gradually. Transitions concentrate that decision into a defined window. Winning or losing happens once rather than gradually.
Attachment depth follows the specification document rather than any commercial relationship. An ingredient written into a validated formulation with stability data behind it does not change without repeating that work, which nobody does to save a few percent on a material cost. A supplier delivering an interchangeable commodity has no attachment whatever and competes on price at every purchase order.

The buyer has shifted from procurement toward formulation and regulatory affairs. Opacifiers were once purchased on price against a specification somebody else had written years earlier. Reformulation moved the decision to formulators solving viscosity and stability problems and to regulatory teams checking jurisdiction coverage, both of whom weigh support and documentation above price per kilogram. Documentation coverage now decides more than price does.
opacifying-cosmetic-products-market-end-use-penetration-index-1790012722300

Where This Market Rewards

These are among the four positions where our research anticipates prominent divergence between winners and laggards over the coming forecast period. Each is grounded in the demand model, the regulatory perimeter, and the announced capacity pipeline.
01 / PERFORMANCE GAP CLOSURE

Cover better or lose the specification

Bio-based alternatives deliver 34% less opacity per unit at roughly 2.7 times the price, which forces higher use levels of a dearer material and makes every switch harder to justify internally. Suppliers narrowing that gap win 3.4 times more replacement specifications than those competing on sustainability positioning alone. Formulators are choosing now rather than eventually, so the window for taking position is measured in quarters, and use levels rather than headline price decide total formulation cost, which most tender processes still fail to model properly.
02 / SOLVED PROBLEM SELLING

Ship the formulation, not the ingredient

Bio-based particles interact with viscosity and stability differently from the polymers they replace, consuming formulator time nobody budgeted and lengthening projects considerably beyond plan. Suppliers providing validated replacement systems with published starting formulations shorten customer development by 38 to 52% and win specifications on support rather than price. Application laboratory capability costs real money and it is what converts an offer into an implementation, which is what a customer facing a deadline actually needs delivered, and application laboratory capability is what makes that possible.
03 / TRANSPARENT ACCOUNT RETENTION

Clear formats still want visual signals

Around 17% of brands removed opacity rather than replacing it, which eliminates ingredient demand instead of redirecting it toward any alternative chemistry. Suppliers offering suspended pearlising and visual effects that clear formulations can carry retain 2.6 times more of those accounts than those treating transparency as lost business. The brand keeps a visual cue and the supplier keeps a specification through a decision that would otherwise end both, which treating transparency as lost business simply concedes, ending a specification that could have been retained instead.
04 / PARALLEL CHEMISTRY MAINTENANCE

Transitions run for years, not quarters

European restrictions bind on published dates while Asian markets face considerably lighter requirements, and brands move ranges across markets on staggered schedules rather than all at once. Suppliers maintaining both restricted and compliant chemistries capture 2.9 times more of a customer's global range than those withdrawing early on principle. It complicates production planning and keeps the supplier present through every stage of a multi-year transition, and withdrawing early cedes that transition to somebody else, who then holds the account through every subsequent stage.

Engagement Snapshot From the Field

A live engagement with an industry participant carrying material or product regulatory and market exposure ahead of a defining policy shift, showing how our research translates into a defensible multi-year portfolio strategy.
MARKET MINDS ADVISORY · CLIENT ENGAGEMENT SUMMARY
Opacifying Cosmetic Products Producer Strategic Portfolio Review and Transition Roadmap 2026·Investment Scenario on Opacifying Cosmetic Products Exposure Evaluation 2025-26
CLIENT PROFILE
A personal care manufacturer producing rinse-off and leave-on ranges across fourteen markets, using synthetic polymer opacifiers in roughly 180 formulations with annual opacifier spending near USD 9.4 million (client-reported, unverified by MMA). European phase-out deadlines applied to about 40% of that portfolio. Reformulation had begun in three markets already and was running behind schedule everywhere.
STRATEGIC CHALLENGE
Procurement had run a tender for bio-based replacements and selected on price per kilogram, and the resulting formulations required higher use levels that eliminated the saving. Nobody had compared suppliers on covering power per unit, and reformulation timelines were already running behind the regulatory deadline. Nobody had modelled total formulation cost.
MMA APPROACH
MMA tested candidate opacifiers for covering power at equivalent use levels, modelled total formulation cost rather than ingredient price, and assessed each supplier's application support against the viscosity and stability work each substitution actually required across the affected formulations. Multi-jurisdiction documentation coverage was checked for every candidate supplier separately. Clear-format candidates were identified.
KEY FINDINGS
  1. The lowest priced bio-based candidate required 61% higher use levels, making the finished formulation more expensive than a competitor priced considerably above it per kilogram.
  2. Two suppliers provided validated starting formulations covering most affected product types, and projects using those completed in roughly half the time of the others.
  3. Around 34 of the 180 formulations were clear-format candidates where opacity served no purpose that customers had ever mentioned in research or complaints.
  4. Only one supplier held documentation covering all fourteen markets, and the rest would have required separate substantiation work for the non-European portion of the range.
CLIENT PROFILE
A personal care manufacturer producing rinse-off and leave-on ranges across fourteen markets, using synthetic polymer opacifiers in roughly 180 formulations with annual opacifier spending near USD 9.4 million (client-reported, unverified by MMA). European phase-out deadlines applied to about 40% of that portfolio. Reformulation had begun in three markets already and was running behind schedule everywhere.
STRATEGIC CHALLENGE
Procurement had run a tender for bio-based replacements and selected on price per kilogram, and the resulting formulations required higher use levels that eliminated the saving. Nobody had compared suppliers on covering power per unit, and reformulation timelines were already running behind the regulatory deadline. Nobody had modelled total formulation cost.
MMA APPROACH
MMA tested candidate opacifiers for covering power at equivalent use levels, modelled total formulation cost rather than ingredient price, and assessed each supplier's application support against the viscosity and stability work each substitution actually required across the affected formulations. Multi-jurisdiction documentation coverage was checked for every candidate supplier separately. Clear-format candidates were identified.
KEY FINDINGS
  1. The lowest priced bio-based candidate required 61% higher use levels, making the finished formulation more expensive than a competitor priced considerably above it per kilogram.
  2. Two suppliers provided validated starting formulations covering most affected product types, and projects using those completed in roughly half the time of the others.
  3. Around 34 of the 180 formulations were clear-format candidates where opacity served no purpose that customers had ever mentioned in research or complaints.
  4. Only one supplier held documentation covering all fourteen markets, and the rest would have required separate substantiation work for the non-European portion of the range.
RECOMMENDED STRATEGY
Phase 1: Phase one: reselect suppliers on total formulation cost and covering power per unit rather than on ingredient price per kilogram alone. Phase 2: Phase two: move the 34 identified formulations to clear formats rather than reformulating opacity that serves no stated consumer purpose. Phase 3: Phase three: consolidate onto the supplier holding multi-jurisdiction documentation for the remainder, avoiding duplicated substantiation across markets. One supplier already held it.
OUTCOME
Total opacifier and formulation cost fell 14% against the tendered outcome (client-reported, unverified by MMA). Reformulation completed ahead of the European deadline. The 34 clear-format conversions removed roughly USD 1.1 million of annual ingredient spending permanently. Documentation consolidation removed duplicated substantiation work across eleven remaining markets.

Frequently Asked Questions

Foundational context covering the market sizes, CAGR, scope, country, region and competition that inform every finding below. This section is provided to cover basics and most often pre-purchase conversations, answered from the MMA Primary Research Dataset.

What is the current size of the Opacifying Cosmetic Products Market?

The market was worth USD 1.6 billion in 2025 and reaches USD 1.7 billion in 2026. Value covers opacifying and pearlising agents supplied for cosmetic formulation.

How large will the Opacifying Cosmetic Products Market be by 2036?

MMA forecasts USD 2.9 billion by 2036, an increase of USD 1.2 billion across the forecast period. That represents 1.71 times the 2026 base of USD 1.7 billion.

What is the CAGR for the Opacifying Cosmetic Products Market 2026 to 2036?

The base case compound annual growth rate is 5.6%, with a bull case at 6.8% and a bear case at 4.4%. Historical growth from 2020 to 2025 ran at 4.2%.

Which segment is growing fastest?

Bio-based starch and cellulose opacifiers grow at 8.4%, half again the market rate of 5.6%. They replace chemistries being withdrawn rather than performing any better.

Who are the major companies in the Opacifying Cosmetic Products Market?

BASF, Croda, Dow, Clariant, and Ashland lead, together holding 43% of ingredient revenue. Starch and cellulose producers are entering from adjacent food and industrial applications.

Which country is growing fastest?

India grows at 9.6%, driven by personal care manufacturing expansion alongside contract manufacturers reformulating for export customers facing European regulatory deadlines they do not share.

Report Segmentation Architecture

The full report scope spans multiple orthogonal segmentation dimensions, with cross-tabulated demand data provided for each dimension pair. Coverage extends further to regional breakdowns, trend trajectories, and the competitive detail needed to support segment-level decision-making.

By Opacifier Chemistry

  • Titanium Dioxide Based Opacifiers
  • Synthetic Polymer Opacifiers
  • Mineral and Mica Based Opacifiers
  • Bio-Based Starch and Cellulose Opacifiers
  • Wax and Fatty Alcohol Opacifiers
  • Silica and Silicate Opacifiers

By End-Use Industry

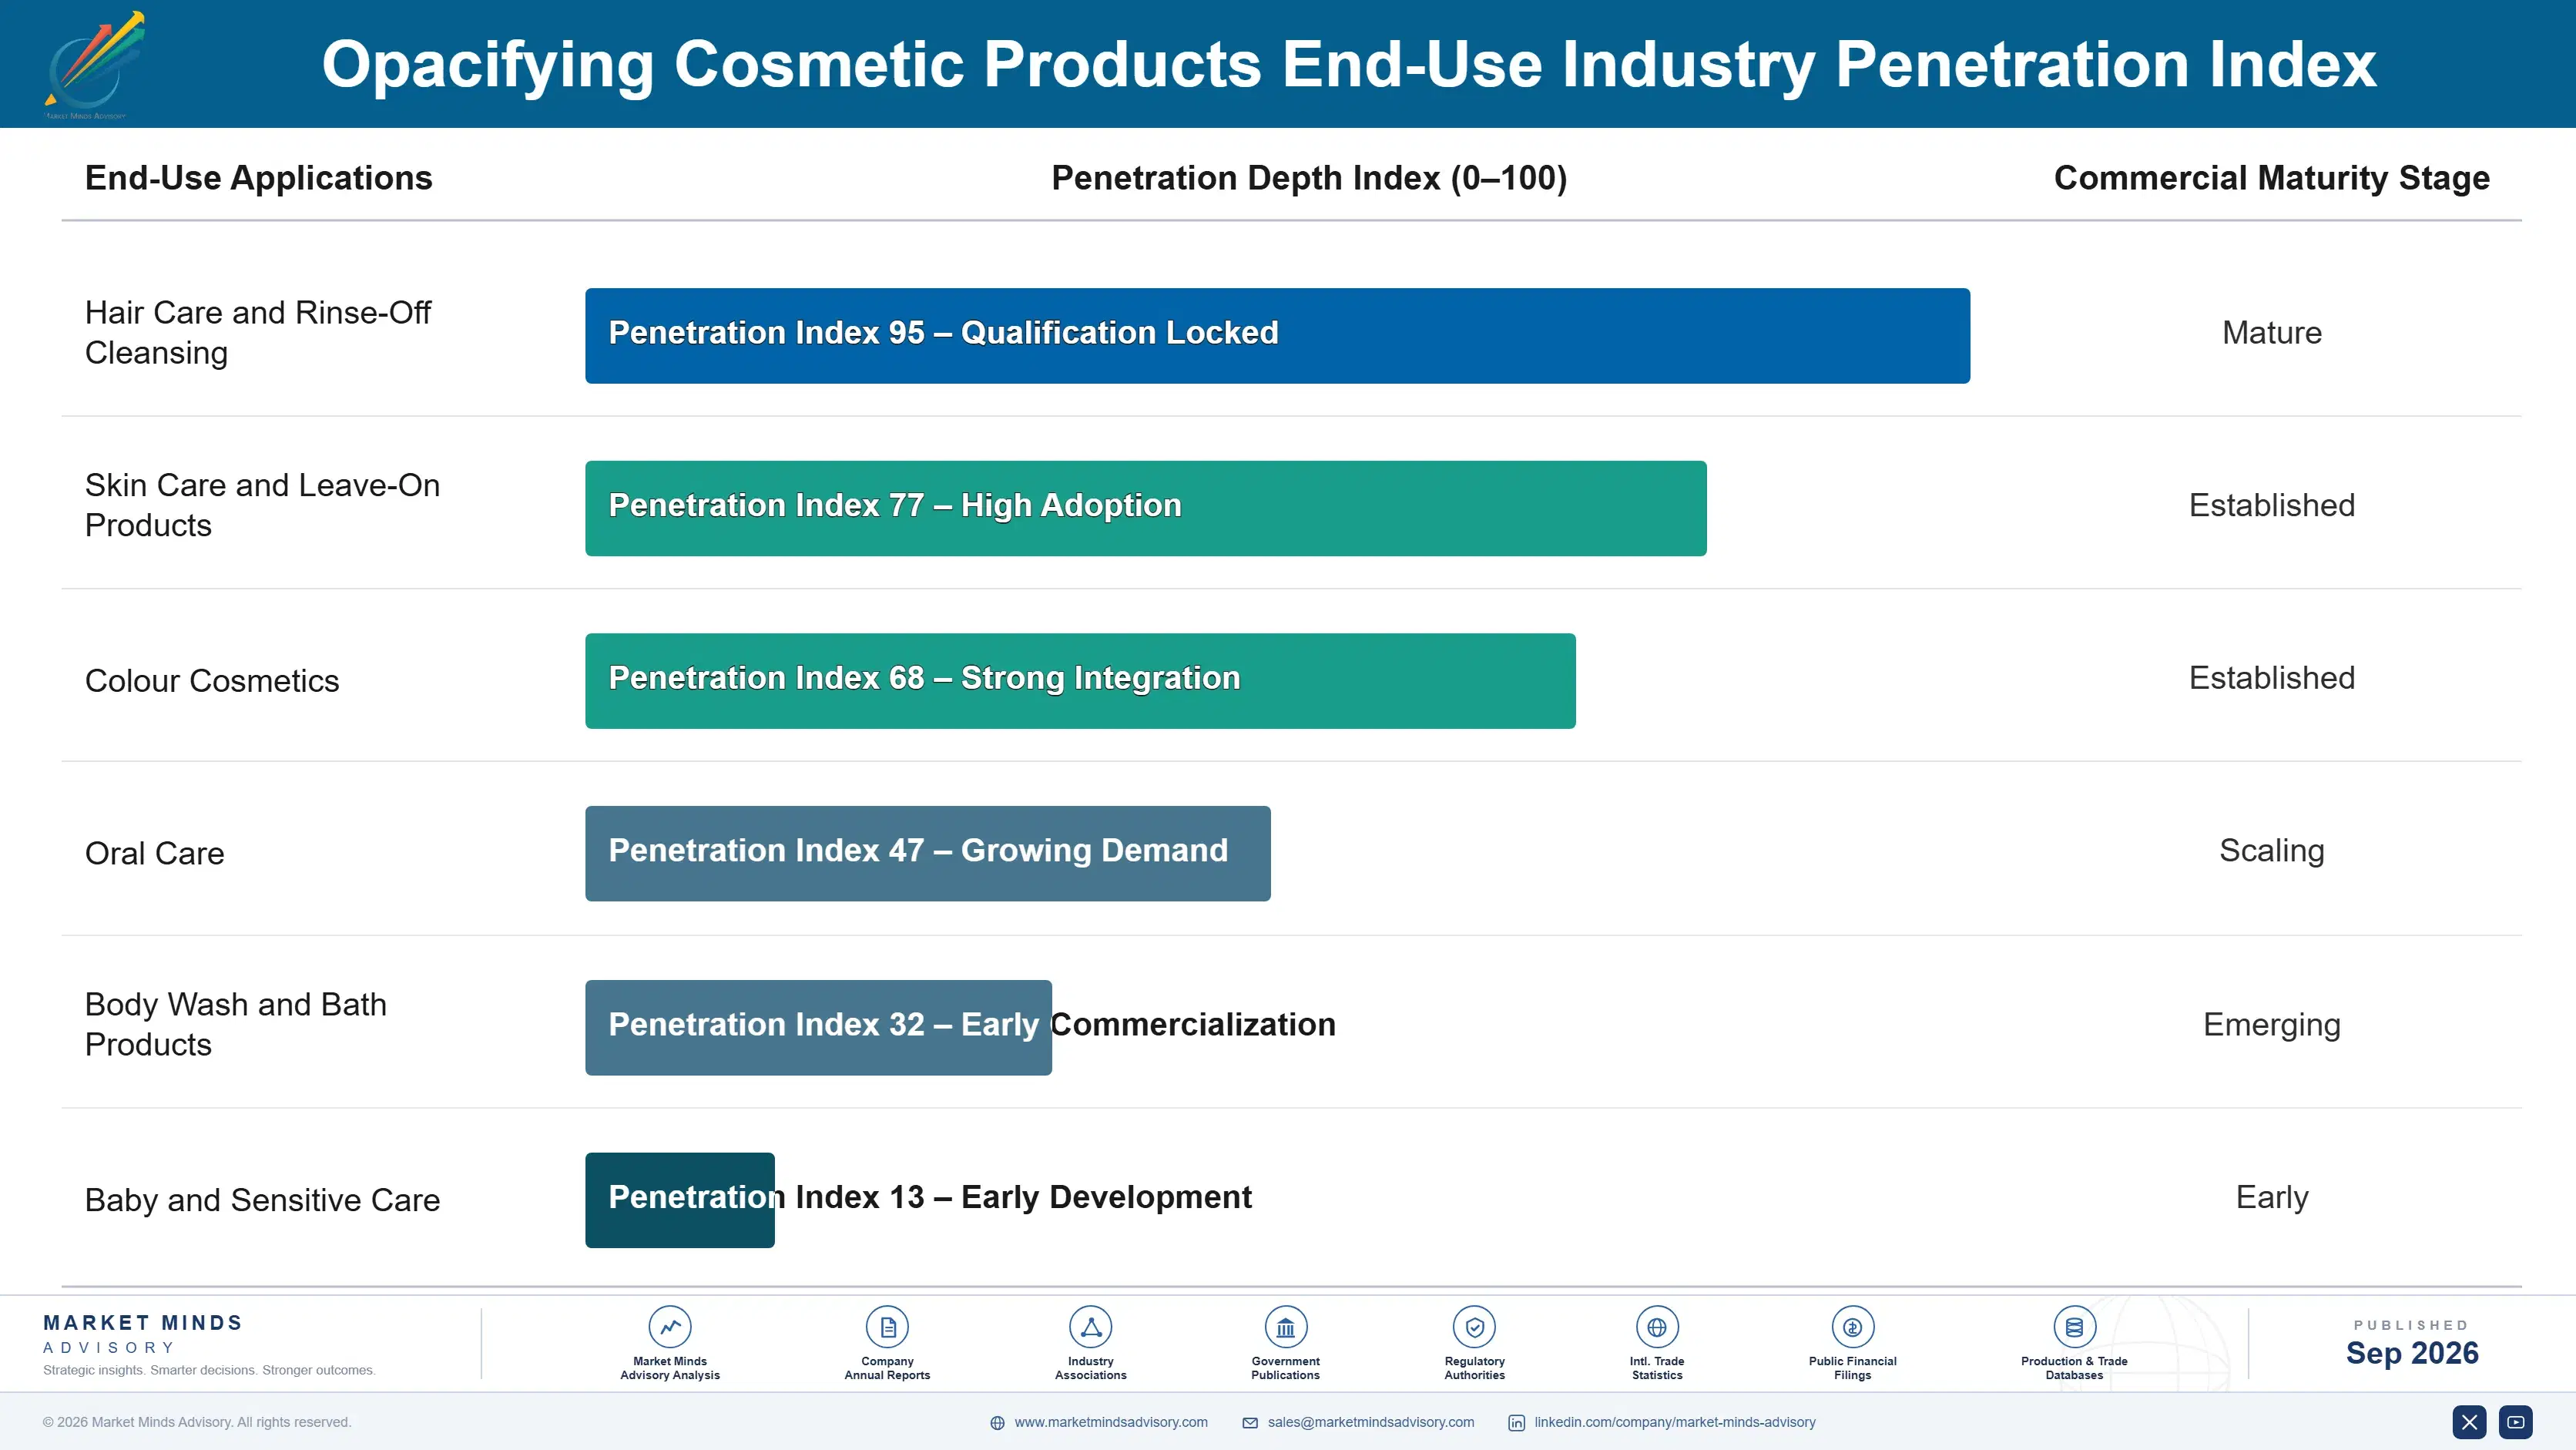
  • Hair Care and Rinse-Off Cleansing
  • Skin Care and Leave-On Products
  • Colour Cosmetics
  • Oral Care
  • Body Wash and Bath Products
  • Baby and Sensitive Care

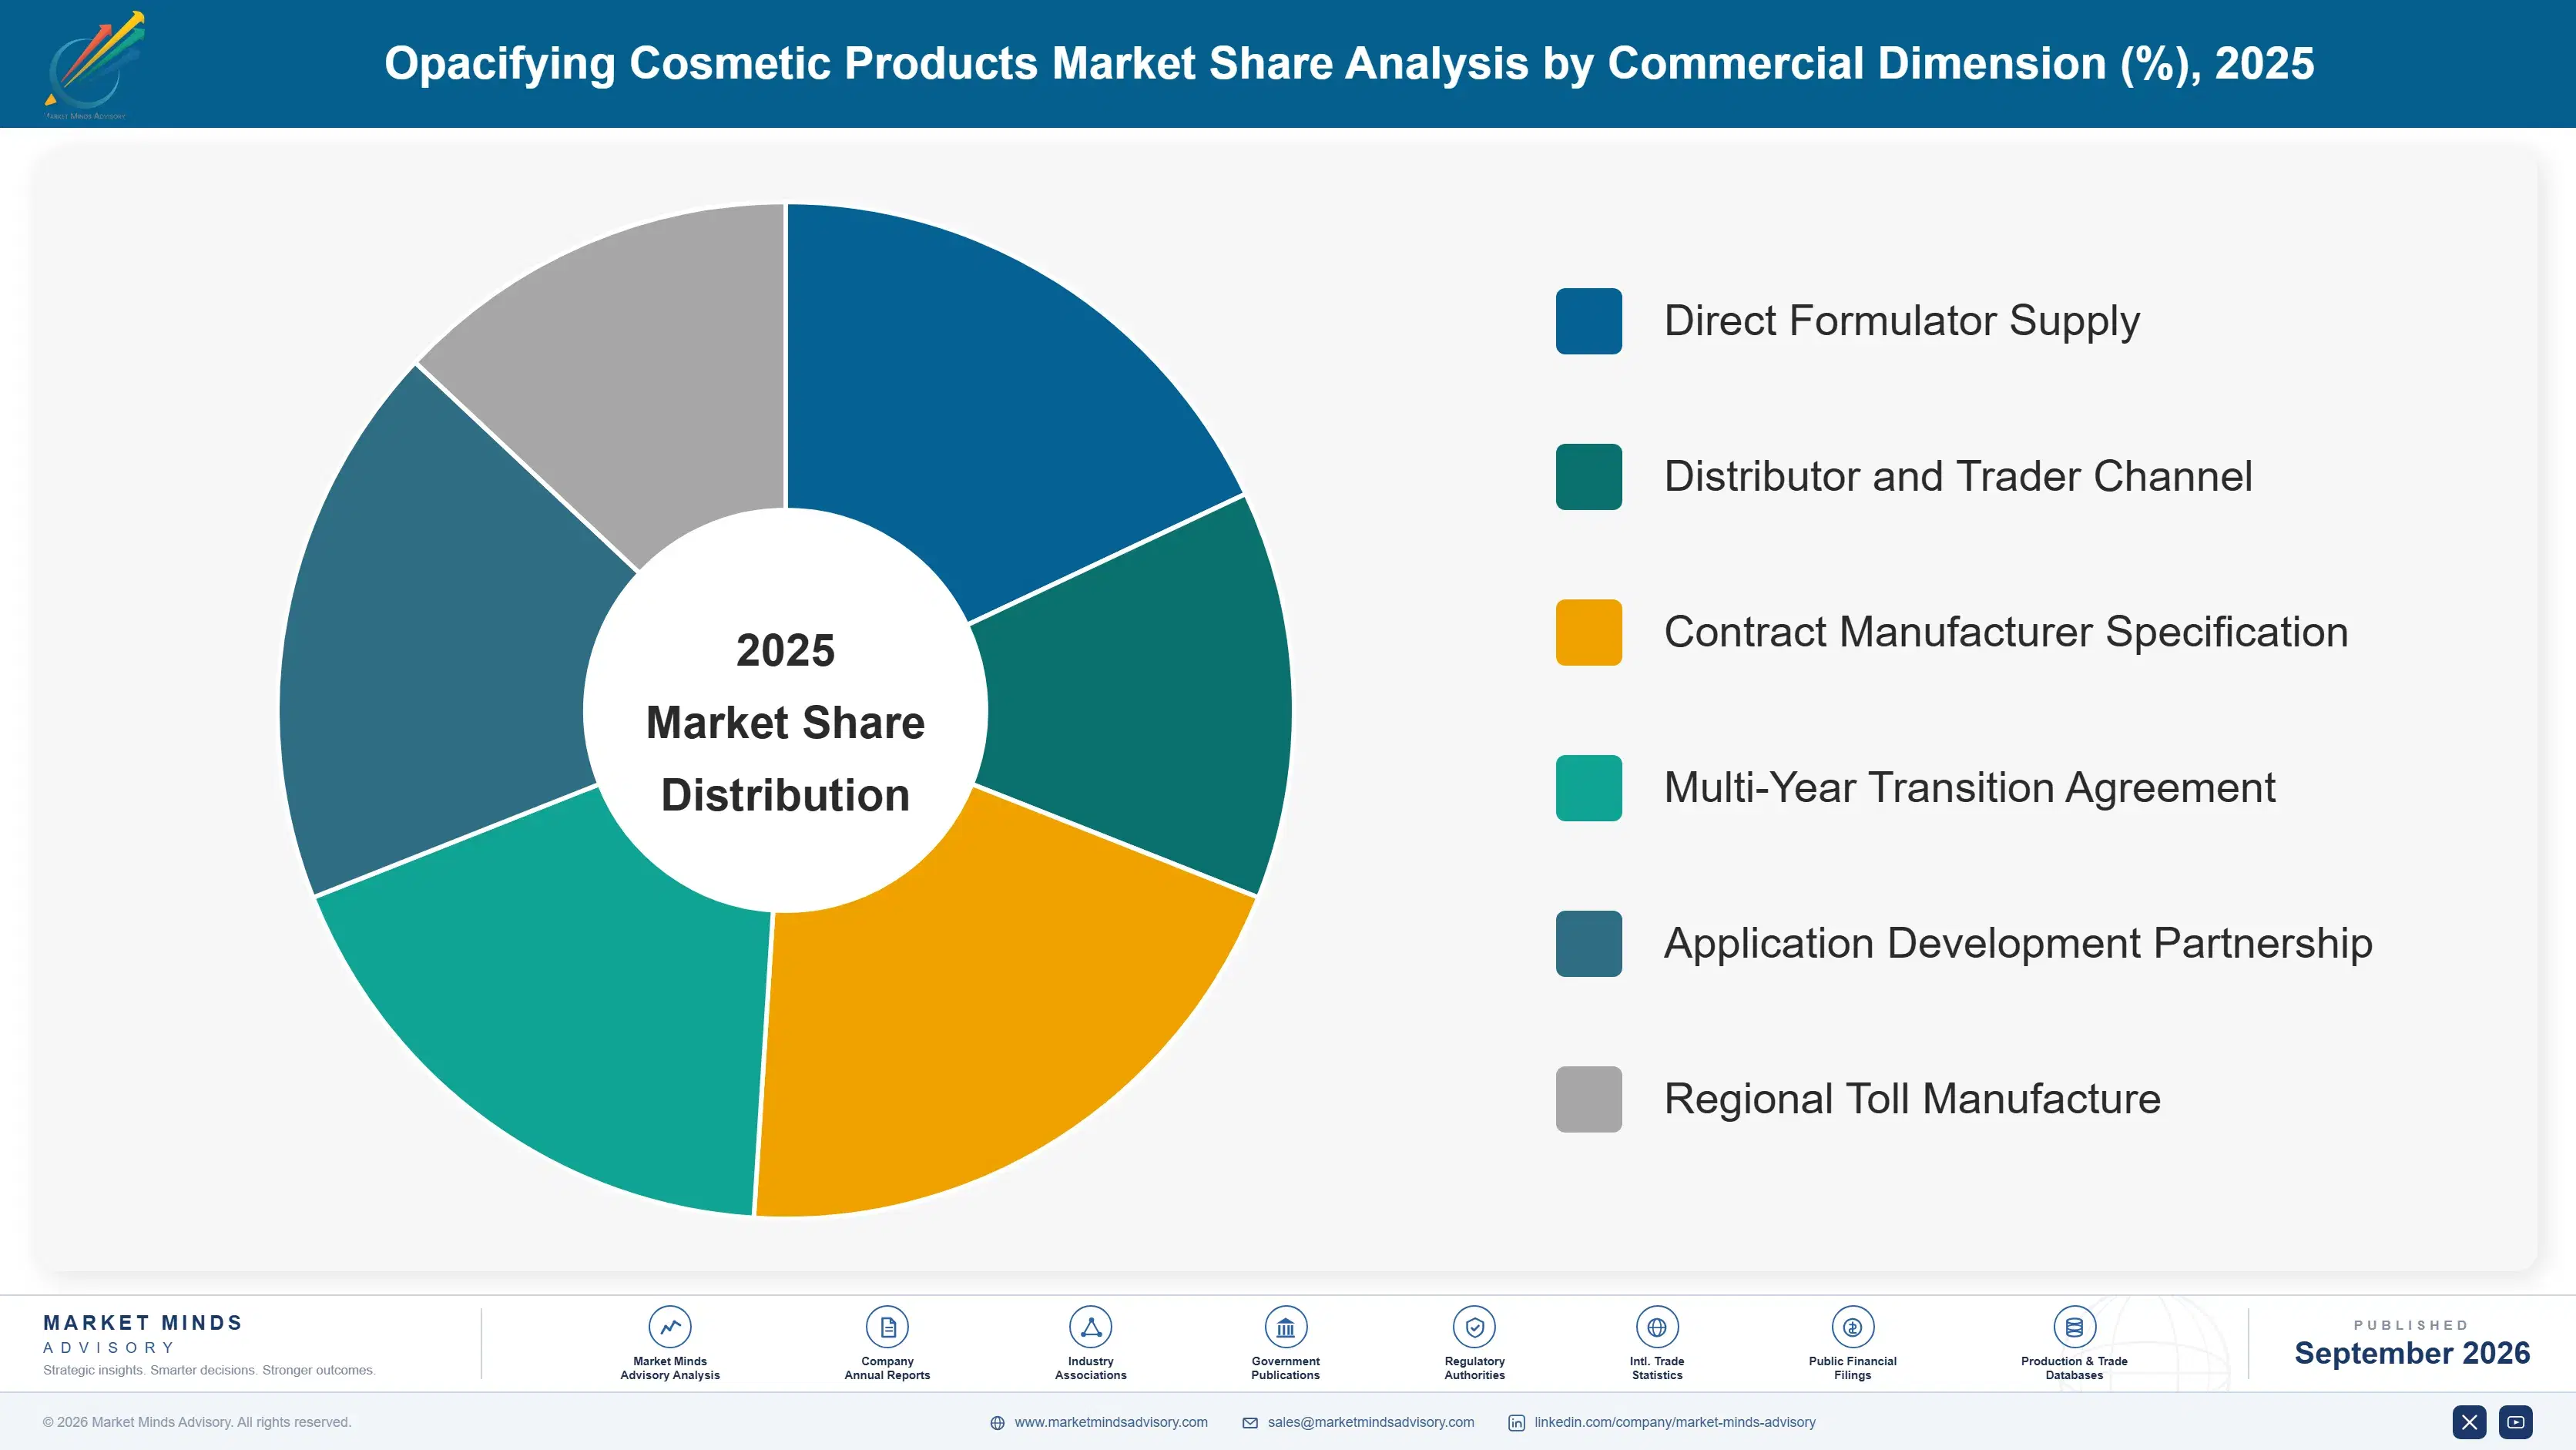
By Commercial Dimension

  • Direct Formulator Supply
  • Distributor and Trader Channel
  • Contract Manufacturer Specification
  • Multi-Year Transition Agreement
  • Application Development Partnership
  • Regional Toll Manufacture

By Region

  • East Asia
  • Western Europe
  • North America
  • South Asia and Pacific
  • Latin America
  • Middle East and Africa
  • Eastern Europe

Scope, Methodology, and Coverage

Every figure in this report is reproducible from documented input assumptions. The scope below maps the historical period, the forecast horizon, the segmentation dimensions, and the countries covered, alongside the underlying primary and qualitative methodology.
Historical Period
2020 to 2025
Forecast Period
2026 to 2036
Base Year
2025 (USD billions; MMA Primary Research Dataset, September 2026)
Market Definition
This market covers opacifying and pearlising agents supplied for cosmetic and personal care formulation, including titanium dioxide based opacifiers, synthetic polymer opacifiers, mineral and mica based opacifiers, bio-based starch and cellulose opacifiers, wax and fatty alcohol opacifiers, and silica and silicate opacifiers. It excludes colour pigments, sunscreen filters, thickeners sold for viscosity alone, finished cosmetic products, and opacifiers supplied to paints, coatings, or plastics.
Quantitative Units
USD billions, ingredient revenue at supplier level
Segmentation Dimensions
Opacifier chemistry, end-use industry, commercial dimension, region
Regions Covered
East Asia, Western Europe, North America, South Asia and Pacific, Latin America, Middle East and Africa, Eastern Europe
Countries Covered
China, Japan, South Korea, Taiwan, Germany, France, United Kingdom, Italy, Spain, Netherlands, Switzerland, Belgium, United States, Canada, Mexico, India, Indonesia, Vietnam, Thailand, Australia, Brazil, Mexico, Colombia, Argentina, Saudi Arabia, United Arab Emirates, Egypt, South Africa, Poland, Czechia
Key Companies Profiled
BASF, Croda, Dow, Clariant, Ashland, Evonik, Lubrizol, Innospec, Stepan, Nouryon, Sasol, Kao Chemicals, Nikkol, Seppic, Roquette, Agrana, Cargill, Merck KGaA, Sun Chemical, Ingredion
Quantitative Methodology
Primary survey, n=3,800 respondents, Q4 2025, six countries; demand-side model with trade association cross-validation
Qualitative Methodology
47 expert interviews, Q4 2025; applied to validate demand model assumptions, identify emerging dynamics, and assess competitive positioning
Report Format
PDF and XLSX data workbook (Word format preview document)
Publisher
Market Minds Advisory
Report Code
MMA-2026-CHM-931
Published
September 2026
Contact
sales@marketmindsadvisory.com | www.marketmindsadvisory.com

Purchase the full Opacifying Cosmetic Products Market Report (2026 to 2036).

The full report sizes the cosmetic opacifier market across six chemistries, seven regions, and thirty countries, with forecasts to 2036 under base, bull, and bear cases. It examines why two workhorse chemistries face withdrawal for reasons unrelated to performance, what bio-based replacement actually costs once use levels are counted, and why a growing minority of brands remove opacity rather than replacing it. Competitive analysis covers twenty participants evaluated consistently on ingredient revenue, with detailed treatment of covering power and application support. Cost structure, margin architecture, and regional regulatory timables are analysed throughout. Primary research includes 3,800 survey responses and 47 expert interviews.
Six opacifier chemistries sized and forecast separately
Twenty participants evaluated on ingredient revenue consistently
Regional regulatory timetables mapped across seven distinct geographies
Margin architecture by chemistry and application support depth
Covering power benchmarked against use level and total formulation cost
Transparent reformulation tracked across brand ranges and categories

Built For The People Who Decide

From boardroom strategy to bench-side execution, this report is read cover-to-cover by leaders shaping the next decade of their industry, turning demand scenarios, market dynamics and valuation benchmarks into decisions.
CXOs/ Presidents/ VPs/ Managers
M&A and Corporate Development
Strategy Teams and R&D Heads
Procurement and Product Directors
Regulatory and Compliance Leaders
Investor Relations and Equity Analysts