Market Minds Advisory
Online Food Delivery Services Market

Online Food Delivery Services Market: Courier Economics, Regulatory Reclassification and the Shift From Growth to Contribution

Courier labour reclassification is rewriting the cost base of every major platform at once, while subscription membership and virtual kitchen supply quietly decide which operators reach contribution and which never will.

Lead Analyst

Lisa Gevelber

Published

September 2026

Make Smarter Decisions with Customized Research Insights

Request a free sample report and evaluate market opportunities, growth trends, and competitive dynamics relevant to your business needs.

2025 MARKET VALUE$380.0BMarket Size 2025
2036 FORECAST VALUE$1021MBase Case , 2026 to 2036
CAGR 2026 TO 20369.4 %Bull 10.7% / Bear 8.2%
INCREMENTAL OPPORTUNITY$605.2BNet 10- year value creation
EXPANSION MULTIPLE2.46x2036 value over 2026 base
Strategic Levers
M&A Pipeline
Regional Outlook
Country Rankings
Competitive Intelligence
Segmental Deep-dive
Call-Us : 91 93563 13602

Executive Snapshot and Market Trajectory

The growth question was settled years ago and the contribution question was not. Every major platform now runs the same argument internally: which orders, which cities and which restaurant partners actually earn money once courier cost is counted honestly. Nobody much wants to say the answer out loud.
Courier labour accounts for roughly 47% of cost per order, which makes worker classification the single largest commercial variable any platform faces. Subscription membership is the main defence, since members order far more often and cost nothing extra to acquire. Cloud kitchens and virtual brands grow fastest because predictable preparation times reduce courier waiting. East Asia holds the largest share by a wide margin on Chinese order volume alone.
Concentration reads at 62% for the top five, though that figure overstates real rivalry because the leaders mostly operate in separate regions rather than against each other. Regulatory reclassification of couriers is the force reshaping economics across every market simultaneously, and platforms with membership scale and virtual kitchen supply absorb it considerably better than those still buying growth through promotional discounting. Advertising is the other separator, and it is already visible in reported margins.
Market Definition
This market covers online platforms and services delivering prepared food from restaurants, cloud kitchens and food operators to consumers, spanning on-demand individual delivery, scheduled and catering orders, subscription meal plans, virtual brand fulfilment and click-and-collect ordering. Grocery and convenience quick commerce, meal kit ingredient boxes, restaurant point-of-sale software sold separately, and business-to-business foodservice distribution are excluded.
Base Year Value
$380.0B in 2025 (MMA Primary Research Dataset, August 2026)
Forecast Period
2026 to 2036, eleven discrete annual values
CAGR
9.4% base case. Bull 10.7%. Bear 8.2%.
Fastest Growth Segment
Cloud Kitchen and Virtual Brand Delivery: 14.1% CAGR
Fastest Growth Country
India: 15.2% CAGR
Fastest Growth Region
South Asia and Pacific: 11.7% CAGR
Largest Region
East Asia: 36% of 2025 global value
Market Leaders
Meituan, Uber Technologies, DoorDash, Delivery Hero and Alibaba Group lead on gross order value processed. Source: MMA Primary Research Dataset, July 2026.
Primary Survey
n=3,800 procurement and R&D decision-makers, Q4 2025, six countries
Methodology
Demand-side build-up, cross-validated against public data, 47 expert interviews

Online Food Delivery Services Market Forecast Scenarios

online-food-delivery-services-market-size-forecast-scenario-1787335693634
Growth ran at 8.6% annually between 2020 and 2025, and that single figure hides two entirely different periods. The pandemic years produced adoption that would otherwise have taken most of a decade. What followed was a painful reset in which order frequency held but promotional spending was withdrawn, several markets consolidated, and the surviving platforms were forced to demonstrate contribution rather than growth alone.
The base case at 9.4% rests on three mechanisms. Subscription membership continues converting occasional users into frequent ones at no additional acquisition cost, which is the cleanest lever any platform holds. Cloud kitchen supply expands the number of restaurants that are genuinely economic to deliver from. And Indian and Southeast Asian order volume grows on a base still far below saturation, where the addressable population has barely started ordering at all.
The bull case at 10.7% turns on advertising revenue scaling into a genuine second income line, which several platforms have proved viable at margins nothing else in the model approaches. The bear case at 8.2% reflects courier reclassification landing simultaneously across major markets, forcing fee increases that consumers respond to by ordering less often than they do today.

Courier Cost Decides Which Orders Actually Earn

Strip away the technology and this is a labour business. Courier pay accounts for roughly 47% of cost per order, and no amount of routing intelligence changes the fact that somebody physically carries the food. Every commercial decision a platform makes eventually reduces to whether a given order covers that cost.
TOP FIVE CONCENTRATION62%High on paper, though leaders mostly operate in separate regions
AVERAGE ORDER VALUE$32Typical basket size across restaurant delivery orders worldwide
PLATFORM TAKE RATE21%Commission and fee share of gross order value
COURIER COST SHARE47%Delivery labour portion of platform cost per order
MEMBERSHIP ORDER SHARE34%Portion of orders placed by subscription programme members
MONTHLY ORDER FREQUENCY3.4 ordersAverage ordering rate among active platform users monthly
Membership is the strongest answer anybody has found. Subscribers order far more frequently than non-members, they cost nothing additional to acquire once enrolled, and roughly 34% of orders now arrive through membership programmes. The economics work because delivery cost per order falls when a courier can batch, and batching requires order density that only frequent users produce. Density is the whole game, which is why platforms fight so hard for city-level share rather than national share.
Advertising deserves more attention than it usually receives. Restaurants pay for placement in a listing where consumers browse with genuine purchase intent, and that revenue arrives at margins nothing else in the model approaches. Platform take rates near 21% of order value get most of the commentary, but the incremental profit increasingly comes from selling visibility to the same restaurants already paying commission.
"Everyone watches take rate and almost nobody watches batching. A platform that gets two orders onto one courier trip has solved a problem that another point of commission never will."
Director, Digital Commerce and Foodservice Platforms Practice · MMA Digital Commerce Practice · August 2026

Market Trends

Subscription Membership Replaces Promotional Discounting As Growth Engine

Platforms spent years buying orders with promotional discounts that vanished the moment the promotion did, and the industry has largely stopped pretending that worked. Membership programmes replaced it. A subscriber pays upfront for delivery fee relief, orders far more often as a result, and costs nothing additional to acquire across the whole of that period. Roughly 34% of orders now arrive through membership, and those orders batch better because frequency produces the density couriers need. The shift moved competition from discount depth toward programme design and retention. Retention now matters more than enrolment ever did.
Market Impact: Segment grows at 14.1% annually
Advertising Becomes The Second Income Line Platforms Needed

Restaurants will pay for placement in a listing where consumers arrive with genuine purchase intent, and that revenue lands at margins commission never approaches because it carries no courier cost whatever. Several large platforms now run advertising as a distinct business with its own sales organisation. The effect on reported economics is considerable, since incremental advertising profit can carry cities where delivery contribution alone remains thin. It also deepens the platform relationship with restaurants that were previously treating commission as a grudging cost. Restaurants that once treated commission grudgingly now buy advertising willingly.
Market Impact: India grows at 15.2% annually

Market Opportunities and Growth Drivers

Cloud Kitchen Supply Expands Economically Deliverable Restaurant Base

Plenty of restaurants are simply uneconomic to deliver from, because preparation times run long and unpredictably and couriers wait unpaid while food is finished. Cloud kitchens solve exactly that. Purpose-built for delivery with no dining room competing for kitchen attention, they produce predictable pickup times that let a platform batch orders reliably. Every new site expands the number of orders that can be served at positive contribution rather than merely served. Growth in this supply runs at 14.1%, well ahead of the market overall. Platforms are contracting for that supply rather than waiting.
Market Impact: Raises cost per order 11%

Indian And Southeast Asian Order Volume Remains Far Below Saturation

Most Western growth now comes from existing users ordering slightly more often, which is a slow way to build a business. India is different. Order volume grows near 15.2% annually on a user base where the addressable urban population has barely begun ordering, and courier cost per delivery sits far below Western levels, which makes low-value orders economic in a way they simply are not elsewhere. Indonesia, Vietnam and the Philippines follow similar paths with strong regional platforms already established. Grab, Swiggy and Eternal are all building membership programmes on that base already.
Market Impact: Frequency drops 8% per fee rise

Market Restraints and Challenges

Courier Classification Rules Tighten Across Every Major Market

Courier labour is roughly 47% of cost per order, so any rule requiring employment status, minimum earnings or benefit provision hits directly and immediately. The root cause is that the independent contractor model was adopted at scale before regulators had formed a view, and they have now formed one. The European Union platform work directive, several American state rules and various municipal minimum pay standards all push the same direction. Participants are responding with fee increases, hybrid employment models in selected cities, and batching investment that reduces courier hours per order.
Market Impact: Membership carries 34% of orders

Consumer Fee Sensitivity Caps What Platforms Can Recover

Order frequency falls measurably when total fees rise, which means platforms cannot simply pass courier cost increases through to customers and carry on. The root cause is that delivery competes against collection and against cooking, both of which remain free and immediately available. Commercially this squeezes participants between rising labour cost and a ceiling on recovery. Participants are responding with membership programmes that bundle fees into a predictable monthly payment consumers accept more readily, with advertising revenue, and with batching that lowers genuine cost. Collection volumes rise whenever delivery fees do.
Market Impact: Adds 4 points of blended margin
3 additional market trends, 4 additional growth drivers, and 2 additional restraints and challenges are covered in the full report. Contact sales@marketmindsadvisory.com to access the complete intelligence.

Segment CAGR and Growth Architecture

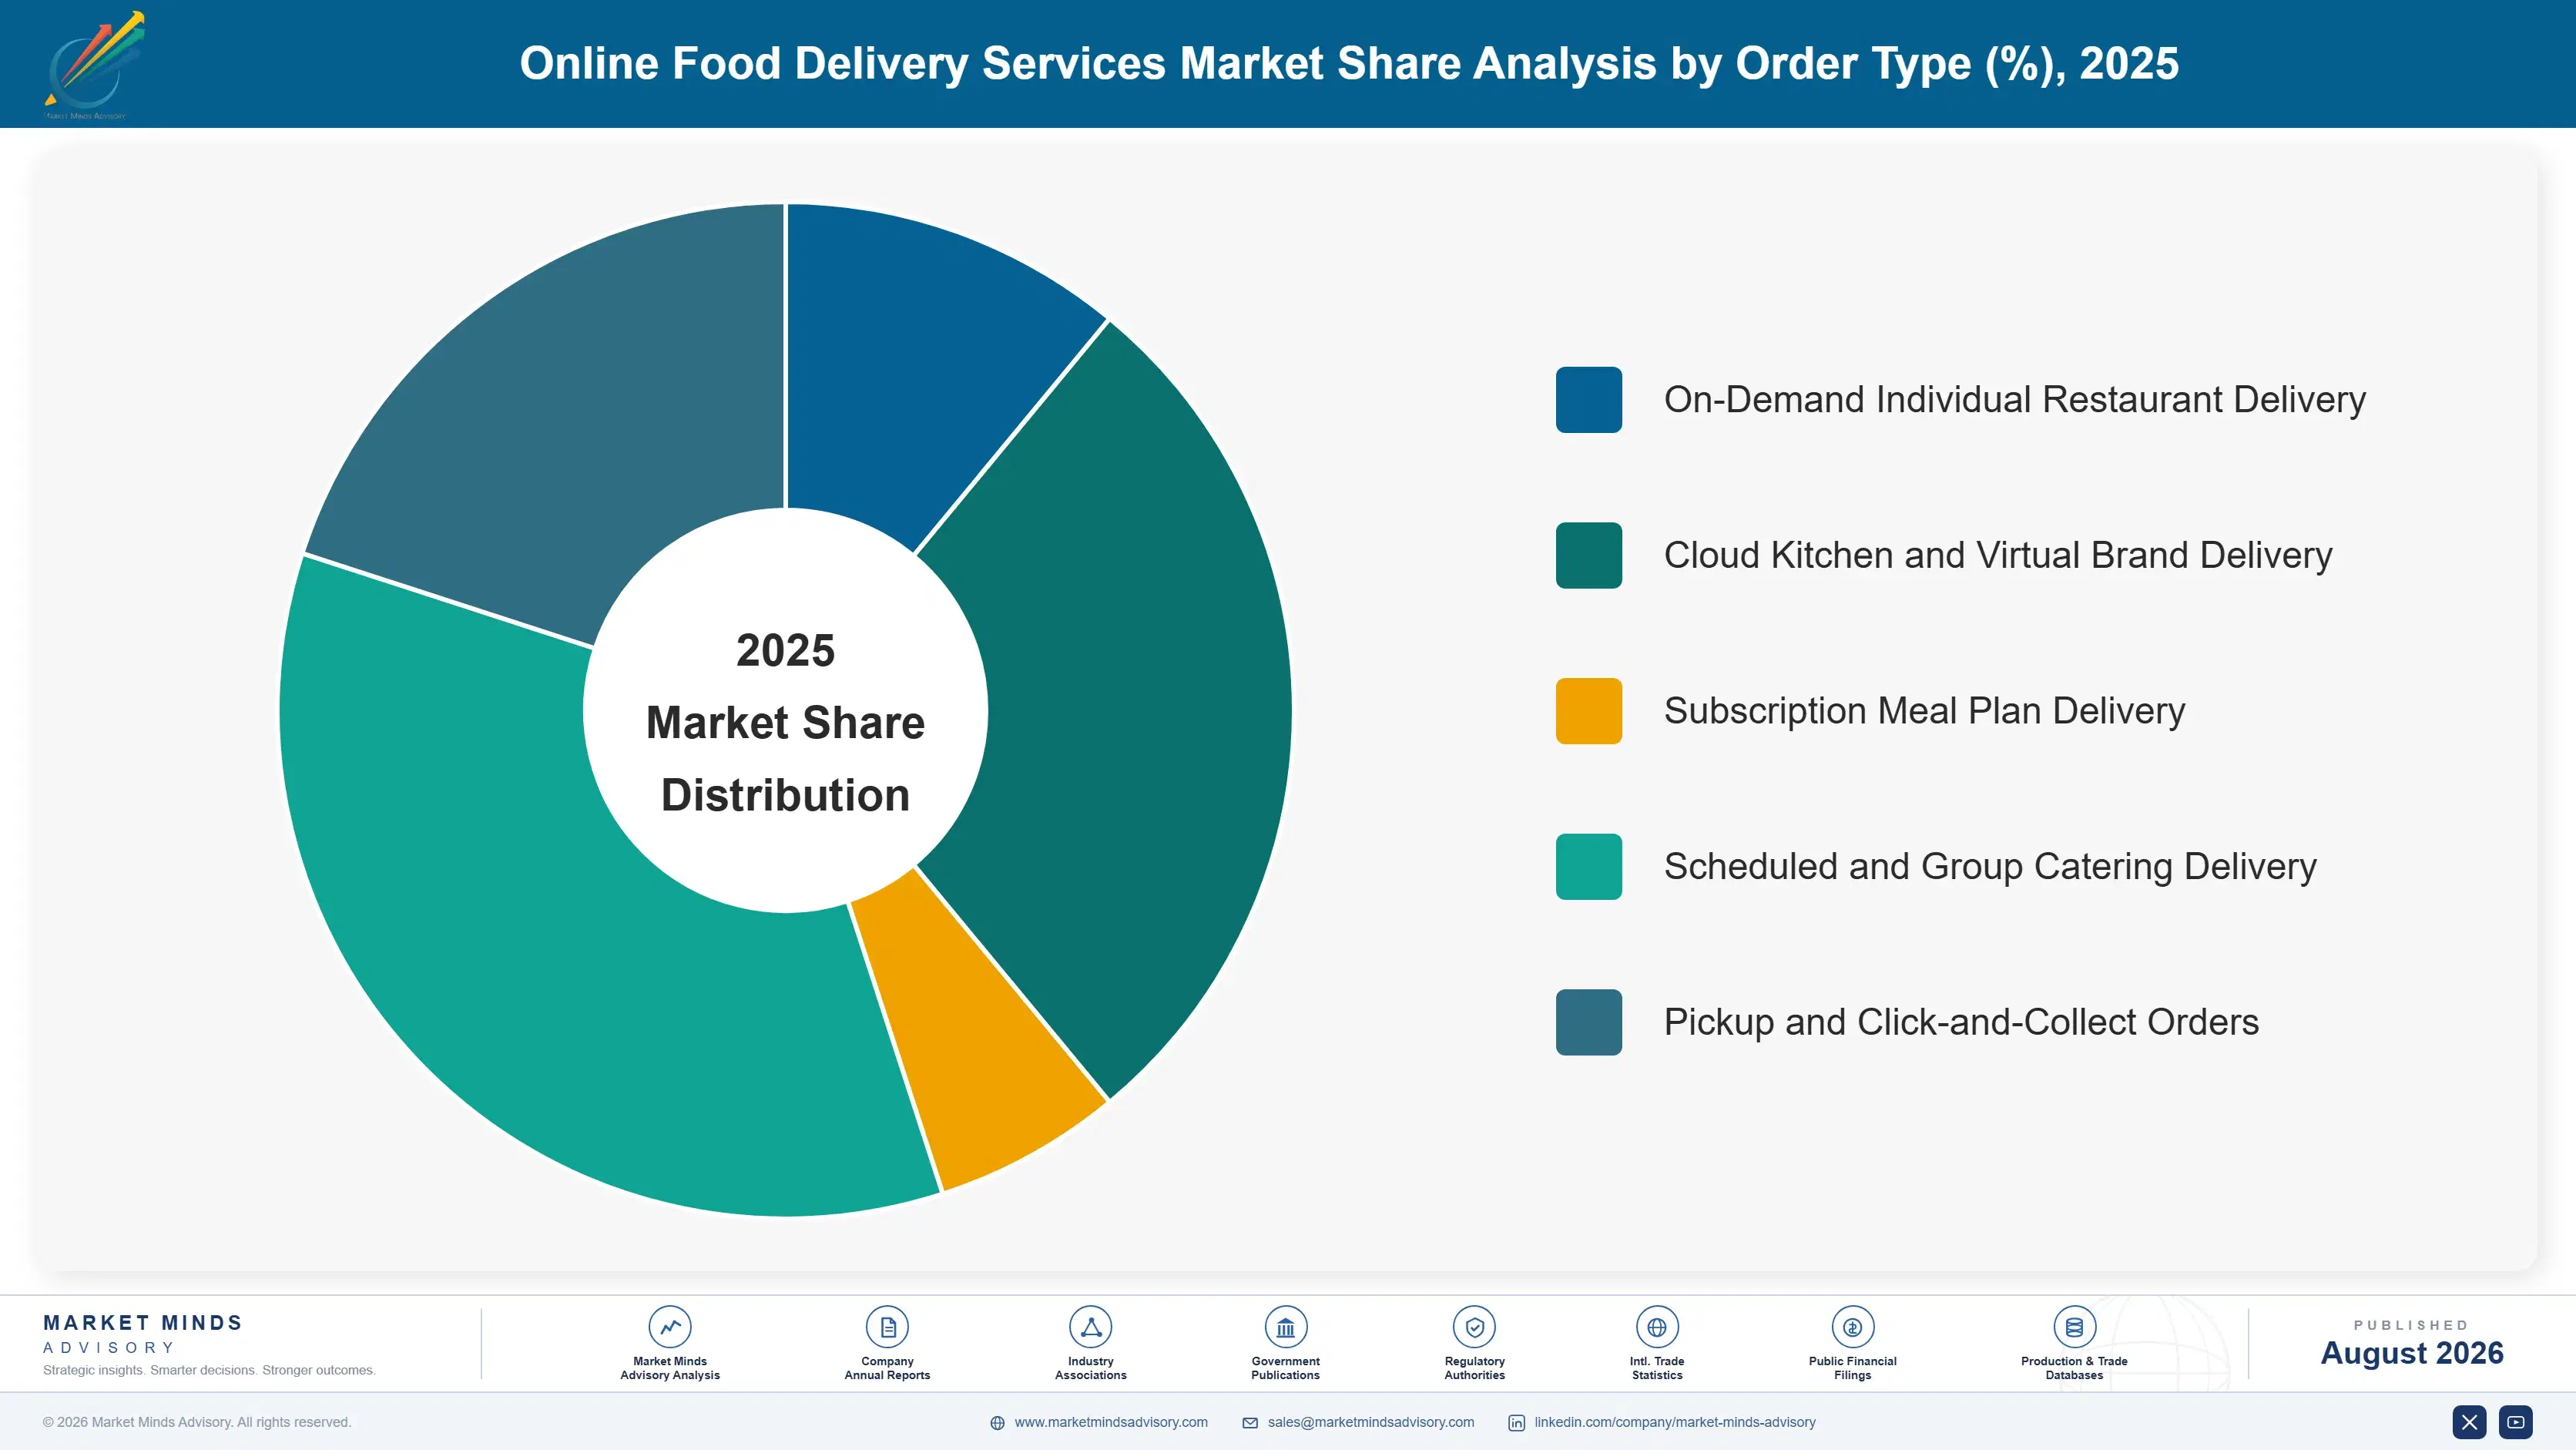
Five order types divide this market on how the customer buys rather than on who prepares the food. The distinction that matters commercially runs between orders a platform can plan capacity against and orders arriving without warning, because predictability determines courier utilisation and courier utilisation determines whether contribution exists. That distinction explains most of the margin variation here.
online-food-delivery-services-market-market-share-analysis-1787335694175

Cloud Kitchen and Virtual Brand Delivery

Growing at 14.1% and the fastest part of this market. Cloud kitchens and virtual brands produce food purpose-built for delivery from sites carrying no dining room, no front of house and rent at industrial rather than high street rates, which changes the economics of every order passing through them. Platforms favour these operators because preparation times are predictable and courier waiting is minimal, and predictable pickup is worth more to a delivery network than almost anything else a restaurant can offer. Virtual brands also let a single kitchen list under several names, testing cuisines against demand data the platform already holds. The constraint is brand fragility, since a virtual name carries no history and customers abandon it without hesitation.
CAGR 14.1%

Subscription Meal Plan Delivery

Growing at 12.6% on meal plans sold as recurring subscriptions rather than as individual orders, covering weekly prepared meal deliveries, office lunch programmes and dietary plans built around calorie or macronutrient targets. The commercial appeal is obvious to anybody who has looked at platform cohort data: a subscriber orders on a schedule the operator can plan capacity against, which removes most of the demand volatility that makes on-demand delivery expensive to serve. Customer acquisition cost is recovered across months rather than hoped for on a second order. Fitness and clinical nutrition positioning drives most of the growth. The constraint is that meal fatigue is real, and retention past six months requires genuine menu development rather than rotation.
CAGR 12.6%
Full segment breakdown across 5 segments available in the complete report.

Regional Architecture and Country Demand Map

East Asia holds 36% of global order value on Chinese volume alone, which sits above the usual regional band for reasons set out below. North America follows at 23% on order value per customer, while South Asia and Pacific grows fastest on Indian volume still far below saturation.

East Asia

Note: East Asia sits above the standard regional share band because China alone processes more delivery orders than North America and Western Europe combined, and no allocation reflecting the real market can avoid that. Meituan and Ele.me operate at order densities nothing outside China approaches, which makes batching routine rather than aspirational and pushes courier cost per order well below Western levels. Urban density does most of the work, since apartment concentration shortens delivery distances dramatically. Japanese and Korean markets are smaller and considerably more competitive per capita, with Woowa Brothers and Coupang fighting on service quality rather than price, and Japanese order values running high on quality expectations that keep basket sizes elevated.
Share: 36% | CAGR: 10.3% (2026 to 2036)

North America

Order value per customer is what carries this region rather than order frequency, which trails East Asia substantially. American baskets are large, tips are customary and additive, and consumers accept fee levels that would suppress demand elsewhere entirely. DoorDash and Uber Eats hold the market between them after several years of consolidation removed most of the challengers who once operated here. Suburban geography raises delivery distances and therefore courier cost, which makes batching harder than in dense Asian cities. Courier classification is being decided state by state rather than nationally, producing a patchwork that platforms must operate across simultaneously. Canada follows American patterns closely at smaller scale. Tipping culture also complicates any fee increase.
Share: 23% | CAGR: 8.5% (2026 to 2036)
Regional intelligence for 5 additional markets available in the complete report: Western Europe, South Asia and Pacific, Latin America, Middle East and Africa, Eastern Europe. Contact sales@marketmindsadvisory.com.
online-food-delivery-services-market-country-cagr-analysis-1787335694697

Where Delivery Platforms Actually Earn Money

Four positions separate platforms reaching genuine contribution from those still buying orders they lose money on: driving membership enrolment, building advertising into a real second income line, securing cloud kitchen supply that batches predictably, and winning city-level order density rather than chasing national coverage that never pays. Each one is measurable at city level rather than nationally.

Drive Membership Enrolment Ahead Of Promotional Discounting

A member orders roughly twice as often as a non-member and costs nothing additional to acquire across the whole subscription period, which is the cleanest economics anywhere in this model. Membership already carries around 34% of orders and every point of that share improves batching, because frequency produces the order density couriers need to carry two deliveries on one trip. Promotional discounting produces none of that and stops working the moment it stops. The programme design matters more than the discount depth does. Retention across the second year is where programmes separate.
Market Impact: Membership already carries 34% of all platform orders

Build Advertising Into A Genuine Second Income

Restaurants pay for placement in a listing where consumers arrive with real purchase intent, and that revenue carries no courier cost whatever, which is why it lands at margins commission cannot approach. Platforms running advertising as a distinct business with dedicated sales capability add roughly 4 points of blended margin, enough to carry cities where delivery contribution alone stays thin. The investment is sales organisation and measurement tooling rather than technology, and restaurants already paying commission convert readily. Advertising already reaches 12% of total revenue at the platforms furthest along this path.
Market Impact: Adds roughly 4 points of blended platform margin

Secure Cloud Kitchen Supply That Batches Predictably

Courier waiting time is unpaid and unproductive, and it is the single largest hidden cost in restaurant delivery. Cloud kitchens produce predictable pickup because nothing competes for kitchen attention, and platforms weighting supply toward them cut courier idle time by 20% to 28% on comparable routes. Growth in this supply runs at 14.1% annually, well ahead of the market. Securing preferential access before competitors do is worth considerably more than another point of commission ever will be. Operators are now signing multi-year capacity agreements rather than relying on open listings alone.
Market Impact: Cuts courier idle time by up to 28%

Win City Density Rather Than National Coverage

Delivery economics are local and nothing about national share improves them. Two orders on one courier trip cut cost per delivery by roughly 35%, and batching at that rate requires order density that only concentrated city share produces. Platforms spreading thinly across many cities carry the cost structure of a leader in none of them. Withdrawing from cities where density cannot be won is the harder half of this discipline, and the half most operators avoid for far too long. City position rather than national scale is what decides the cost structure.
Market Impact: Batching cuts delivery cost per order by 35%

Who Controls the Margin Pool

Concentration reads at 62% for the top five measured on gross order value processed, the basis used throughout this section, and the figure overstates real rivalry considerably. Meituan and Alibaba compete in China, DoorDash and Uber in North America, Delivery Hero across a spread of emerging markets. They rarely meet. The gap between each regional leader and its nearest challenger is wider than the global figure suggests.
Competition runs on three fronts. City-level order density is the first and the most decisive, because batching economics are local and national share improves nothing. Membership programme design is the second, having replaced promotional depth as the growth mechanism. The third is advertising sales capability, which several platforms now run as a separate business with its own organisation and its own targets.

Pressure arrives from two directions. Courier classification rules are tightening across every major market simultaneously, and platforms with membership scale and batching investment absorb the cost far better than those without. Separately, large restaurant chains continue building direct ordering channels to avoid commission entirely. Rankings will shift toward operators holding genuine city density and a second income line rather than those still buying orders.
online-food-delivery-services-market-company-positioning-matrix-1787335695228

Competitive Moat and Risk Dimensions

MEITUAN

Moat: Order density beyond comparison

Chinese urban order density allows batching at rates nothing outside China approaches, which pushes courier cost per delivery well below Western levels and makes low-value orders economic. The same dense network also supports adjacent categories from the identical courier fleet, spreading fixed cost across far more deliveries than a single-category platform can manage.
MEITUAN

Risk: Single-market regulatory concentration

Almost all value sits inside one regulatory jurisdiction, which leaves the business exposed to Chinese platform regulation, courier welfare requirements and competition rulings with no geographic diversification to offset them. Domestic competition is also intense and periodically escalates into subsidy contests that damage margins across the whole sector at once.
DOORDASH

Moat: Suburban density and membership

Early concentration on suburban American markets built density where competitors focused on dense city centres, and that position proved considerably more defensible than it looked at the time. Membership enrolment is deep, advertising revenue is scaling, and the combination produces contribution that most delivery platforms globally have never managed to demonstrate at all.
DOORDASH

Risk: State-level classification exposure

Courier classification is being decided state by state across the United States rather than nationally, producing a patchwork the business must operate across simultaneously and cannot plan around with any confidence. Suburban geography also raises delivery distances, which makes batching considerably harder than it is in dense urban networks.

Players Tracked

Prominent Players

Meituan
Uber Technologies
DoorDash
Delivery Hero
Alibaba Group

Other Key Players

Just Eat Takeaway.com
Grab Holdings
Deliveroo
Eternal
Swiggy
Rappi
iFood
Coupang
Woowa Brothers
Demae-can
Olo
Toast
HungryPanda
Talabat Holding
Jahez International

Recent Developments

JANUARY 2025

Platform work directive implementation begins across member states

European Union member states began transposing the platform work directive into national law, introducing a presumption of employment for couriers that several major platforms had spent years arguing against, and forcing cost recalculation across every European market they operate in. Implementation timetables vary considerably by member state.
Signal: Courier classification has moved from contested argument to implementation timetable across the whole of the European market
MAY 2025

Advertising business separated with dedicated sales organisation

A major delivery platform separated its advertising operation into a distinct business unit with its own sales organisation and reporting line, formalising a revenue stream that had been managed as an adjunct to commission for several years previously. Reporting from 2026 separates it from commission entirely.
Signal: Advertising is being treated as a genuine second business rather than incremental revenue on existing commission
SEPTEMBER 2025

Cloud kitchen supply agreement signed for preferential platform access

A delivery platform signed a multi-year supply agreement with a cloud kitchen operator covering preferential listing and capacity commitments across several cities, securing predictable pickup times that reduce courier waiting on the routes concerned. Both parties described the arrangement as a template for further city agreements.
Signal: Platforms are contracting for predictable supply because courier idle time costs more than commission actually earns them back

What Drives Delivery Cost Per Order

Courier payment accounts for roughly 47% of platform cost per order and dominates everything else on the list. Customer acquisition and promotional incentives contribute around 18%, though that share has fallen as membership replaced discounting. Technology, platform operations and mapping add about 12%. Customer support and insurance together reach roughly 9%, and payment processing close to 4% depending on regional card and wallet economics.
Courier cost rose across most Western markets through 2024 and 2025 as minimum pay standards took effect, with Seattle and New York City both implementing municipal floors and Spain legislating employment status directly. European Commission platform work rules push the same direction across member states. United States Bureau of Labor Statistics wage data shows delivery occupation earnings rising faster than the general wage index across the same period.

The disadvantage mechanism is order density and it compounds against smaller operators relentlessly. A platform with city leadership batches two orders onto one courier trip and cuts cost per delivery by roughly 35%; a platform holding 15% of that city cannot batch and pays full cost on every order. Exposure varies by city position rather than national scale, which is what makes thin coverage so expensive.
online-food-delivery-services-market-cost-volatility-analysis-1787335695426

Invest in batching and routing to cut courier hours

Two orders carried on one courier trip cut cost per delivery by roughly 35%, and batching rates depend on order density and dispatch quality together rather than on either alone. Investment in routing and dispatch pays back faster than any commission increase. The requirement is genuine city density, which routing software alone cannot manufacture where volume does not exist.

Convert fee recovery into membership rather than per-order charges

Consumers respond badly to visible per-order fee increases and reduce ordering frequency measurably, but they accept a predictable monthly membership payment far more readily than the arithmetic alone would suggest. Converting recovery into membership protects frequency while still covering rising courier cost. It requires a programme consumers find worth joining, which means genuine benefit rather than repackaged fees.

Withdraw from cities where density cannot be won

Platforms spreading thinly across many cities carry a leader's cost structure in none of them, and no amount of national scale corrects that arithmetic. Exiting positions where batching will never work releases capital and management attention for markets where density is achievable. The difficulty is political rather than analytical, since withdrawal reads publicly as retreat.

Portfolio Architecture for Margin Defence

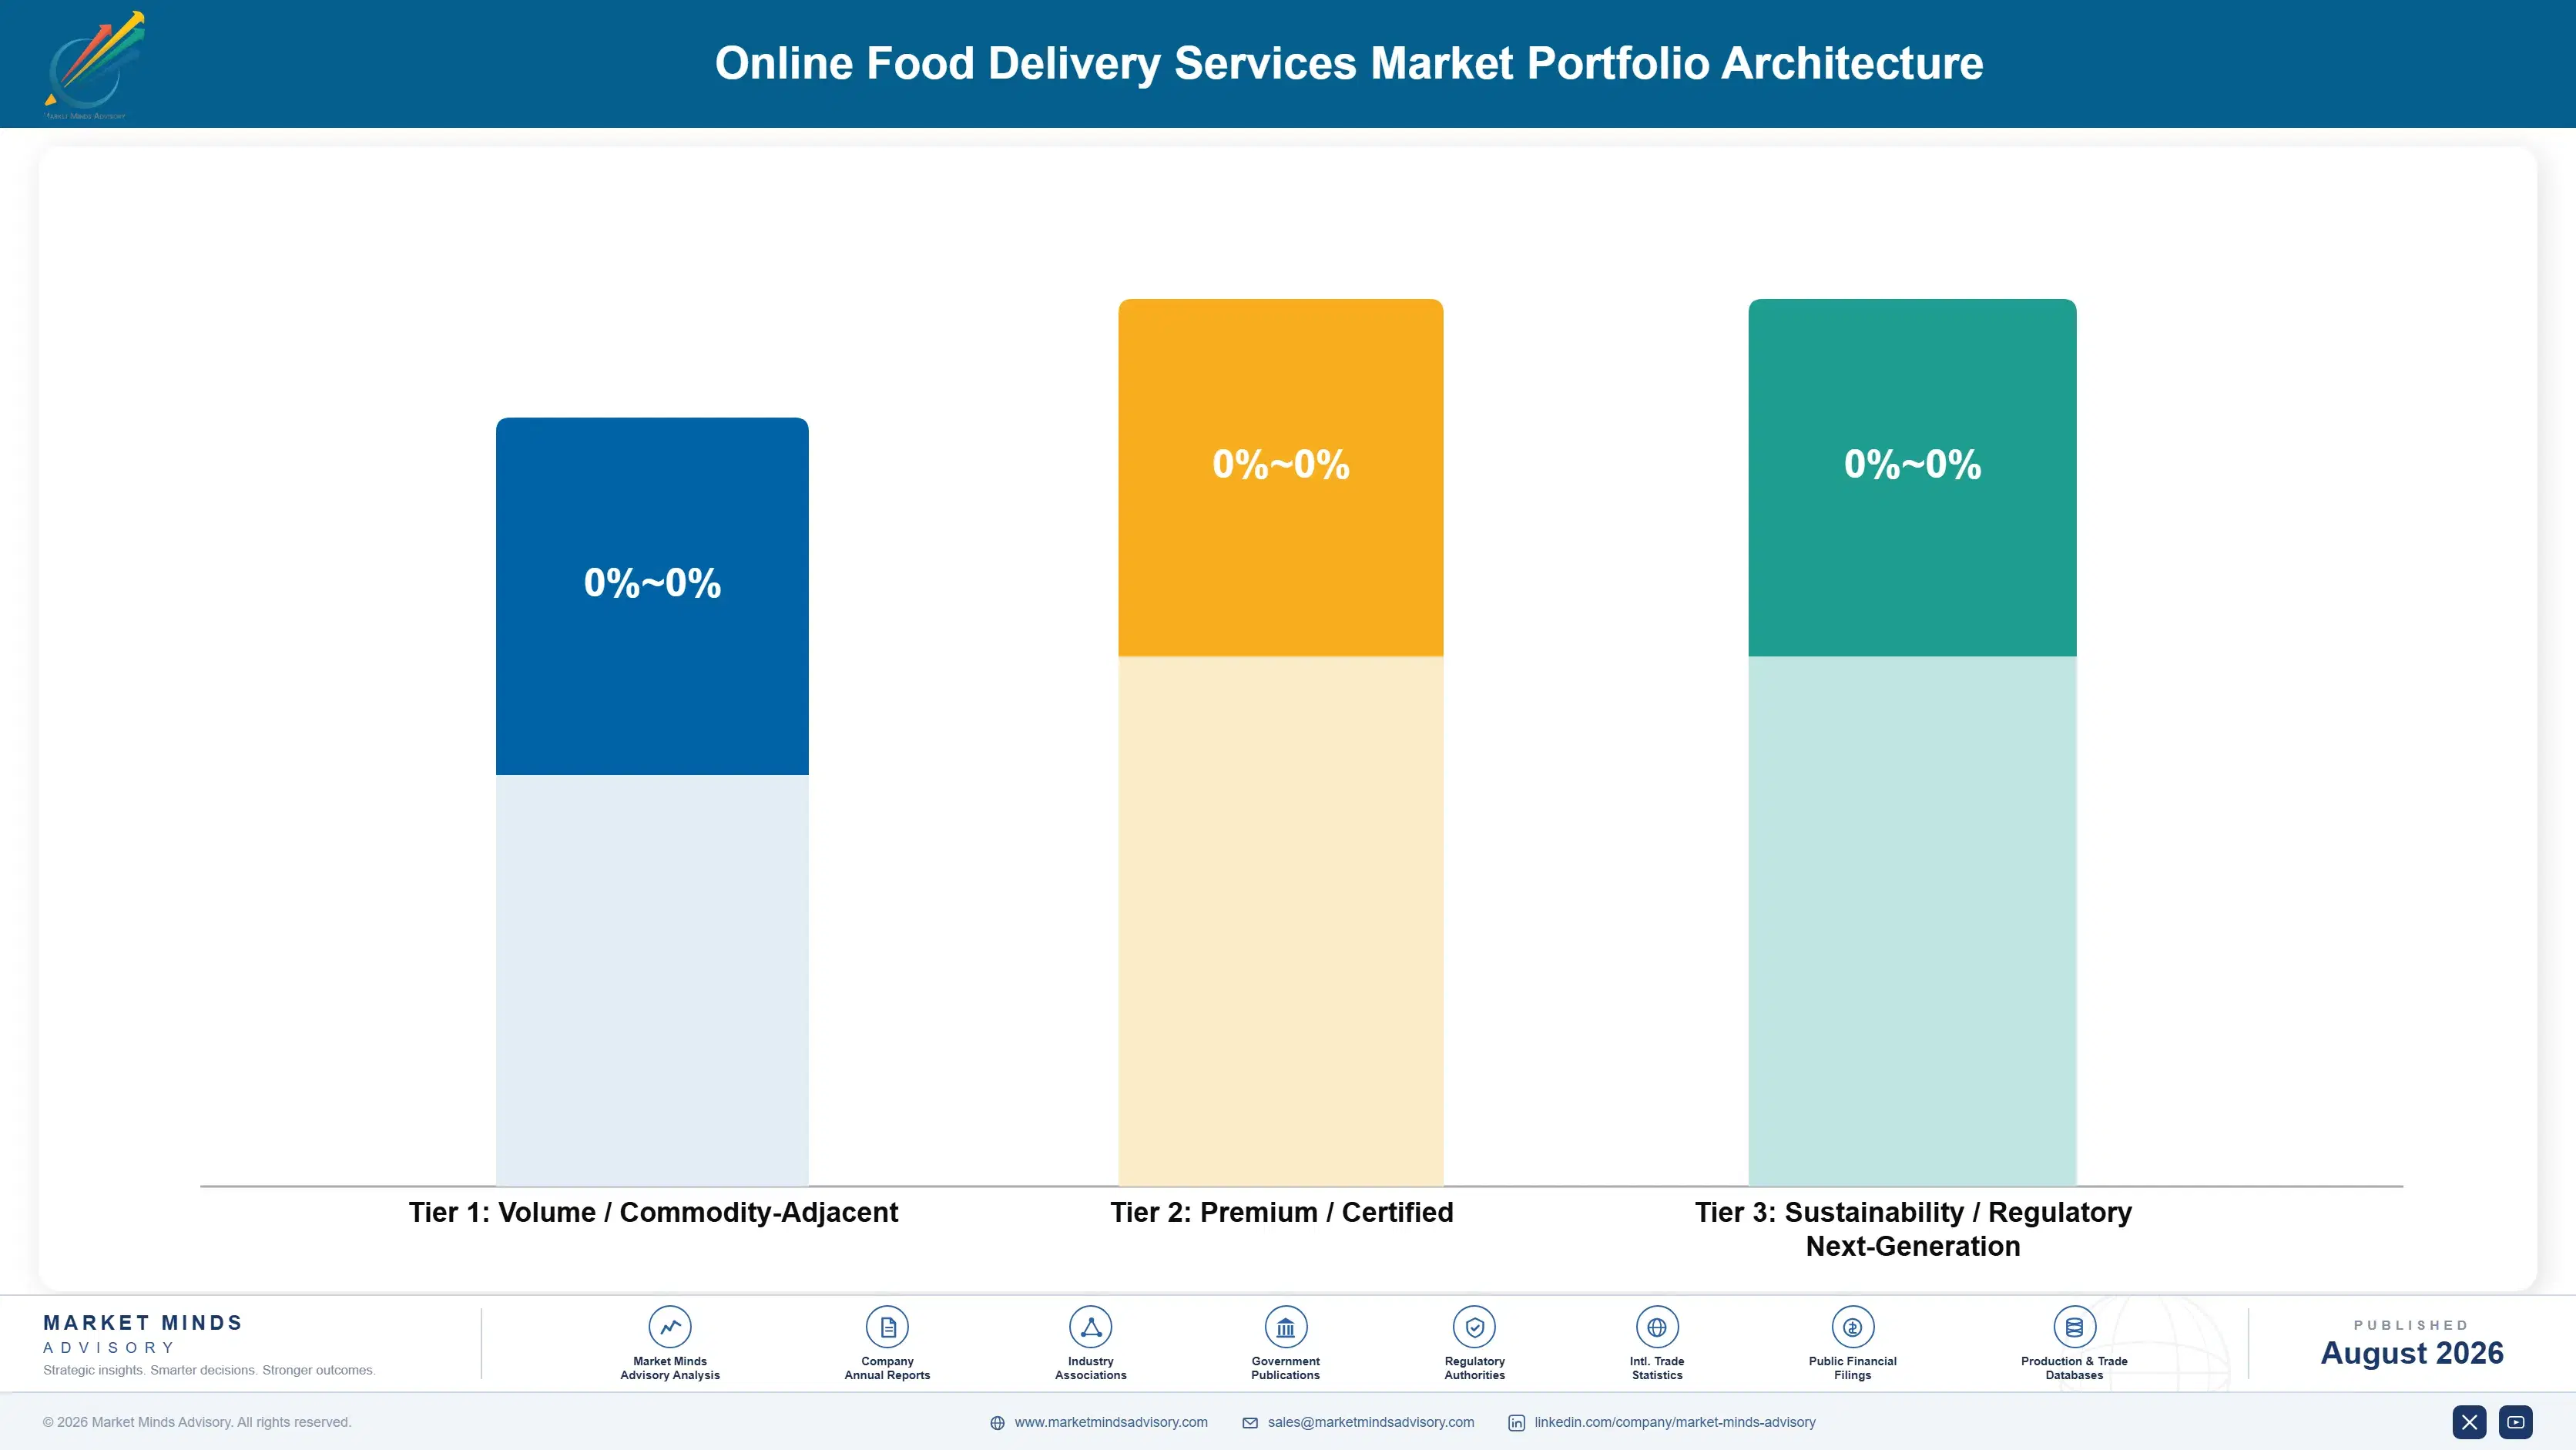
Portfolio economics here divide on order predictability and city position rather than on cuisine or basket size. Occasional single orders in cities where a platform holds no density are the weakest position anywhere in the model, since no batching is possible and the courier trip carries one delivery at full cost. Coverage of that kind flatters a map and nothing else.
The middle tier is membership orders in cities with genuine density. Subscribers order roughly twice as often, cost nothing additional to acquire, and their frequency produces exactly the density that makes batching routine rather than occasional. Contribution margins reach the mid teens after courier cost, which sounds modest and is transformative against the alternative. Density is the input and batching is the output.

Above both sits advertising and cloud kitchen supported volume. Advertising revenue carries no courier cost whatever and lands at margins commission cannot approach, while cloud kitchen orders cut courier idle time by 20% to 28%. Blended margins reach the high twenties where both are present together. The position requires sales organisation and supply agreements that take years to assemble properly, which is precisely why so few platforms hold it.

Volume / Commodity-Adjacent

Occasional single orders in cities without density. The range reflects basket size and courier cost per trip, neither of which the platform meaningfully controls, and contribution frequently sits near zero.
Gross Margin: 2 to 9%

Premium / Certified

Membership orders in cities holding genuine density. The range reflects batching rates achieved, which depend on order concentration and dispatch quality together rather than on either factor alone. Dispatch quality is the controllable half.
Gross Margin: 13 to 19%

Sustainability / Regulatory / Next-Generation

Advertising revenue combined with cloud kitchen supported delivery volume. The wide range reflects how developed the advertising sales organisation is and how much supply has been contracted preferentially. Few platforms hold both together.
Gross Margin: 24 to 32%
online-food-delivery-services-market-portfolio-architecture-1787335695920

High-value Sub-segments and Strategic Watch-out

Platform Advertising Revenue

High value and high growth together. Restaurants pay for placement where consumers browse with real purchase intent, and no courier cost attaches to any of it. The very wide range reflects sales organisation maturity, which varies enormously between platforms. Restaurants already paying commission convert readily.
Gross Margin: 58 to 72%

Membership Order Volume

High value on strong growth and the most defensible position in core delivery. Members order roughly twice as often at no additional acquisition cost. The range reflects city batching rates, which depend on order density more than anything else. Retention past the first year separates programmes.
Gross Margin: 13 to 19%

On-Demand Individual Restaurant Orders

The volume core of this market and the source of most order count. Contribution depends entirely on whether the city supports batching. The range reflects density position, basket size and local courier cost, which vary widely between markets. Batching rate is the only variable that matters.
Gross Margin: 6 to 13%

Thin Coverage Secondary Cities

The strategic watch-out. Coverage looks impressive in investor materials while every order carries full courier cost with no batching possible at all. The range reflects basket size and local wage levels rather than any commercial decision. Coverage without density is the most expensive habit in this market.
Gross Margin: 2 to 9%

How Delivery Demand Actually Repeats

Two repeat mechanisms operate here and only one behaves like an annuity. Membership produces scheduled, predictable ordering that a platform can plan courier capacity against, and members order roughly twice as often as non-members across the whole subscription period. Non-member ordering is occasional, triggered by circumstance, and disappears entirely the moment fees rise beyond what the customer considers reasonable.
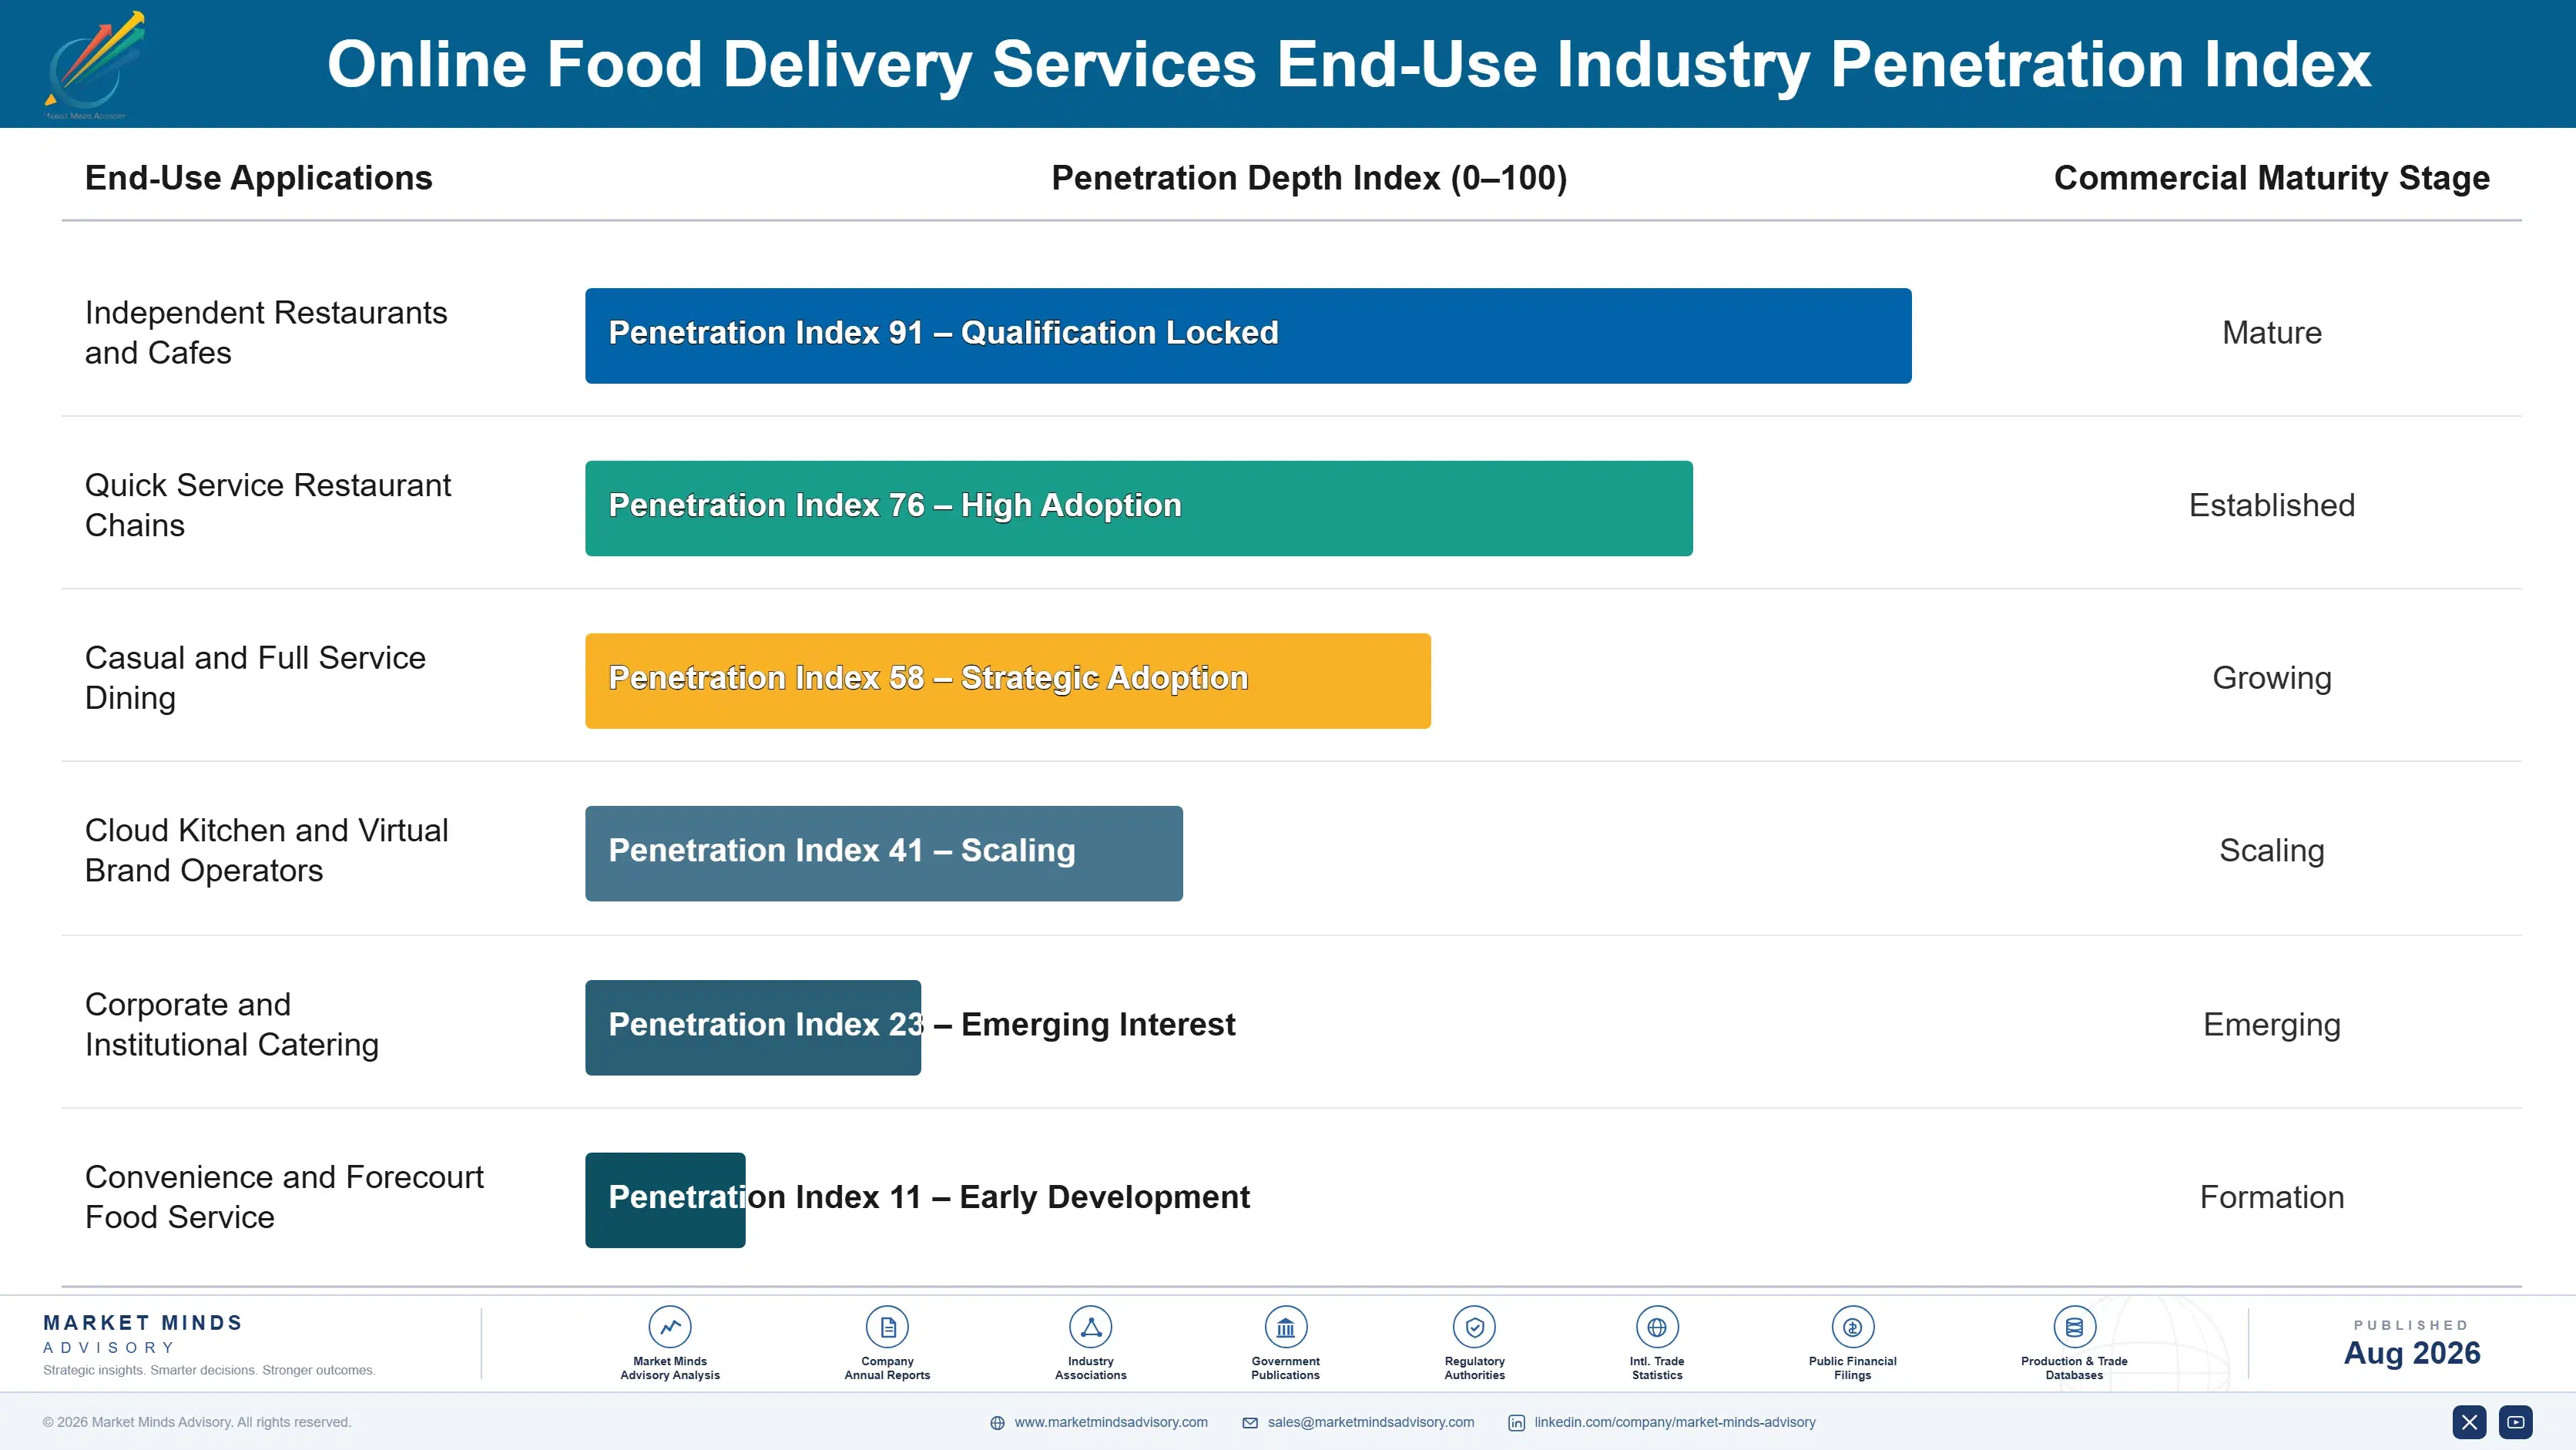
Stickiness varies sharply by end use. Office lunch and scheduled catering hold best, because the ordering decision is institutional rather than personal and repeats on a calendar. Subscription meal plans hold well until menu fatigue arrives, typically around six months. Weekend household ordering is the most habitual of the occasional patterns. Late-night individual ordering is the least sticky of all, being purely circumstantial and highly sensitive to any fee increase.

The buyer profile has shifted noticeably. Early adopters were younger urban users treating delivery as an occasional convenience worth paying for. Today's frequent user is more likely a household treating delivery as a routine substitute for cooking on particular days of the week, which produces predictable weekly patterns platforms can plan capacity around and makes membership economics considerably more attractive.
online-food-delivery-services-market-end-use-penetration-index-1787335696410

Where To Compete And Why

These are among the four positions where our research anticipates prominent divergence between winners and laggards over the coming forecast period. Each is grounded in the demand model, the regulatory perimeter, and the announced capacity pipeline.
01 / CITY DENSITY DISCIPLINE

Local batching beats national coverage entirely

Two orders carried on one courier trip cut cost per delivery by roughly 35%, and batching at that rate requires order density that only concentrated city-level share can produce for any operator. Platforms spread thinly across many cities carry a leader's cost structure in none of them, and no amount of national scale corrects that arithmetic. Withdrawing where density cannot be won is the harder half of this discipline and the half most operators avoid for far too long, usually because it reads publicly as retreat.
02 / MEMBERSHIP PROGRAMME DESIGN

Subscribers order twice as often

A member orders roughly twice as often as a non-member and costs nothing additional to acquire across the whole subscription period, which makes membership the cleanest economics available anywhere in this model. Around 34% of orders now arrive that way, and every point of that share improves batching because frequency produces density. Programme design and retention across the second year matter far more than discount depth ever did, which stopped working entirely the moment platforms withdrew it and never came back.
03 / ADVERTISING REVENUE BUILDING

Second income carries thin cities

Restaurants pay for placement in a listing where consumers arrive with genuine purchase intent, and that revenue carries no courier cost whatever, which is why it lands at margins commission cannot approach. Platforms running advertising as a distinct business with dedicated sales capability add roughly four points of blended margin, enough to carry cities where delivery contribution alone stays thin. The investment is sales organisation and measurement tooling rather than technology, and restaurants already paying commission convert to advertising more readily than expected.
04 / COURIER COST PREPARATION

Classification changes are already scheduled

Courier payment is roughly 47% of cost per order, so classification rules requiring employment status or minimum earnings hit immediately and cannot be absorbed quietly. European implementation timetables are published and American state rules keep arriving, which removes any argument for waiting to see what happens next. Batching investment and membership conversion are the only genuine defences available, and both take considerably longer to build than the rules take to arrive, which leaves late movers absorbing the whole cost directly instead.

Engagement Snapshot From the Field

A live engagement with an industry participant carrying material or product regulatory and market exposure ahead of a defining policy shift, showing how our research translates into a defensible multi-year portfolio strategy.
MARKET MINDS ADVISORY · CLIENT ENGAGEMENT SUMMARY
Online Food Delivery Services Producer Strategic Portfolio Review and Transition Roadmap 2026·Investment Scenario on Online Food Delivery Services Exposure Evaluation 2025-26
CLIENT PROFILE
A regional online food delivery platform with annual gross order value near $1.4 billion (client-reported, unverified by MMA), operating across roughly forty cities in two countries. The business held clear leadership in its four largest cities and thin positions in most of the rest, with membership enrolment below a fifth of active users and no advertising revenue at all.
STRATEGIC CHALLENGE
Courier costs had risen across both countries while promotional spending had been cut, and blended contribution remained slightly negative despite four consecutive years of order growth. Management needed to decide between defending national coverage, concentrating investment in cities where density was achievable, or building the second income line competitors had already started.
MMA APPROACH
MMA modelled contribution by city against batching rate, courier cost and basket size using three years of the client's own order data, benchmarked membership programme design against comparable regional platforms, and assessed advertising readiness with restaurant partners. Twenty-six expert interviews with restaurant operators, couriers and platform commercial leads tested where the economics genuinely broke.
KEY FINDINGS
  1. Eleven cities generated negative contribution on every order and had done so consistently for three years, with batching rates below the level at which any delivery route becomes economic to run.
  2. Membership enrolment among frequent users was far below comparable platforms, and modelling showed conversion alone would move blended contribution positive without any city exits at all.
  3. Restaurant partners in the four leading cities expressed clear willingness to pay for placement, and several were already buying advertising on competing platforms in the same markets.
  4. Courier interviews showed idle waiting time at traditional restaurants ran roughly double that at cloud kitchens, which the client had never measured or reflected in its supply strategy.
CLIENT PROFILE
A regional online food delivery platform with annual gross order value near $1.4 billion (client-reported, unverified by MMA), operating across roughly forty cities in two countries. The business held clear leadership in its four largest cities and thin positions in most of the rest, with membership enrolment below a fifth of active users and no advertising revenue at all.
STRATEGIC CHALLENGE
Courier costs had risen across both countries while promotional spending had been cut, and blended contribution remained slightly negative despite four consecutive years of order growth. Management needed to decide between defending national coverage, concentrating investment in cities where density was achievable, or building the second income line competitors had already started.
MMA APPROACH
MMA modelled contribution by city against batching rate, courier cost and basket size using three years of the client's own order data, benchmarked membership programme design against comparable regional platforms, and assessed advertising readiness with restaurant partners. Twenty-six expert interviews with restaurant operators, couriers and platform commercial leads tested where the economics genuinely broke.
KEY FINDINGS
  1. Eleven cities generated negative contribution on every order and had done so consistently for three years, with batching rates below the level at which any delivery route becomes economic to run.
  2. Membership enrolment among frequent users was far below comparable platforms, and modelling showed conversion alone would move blended contribution positive without any city exits at all.
  3. Restaurant partners in the four leading cities expressed clear willingness to pay for placement, and several were already buying advertising on competing platforms in the same markets.
  4. Courier interviews showed idle waiting time at traditional restaurants ran roughly double that at cloud kitchens, which the client had never measured or reflected in its supply strategy.
RECOMMENDED STRATEGY
Phase 1: Phase one: drive membership conversion among frequent users in the leading cities, since it moves contribution positive without requiring any withdrawal decision. Phase 2: Phase two: build advertising sales capability in the four leading cities where restaurant willingness to pay is already demonstrated and partners are buying elsewhere. Phase 3: Phase three: exit or restructure the eleven cities where batching will never reach economic rates, releasing capital and management attention for density markets.
OUTCOME
The client lifted membership enrolment from 19% to 44% of active users within eleven months and moved blended contribution positive for the first time (client-reported, unverified by MMA). Advertising reached $18 million in its first year, seven of the eleven identified cities were exited, and the remaining four were restructured onto a marketplace listing model.

Frequently Asked Questions

Foundational context covering the market sizes, CAGR, scope, country, region and competition that inform every finding below. This section is provided to cover basics and most often pre-purchase conversations, answered from the MMA Primary Research Dataset.

What is the current size of the Online Food Delivery Services Market?

The global online food delivery services market was valued at $380.0 billion in 2025, reaching an estimated $415.72 billion in 2026. That measures gross order value processed through delivery platforms and services.

How large will the Online Food Delivery Services Market be by 2036?

MMA forecasts the market reaching $1,020.88 billion by 2036, an increase of $605.16 billion over the 2026 base. That represents an expansion multiple of 2.46 times across the forecast period.

What is the CAGR for the Online Food Delivery Services Market 2026 to 2036?

The base case compound annual growth rate is 9.4%, with a bull case of 10.7% and a bear case of 8.2%. Historical growth between 2020 and 2025 ran at 8.6% annually.

Which segment is growing fastest?

Cloud kitchen and virtual brand delivery grows at 14.1%, a full 1.50 times the market rate, on predictable preparation times that let platforms batch orders. Subscription meal plan delivery follows at 12.6%.

Who are the major companies in the Online Food Delivery Services Market?

Meituan, Uber Technologies, DoorDash, Delivery Hero and Alibaba Group lead on gross order value processed. Together they account for roughly 62%, though they mostly operate in separate regions.

Which country is growing fastest?

India grows fastest at 15.2% annually, driven by an urban population that has barely begun ordering combined with courier costs far below Western levels. Indonesia and Vietnam follow closely.

Report Segmentation Architecture

The full report scope spans multiple orthogonal segmentation dimensions, with cross-tabulated demand data provided for each dimension pair. Coverage extends further to regional breakdowns, trend trajectories, and the competitive detail needed to support segment-level decision-making.

By Order Type

  • On-Demand Individual Restaurant Delivery
  • Cloud Kitchen and Virtual Brand Delivery
  • Subscription Meal Plan Delivery
  • Scheduled and Group Catering Delivery
  • Pickup and Click-and-Collect Orders

By End-Use Industry

  • Independent Restaurants and Cafes
  • Quick Service Restaurant Chains
  • Casual and Full Service Dining
  • Cloud Kitchen and Virtual Brand Operators
  • Corporate and Institutional Catering
  • Convenience and Forecourt Food Service

By Commercial Dimension

  • Platform-Fulfilled Delivery Logistics
  • Marketplace Listing with Restaurant Self-Delivery
  • Subscription Membership Programmes
  • Platform Advertising and Promoted Placement
  • White Label Ordering for Restaurant Brands

By Region

  • North America
  • Western Europe
  • East Asia
  • South Asia and Pacific
  • Latin America
  • Middle East and Africa
  • Eastern Europe

Scope, Methodology, and Coverage

Every figure in this report is reproducible from documented input assumptions. The scope below maps the historical period, the forecast horizon, the segmentation dimensions, and the countries covered, alongside the underlying primary and qualitative methodology.
Historical Period
2020 to 2025
Forecast Period
2026 to 2036
Base Year
2025 (USD billions; MMA Primary Research Dataset, August 2026)
Market Definition
This report covers online platforms and services delivering prepared food from restaurants, cloud kitchens and food operators to consumers, spanning on-demand individual delivery, cloud kitchen and virtual brand fulfilment, subscription meal plan delivery, scheduled and catering orders, and click-and-collect ordering, measured as gross order value processed. Grocery and convenience quick commerce, meal kit ingredient boxes, restaurant point-of-sale and kitchen software sold independently, and business-to-business foodservice distribution are excluded from the sizing.
Quantitative Units
USD billions of gross order value processed; order volume in billions; average order value in USD.
Segmentation Dimensions
By order type; by end-use industry; by commercial dimension; by region.
Regions Covered
North America, Western Europe, East Asia, South Asia and Pacific, Latin America, Middle East and Africa, Eastern Europe
Countries Covered
China, Japan, South Korea, India, Indonesia, Vietnam, Philippines, Australia, United States, Canada, Mexico, Brazil, Colombia, United Kingdom, Germany, France, Spain, Poland, Turkey, Saudi Arabia.
Key Companies Profiled
Meituan, Uber Technologies, DoorDash, Delivery Hero, Alibaba Group, Just Eat Takeaway.com, Grab Holdings, Deliveroo, Eternal, Swiggy, Rappi, iFood, Coupang, Woowa Brothers and others.
Quantitative Methodology
Primary survey, n=3,800 respondents, Q4 2025, six countries; demand-side model with trade association cross-validation
Qualitative Methodology
47 expert interviews, Q4 2025; applied to validate demand model assumptions, identify emerging dynamics, and assess competitive positioning
Report Format
PDF and XLSX data workbook (Word format preview document)
Publisher
Market Minds Advisory
Report Code
MMA-2026-TEC-068
Published
August 2026
Contact
sales@marketmindsadvisory.com | www.marketmindsadvisory.com

Purchase the full Online Food Delivery Services Market Report (2026 to 2036).

The full report sizes the online food delivery services market across five order types, six end-use categories and seven regions, with order volume and average order value detail behind every estimate. It profiles twenty companies on city density position, membership programme depth and advertising capability. Regional chapters cover courier regulation, order frequency and platform structure by market. Unit economics analysis quantifies courier cost, batching rates and contribution by city archetype. Regulatory analysis maps courier classification across the major jurisdictions, with implementation timetables where these have been published.
Order volume and average order value by type
Courier classification regulation across major jurisdictions compared
City-level batching and contribution economics modelled
Membership programme benchmarking across regional platforms
Competitive position assessments across twenty companies
Advertising revenue development and margin contribution analysis

Built For The People Who Decide

From boardroom strategy to bench-side execution, this report is read cover-to-cover by leaders shaping the next decade of their industry, turning demand scenarios, market dynamics and valuation benchmarks into decisions.
CXOs/ Presidents/ VPs/ Managers
M&A and Corporate Development
Strategy Teams and R&D Heads
Procurement and Product Directors
Regulatory and Compliance Leaders
Investor Relations and Equity Analysts