Market Minds Advisory
Online Clothing Rental Market

Online Clothing Rental Market: Online Clothing Rental Market: Reverse Logistics Economics, Occasion Wear Reality and Why Subscription Keeps Failing

Every rental garment has to be shipped back, inspected, cleaned and shipped out again, and that round trip costs more than most operators manage to charge for the rental itself.

Lead Analyst

Published

September 2026

Make Smarter Decisions with Customized Research Insights

Request a free sample report and evaluate market opportunities, growth trends, and competitive dynamics relevant to your business needs.

2025 MARKET VALUE$2.4BMarket Size 2025
2036 FORECAST VALUE$5.5BBase Case , 2026 to 2036
CAGR 2026 TO 20367.8 %Bull 9.1% / Bear 6.5%
INCREMENTAL OPPORTUNITY$2.9BNet 10- year value creation
EXPANSION MULTIPLE2.12x2036 value over 2026 base
Strategic Levers
M&A Pipeline
Regional Outlook
Country Rankings
Competitive Intelligence
Segmental Deep-dive
Call-Us : 91 93563 13602

Executive Snapshot and Market Trajectory.

Clothing rental works when a garment is expensive, worn once and returned quickly. It stops working the moment any of those three conditions fails. Most of the operators that collapsed had built for the everyday wardrobe instead, where none of them hold at all. That was the whole error.
Occasion and event wear grows at 11.7%, half again the market rate of 7.8%, because a dress worn to one wedding is exactly the product this model was built for. Designer handbags and accessories follow at 10.4%. Everyday workwear subscription grows slowest at 2.9%, still the segment that attracted the most capital and delivered the least of it back. Nothing about that gap is fashionable.
Reverse logistics is the whole business and it sits where nobody looks. Shipping back, inspecting, cleaning and reshipping a garment runs about 38% of revenue per rental, which is why utilisation rate rather than catalogue size decides whether an operator survives. Concentration is moderate at 38% held by the top five, and Indian demand is growing at 14.2% on a wedding market unlike anywhere else. Western platforms have no equivalent demand to build on.
Market Definition
This market covers garments and fashion accessories rented to consumers through online platforms, spanning occasion and event wear, designer handbags and accessories, everyday workwear subscription, maternity and transitional clothing, children's clothing rental, and outdoor and technical apparel. Sizing is at gross rental revenue. Peer-to-peer resale, permanent secondhand sale, costume hire through physical-only shops, and business uniform leasing are excluded.
Base Year Value
$2.4B in 2025 (MMA Primary Research Dataset, September 2026)
Forecast Period
2026 to 2036, eleven discrete annual values
CAGR
7.8% base case. Bull 9.1%. Bear 6.5%.
Fastest Growth Segment
Occasion And Event Wear: 11.7% CAGR
Fastest Growth Country
India: 14.2% CAGR
Fastest Growth Region
South Asia and Pacific: 10.1% CAGR
Largest Region
East Asia: 31% of 2025 global value
Market Leaders
Rent the Runway, Flyrobe, HURR, By Rotation, Le Tote. Source: MMA Primary Research Dataset, July 2026.
Primary Survey
n=3,800 procurement and R&D decision-makers, Q4 2025, six countries
Methodology
Demand-side build-up, cross-validated against public data, 47 expert interviews

Online Clothing Rental Market Forecast Scenarios

online-clothing-rental-market-share-analysis-size-forecast-scenario-1790023952900
Growth of 6.6% between 2020 and 2025 is the average of a near-death experience and a recovery. Occasion rental collapsed through 2020 and 2021 because the occasions themselves stopped happening, and several well-funded operators failed outright rather than contracting. Demand returned sharply from 2022 as weddings and events resumed, but the capital had gone and the survivors rebuilt on considerably more careful unit economics.
Three mechanisms carry the base case. Occasion wear grows at 11.7% because the use case genuinely works: expensive garment, single wearing, quick return. Indian demand expands at 14.2% on a wedding market where outfit expectations are high and repeat wearing is socially discouraged. Reverse logistics automation is cutting the cost of the round trip, which is the single variable that decides whether any of this is profitable at scale. None of the three depend on consumer attitudes shifting.
The bull case is logistics cost falling far enough to make everyday rental viable. If the round trip drops below a fifth of rental revenue, subscription becomes defensible rather than aspirational. The bear case is garment lifecycle. Rental depends on a garment surviving enough rentals to cover its purchase, and lighter construction across fashion shortens that considerably.

What The Round Trip Costs

The economics here are decided in a warehouse rather than on a website. Returning, inspecting, cleaning and reshipping a garment consumes roughly 38% of the revenue that rental earned, and it happens on every single transaction rather than occasionally. That is why utilisation matters more than catalogue breadth: a dress sitting on a rail earns nothing while depreciating, and operators who built enormous catalogues to look impressive discovered exactly that.
TOP FIVE CONCENTRATION38%Combined rental revenue share held by the five largest platforms
REVERSE LOGISTICS COST38%Share of rental revenue consumed by return, cleaning and reshipping
AVERAGE RENTAL PRICEUSD 68Weighted price of a single garment rental across all categories
GARMENT RENTAL CYCLES23 rentalsAverage number of times a garment rents before retirement
UTILISATION RATE44%Proportion of inventory out on rental at any time
OCCASION WEAR SHARE51%Portion of rental revenue coming from event and occasion garments
Occasion wear is about 51% of revenue and it is the only segment where the model works cleanly. An expensive dress worn to one wedding and returned within days hits all three conditions the economics require. Everyday workwear fails every one of them: the garments are cheap enough to buy, worn repeatedly, and kept for weeks. Most of the capital that entered this market went into the version that does not work.
Garments retire after roughly 23 rentals on average, which sets the arithmetic every operator here must satisfy. A garment must earn back its purchase price plus 23 round trips before it contributes anything. Construction quality therefore matters far more here than it ever does in retail.
"This industry spent a decade trying to rent people their ordinary clothes and losing money on every parcel, while the wedding guest business worked perfectly the entire time. The good idea was sitting there and it was not exciting enough."
Director, Consumer Retail Services Practice · MMA Consumer and Retail Services Practice · September 2026

Market Trends

Occasion Wear Proves The Only Clean Use Case

Occasion and event wear now supplies around 51% of rental revenue and grows at 11.7% against 7.8% for the market, because it satisfies every condition the economics require simultaneously. The garment is expensive enough that buying feels wasteful, it gets worn once, and it comes back within days rather than weeks. Photography culture around weddings and events adds a further push, since wearing the same outfit twice is now visible in a way it never used to be. Operators refocusing here recovered where diversified ones did not. The lesson took a decade and a great deal of capital.
Market Impact: India grows at 14.2% yearly
Automation Attacks The Reverse Logistics Cost Directly

The round trip consumes roughly 38% of rental revenue and it is the only line large enough to change the economics of the whole category. Automated inspection using imaging, ozone and hydrocarbon cleaning systems that cut water and time, and regional micro-fulfilment that shortens the shipping leg all reduce it measurably. Operators who invested report the figure falling toward the high twenties. That is not yet low enough to rescue everyday subscription, but it changes what is viable considerably. Micro-fulfilment also shortens turnaround, which raises utilisation on the same inventory. The two effects compound rather than simply adding together.
Market Impact: Recovers roughly 30% of cost

Market Opportunities and Growth Drivers

Indian Wedding Culture Creates Unmatched Occasion Demand

India grows fastest of any country covered at 14.2%, and the reason is specific rather than general economic growth. Indian weddings run several days with multiple outfit changes, the garments are elaborate and expensive, and wearing the same outfit to a second event carries genuine social cost. That produces exactly the demand pattern rental economics require, at a volume no Western market approaches. Domestic operators including Flyrobe built around this rather than importing a subscription model that would not have worked. Acquisition cost for Indian occasion wear also sits below Western equivalents. Both halves of the economics work at once.
Market Impact: Subscription grows at 2.9% only

Resale Value Recovery Improves Garment Lifetime Economics

A rental garment retires after roughly 23 rentals and its residual sale value now covers a meaningful share of the original purchase, because secondhand demand for designer pieces has strengthened considerably. Operators selling retired inventory through their own channels recover far more than wholesale liquidation returns. That changes the arithmetic on every acquisition decision, since a garment that recovers 30% of cost at retirement needs fewer rentals to break even and can be bought at a higher price point. Wholesale liquidation recovers roughly a third of what a direct sale to a previous renter achieves on the same piece.
Market Impact: Garments retire after 23 rentals

Market Restraints and Challenges

Everyday Subscription Fails On Every Economic Condition

Everyday workwear subscription grows slowest at 2.9% and has consumed more capital than any other segment while returning the least of it. The root cause is that the model needs expensive garments worn once and returned fast, and everyday clothing is cheap to buy, worn repeatedly and kept for weeks, so the round trip cost lands against a low rental price. Operators exiting have redeployed inventory into occasion categories, the only visible recovery pathway. Nothing about the segment improves until the round trip cost falls by roughly half. That is a warehouse problem, not a marketing one.
Market Impact: Occasion supplies 51% of revenue

Garment Construction Limits How Often Anything Rents

Inventory retires after roughly 23 rentals and the constraint is physical: seams, linings, fastenings and embellishment fail before the fabric does. The root cause is that almost nothing in fashion is constructed for repeated commercial cleaning, because nobody designs for it. Commercially it means a garment must earn its purchase price plus 23 round trips before contributing anything at all. Operators responding are commissioning rental-specific construction and specifying reinforcement at the points that actually fail first. Reinforcement at those points costs a small premium and extends lifetime by most of a factor of two. Very few operators specify anything.
Market Impact: Round trip costs 38% of revenue
3 additional market trends, 4 additional growth drivers, and 2 additional restraints and challenges are covered in the full report. Contact sales@marketmindsadvisory.com to access the complete intelligence.

Segment CAGR and Growth Architecture

Segmentation follows garment category, the dimension on which rental price, holding period, return speed and lifetime cycles all divide together. Six categories are assessed at gross rental revenue. Peer-to-peer resale, permanent secondhand sale, physical-only costume hire, and business uniform leasing sit outside the defined scope here throughout. Round trip cost varies by a factor of two across the six.
online-clothing-rental-market-share-analysis-market-share-analysis-1790023953433

Occasion And Event Wear

Occasion and event wear grows at 11.7%, half again the market rate of 7.8%, and supplies around 51% of revenue because it is the only category where every economic condition holds at once. The garment is expensive enough that buying it for one wedding feels wasteful, it gets worn a single time, and it returns within days rather than being held for weeks. Photography around events adds pressure, since repeating an outfit is now visible in a way it was not a decade ago. Indian demand is the clearest expression of this, growing at 14.2% on a wedding culture that produces the pattern naturally. Operators who refocused here recovered while diversified ones did not.
CAGR 11.7%

Designer Handbags And Accessories

Designer handbags and accessories grow at 10.4% on economics that are better than garments in almost every respect. Bags do not require cleaning between rentals in the way clothing does, they carry no sizing problem so inventory serves every customer, and they survive far more than 23 cycles before retiring. Residual value is also stronger, since the secondhand market for recognised designer bags is deep and liquid. The constraint is acquisition cost and authentication, because a counterfeit entering inventory damages a platform in ways that are slow and expensive to repair. Acquisition cost is the other half of that trade, since a bag costs more to put into inventory than a dress. Utilisation has to be high to justify it.
CAGR 10.4%
Full segment breakdown across 6 segments available in the complete report.

Regional Architecture and Country Demand Map

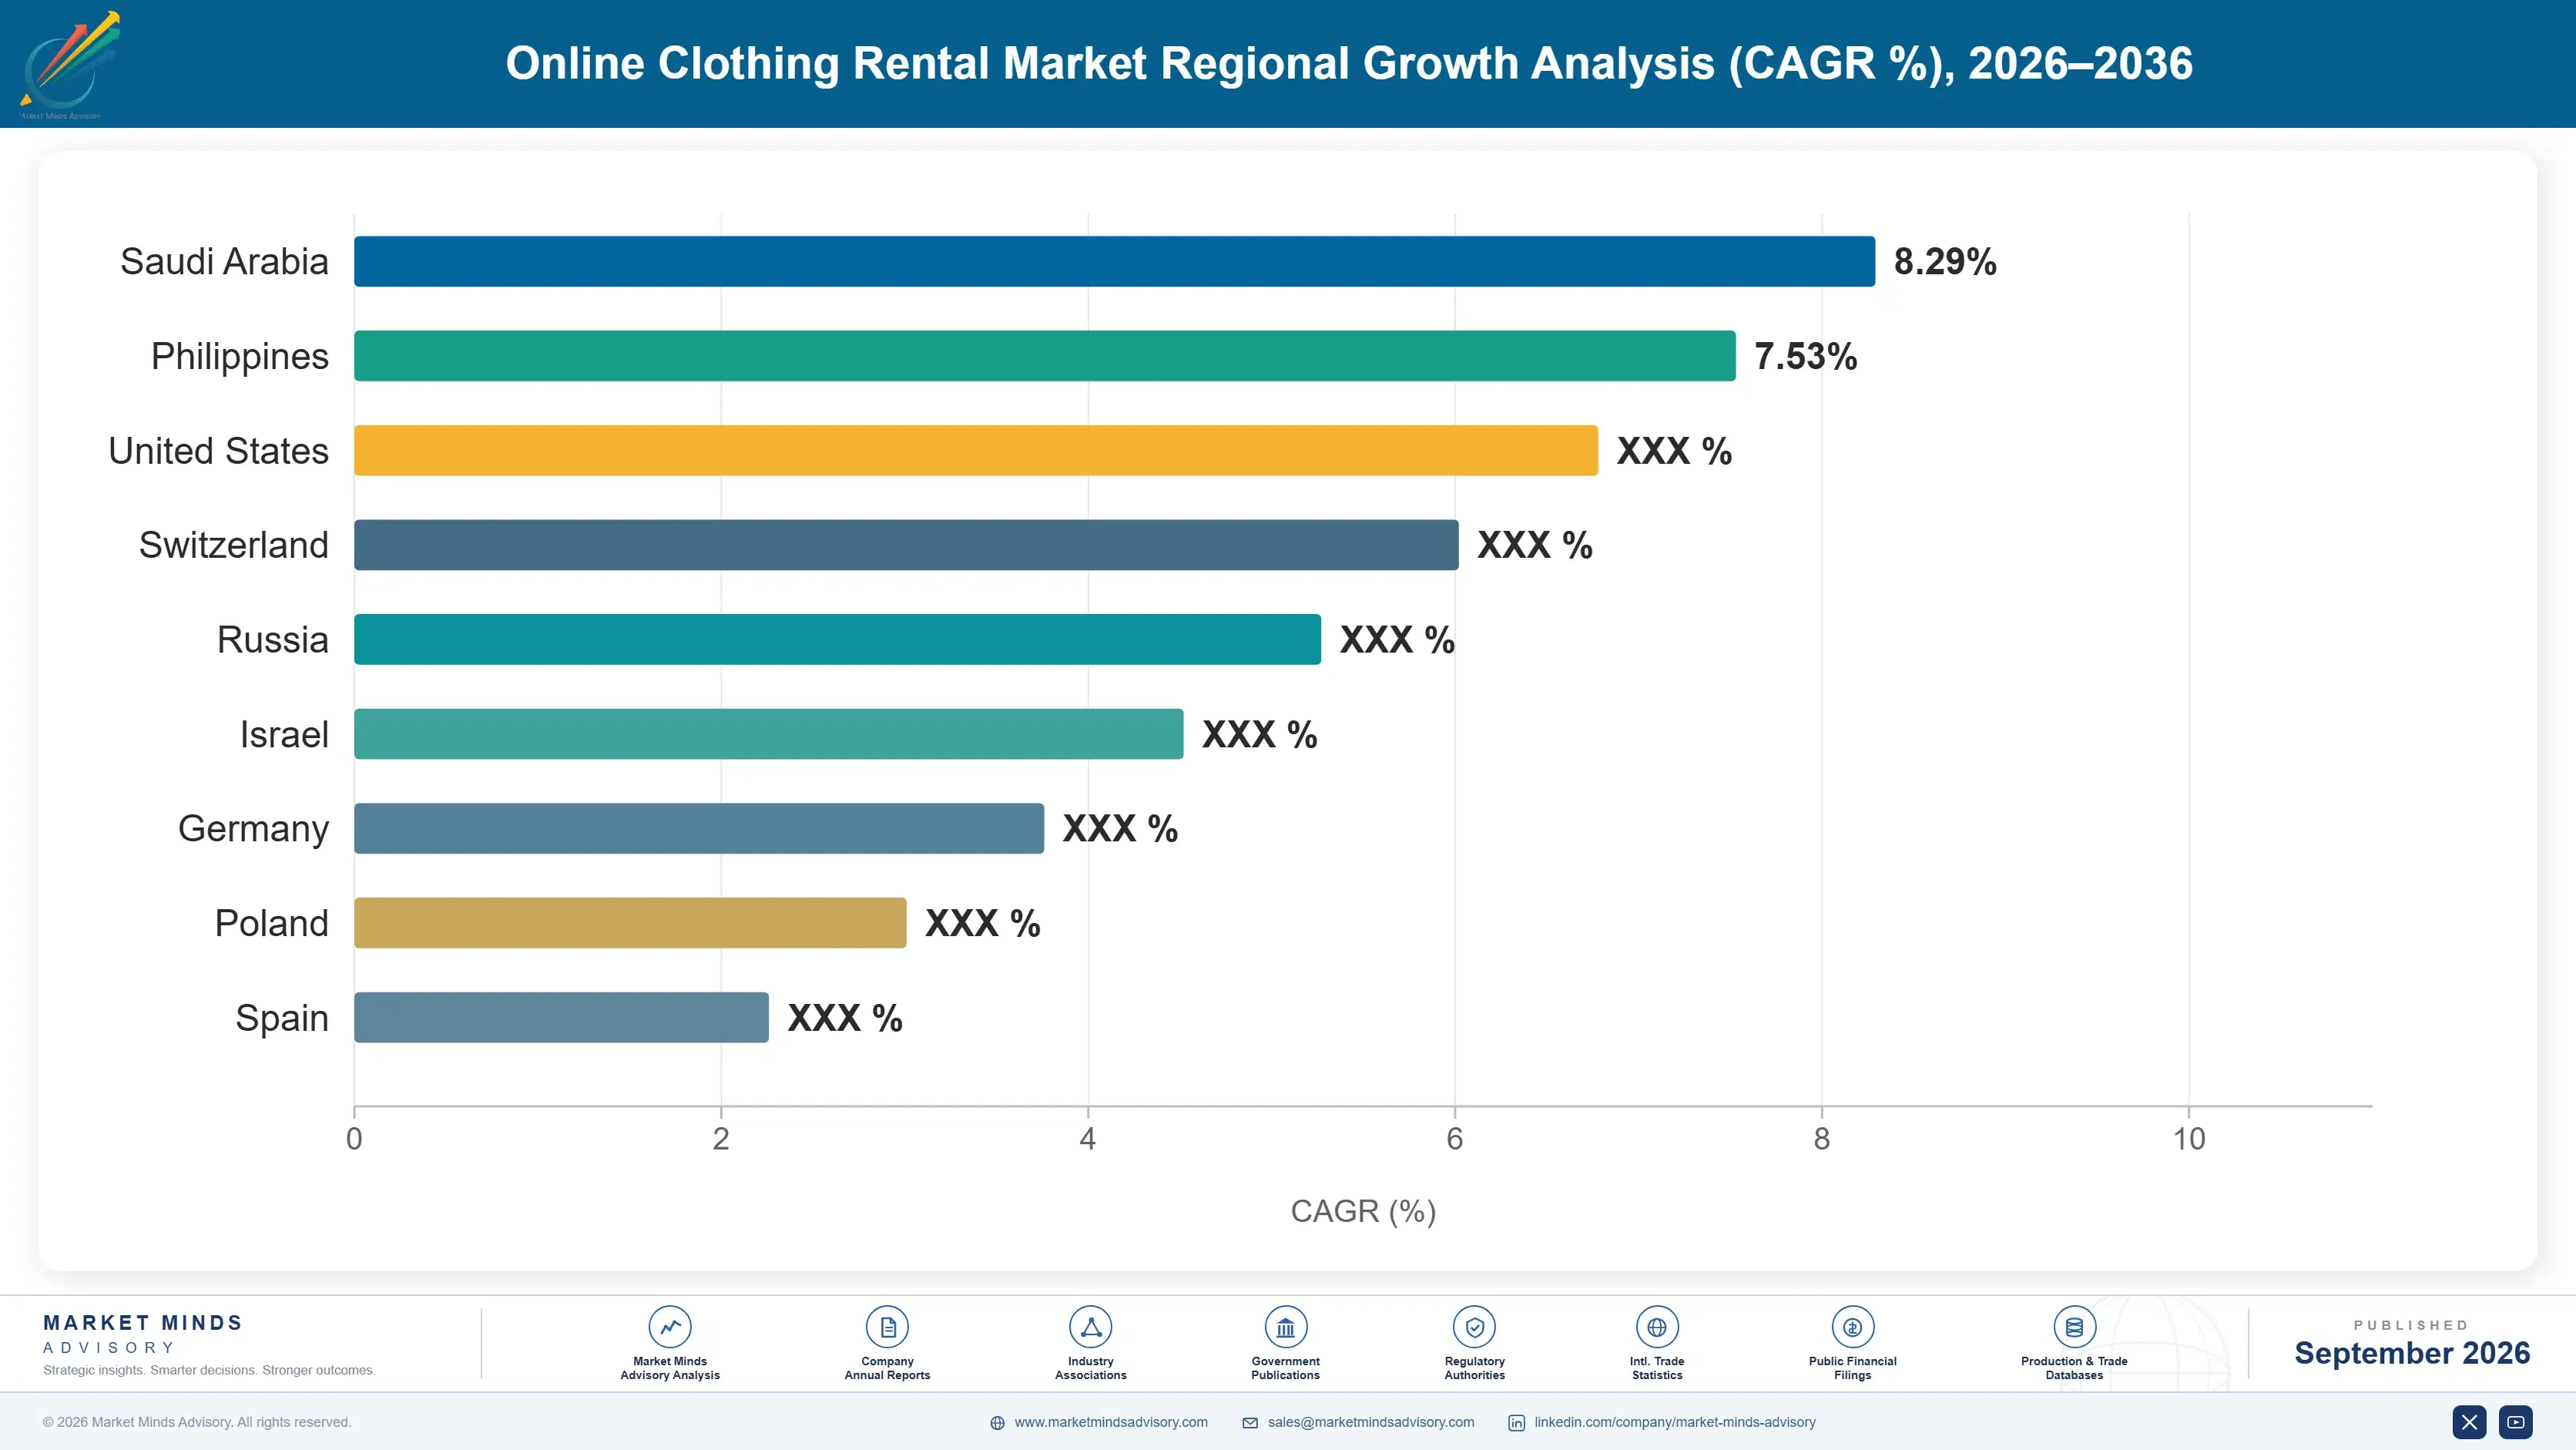
Shares record where the rental is transacted rather than where garments are manufactured. East Asia sits above its standard band on occasion demand and urban density, and Eastern Europe below on limited platform presence and lower disposable spending. Both deviations carry a stated reason in the paragraph concerned.

East Asia

At 31% this sits above the standard band, carried by Chinese, Japanese and Korean markets where urban density makes the logistics genuinely work. Short delivery distances in dense cities cut the shipping leg that dominates cost everywhere else, and Chinese platforms operate with return windows measured in hours rather than days. Occasion demand is strong across all three markets, and Japanese formal wear rental has operated for decades through department stores before any platform existed. Growth of 8.8% reflects both category expansion and the logistics advantage compounding together. Korean platforms have grown quickly around event and photography demand specifically. Chinese operators run turnaround cycles Western platforms cannot match on any comparable cost base, largely because distances are shorter.
Share: 31% | CAGR: 8.8% (2026 to 2036)

North America

The 25% position covers the market where this category was invented and where the most capital was lost. Rent the Runway established the model and also demonstrated how badly everyday subscription performs, and several well-funded competitors failed outright between 2020 and 2022. Shipping distances are long, which pushes reverse logistics cost above the global average and makes micro-fulfilment necessary rather than optional. Growth of 7.0% reflects a market rebuilding on occasion wear after the subscription experiment consumed most of the available capital. Handbag rental has performed considerably better than garment subscription here, for the same reasons it does everywhere: no cleaning, no sizing constraint and far more cycles per unit. Canadian volumes are small and served from the United States.
Share: 25% | CAGR: 7.0% (2026 to 2036)
Regional intelligence for 5 additional markets available in the complete report: Western Europe, South Asia and Pacific, Latin America, Middle East and Africa, Eastern Europe. Contact sales@marketmindsadvisory.com.
online-clothing-rental-market-share-analysis-country-cagr-analysis-1790023953984

Four Moves Worth Making Now

These four address a market where the warehouse decides profitability, occasion wear is the only clean use case, and the segment that attracted the most capital returned the least. Each has been executed by at least one operator with measured results rather than asserted ones afterwards. Two of the four require only a reallocation decision rather than capital.

Concentrate Inventory In Occasion And Event Categories

Occasion wear supplies around 51% of revenue and grows at 11.7% while everyday subscription grows at 2.9%, and the difference is economic rather than fashionable. Expensive garments worn once and returned within days satisfy every condition the model requires. Operators who redeployed subscription inventory into occasion categories report revenue per garment rising roughly 2.3 times within a year, on the same warehouse, the same staff and largely the same customer base. The warehouse was already built for a harder problem than this one. Redeployment costs acquisition budget rather than infrastructure, which is why it moves quickly.
Market Impact: Revenue per garment rises roughly 2.3 times higher

Attack The Round Trip Through Regional Fulfilment

Reverse logistics consumes about 38% of rental revenue and shipping distance is the largest component of it. Regional micro-fulfilment shortens both legs and cuts transit damage, which reduces inspection failures at the same time. Operators who moved from single national warehouses to regional nodes report round trip cost falling to around 29% of revenue, which converts directly into margin and also shortens turnaround so the same garment rents more often each season. Faster turnaround also raises utilisation on the same inventory, so the benefit compounds rather than simply adding. Fixed cost duplication across nodes is the obstacle before volume arrives.
Market Impact: Round trip cost falls to roughly 29% overall

Commission Garments Built For Repeated Commercial Cleaning

Inventory retires after roughly 23 rentals and it fails at seams, linings and fastenings rather than in the fabric, because nothing in fashion is constructed for commercial cleaning cycles. Specifying reinforcement at those points during commissioning costs a small premium on acquisition. Operators who did it report garment lifetime rising to around 41 rentals, which is a 78% increase in earning capacity for a unit cost increase in the low single digits. It requires order volumes large enough for a manufacturer to accept bespoke specification, which is the practical barrier. Most operators have never given a supplier any specification.
Market Impact: Garment lifetime rises to around 41 rentals overall

Sell Retired Inventory Through Owned Channels

A retired garment sold through wholesale liquidation recovers a fraction of what the same piece earns sold directly to a customer who already rented it and liked it. Secondhand demand for designer pieces is deep and the platform already holds the audience. Operators running owned resale report recovering around 30% of original acquisition cost against roughly 11% through liquidation, which changes what price point is rational to buy at in the first place. The renter already knows the garment fits and already liked it enough to wear it once. That is a far better conversion position than any liquidator holds.
Market Impact: Recovery reaches 30% against 11% through liquidation instead

Who Controls the Margin Pool

Concentration is moderate at 38% held by the top five, measured consistently on gross rental revenue rather than on catalogue size, which would reward inventory that sits on rails earning nothing. The leader to challenger gap is narrow and unstable, because this is a young category where several well-funded participants failed outright between 2020 and 2022 and the survivors rebuilt on different economics entirely.
Competition runs on three dimensions currently. Inventory relevance decides occasion bookings, since a customer wants a specific look for a specific event and a near miss converts at nothing. Turnaround speed decides utilisation and therefore profitability, and it varies enormously between operators handling identical categories. Brand access decides premium positioning, because designers grant rental rights selectively and a refused label cannot be substituted.

Pressure is building from two directions and positions will move on both. Fashion brands are launching rental directly, which removes the access advantage that platforms built on and gives the brand the customer relationship. Regional operators in India and East Asia are growing faster than Western platforms on demand patterns that suit the model naturally, and none of them need to import a business model that already failed.
online-clothing-rental-market-share-analysis-company-positioning-matrix-1790023954505

Competitive Moat and Risk Dimensions

RENT THE RUNWAY

Moat: Designer Relationships And Scale

Rental rights negotiated with a large number of designers over more than a decade give catalogue breadth that a new entrant cannot assemble, since each label negotiates separately and many decline. Operational scale in warehousing and cleaning also produces unit costs that smaller operators cannot reach.
RENT THE RUNWAY

Risk: Subscription Model Legacy Exposure

A business built substantially on everyday subscription carries the segment growing slowest at 2.9% and the cost structure that model required. Shifting weight toward occasion wear means competing against operators who never carried that overhead and who built their warehouses for a different rhythm entirely.
FLYROBE

Moat: Indian Occasion Market Position

Building around Indian wedding demand rather than importing a subscription template gives the operator the fastest-growing national market at 14.2% and a use case where the economics work without needing logistics cost to fall first. Local inventory sourcing also keeps acquisition cost well below Western equivalents.
FLYROBE

Risk: Return Reliability Outside Cities

Expansion beyond major metropolitan areas runs into return logistics that are considerably less reliable, and a garment that does not come back is a complete loss rather than a delayed one. Serving smaller cities profitably requires infrastructure investment that the current unit economics do not obviously fund.

Players Tracked

Prominent Players

Rent the Runway
Flyrobe
HURR
By Rotation
Le Tote

Other Key Players

Nuuly
Armoire
Vivrelle
Bag Borrow or Steal
Rotaro
My Wardrobe HQ
Cocoon Club
Stylelend
Rentez-Vous
Dress and Go
Style Theory
Rent It Bae
Designer 24
Girl Meets Dress
Front Row

Recent Developments

JUNE 2025

Style Theory expands regional fulfilment across Southeast Asia

The operator opened additional regional fulfilment nodes to shorten shipping legs and cut turnaround times across its Southeast Asian markets. This was organic operational investment funded internally, with no acquisition, joint venture or third-party logistics partnership behind the decision. Existing central warehousing continued operating alongside the new nodes.
Signal: Shortening the shipping leg is the clearest route to margin. Distance is the largest and most addressable component.
OCTOBER 2024

Rent the Runway narrows everyday subscription inventory weighting

The company reduced inventory allocated to everyday workwear subscription and redeployed acquisition budget toward occasion and event categories. This was an internal portfolio decision rather than a divestiture, acquisition or partnership of any kind with another party. Subscription remains available to existing members without change.
Signal: Even the category's originator is conceding which use case actually works. Occasion wear was always the business underneath the pitch.
MARCH 2025

Flyrobe signs supply agreement with Indian designer group

The platform agreed direct supply terms with a group of Indian occasion wear designers, securing inventory at acquisition costs below open market purchase. This was a supply agreement with no equity component, joint venture structure or acquisition involved at any point. Designers retain the right to supply other platforms.
Signal: Acquisition cost is where Indian operators hold an advantage Western platforms cannot copy. Local sourcing keeps economics ahead.

What Each Rental Consumes

Reverse logistics dominates and everything else is secondary to it. Outbound and return shipping together run about 21% of rental revenue, cleaning and finishing roughly 11%, and inspection, repair and repackaging a further 6%, which is the 38% round trip. Garment depreciation across an average 23 rentals adds around 24%. Platform, payment and customer service take most of what remains.
Parcel carrier rates rose sharply through 2021 and 2022 across most developed markets as capacity tightened and fuel surcharges climbed, a movement visible in US Census Bureau transportation services data for the period. A category shipping every unit twice absorbed that increase twice over, and several operators whose pricing had been set against earlier rates could not adjust mid-season. Le Tote and other subscription-weighted operators reported margin pressure through that window.

Exposure divides by shipping distance and by category weighting rather than by platform size. Operators serving dispersed national markets from a single warehouse carry the highest cost per round trip and the longest turnaround, which suppresses utilisation at the same time. Handbag-weighted operators avoid cleaning cost almost entirely and survive far more cycles per unit, which is why their economics look better on identical shipping rates.
online-clothing-rental-market-share-analysis-cost-volatility-analysis-1790023954702

Build regional fulfilment nodes to shorten both shipping legs

Shipping is the largest single component of the round trip and distance drives it directly, so moving from one national warehouse to regional nodes cuts cost and turnaround at once. Faster turnaround raises utilisation, which compounds the benefit. The obstacle is fixed cost duplication across nodes before volume justifies it. Volume has to arrive before the duplication pays.

Specify rental-grade construction at the commissioning stage

Garments fail at seams, linings and fastenings rather than in the fabric, because fashion is not constructed for repeated commercial cleaning. Reinforcement specified during commissioning costs a small acquisition premium and extends lifetime substantially. The constraint is that it requires order volumes large enough for a manufacturer to accept bespoke specification. Smaller operators cannot reach that order size.

Shift category weighting toward handbags and accessories

Bags avoid cleaning cost almost entirely, carry no sizing constraint so every unit serves every customer, and survive far more cycles before retiring. Shifting weight toward them improves unit economics on identical shipping rates. The trade is higher acquisition cost per unit and a genuine authentication requirement that garments do not carry. Authentication failure is slow and expensive to repair.

Portfolio Architecture for Margin Defence

Margin architecture divides by round trip cost rather than by rental price, which is not what a price list would suggest. Everyday workwear subscription runs at gross margins in the high teens to high twenties, because a low rental price carries the same shipping, cleaning and inspection cost that an expensive garment carries and the holding period is far longer. A low price against a fixed cost is the entire problem.
Occasion and event wear holds gross margins in the high thirties to high forties. The spread reflects how differently garments at varying price points absorb an essentially fixed round trip cost. A dress renting at USD 180 carries the same logistics burden as one renting at USD 45, which is most of why occasion is the only segment where the model works cleanly.

The highest-value pool is designer handbags and accessories, at margins in the high forties to high fifties. Those units need no cleaning, fit every customer, survive far more cycles and hold residual value. Everyday subscription fills warehouse space and generates activity. It has consumed more capital than any other segment and returned the least. Activity and profitability have been confused here for a decade.

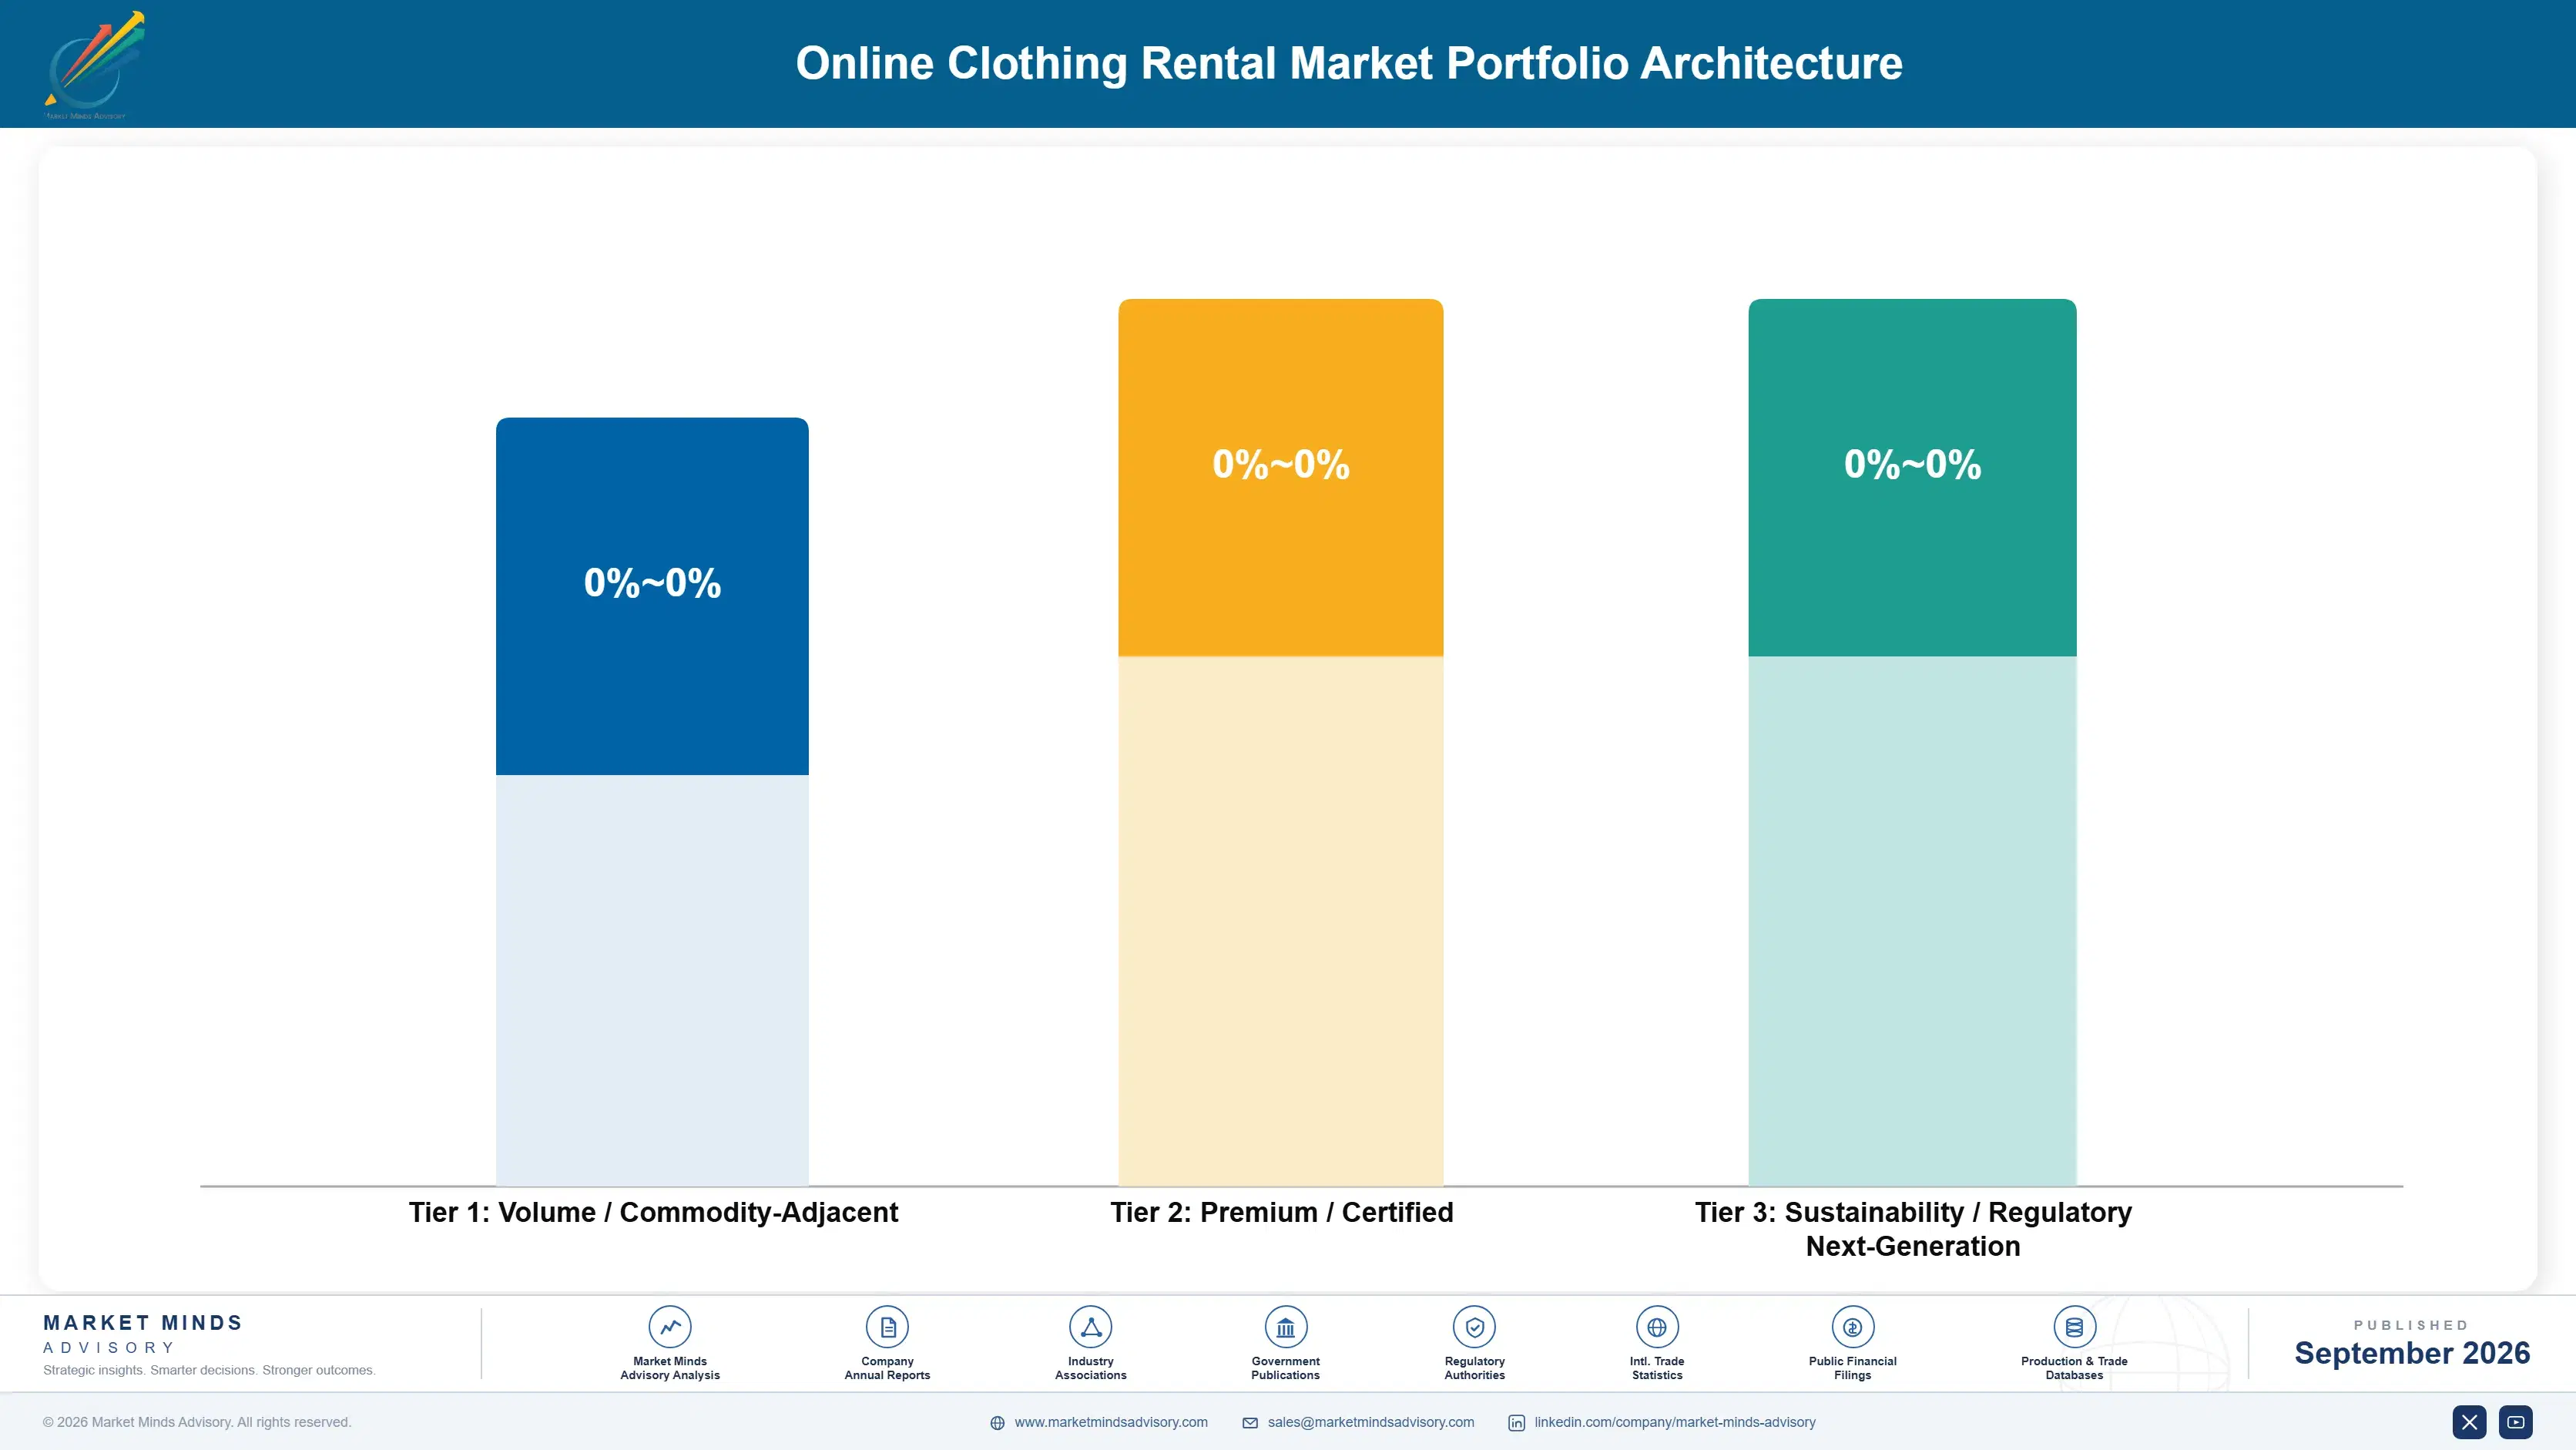
Volume / Commodity-Adjacent

Everyday workwear subscription, where a low rental price carries the same round trip cost as an expensive garment. The eleven point range reflects how sharply outcomes vary with shipping distance.
Gross Margin: 18 to 29%

Premium / Certified

Occasion and event wear, where an essentially fixed round trip cost is absorbed by a much higher rental price. This is the only garment segment where the model works cleanly.
Gross Margin: 37 to 48%

Sustainability / Regulatory / Next-Generation

Designer handbags and accessories. No cleaning requirement, no sizing constraint, far more cycles per unit and residual value that garments never reach at retirement. Acquisition cost and authentication are the offsetting requirements here.
Gross Margin: 47 to 58%
online-clothing-rental-market-share-analysis-portfolio-architecture-1790023955202

High-value Sub-segments and Strategic Watch-out

Occasion And Event Wear

High value and fastest growth at 11.7%. It satisfies every condition the economics require: expensive garment, single wearing, rapid return, and Indian wedding demand expresses that pattern more cleanly than anywhere. Operators who refocused here recovered while diversified competitors did not. Nothing else comes close.
Gross Margin: 38 to 47%

Designer Handbags And Accessories

High value and strong growth at 10.4%. No cleaning cost, no sizing constraint and superior cycle life, though acquisition cost is high and authentication failure damages a platform slowly and expensively. Residual value at retirement is also stronger than any garment category ever reaches at retirement.
Gross Margin: 48 to 57%

Maternity And Transitional Clothing

Volume core with a genuinely sound premise, since the garments are needed for a defined and short period. Holding times are long, which suppresses utilisation and keeps margin below occasion categories. Demand is reliable and the customer needs no persuading about the premise at any point.
Gross Margin: 30 to 38%

Everyday Workwear Subscription

Strategic watch-out. Growing slowest at 2.9% after consuming more capital than any other segment. The sixteen point range reflects how differently dense urban and dispersed national operators carry shipping cost. Redeploying that inventory into occasion categories is the only visible recovery pathway available to anybody now.
Gross Margin: 18 to 34%

How Renters Actually Return

Repeat behaviour here is event-driven rather than habitual, and treating it as a subscription relationship is what sank most of the capital that entered. An occasion renter returns when there is another occasion, which might be three months later or eighteen, and engagement does not change that timing. The task is being remembered when an invitation arrives rather than generating weekly activity.
Stickiness varies sharply by category and by how the first rental went. Occasion renters who received the right garment on time return for the next event, because the alternative is buying something expensive for one wearing. Handbag renters behave closest to subscribers, since the use case is ongoing rather than tied to a date. Everyday subscribers churn hardest of all, typically once they calculate what the year actually cost them.

Buyer profiles have shifted since 2020 in a way that favours the working model. The cohort that entered through occasion rental during the wedding backlog skewed younger and more price-aware, and treats rental as a sensible alternative to a single-wear purchase rather than a sustainability statement. That framing converts far better than the environmental argument the category led with, and most operators still lead with the wrong one.
online-clothing-rental-market-share-analysis-end-use-penetration-index-1790023955694

Where The Model Works

These are among the four positions where our research anticipates prominent divergence between winners and laggards over the coming forecast period. Each is grounded in the demand model, the regulatory perimeter, and the announced capacity pipeline.
01 / OCCASION CATEGORY CONCENTRATION

Put the inventory where the maths works

Occasion wear supplies around 51% of rental revenue and grows at 11.7% while everyday subscription grows at 2.9%, and the gap is economic rather than a matter of fashion. Expensive garments worn once and returned within days satisfy every condition the model requires simultaneously. Operators who redeployed subscription inventory into occasion categories report revenue per garment rising roughly 2.3 times inside a year, using the same warehouse and largely the same customers, which makes this a reallocation decision rather than an investment one.
02 / FULFILMENT NETWORK DESIGN

Shorten both legs of the trip

Reverse logistics consumes about 38% of rental revenue and shipping distance is its largest single component across every market covered here. Regional micro-fulfilment shortens both legs of the trip, reduces transit damage and cuts inspection failures at the same time. Operators moving from single national warehouses to regional nodes report round trip cost falling toward 29% of revenue, which converts directly into gross margin and raises utilisation through faster turnaround, and the two effects compound on one another rather than simply adding.
03 / GARMENT SPECIFICATION DISCIPLINE

Commission for cleaning, not for shopping

Inventory retires after roughly 23 rentals and fails at seams, linings and fastenings rather than in the fabric, because nothing in fashion is built to survive repeated commercial cleaning cycles. Specifying reinforcement at those failure points during commissioning costs a low single digit acquisition premium. Operators who actually did it report garment lifetime reaching around 41 rentals, which is a 78% increase in earning capacity for every unit acquired, for an acquisition premium measured in the low single digit percentages.
04 / RETIREMENT VALUE CAPTURE

Sell the garment to whoever rented it

A retired garment sold through wholesale liquidation recovers a small fraction of what the same piece earns sold directly to a customer who already rented and liked it. Secondhand demand for designer pieces is deep and the platform already holds the relevant audience. Operators running owned resale report recovering around 30% of acquisition cost against roughly 11% through liquidation, which changes what price point is rational to buy at, since the renter already knows the garment fits and liked it.

Engagement Snapshot From the Field

A live engagement with an industry participant carrying material or product regulatory and market exposure ahead of a defining policy shift, showing how our research translates into a defensible multi-year portfolio strategy.
MARKET MINDS ADVISORY · CLIENT ENGAGEMENT SUMMARY
Online Clothing Rental Producer Strategic Portfolio Review and Transition Roadmap 2026·Investment Scenario on Online Clothing Rental Exposure Evaluation 2025-26
CLIENT PROFILE
A European clothing rental platform with gross rental revenue near USD 19 million (client-reported, unverified by MMA), operating a single national warehouse and weighted approximately 58% toward everyday workwear subscription. Occasion wear accounted for 27% of inventory. Retired garments were sold through a wholesale liquidator at rates management had never examined closely. Construction specifications had never been issued.
STRATEGIC CHALLENGE
Subscription churn had risen for six consecutive quarters while occasion bookings grew, and management read the churn as a retention problem requiring engagement spending. A loyalty programme had been approved. Nobody had calculated round trip cost by category or compared it against the rental price each category actually earned. Neither figure existed anywhere.
MMA APPROACH
MMA rebuilt unit economics per rental by category, separating outbound shipping, return shipping, cleaning, inspection and depreciation rather than reporting fulfilment as one line. Garment lifetime was measured by failure point across 4,200 retired units. Liquidation recovery was compared against direct resale on matched inventory. Churn was tested against cumulative annual spend.
KEY FINDINGS
  1. Everyday subscription carried a round trip cost of 44% of rental revenue against 24% for occasion wear, and the two categories had been reported together as a single fulfilment line.
  2. Subscription churn correlated with cumulative annual spend rather than with engagement, meaning the approved loyalty programme addressed a cause that did not exist.
  3. Garments failed at seams and fastenings in 81% of retirements while fabric remained serviceable, and no construction specification had ever been given to suppliers.
  4. Liquidation recovered 9% of acquisition cost against 31% achieved in a direct resale test run to existing renters over one quarter. to renters who had previously taken the piece.
CLIENT PROFILE
A European clothing rental platform with gross rental revenue near USD 19 million (client-reported, unverified by MMA), operating a single national warehouse and weighted approximately 58% toward everyday workwear subscription. Occasion wear accounted for 27% of inventory. Retired garments were sold through a wholesale liquidator at rates management had never examined closely. Construction specifications had never been issued.
STRATEGIC CHALLENGE
Subscription churn had risen for six consecutive quarters while occasion bookings grew, and management read the churn as a retention problem requiring engagement spending. A loyalty programme had been approved. Nobody had calculated round trip cost by category or compared it against the rental price each category actually earned. Neither figure existed anywhere.
MMA APPROACH
MMA rebuilt unit economics per rental by category, separating outbound shipping, return shipping, cleaning, inspection and depreciation rather than reporting fulfilment as one line. Garment lifetime was measured by failure point across 4,200 retired units. Liquidation recovery was compared against direct resale on matched inventory. Churn was tested against cumulative annual spend.
KEY FINDINGS
  1. Everyday subscription carried a round trip cost of 44% of rental revenue against 24% for occasion wear, and the two categories had been reported together as a single fulfilment line.
  2. Subscription churn correlated with cumulative annual spend rather than with engagement, meaning the approved loyalty programme addressed a cause that did not exist.
  3. Garments failed at seams and fastenings in 81% of retirements while fabric remained serviceable, and no construction specification had ever been given to suppliers.
  4. Liquidation recovered 9% of acquisition cost against 31% achieved in a direct resale test run to existing renters over one quarter. to renters who had previously taken the piece.
RECOMMENDED STRATEGY
Phase 1: Phase one: cancel the loyalty programme, halt subscription inventory acquisition and redeploy the budget into occasion categories. Occasion inventory was already proven. Phase 2: Phase two: open two regional fulfilment nodes and specify rental-grade construction on all new commissioning. Node locations follow existing demand density. Phase 3: Phase three: move retirement sales to an owned resale channel targeting renters who previously took the garment. Liquidation continues only for unsold residual.
OUTCOME
Gross margin improved by 11 points across four quarters, with category mix and resale recovery contributing roughly equally (client-reported, unverified by MMA). Round trip cost fell to 30% of revenue once regional nodes opened, and revenue per garment rose by about half as inventory shifted into occasion wear.

Frequently Asked Questions

Foundational context covering the market sizes, CAGR, scope, country, region and competition that inform every finding below. This section is provided to cover basics and most often pre-purchase conversations, answered from the MMA Primary Research Dataset.

What is the current size of the Online Clothing Rental Market?

The market was valued at USD 2.4 billion in 2025, rising to USD 2.6 billion in 2026. Sizing is at gross rental revenue across six garment categories.

How large will the Online Clothing Rental Market be by 2036?

MMA forecasts USD 5.5 billion by 2036, an increase of USD 2.9 billion over the 2026 base. That represents expansion of 2.12 times across the forecast period.

What is the CAGR for the Online Clothing Rental Market 2026 to 2036?

The base case CAGR is 7.8%, with a bull case of 9.1% and a bear case of 6.5%. Historical growth between 2020 and 2025 ran at 6.6%.

Which segment is growing fastest?

Occasion and event wear grows at 11.7%, half again the market rate, because it satisfies every condition the economics require. Designer handbags and accessories follow at 10.4%.

Who are the major companies in the Online Clothing Rental Market?

Rent the Runway, Flyrobe, HURR, By Rotation and Le Tote lead on gross rental revenue, holding a combined 38%. Several well-funded competitors failed outright between 2020 and 2022.

Which country is growing fastest?

India grows fastest at 14.2%, because multi-day weddings with several outfit changes produce the demand pattern rental economics require at unmatched volume. Acquisition cost there also sits well below Western equivalents.

Report Segmentation Architecture

The full report scope spans multiple orthogonal segmentation dimensions, with cross-tabulated demand data provided for each dimension pair. Coverage extends further to regional breakdowns, trend trajectories, and the competitive detail needed to support segment-level decision-making.

By Garment Category

  • Occasion and Event Wear
  • Designer Handbags and Accessories
  • Everyday Workwear Subscription
  • Maternity and Transitional Clothing
  • Children's Clothing Rental
  • Outdoor and Technical Apparel

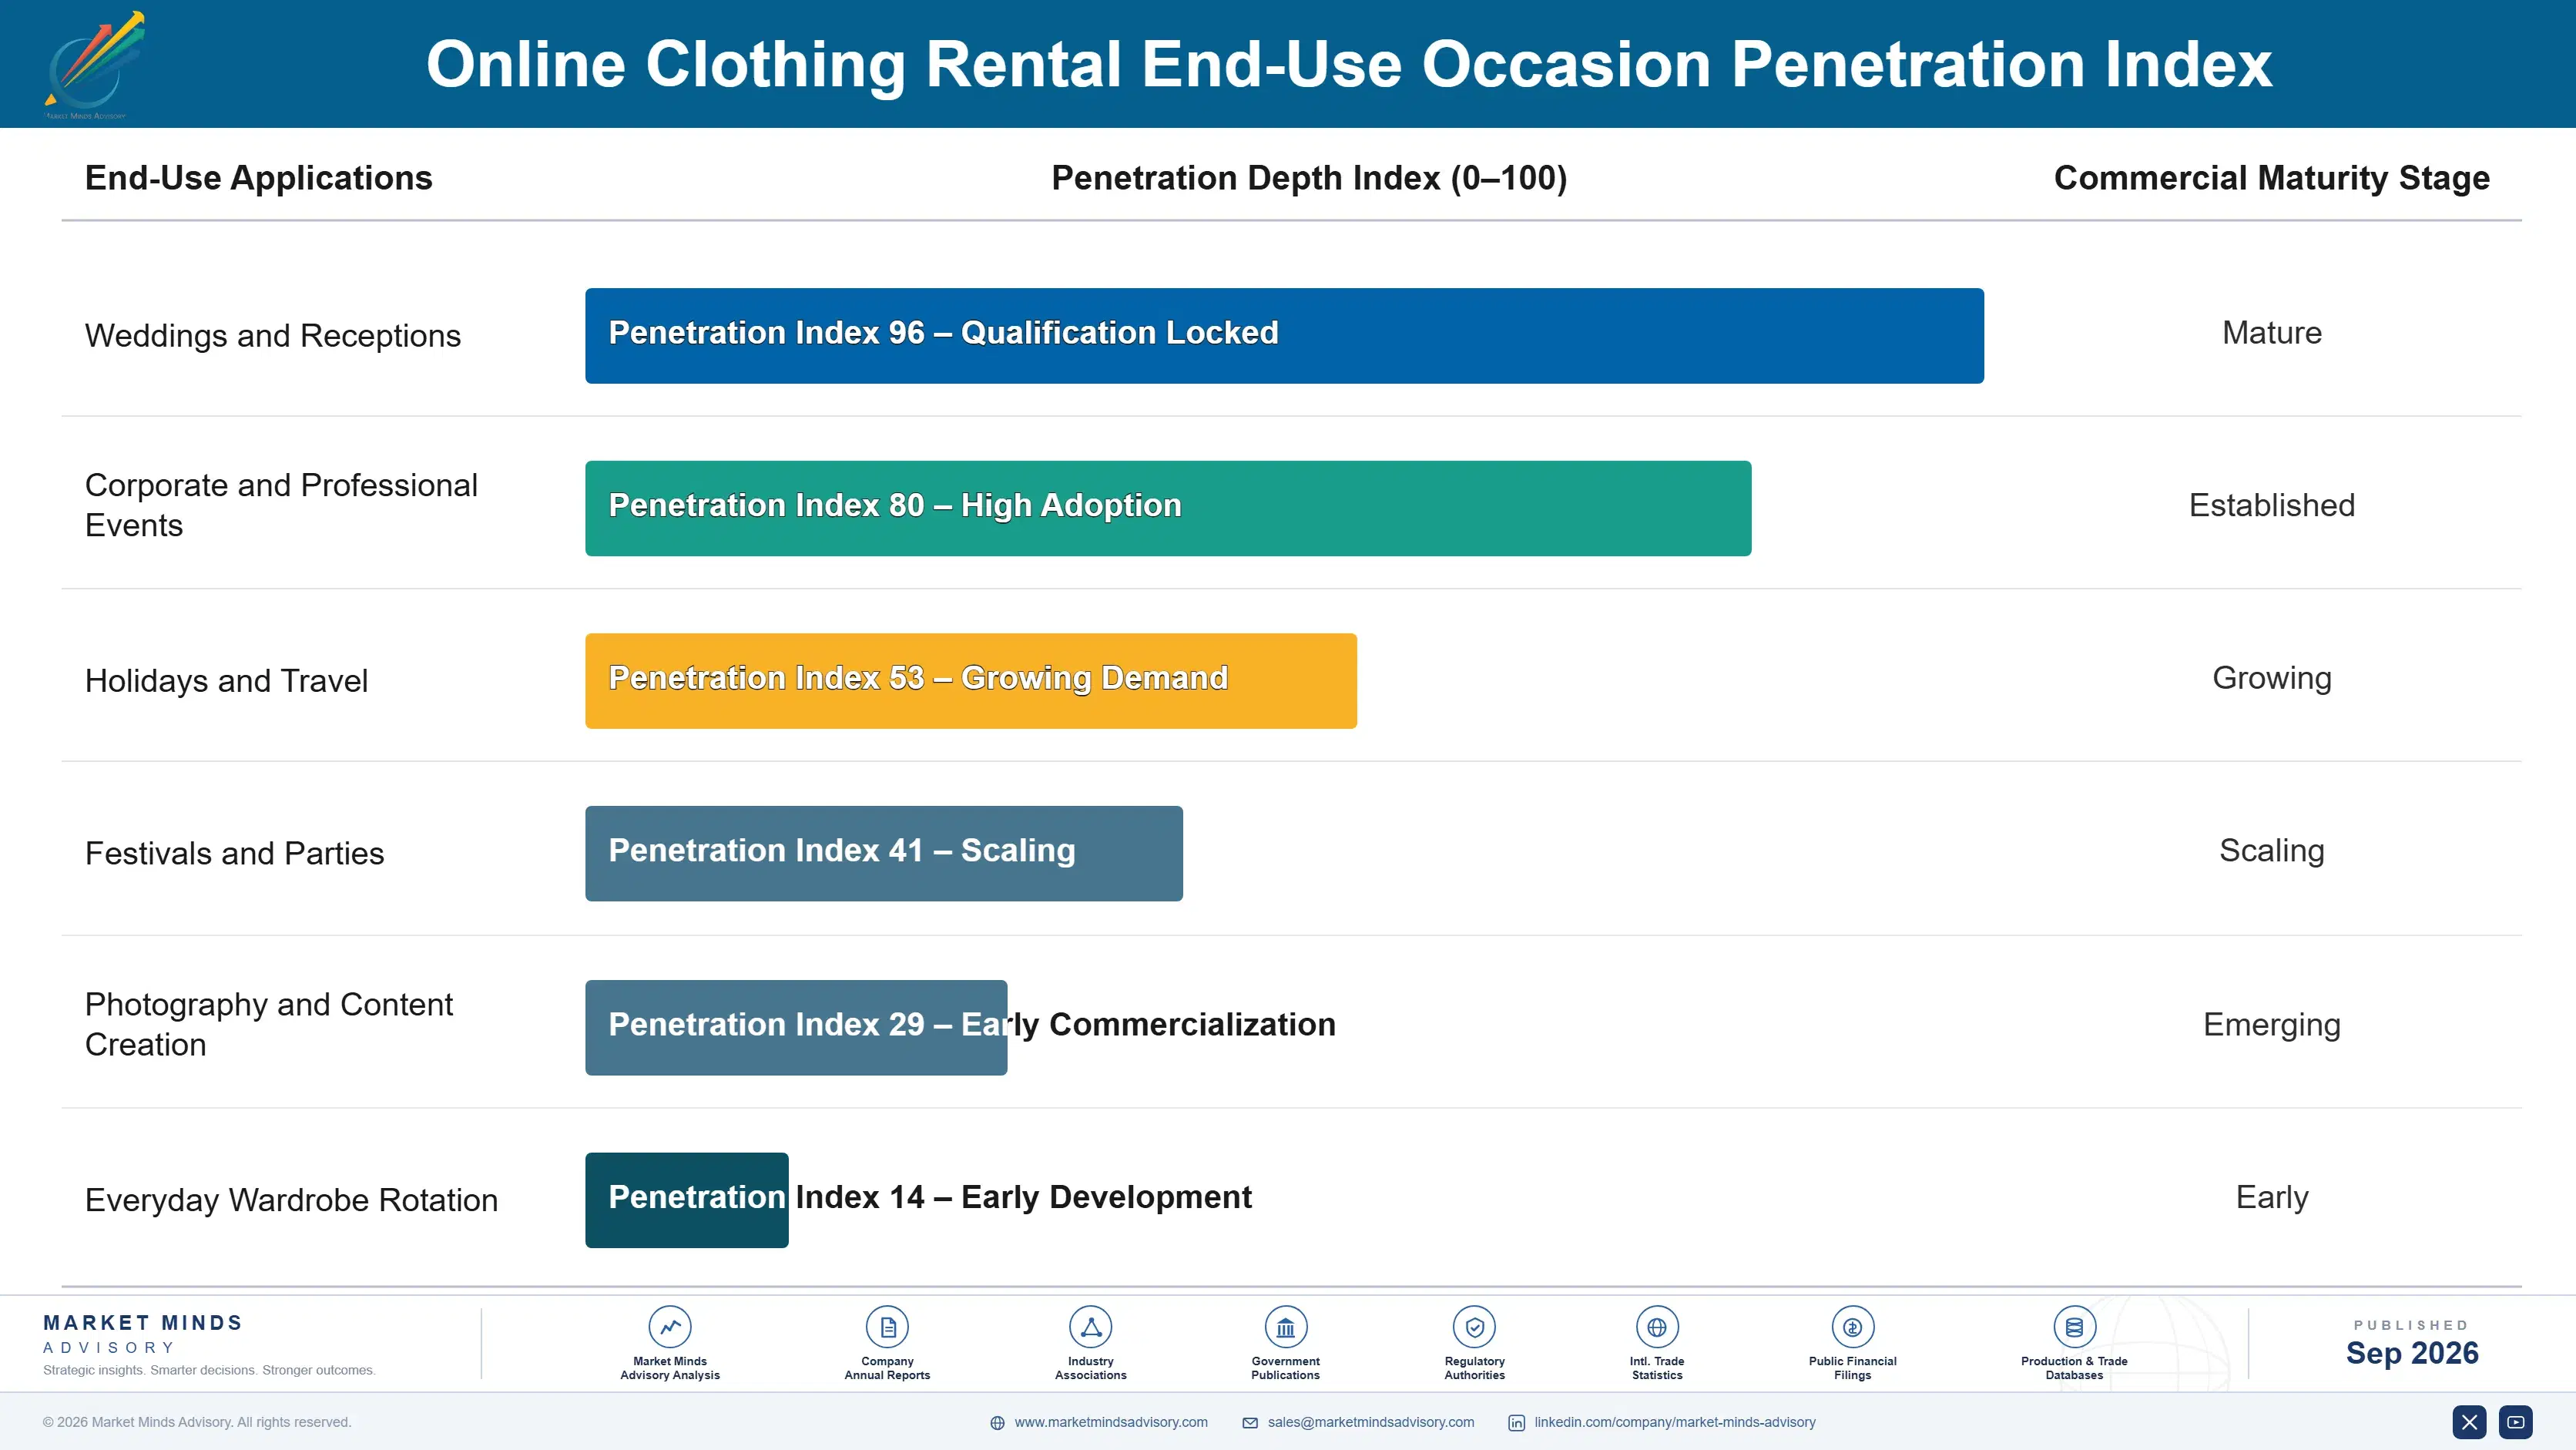
By End-Use Occasion

  • Weddings and Receptions
  • Corporate and Professional Events
  • Holidays and Travel
  • Festivals and Parties
  • Photography and Content Creation
  • Everyday Wardrobe Rotation

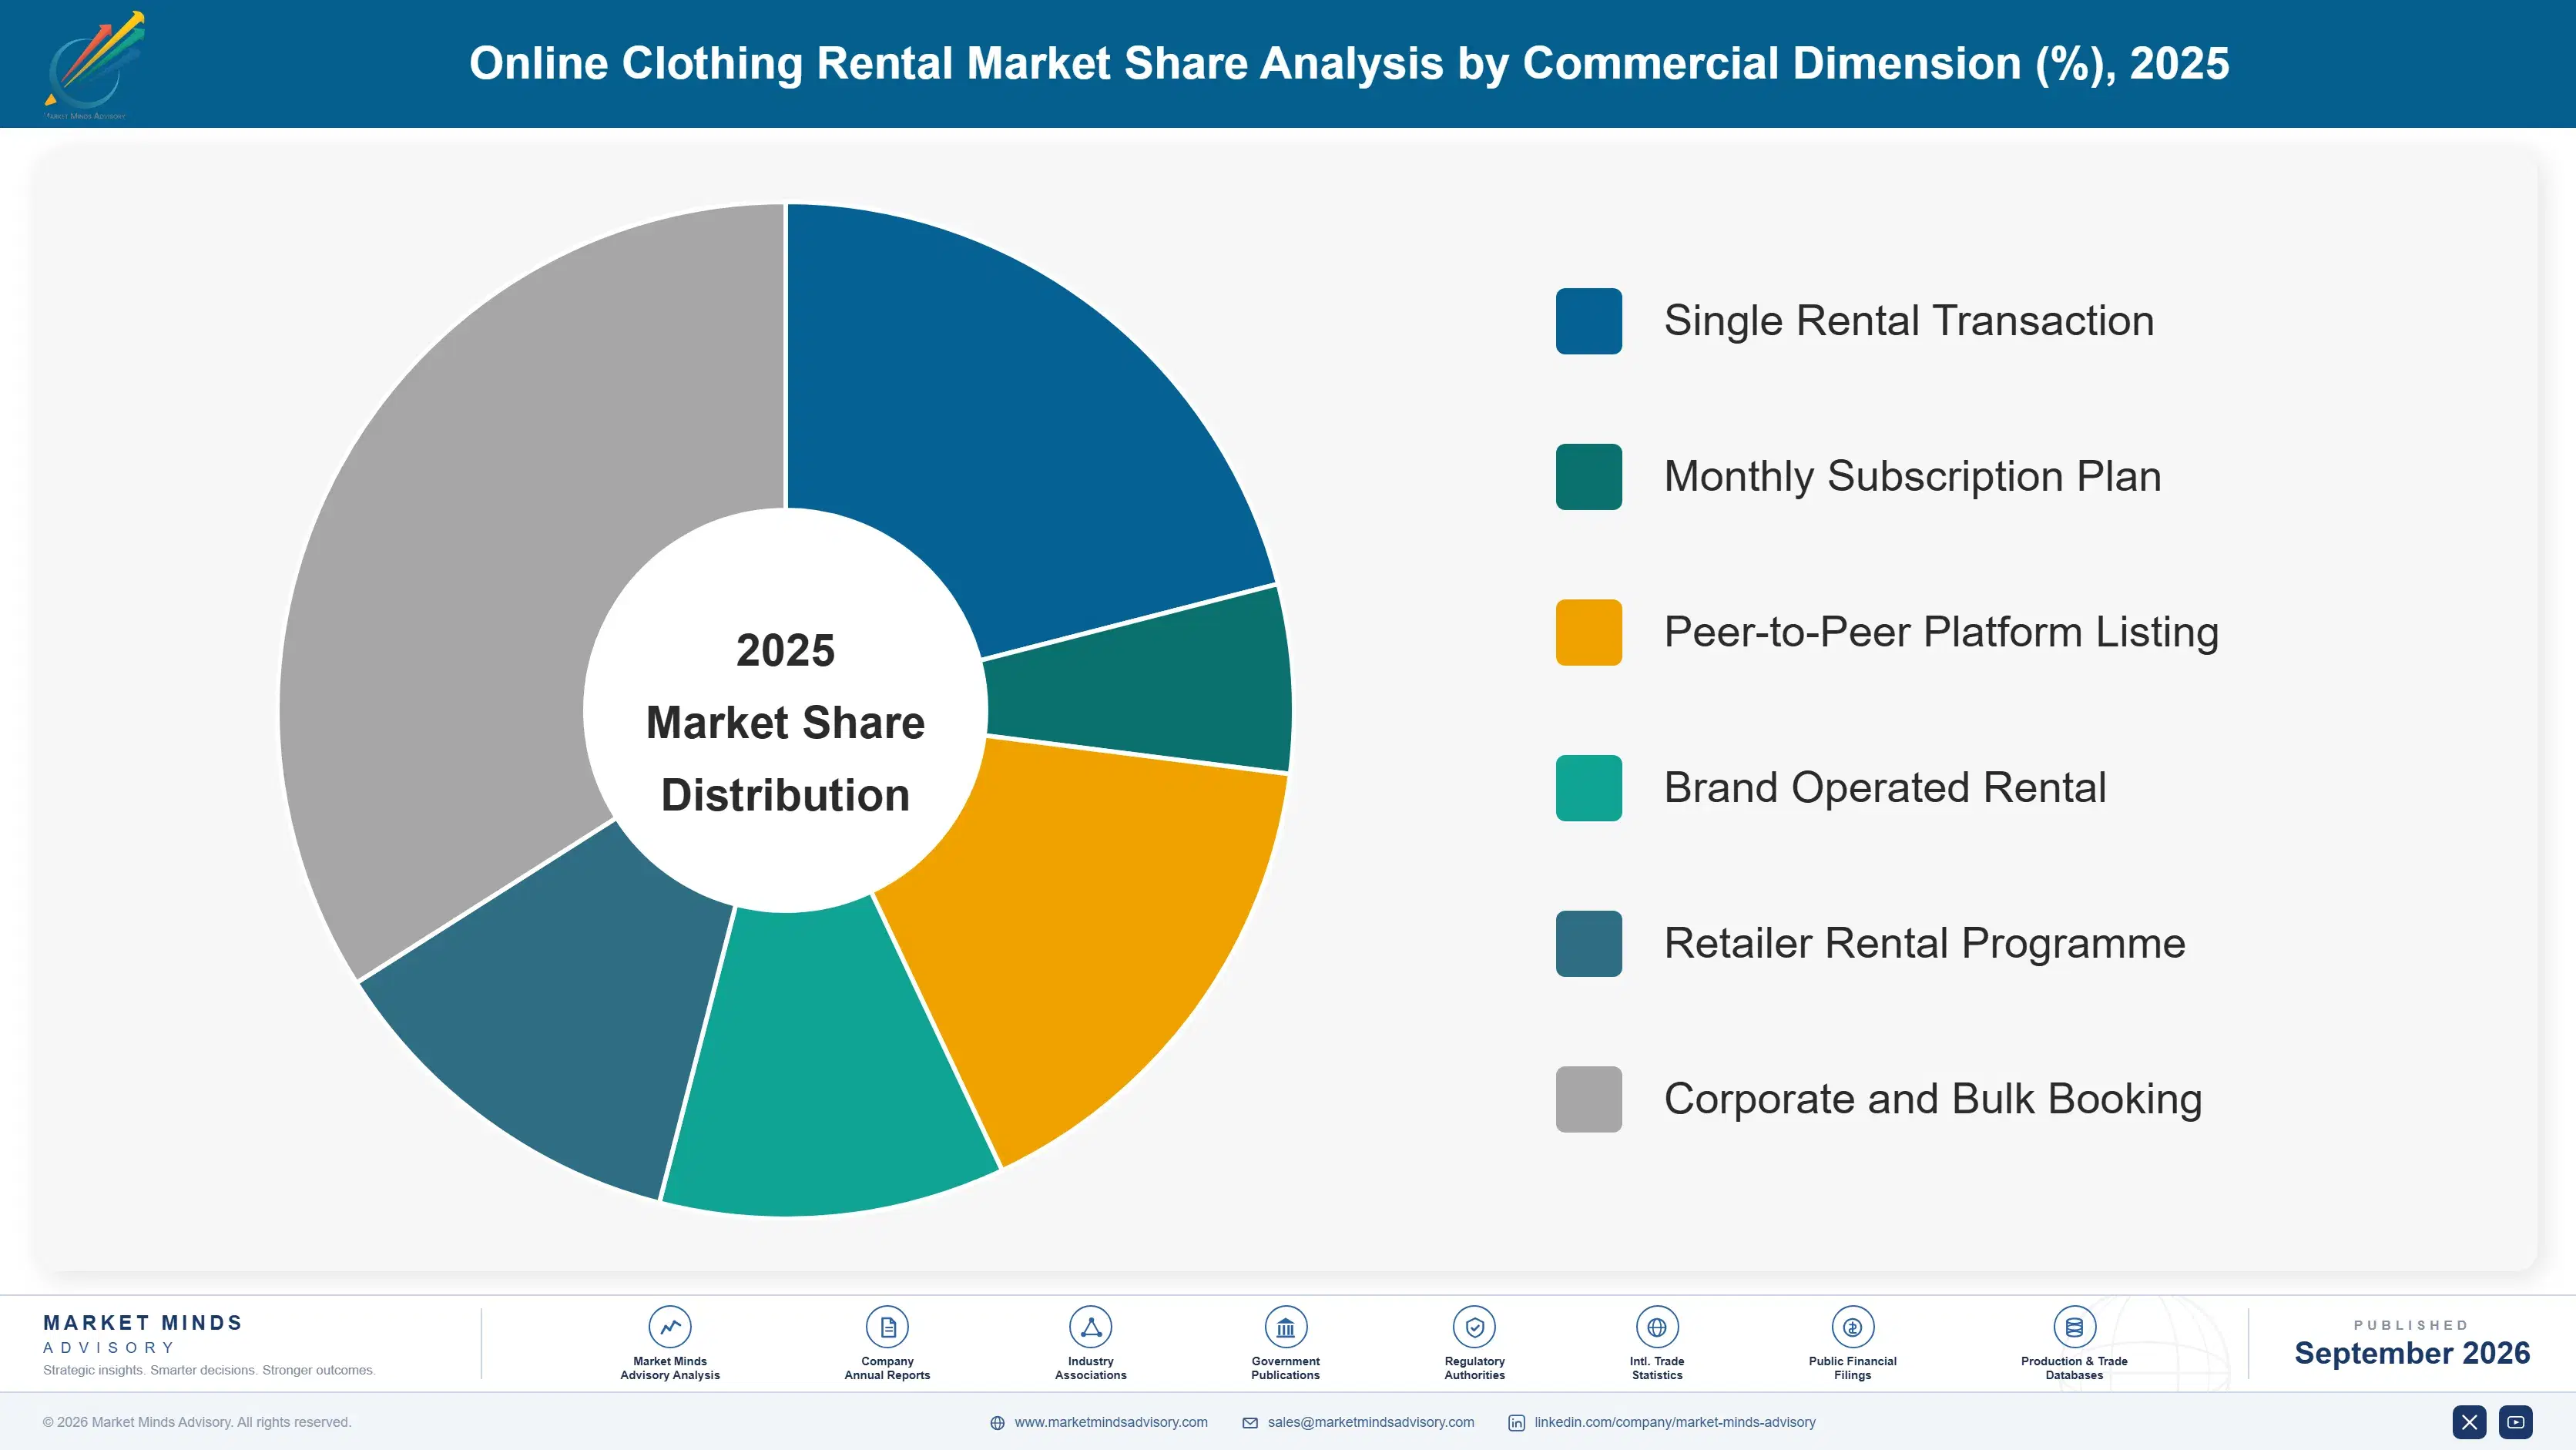
By Commercial Dimension

  • Single Rental Transaction
  • Monthly Subscription Plan
  • Peer-to-Peer Platform Listing
  • Brand Operated Rental
  • Retailer Rental Programme
  • Corporate and Bulk Booking

By Region

  • East Asia
  • North America
  • Western Europe
  • South Asia and Pacific
  • Latin America
  • Middle East and Africa
  • Eastern Europe

Scope, Methodology, and Coverage

Every figure in this report is reproducible from documented input assumptions. The scope below maps the historical period, the forecast horizon, the segmentation dimensions, and the countries covered, alongside the underlying primary and qualitative methodology.
Historical Period
2020 to 2025
Forecast Period
2026 to 2036
Base Year
2025 (USD billions; MMA Primary Research Dataset, September 2026)
Market Definition
This market covers garments and fashion accessories rented to consumers through online platforms, spanning occasion and event wear, designer handbags and accessories, everyday workwear subscription, maternity and transitional clothing, children's clothing rental, and outdoor and technical apparel. Sizing is at gross rental revenue across single transaction, subscription, peer-to-peer, brand operated, retailer programme and bulk booking channels. Peer-to-peer resale, permanent secondhand sale, physical-only costume hire, and business uniform leasing are excluded throughout.
Quantitative Units
USD billions at gross rental revenue; volume in millions of individual rentals; lifetime in rental cycles per garment.
Segmentation Dimensions
Garment category, end-use occasion, commercial dimension, and geographic region.
Regions Covered
East Asia, North America, Western Europe, South Asia and Pacific, Latin America, Middle East and Africa, Eastern Europe
Countries Covered
India, China, United States, United Kingdom, Brazil, United Arab Emirates
Key Companies Profiled
Rent the Runway, Flyrobe, HURR, By Rotation, Le Tote, Nuuly, Armoire, Vivrelle, Bag Borrow or Steal, Rotaro, My Wardrobe HQ, Cocoon Club, Stylelend, Rentez-Vous, Dress and Go, Style Theory, Rent It Bae, Designer 24, Girl Meets Dress, Front Row
Quantitative Methodology
Primary survey, n=3,800 respondents, Q4 2025, six countries; demand-side model with trade association cross-validation
Qualitative Methodology
47 expert interviews, Q4 2025; applied to validate demand model assumptions, identify emerging dynamics, and assess competitive positioning
Report Format
PDF and XLSX data workbook (Word format preview document)
Publisher
Market Minds Advisory
Report Code
MMA-2026-CON-797
Published
September 2026
Contact
sales@marketmindsadvisory.com | www.marketmindsadvisory.com

Purchase the full Online Clothing Rental Market Report (2026 to 2036).

The full report sizes the online clothing rental market across six garment categories, six end-use occasions and six commercial dimensions for all seven global regions through 2036. It rebuilds unit economics per rental by category, separating outbound shipping, return shipping, cleaning, inspection and depreciation rather than reporting fulfilment as a single line. Garment lifetime is measured by failure point across retired inventory rather than estimated from supplier claims. Liquidation and direct resale recovery are compared on matched inventory. Competitive assessment covers 20 participants on a consistent gross rental revenue basis.
Unit economics rebuilt per rental by garment category
Garment lifetime measured by actual failure point
Liquidation and direct resale recovery compared directly
Round trip cost decomposed across every fulfilment step
Six garment categories sized through 2036
Twenty participants assessed on gross rental revenue

Built For The People Who Decide

From boardroom strategy to bench-side execution, this report is read cover-to-cover by leaders shaping the next decade of their industry, turning demand scenarios, market dynamics and valuation benchmarks into decisions.
CXOs/ Presidents/ VPs/ Managers
M&A and Corporate Development
Strategy Teams and R&D Heads
Procurement and Product Directors
Regulatory and Compliance Leaders
Investor Relations and Equity Analysts