Market Minds Advisory
On-Demand Warehousing Platforms Market

On-Demand Warehousing Platforms Market: On-Demand Warehousing Platforms: Vacancy Cycles, Quality Control and the Marketplaces That Became Networks

The model needs operators with spare space and shippers unwilling to sign a lease, and those two conditions sit at opposite ends of the same property cycle rather than arriving together.

Lead Analyst

Published

September 2026

Make Smarter Decisions with Customized Research Insights

Request a free sample report and evaluate market opportunities, growth trends, and competitive dynamics relevant to your business needs.

2025 MARKET VALUE$3.2BMarket Size 2025
2036 FORECAST VALUE$11.8BBase Case , 2026 to 2036
CAGR 2026 TO 203612.6 %Bull 13.8% / Bear 11.4%
INCREMENTAL OPPORTUNITY$8.2BNet 10- year value creation
EXPANSION MULTIPLE3.28x2036 value over 2026 base
Strategic Levers
M&A Pipeline
Regional Outlook
Country Rankings
Competitive Intelligence
Segmental Deep-dive
Call-Us : 91 93563 13602

Executive Snapshot and Market Trajectory.

This model requires warehouse operators willing to sell spare capacity and shippers unwilling to commit to a lease. Those conditions sit at opposite ends of the same property cycle, which is why the sector's history reads as a series of good years followed by difficult ones.
The platforms responded by ceasing to be platforms. Managed fulfilment network capacity, where the operator sets standards and systems rather than merely matching parties, grows at 18.9%, half again the market rate of 12.6%. Shipper churn near 31% forced that change. North America takes 38% of value on a uniquely fragmented operator base and delivery expectations that require distributed inventory. Nothing about that arrived with the software.
Concentration sits at roughly 46% across the top five on measured platform revenue, and the leaders now look considerably more like third party logistics providers than marketplaces. Labour rather than space is 58% of fulfilment cost, which means any platform supplying only square footage has solved the easier half of the problem. Asset-light was a funding story rather than an operating model. Every survivor has quietly accepted that, whatever the positioning still says.
Market Definition
This market covers platforms matching shippers with warehouse and fulfilment capacity on flexible terms without a conventional lease, spanning short-term overflow storage, managed fulfilment network capacity, peak season surge capacity, cross-border and port-adjacent staging, returns processing and reverse logistics, and cold and specialty handling capacity. Revenue is measured as gross platform revenue including space and fulfilment services billed to shippers. Conventional multi-year warehouse leasing, owned third party logistics contracts outside a platform, freight brokerage, parcel carriage and warehouse management software sold standalone are excluded.
Base Year Value
$3.2B in 2025 (MMA Primary Research Dataset, September 2026)
Forecast Period
2026 to 2036, eleven discrete annual values
CAGR
12.6% base case. Bull 13.8%. Bear 11.4%.
Fastest Growth Segment
Managed Fulfilment Network Capacity: 18.9% CAGR
Fastest Growth Country
India: 17.8% CAGR
Fastest Growth Region
South Asia and Pacific: 14.8% CAGR
Largest Region
North America: 38% of 2025 global value
Market Leaders
Flexe, Stord, Ware2Go, Flowspace and ShipBob lead on measured on-demand warehousing platform revenue. Source: MMA Primary Research Dataset, July 2026.
Primary Survey
n=3,800 procurement and R&D decision-makers, Q4 2025, six countries
Methodology
Demand-side build-up, cross-validated against public data, 47 expert interviews

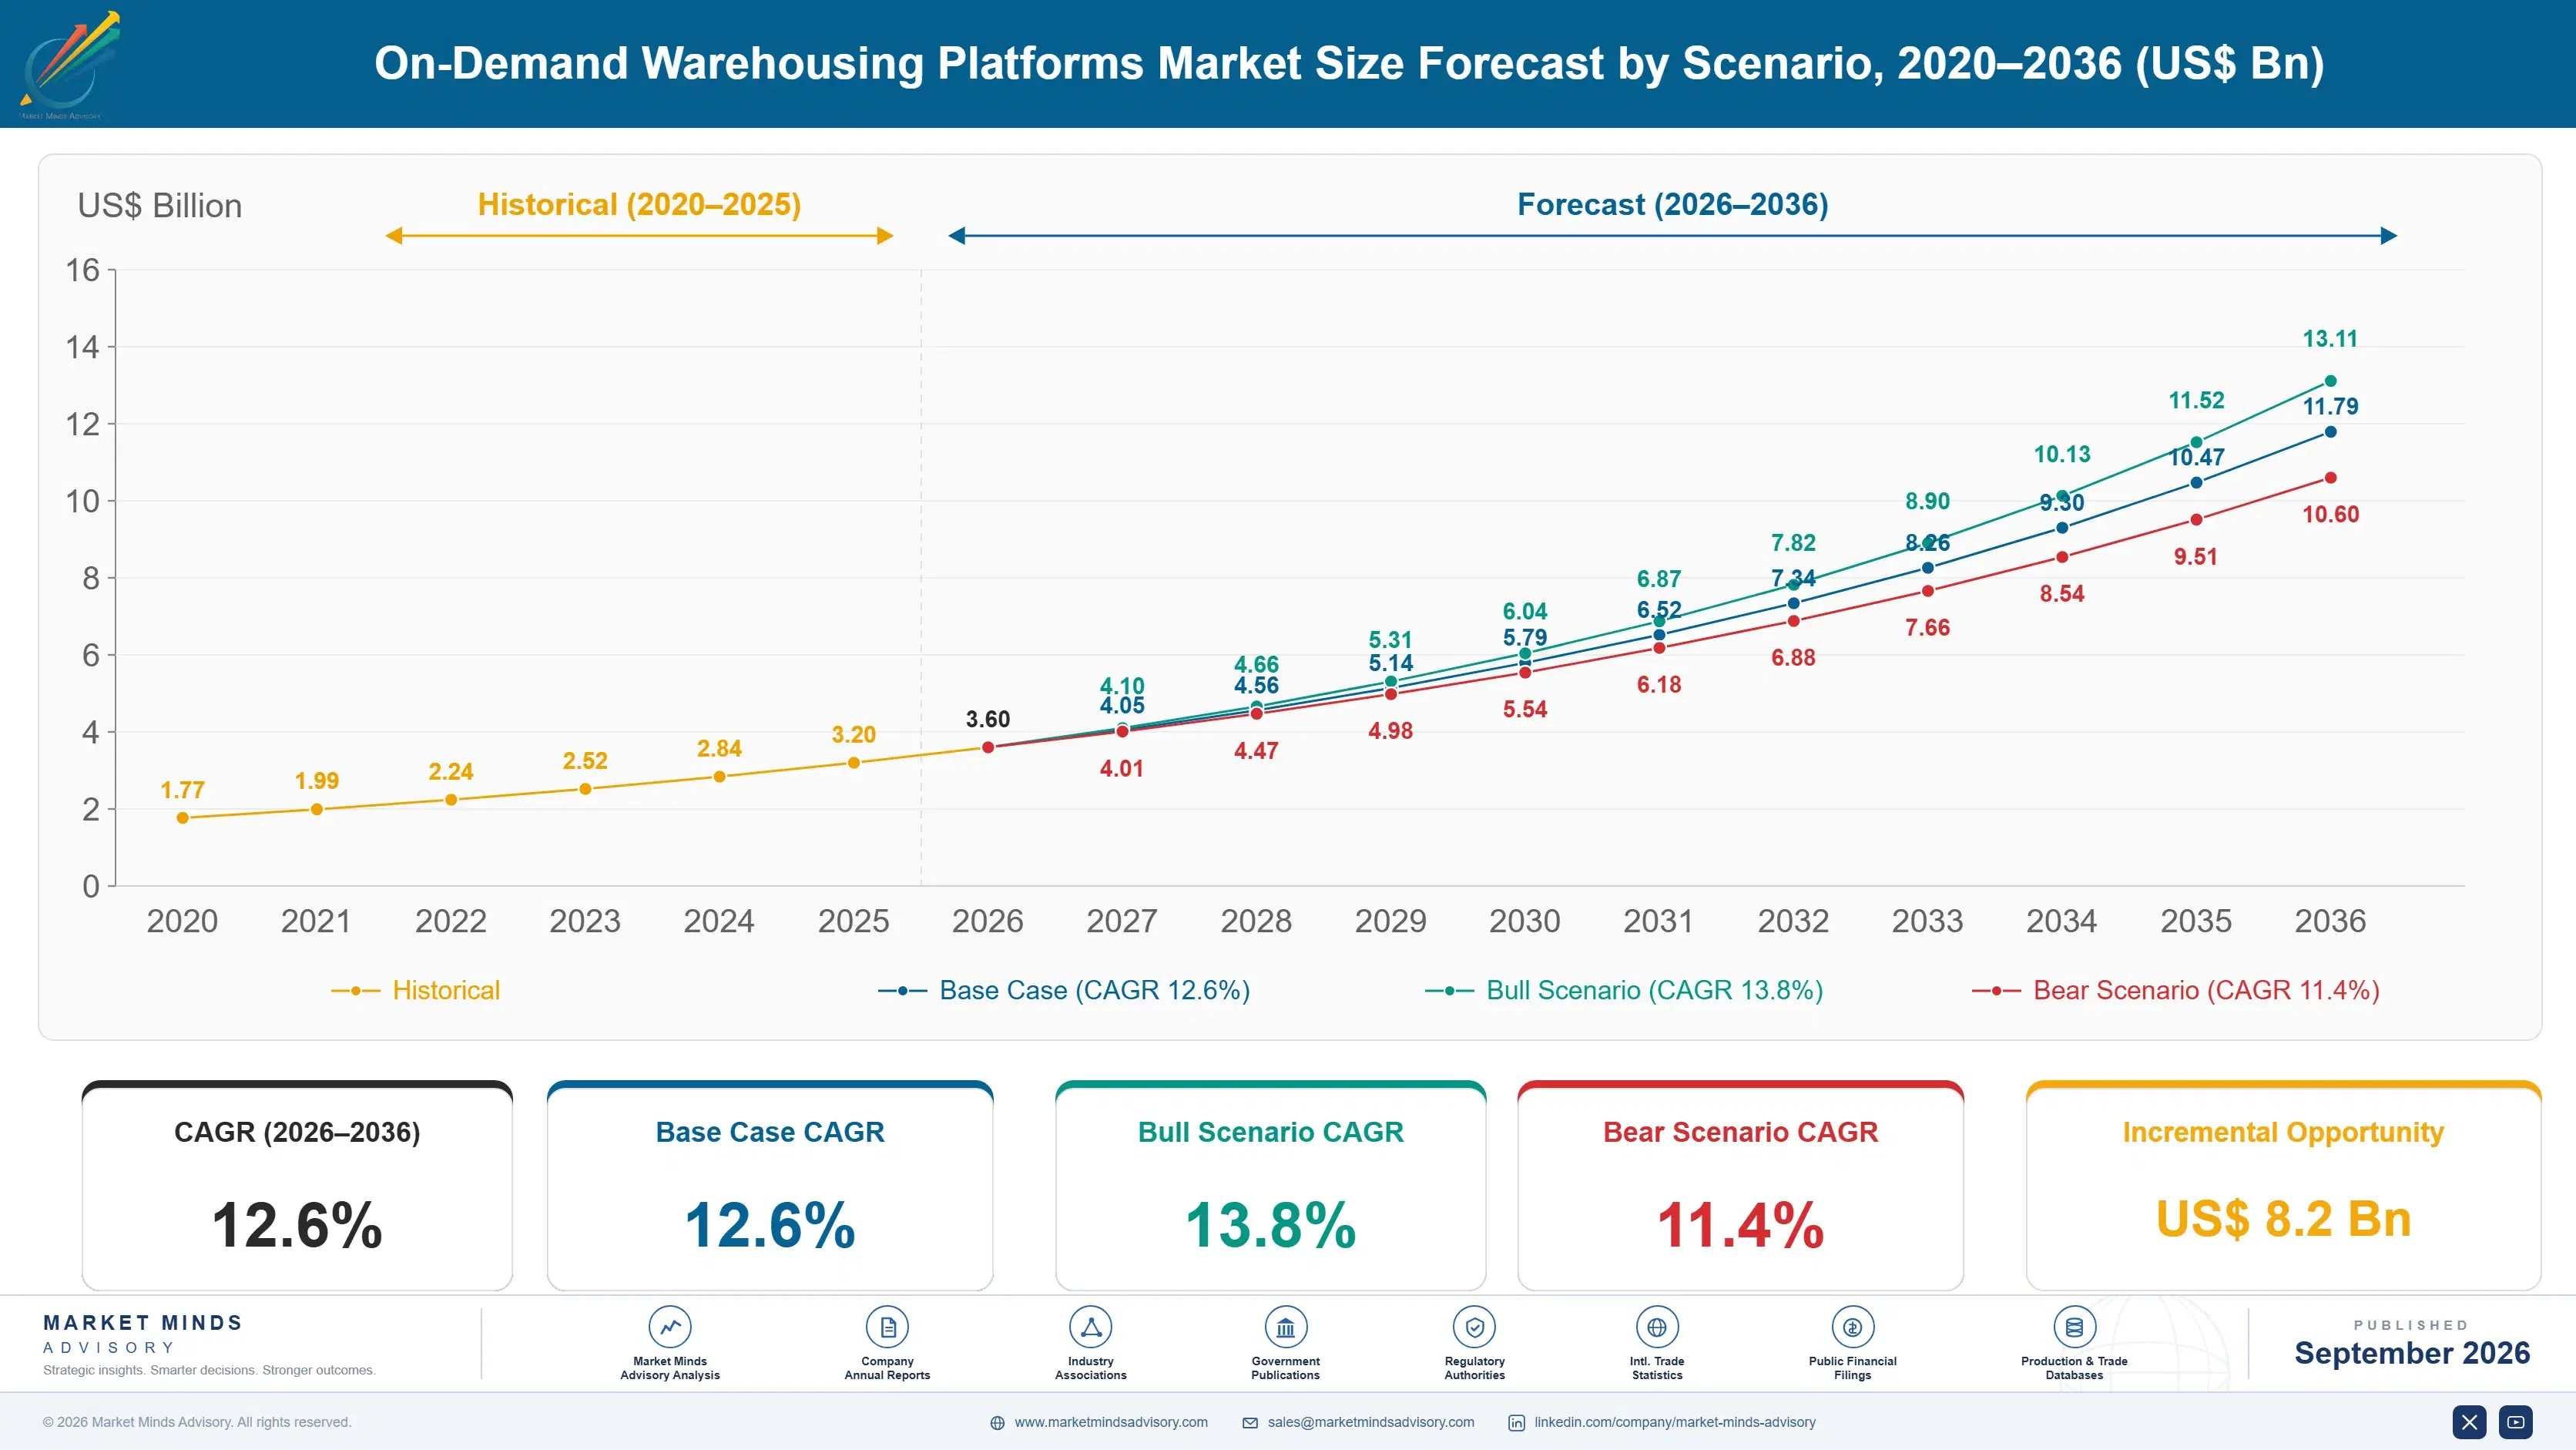
On-Demand Warehousing Platforms Market Forecast Scenarios

on-demand-warehousing-platforms-market-size-forecast-scenario-1788423750801
Growth ran at 11.6% from 2020 to 2025 through a cycle that tested the model severely in both directions. Pandemic demand filled every warehouse in 2021 and 2022, leaving operators with no spare capacity to sell just as shippers most needed it. Vacancy then rose through 2023 and 2024, restoring supply while making conventional leases cheap enough that some shippers no longer needed a flexible alternative.
The base case at 12.6% rests on three mechanisms rather than on property conditions. Distributed inventory for fast delivery requires around six nodes to cover a large market, which most shippers cannot justify building or leasing themselves. Returns volumes have grown faster than shipments and need handling capacity that conventional networks were never designed around. Third, port-adjacent staging demand has risen as tariff and routing uncertainty made inventory near entry points more valuable.
The bull case at 13.8% assumes vacancy stays elevated enough that operators keep selling capacity while shippers keep avoiding long commitments, which is a narrow band the market has rarely occupied for long. The bear case at 11.4% is a tightening property market removing available capacity, which happened in 2021 and left several platforms with demand they could not fill.

A Marketplace That Had to Stop Being One

The original proposition was elegant and cyclically fragile: warehouses hold spare space, shippers need space without a lease, and a platform matches them. The difficulty is that operators sell spare capacity only when vacancy is high, while shippers pay a premium for flexibility only when space is scarce, and those states rarely coexist. Vacancy near 7.4% suits the model today and has been far outside that band twice in five years.
TOP FIVE CONCENTRATION46%Moderately concentrated among platforms that became managed networks
WAREHOUSE VACANCY RATE7.4%Available industrial space determining whether operators sell capacity
SHIPPER CHURN RATE31%Customers leaving within a year of their first placement
LABOUR SHARE OF COST58%Fulfilment cost attributable to people rather than to space
NETWORK NODE REQUIREMENT6 nodesSites needed for two-day coverage across a large market
GROSS MARGIN RETAINED19%Platform share after paying the operating warehouse partner
Quality proved the harder problem. Independent operators run different systems, picking standards and service levels, and a shipper with inventory across several experiences inconsistency they blame on the platform. Churn near 31% within the first year followed. The response was operating standards, common systems and in some cases taking space directly, which is contract logistics rather than a marketplace.
What has held up commercially is not overflow storage but network coverage. A shipper wanting two-day delivery across a large market needs roughly six well-placed nodes, which few can justify leasing and staffing alone. Buying that coverage as a service is a recurring requirement rather than a temporary response. Labour, at 58% of fulfilment cost, is the part that actually determines whether it works.
"Every business in this category started as a marketplace and the successful ones quietly stopped being one, because a shipper does not care whose warehouse it is and cares enormously whether the order shipped correctly. Asset-light was a positioning choice, not a durable operating model."
Director, Logistics Technology and Fulfilment Networks Practice · MMA Technology Practice · September 2026

Market Trends

Marketplaces Convert Into Managed Operating Networks

Matching a shipper to an independent warehouse leaves service quality with a party the platform does not control, and inconsistency across sites produced churn near 31% within the first year. The response has been to impose operating standards, deploy a common warehouse system, train partner staff and in several cases take space and hire directly. Managed network capacity grows at 18.9% as a result, faster than anything else here. It also changes what the business is, since operating standards require supervision, capital and liability that a matching platform never carried.
Market Impact: Requires about 6 network nodes
Labour Scarcity Displaces Space as the Binding Constraint

Fulfilment cost is roughly 58% labour and the remainder is space, equipment and systems, which means a platform offering square footage without people has addressed the smaller half of the problem. Warehouse labour availability varies enormously by submarket and tightens exactly when peak volumes arrive. Platforms that recruit, train and supply labour alongside space command materially better pricing and hold customers through peaks. Those brokering space alone find their partners unable to staff the volume they accepted, which produces failures the shipper attributes to the platform. Unstaffed space during a peak is worse than none.
Market Impact: Segment grows at 15.4% annually

Market Opportunities and Growth Drivers

Fast Delivery Coverage Requires Distributed Inventory Nodes

Meeting two-day delivery expectations across a large market requires inventory positioned at roughly six nodes, and building or leasing that network is beyond what most shippers below the largest scale can justify. Buying coverage as a service converts a capital and staffing commitment into a variable cost tied to actual volume. That is a recurring requirement rather than a response to a temporary shortage, which makes it the most durable demand mechanism in this market. It also favours platforms with existing node coverage over those assembling capacity per customer. Existing coverage beats assembled capacity every time.
Market Impact: Vacancy swung twice in 5 years

Returns Volumes Outgrow the Networks Built to Handle Them

Return rates on online apparel and consumer goods have risen faster than outbound shipment volumes, and returns processing needs inspection, grading, refurbishment and restocking capability that outbound-optimised warehouses handle badly. Retailers have discovered that processing returns through their primary network degrades outbound performance during exactly the periods when both peak together. Dedicated reverse logistics capacity bought on flexible terms addresses that without permanent commitment, and the segment grows at 15.4%. Handling cost per unit exceeds outbound cost, which surprises most shippers the first time they measure it. Both volumes peak in exactly the same weeks each year.
Market Impact: Churn reaches 31% annually

Market Restraints and Challenges

Supply and Demand Peak at Opposite Points of the Cycle

Operators sell spare capacity when vacancy is high, and shippers pay most for flexibility when space is scarce, which means the model's two requirements are anti-correlated across the property cycle. The root cause is that both parties respond to the same underlying condition in opposite directions. Commercially this produced the shortage of 2021 and the pricing pressure of 2024 within three years of each other. Platforms mitigate by contracting capacity ahead of demand, holding leases directly and building customer relationships that survive a cycle turn. Comfortable conditions are precisely when capacity must be secured.
Market Impact: Fastest segment at 18.9% growth

Quality Inconsistency Drives Churn the Platform Absorbs

A shipper with inventory across several independent warehouses experiences different systems, standards and service levels, and attributes every failure to the platform rather than to the site. Churn near 31% in the first year follows directly. The root cause is that a matching model gives away control of the thing customers actually judge. Mitigation requires operating standards, common systems, trained staff and supervision, all of which convert an asset-light marketplace into an operating business with the cost structure and liabilities that implies. Supervision cost erodes the asset-light economics the model was originally built on.
Market Impact: Labour is 58% of fulfilment cost
3 additional market trends, 4 additional growth drivers, and 2 additional restraints and challenges are covered in the full report. Contact sales@marketmindsadvisory.com to access the complete intelligence.

Segment CAGR and Growth Architecture

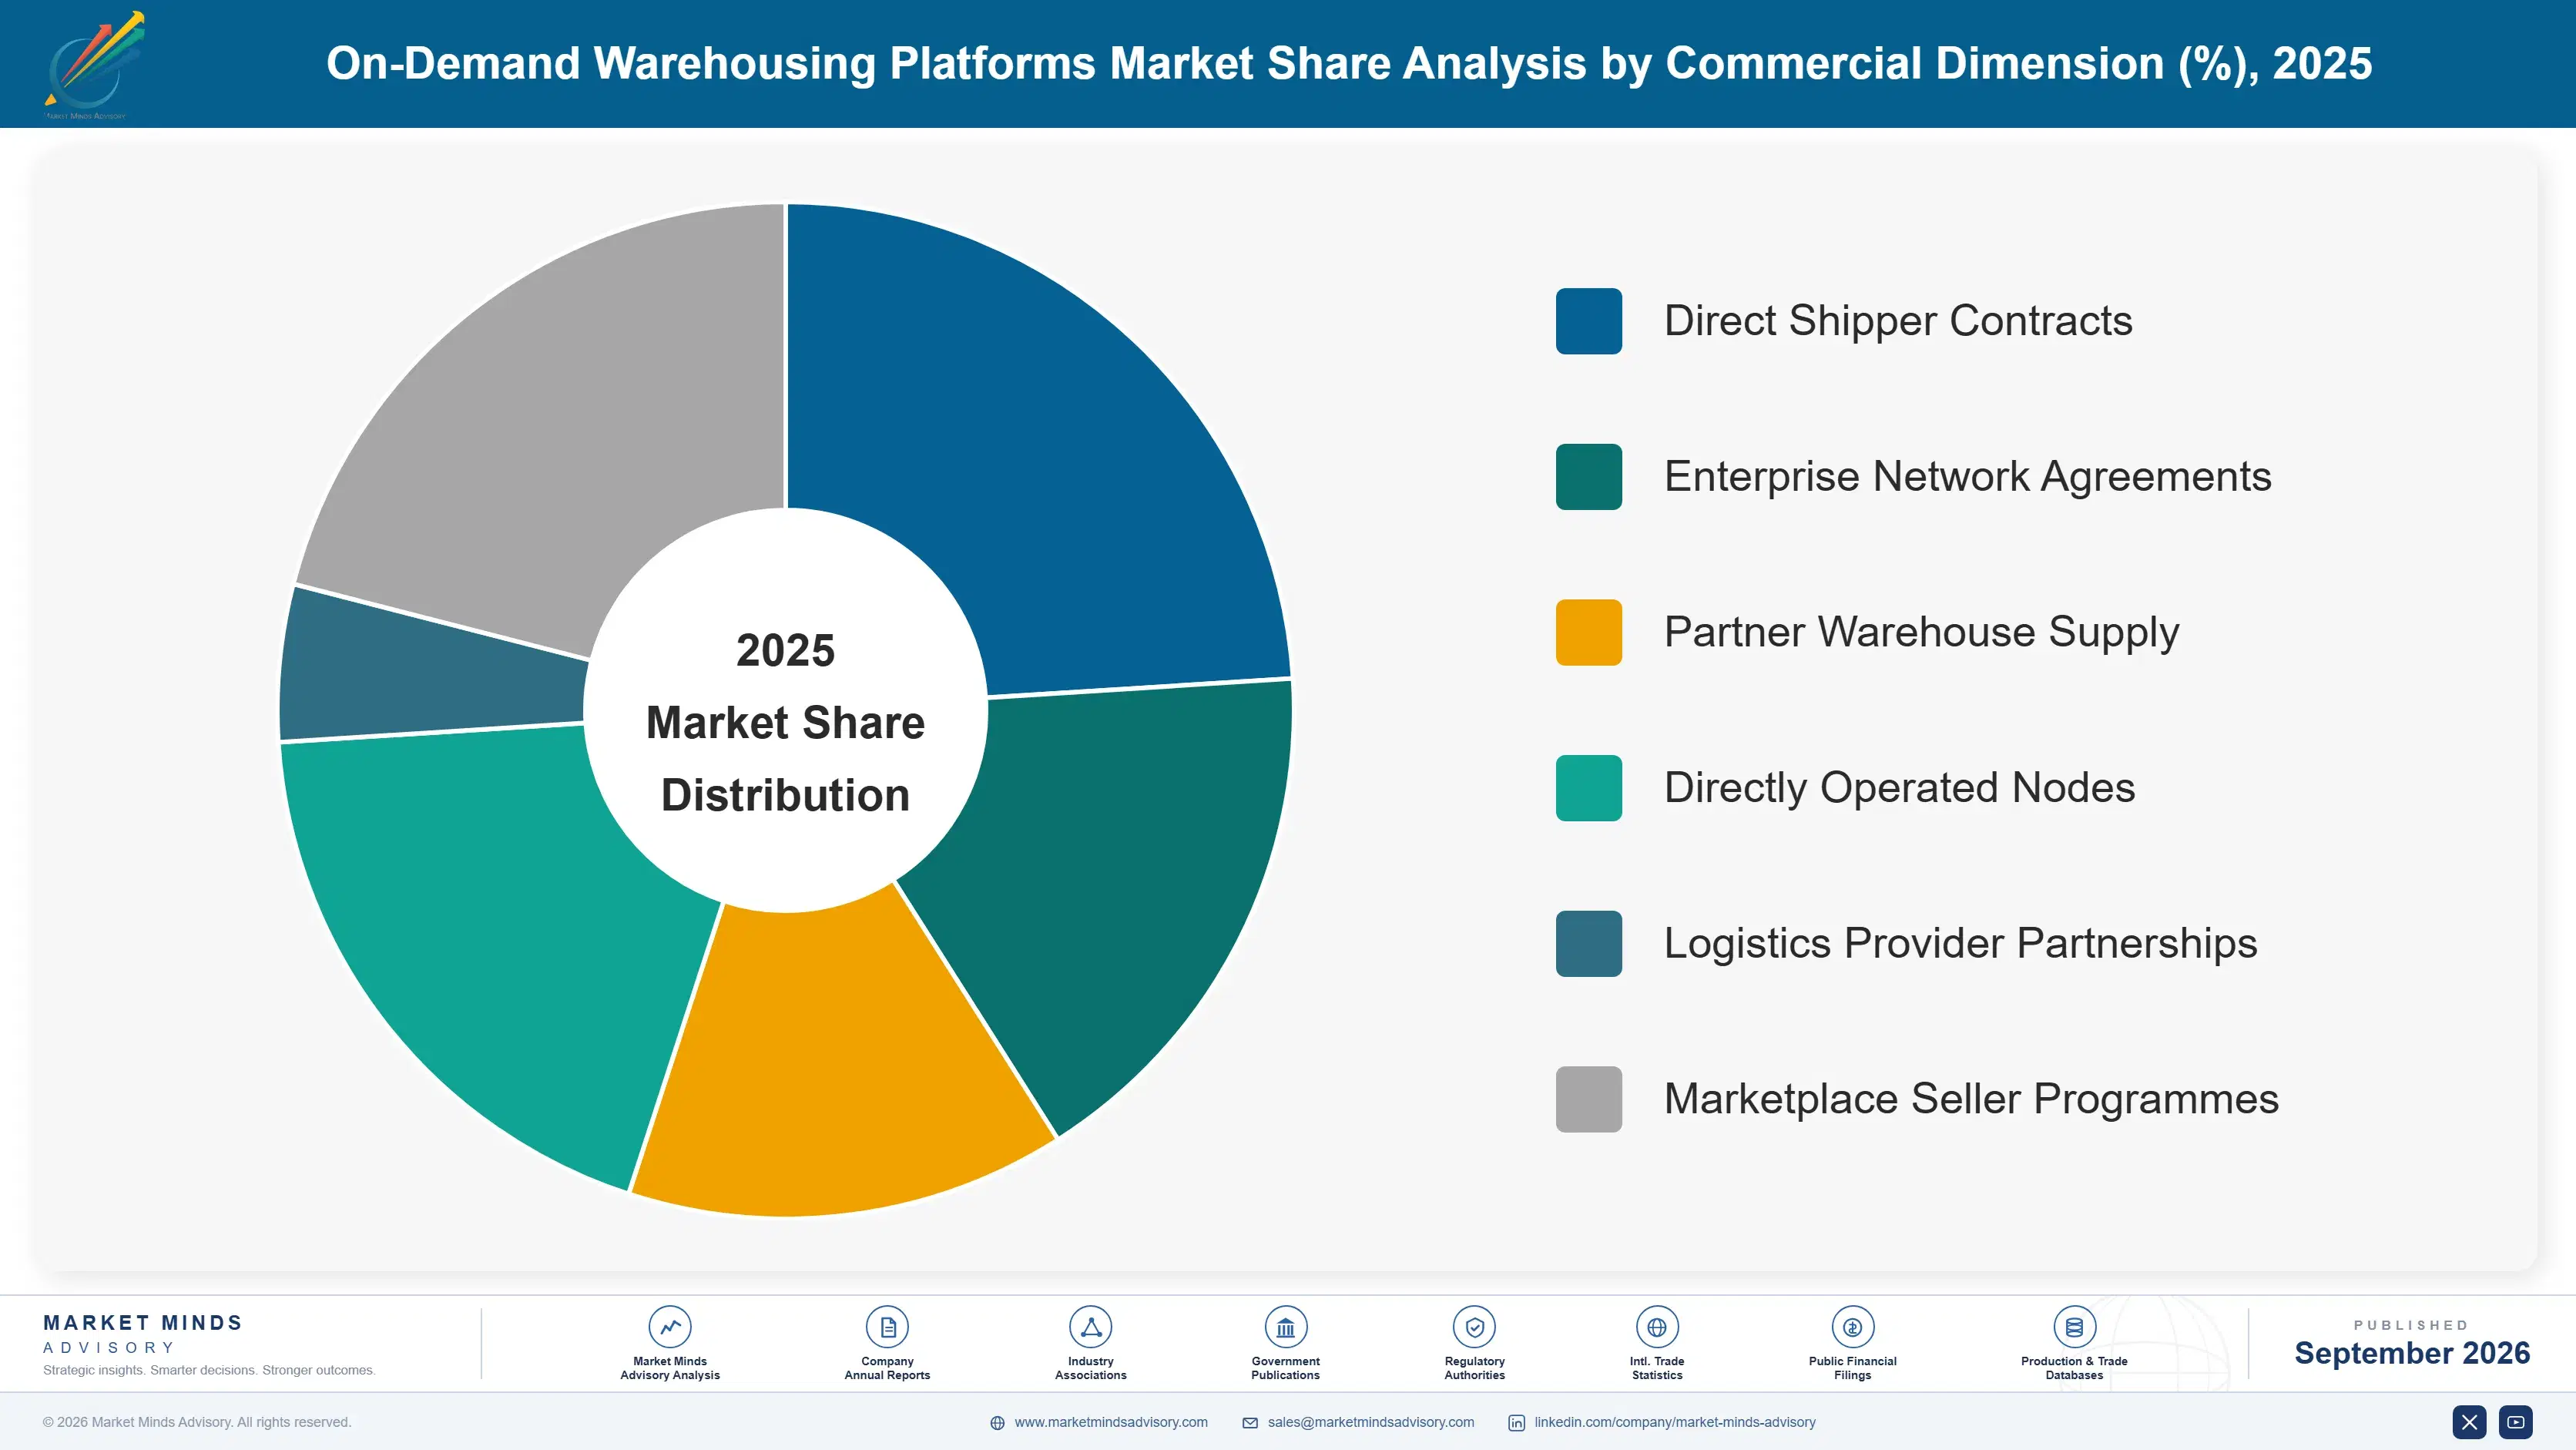
Segmentation follows what the shipper is actually buying, because storage, coverage, surge and specialist handling behave as different businesses with different renewal patterns. Capacity bought to solve a temporary problem does not recur, while capacity bought as permanent network coverage does, and that difference governs almost everything commercially. Renewal patterns differ completely between them.
on-demand-warehousing-platforms-market-market-share-analysis-1788423751398

Managed Fulfilment Network Capacity

Managed network capacity is the fastest part of this market at 18.9%, half again the market rate of 12.6%, and it exists because pure matching could not hold customers. The platform sets operating standards, deploys a common warehouse system, trains staff and takes responsibility for service quality across every node a shipper uses. That converts a temporary space arrangement into permanent network coverage the shipper would otherwise have to build, and it renews accordingly. It also requires supervision, working capital and liability that a marketplace never carried, which is why several platforms now resemble third party logistics providers with better technology rather than technology companies with warehouse partners. Capital and liability follow the operating responsibility.
CAGR 18.9%

Cross-Border and Port-Adjacent Staging

Staging inventory near ports and border crossings grows at 16.6% because tariff changes, routing disruption and customs unpredictability have made the option to redirect worth paying for. Holding goods close to an entry point preserves choices that inventory sitting deep in a distribution network has already given up. Port-adjacent property is expensive and rarely available on short leases, which makes flexible capacity genuinely difficult to replicate independently. Demand responds to policy announcements rather than to consumer activity, so it arrives in bursts that are hard to forecast and reliable in direction, and platforms holding contracted space near major gateways capture it first. Forecasting that demand is close to impossible. Contracted gateway space wins it.
CAGR 16.6%
Full segment breakdown across 6 segments available in the complete report.

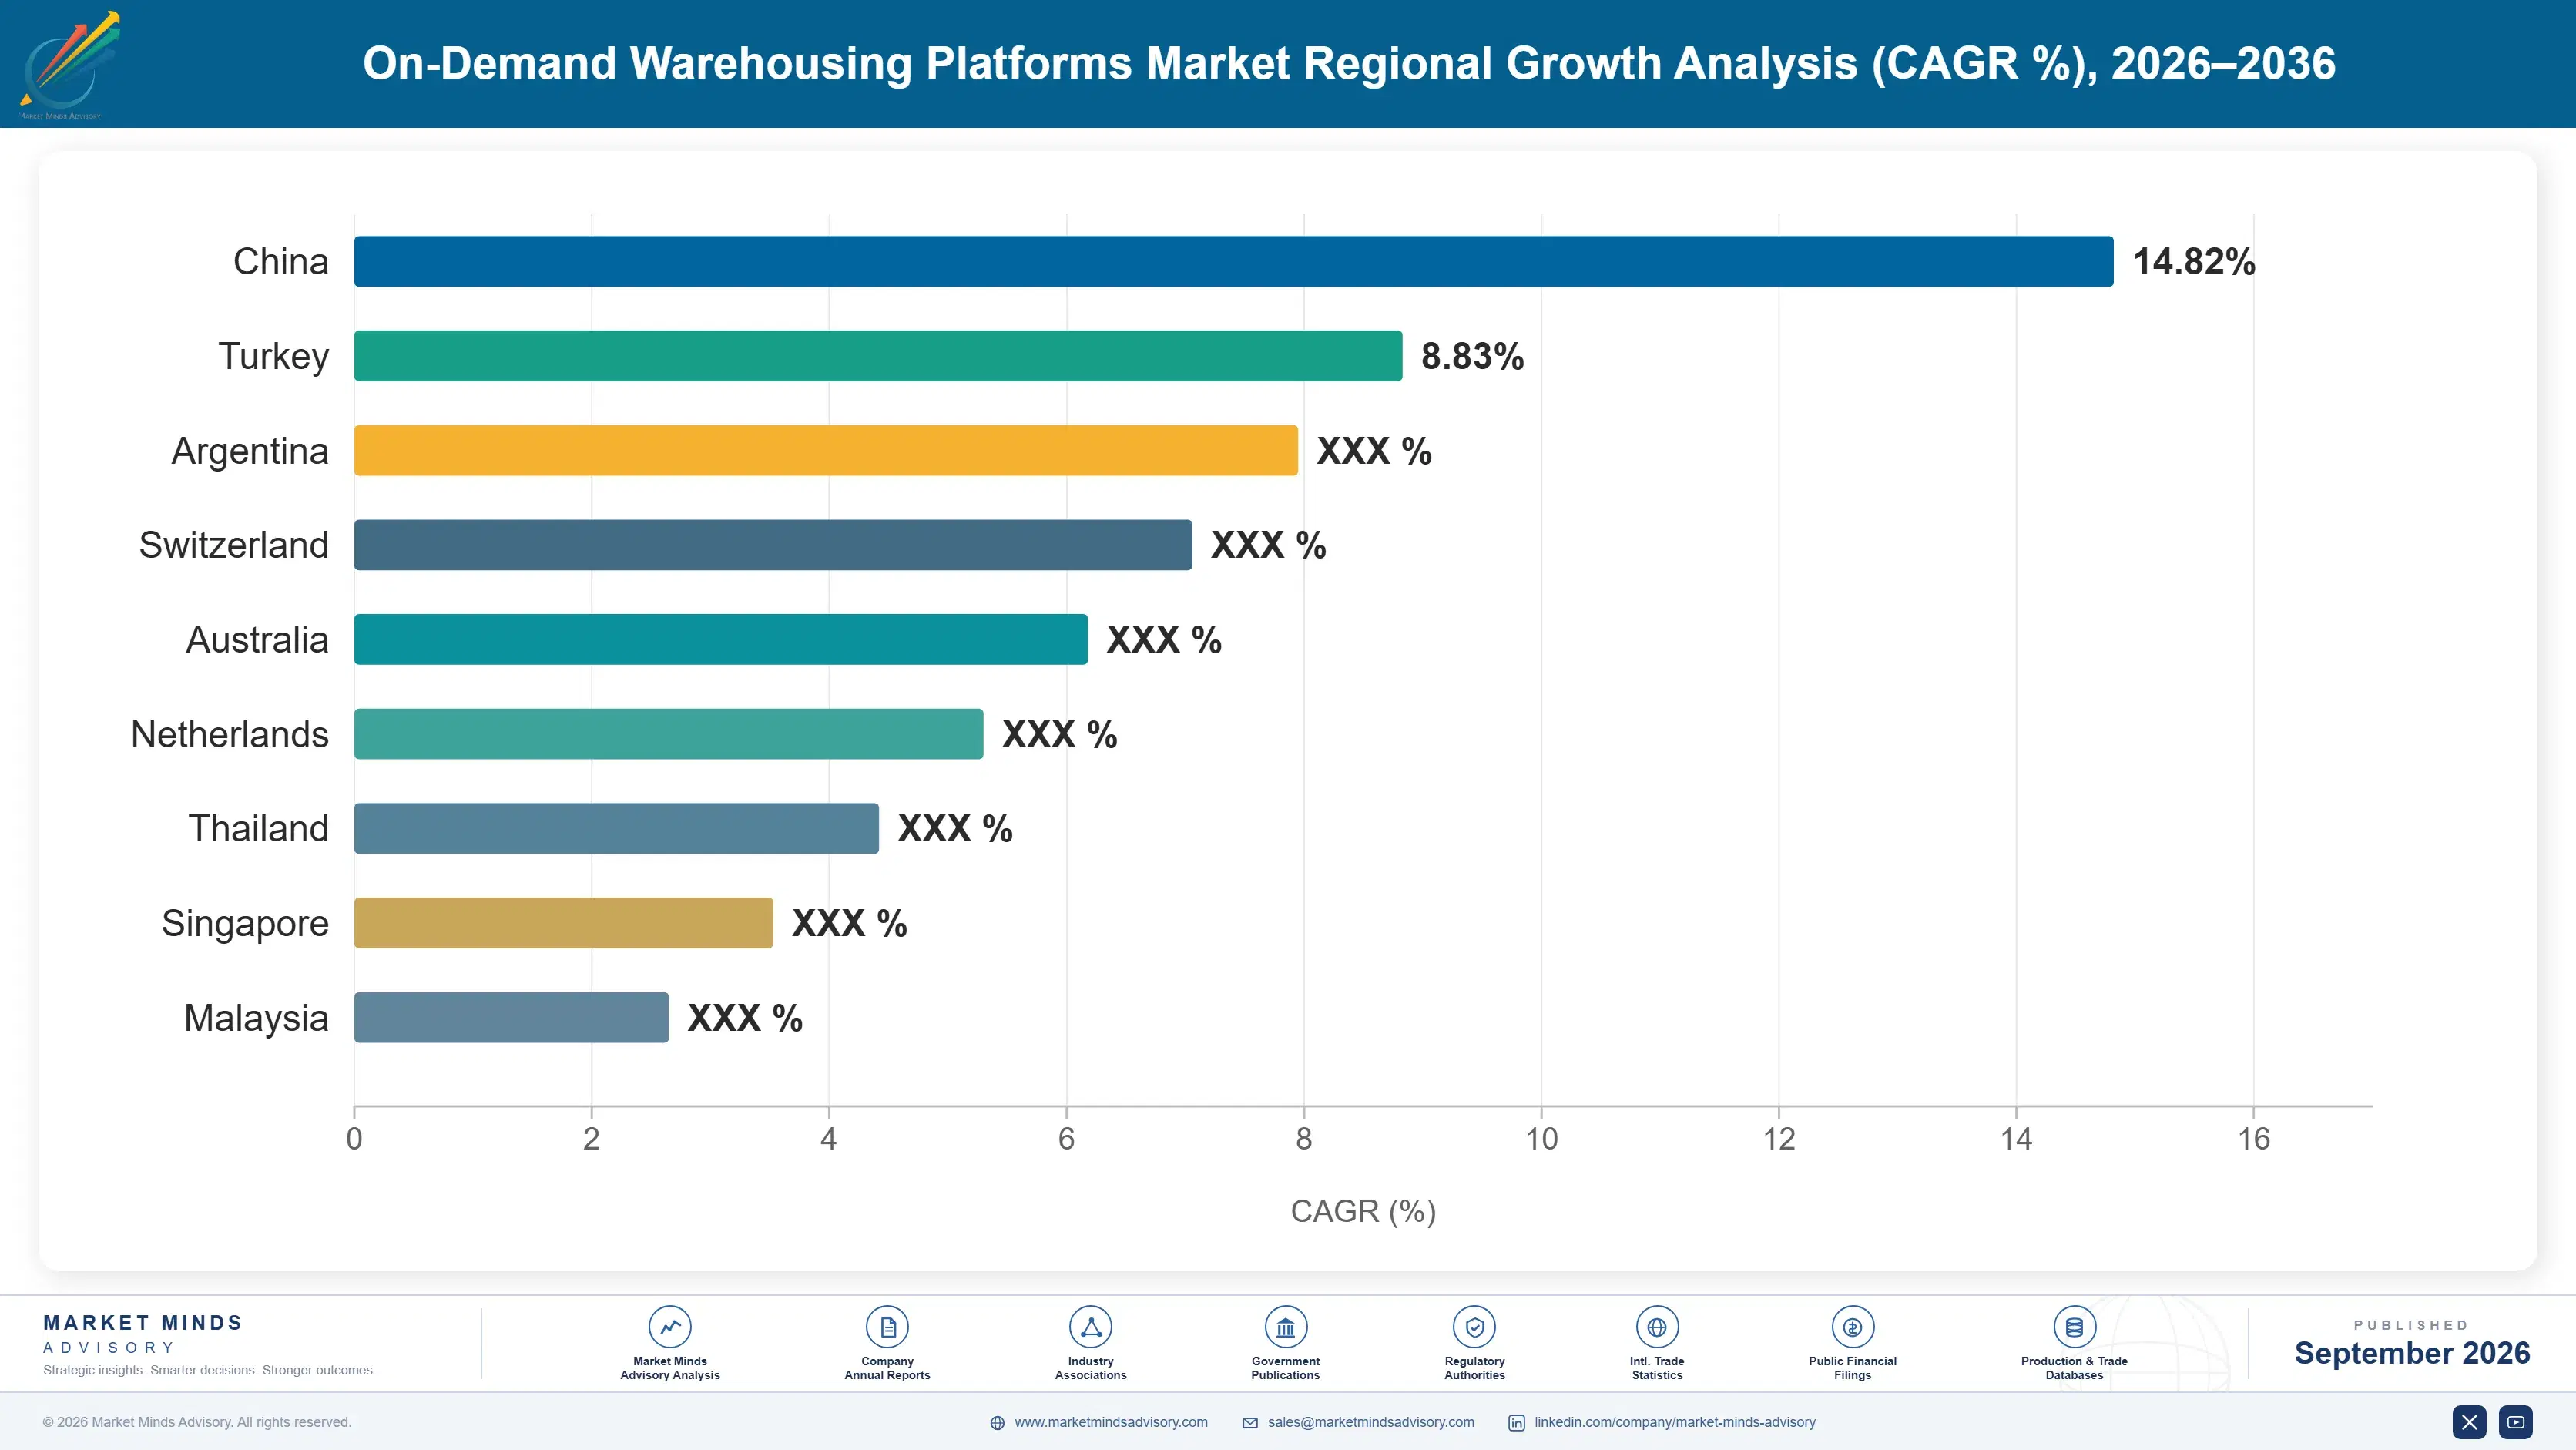
Regional Architecture and Country Demand Map

Demand follows warehouse market fragmentation and delivery speed expectations rather than trade volume. Markets with many independent operators and shippers under pressure to deliver quickly support this model; markets dominated by large integrated logistics providers largely do not. Operator fragmentation is what supplies it. Integrated markets support little.

North America

North America holds 38%, above the regional band, on a warehouse operator base more fragmented than anywhere else: tens of thousands of independent operators hold space that no integrated provider controls, which is exactly the supply a matching model requires. Delivery expectations set by the largest retailers force distributed inventory on shippers who cannot build national networks themselves. Vacancy has swung sharply across the past five years, testing the model in both directions. Every platform of consequence in this category was founded here, and the managed network transition happened here first as churn forced it. Regional growth at 11.8% is modest because the base is large and the model has already been tested through a full property cycle here.
Share: 38% | CAGR: 11.8% (2026 to 2036)

Western Europe

European demand is constrained by a warehouse market where large logistics providers control a greater share of quality space, leaving less independent capacity available for a platform to broker. British and Dutch markets are the most active, with port-adjacent staging around Rotterdam and the Channel crossings unusually valuable given customs arrangements. German shippers work predominantly with established contract logistics providers on conventional terms. Cross-border complexity within the region creates genuine demand for flexible staging, though it also raises the operational bar considerably for any platform attempting to serve it. Regional growth at 11.0% is the slowest anywhere, constrained by how little independent capacity is genuinely available rather than by any lack of shipper interest.
Share: 22% | CAGR: 11.0% (2026 to 2036)
Regional intelligence for 5 additional markets available in the complete report: East Asia, South Asia and Pacific, Latin America, Middle East and Africa, Eastern Europe. Contact sales@marketmindsadvisory.com.
on-demand-warehousing-platforms-market-country-cagr-analysis-1788423751922

Where This Model Actually Holds Together

Matching space to shippers is cyclically fragile and gives away control of service quality, which is what customers judge. The durable positions come from operating the network rather than brokering it, from supplying labour alongside space, and from holding capacity contracted before demand arrives. Every survivor reached the same conclusion independently. That conclusion took a full cycle.

Operate the Network Instead of Brokering It

Pure matching leaves service quality with parties the platform does not control, and inconsistency across sites drives churn near 31% within the first year. Platforms imposing operating standards, common systems and trained supervision hold customers roughly 3 times longer and command better pricing, because the shipper is buying a service outcome rather than a space arrangement. It converts an asset-light business into an operating one with supervision cost and liability attached. That trade is uncomfortable and every platform that survived has made it anyway. Supervision and liability come with the territory.
Market Impact: Holds those customers roughly 3 times longer overall

Supply Labour Alongside the Square Footage

Fulfilment cost is roughly 58% labour, so a platform providing space without people has solved the smaller half of the problem and left the harder half with a partner who may not manage it. Platforms recruiting, training and supplying warehouse labour capture around 40% more revenue per placement and hold customers through peak periods when partner staffing typically fails. It requires becoming an employer in many submarkets, with the workforce management that implies. Shippers pay for it because unstaffed space during peak is worse than no space at all. Becoming an employer is the real barrier here.
Market Impact: Captures 40% more revenue on every single placement

Contract Capacity Before the Cycle Turns

Operators sell spare space when vacancy is high and withdraw it when the market tightens, which left platforms unable to serve demand in 2021 and repeated the pattern in earlier cycles. Contracting capacity on multi-year terms during high vacancy costs commitment and secures supply through the turn, when competitors have nothing to offer. Platforms holding contracted capacity through the last tightening retained customers who would otherwise have signed conventional leases. It looks like unnecessary risk during comfortable periods, which is precisely when it must be done. Commitment during comfortable periods is the whole discipline.
Market Impact: Vacancy has swung twice within just 5 years

Sell Network Coverage Rather Than Overflow Space

Overflow storage is bought to solve a temporary problem and ends when the problem does, which produces revenue that never compounds. Network coverage for fast delivery requires roughly 6 nodes that a shipper cannot justify building, and it is bought as a permanent arrangement that renews annually. Platforms positioned on coverage rather than surge achieve around 2 times the customer lifetime value, and the sales conversation reaches a supply chain leader rather than a warehouse manager solving this quarter's difficulty. Overflow customers were never really acquired at all. Coverage customers were, and they renew each year without being asked twice.
Market Impact: Doubles lifetime value across roughly 6 network nodes

Who Controls the Margin Pool

Concentration sits near 46% across the top five on measured platform revenue, and the leaders have converged on an operating model that looks considerably more like contract logistics than like a marketplace. The gap against smaller platforms is node coverage and operating capability rather than technology, since matching software is not difficult. What separates them is whether they can guarantee a service level across sites they do not own.
Competition runs on three dimensions. Node coverage is first, because a shipper buying two-day reach needs specific geography rather than available space anywhere. Second is operating consistency across partner sites, which determines churn and therefore whether any customer is profitable. Third is contracted capacity depth, which decides who can serve demand when the property market tightens and independent operators stop selling.

Two pressures are reshaping the field. Established contract logistics providers are offering flexible terms directly, arriving with node networks, labour and systems that platforms spent years assembling. Meanwhile the largest e-commerce platforms are selling fulfilment capacity to third-party merchants, reaching exactly the shipper segment these businesses were built to serve. Rankings will move toward participants with contracted node coverage and real operating capability.
on-demand-warehousing-platforms-market-company-positioning-matrix-1788423752446

Competitive Moat and Risk Dimensions

FLEXE

Moat: Contracted network breadth

Flexe built the broadest contracted node network in the category, which lets it offer geographic coverage rather than whatever space happens to be available, and coverage is what shippers buying delivery speed actually need. Its enterprise customers have requirements smaller platforms cannot meet across markets. A full property cycle of operating history gives it capacity relationships newer entrants lack.
FLEXE

Risk: Partner-operated service exposure

Service quality still depends substantially on partner warehouses operating to standard, and a shipper attributes any failure to the platform regardless of which site caused it. Imposing consistency across independent operators requires supervision cost that erodes the asset-light economics the model was built on. Contract logistics providers offering flexible terms arrive with directly operated sites and avoid that exposure.
STORD

Moat: Owned facility operating control

Stord moved decisively toward owned and directly operated facilities alongside its partner network, which gives it control of service quality in the nodes that matter most to customers. That combination lets it guarantee outcomes rather than arrangements, which is what enterprise shippers evaluate. Its integrated software and operations reduce the systems inconsistency that drives churn across purely brokered networks.
STORD

Risk: Capital intensity of owned sites

Owning and operating facilities carries lease commitments, staffing obligations and fixed cost through demand troughs that a matching platform avoids entirely. That changes the capital profile and the downside considerably during a soft period. Competing against established contract logistics providers on their own operating ground also means competing against organisations with far greater scale and considerably lower cost of capital.

Players Tracked

Prominent Players

Flexe
Stord
Ware2Go
Flowspace
ShipBob

Other Key Players

Chunker
WareSpace
Cubework
GEODIS
DHL Supply Chain
XPO
NFI Industries
Ryder System
Kuehne and Nagel
DP World
Lineage
Americold
Shipfusion
Radial
Hive

Recent Developments

MARCH 2025

Platforms extend directly operated facilities alongside partner networks

Several on-demand warehousing platforms took direct leases and staffed facilities in key nodes rather than relying entirely on partner operators, citing service consistency and customer retention. The moves were organic operational expansion rather than acquisitions of any existing logistics businesses. Partner networks were retained alongside the new sites.
Signal: Asset-light positioning gave way to operating control once churn data made the trade-off impossible to defend.
AUGUST 2025

Contract logistics providers introduce flexible short-term capacity offerings

Established third party logistics providers launched shorter commitment terms and variable pricing for warehouse and fulfilment capacity, targeting shippers who had previously used platforms for that flexibility. The offerings used existing facilities and staff rather than requiring new investment or partnerships. Pricing carried a modest premium.
Signal: Incumbents can copy flexible terms far more easily than platforms can build node networks and operating capability.
NOVEMBER 2025

Port-adjacent staging demand rises with trade routing uncertainty

Shippers increased inventory held near ports and border crossings in response to tariff changes and routing disruption, seeking the option to redirect goods after arrival. Demand arrived in concentrated bursts tied to policy announcements rather than following any consumer demand pattern. Capacity near major gateways filled quickly.
Signal: Staging demand is reliable in direction and genuinely unpredictable in timing, which makes capacity planning unusually difficult.

What Flexible Capacity Costs to Supply

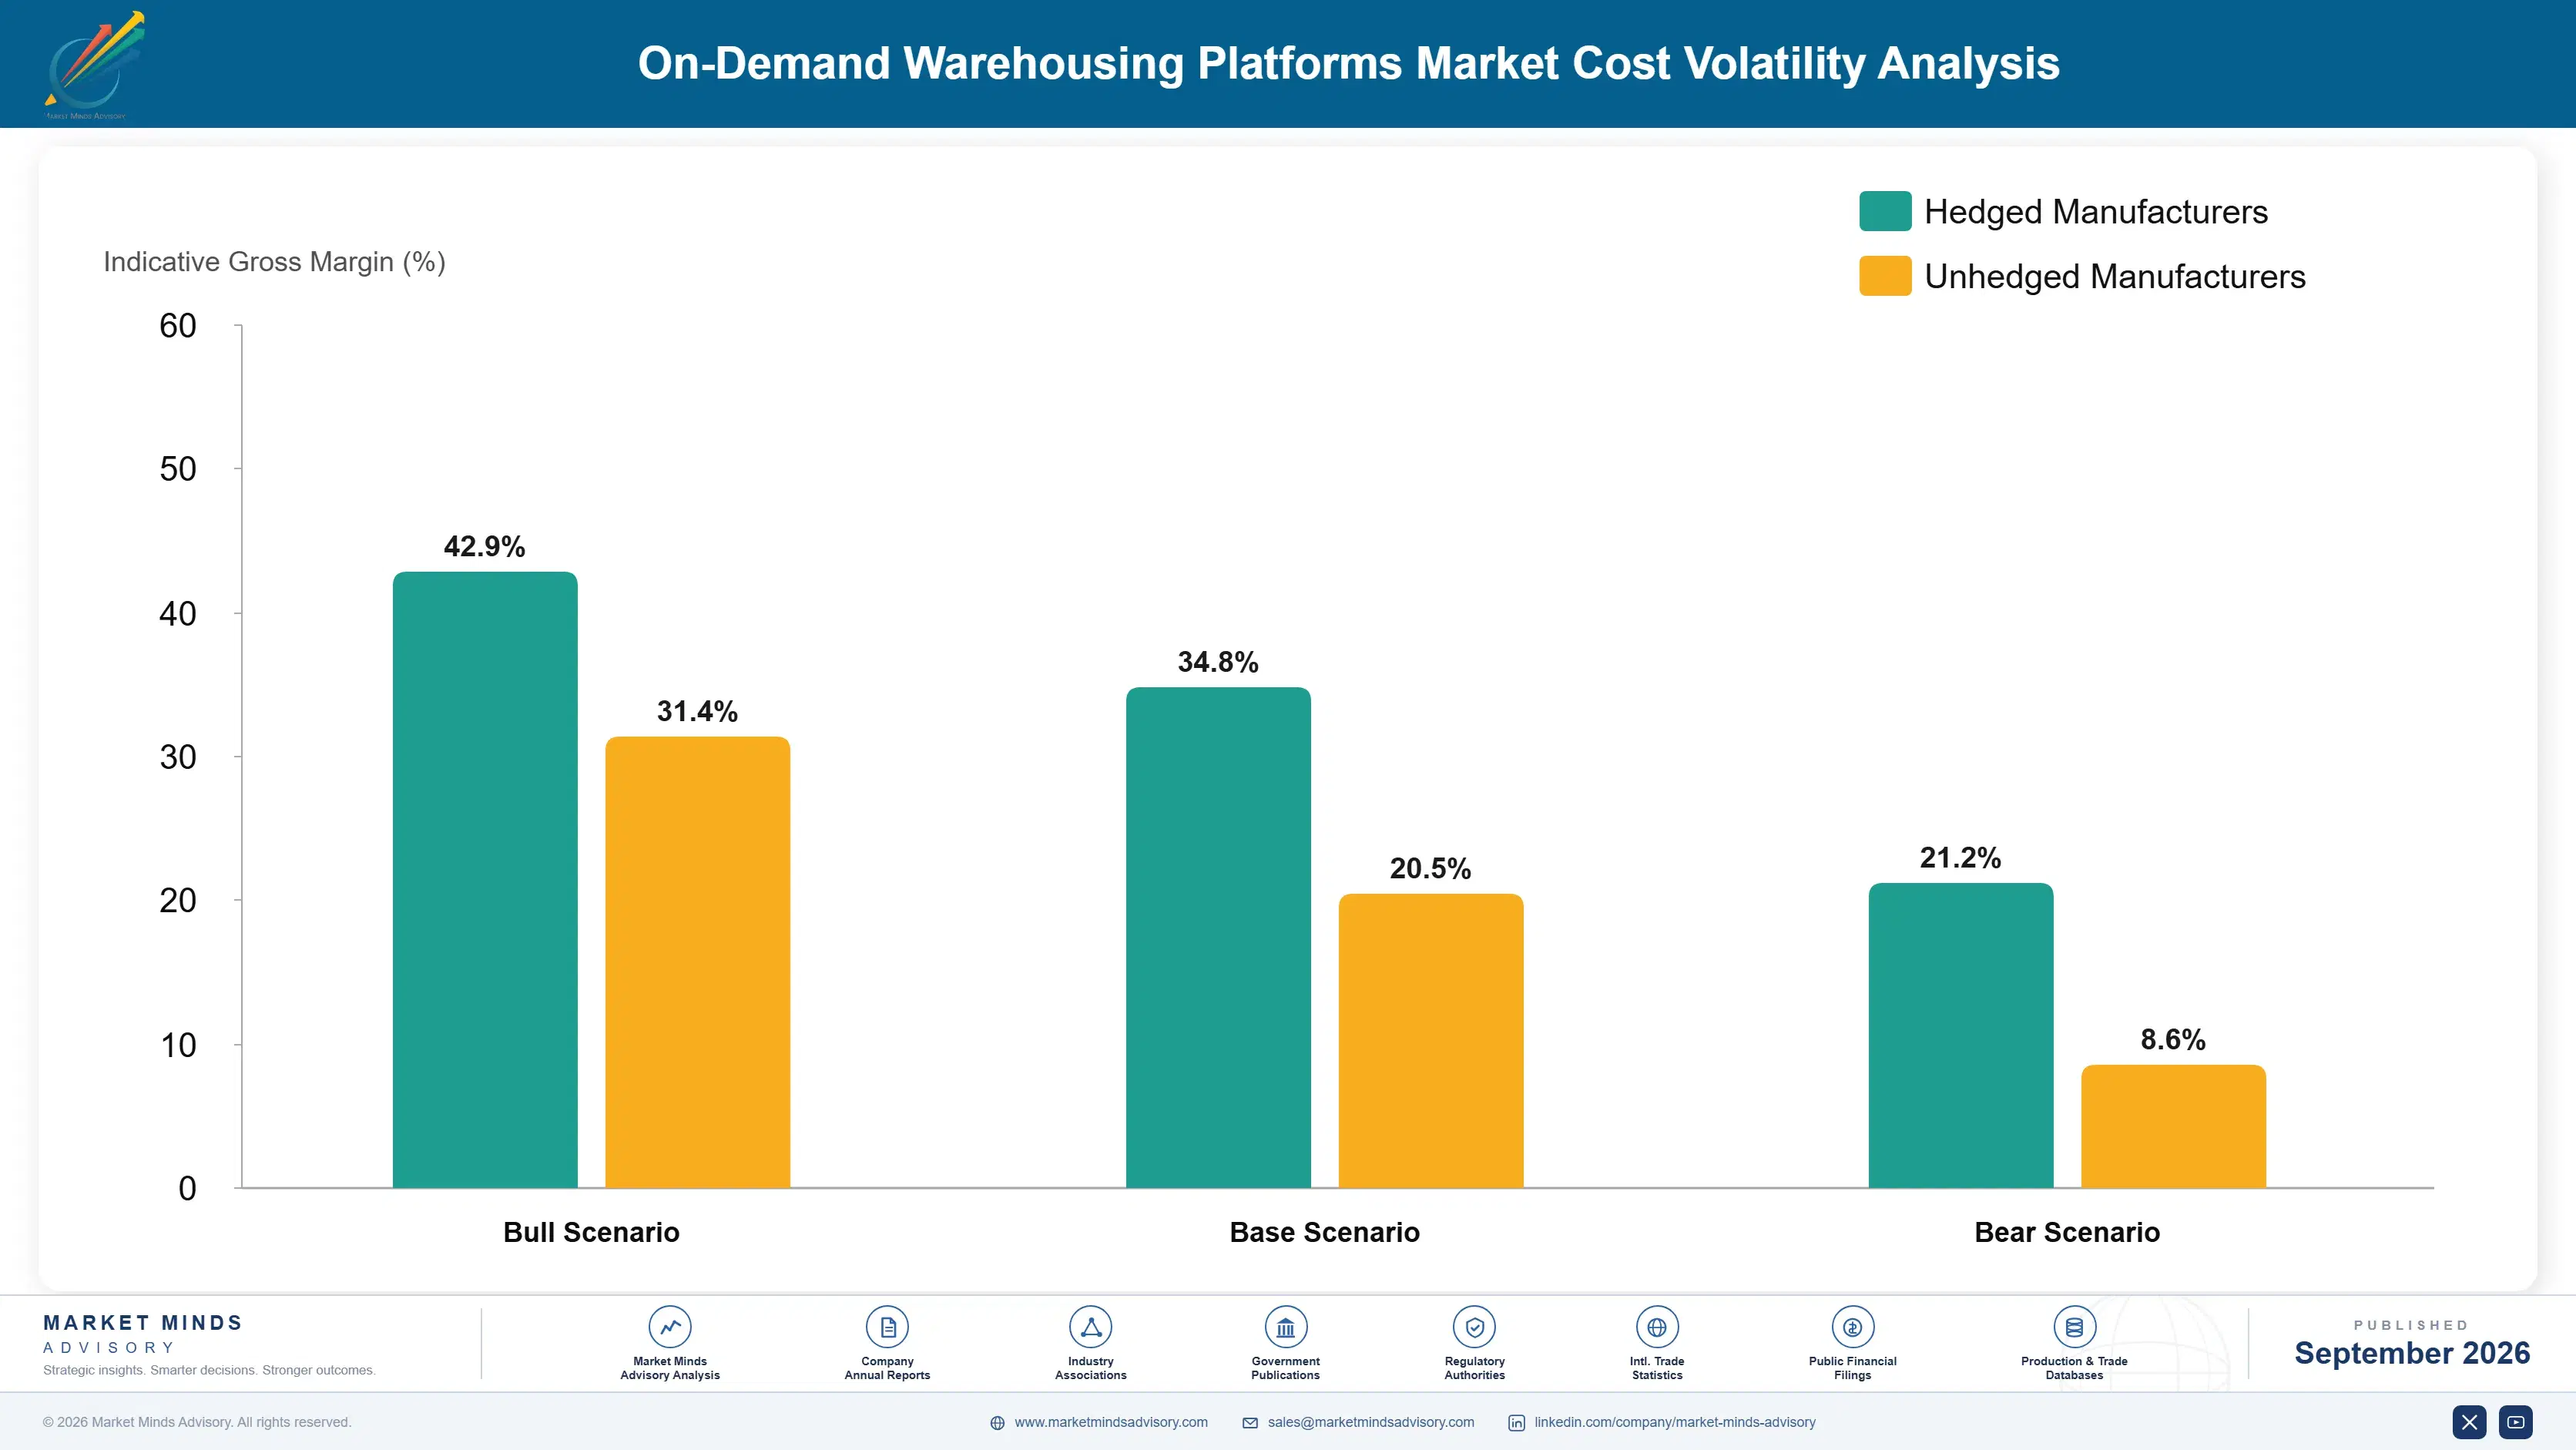
Cost structure is dominated by things the platform buys rather than builds. Payments to operating warehouse partners or direct lease and staffing cost run between 68% and 81% of revenue, the range reflecting whether a node is partnered or directly operated. Technology adds roughly 6%, onboarding and implementation 5%, and network management the balance. Gross margin retained sits near 19%, thin and characteristic of intermediated physical operations.
Labour rather than property has been the sharper pressure. Warehouse wages rose faster than industrial rents across 2024 and 2025 in most major markets, and Bureau of Labor Statistics warehousing earnings data documents the movement. Peak season staffing premiums have widened further, since availability tightens exactly when volumes arrive. Prologis and Ryder System both referenced industrial property and logistics labour conditions in recent annual reporting periods.

Exposure varies by operating model rather than by scale. Platforms brokering partner capacity pass labour cost through and carry service risk without controlling staff. Those operating directly carry wage inflation and staffing obligations and control the outcome customers judge. Platforms holding contracted space through a soft market carry commitments against uncertain demand. Smaller platforms lack both contracted supply and the volume to negotiate labour rates anywhere.
on-demand-warehousing-platforms-market-cost-volatility-analysis-1788423752640

Contract capacity during high vacancy periods

Spare capacity is abundant and cheap when vacancy is elevated and disappears when it tightens, which is precisely when customers need it most. Multi-year contracted space secured during soft periods costs commitment and guarantees supply through the turn. It looks like avoidable risk while the market is comfortable, and those who committed held customers when competitors could offer nothing.

Build labour pools rather than relying on partner staffing

Partner warehouses staff for their own baseline volume and struggle when a platform places additional work during peak, which produces failures the shipper attributes to the platform. Recruiting and training a directed labour pool carries employer obligations and removes the commonest cause of service failure. Staffed capacity also commands a premium over empty space in every peak.

Standardise systems across partner sites before scaling

Different warehouse systems across partner nodes produce inconsistent data, different picking accuracy and reporting a shipper cannot reconcile, which drives the churn that undermines unit economics. Deploying a common system per node costs implementation effort and removes much of the quality variance. Partners resist it, which is why it must be a joining condition.

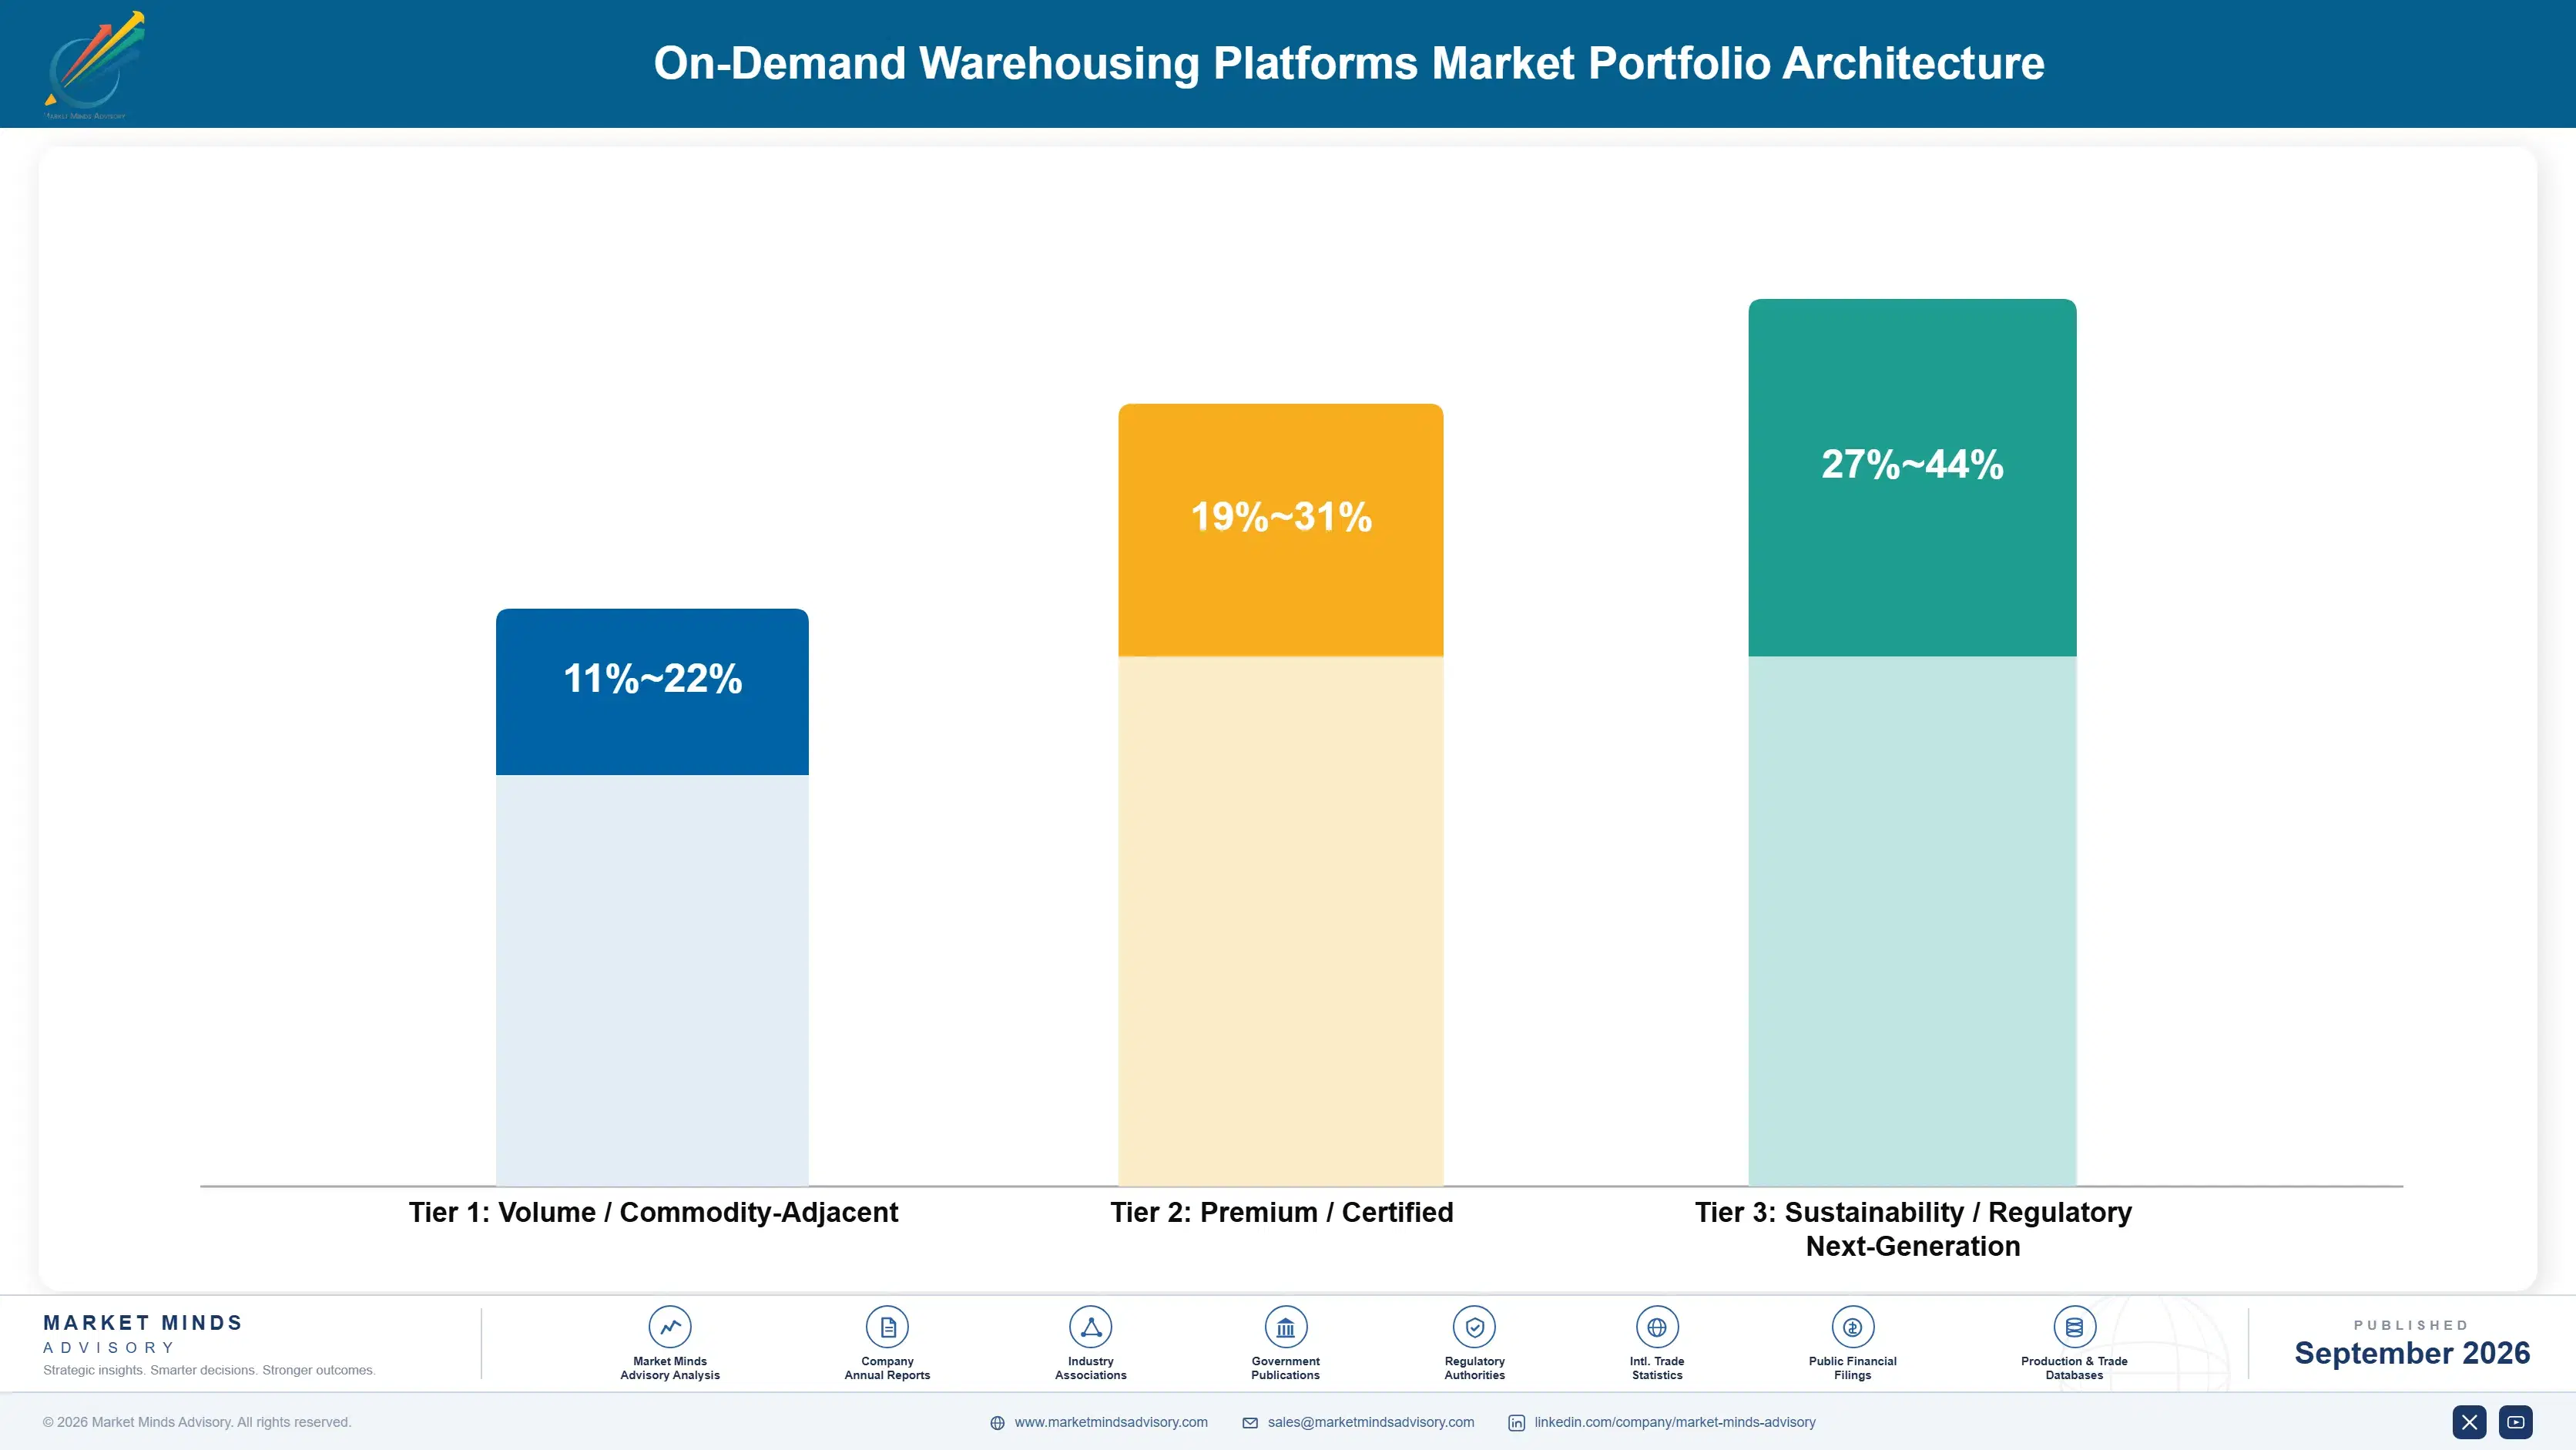
Portfolio Architecture for Margin Defence

Margin architecture separates on how much operating responsibility the platform accepts. Brokered space passes most of the revenue to the operating partner and retains a thin intermediation margin, with service risk retained regardless. Directly operated fulfilment carries labour and lease cost and earns considerably more because the platform is selling an outcome. Specialist handling, including cold chain and regulated goods, earns best because qualified capacity is genuinely scarce.
The volume tension is between brokered breadth and operated depth. Brokered capacity covers many locations cheaply and produces the coverage map that wins enterprise conversations. Operated nodes cost capital and staffing and produce the service consistency that keeps those customers past their first year. Platforms need both, and the balance moved toward operated nodes as churn data accumulated, which is more capital-intensive than any were funded to be.

High-value revenue concentrates in managed network coverage and in specialist handling capacity. Both share the property that the shipper is buying a capability they cannot assemble quickly themselves rather than space they could find elsewhere. Overflow storage occupies the volume position, arrives with a problem, ends when it is solved, and generates almost none of the recurring revenue the model promised.

Volume / Commodity-Adjacent

Brokered overflow and surge storage placed with partner operators on short terms. The wide range reflects whether the platform holds contracted space or sources it spot, which changes buying power completely. Service risk stays with the platform while most revenue passes to the partner.
Gross Margin: 11-22%

Premium / Certified

Managed fulfilment across standardised partner nodes with common systems and supervised operations. Margin improves because the platform sells a service outcome rather than an arrangement. Standardisation cost per node is real and it is what makes the revenue retain.
Gross Margin: 19-31%

Sustainability / Regulatory / Next-Generation

Directly operated nodes, cold and regulated goods handling, and port-adjacent staging in constrained locations. The widest range in the portfolio, reflecting property cost and qualification requirements by location. Highest margin and the most capital and labour intensive to deliver.
Gross Margin: 27-44%
on-demand-warehousing-platforms-market-portfolio-architecture-1788423753143

High-value Sub-segments and Strategic Watch-out

Managed Network Coverage

High value and high growth together, because the shipper is buying delivery reach that would otherwise require building roughly six nodes independently. The margin range reflects how many nodes are directly operated. Customers renew annually rather than departing once a temporary problem resolves itself, which changes the economics entirely.
Gross Margin: 22-34%

Cold and Specialty Handling

High value with steady growth, since qualified cold and regulated goods capacity is genuinely scarce and cannot be assembled quickly by anybody. The range reflects temperature class and regulatory qualification. Shippers accept premium pricing because the alternative is committing to a specialist lease they would rather avoid entirely.
Gross Margin: 31-44%

Brokered Overflow Storage

The volume core of placements and the weakest part commercially, retaining thin margin while carrying the service risk that drives churn. It builds the coverage map and the operator relationships everything else depends on. Platforms cannot exit it and have never earned adequately within it.
Gross Margin: 10-21%

Incumbent Flexible Offerings

The strategic watch-out, carried at zero because it represents demand served by contract logistics providers rather than platform revenue. Incumbents can offer flexible terms using facilities and staff they already hold. Platforms treating flexibility as their differentiator are defending the one thing an incumbent can copy immediately.
Gross Margin: 0-0%

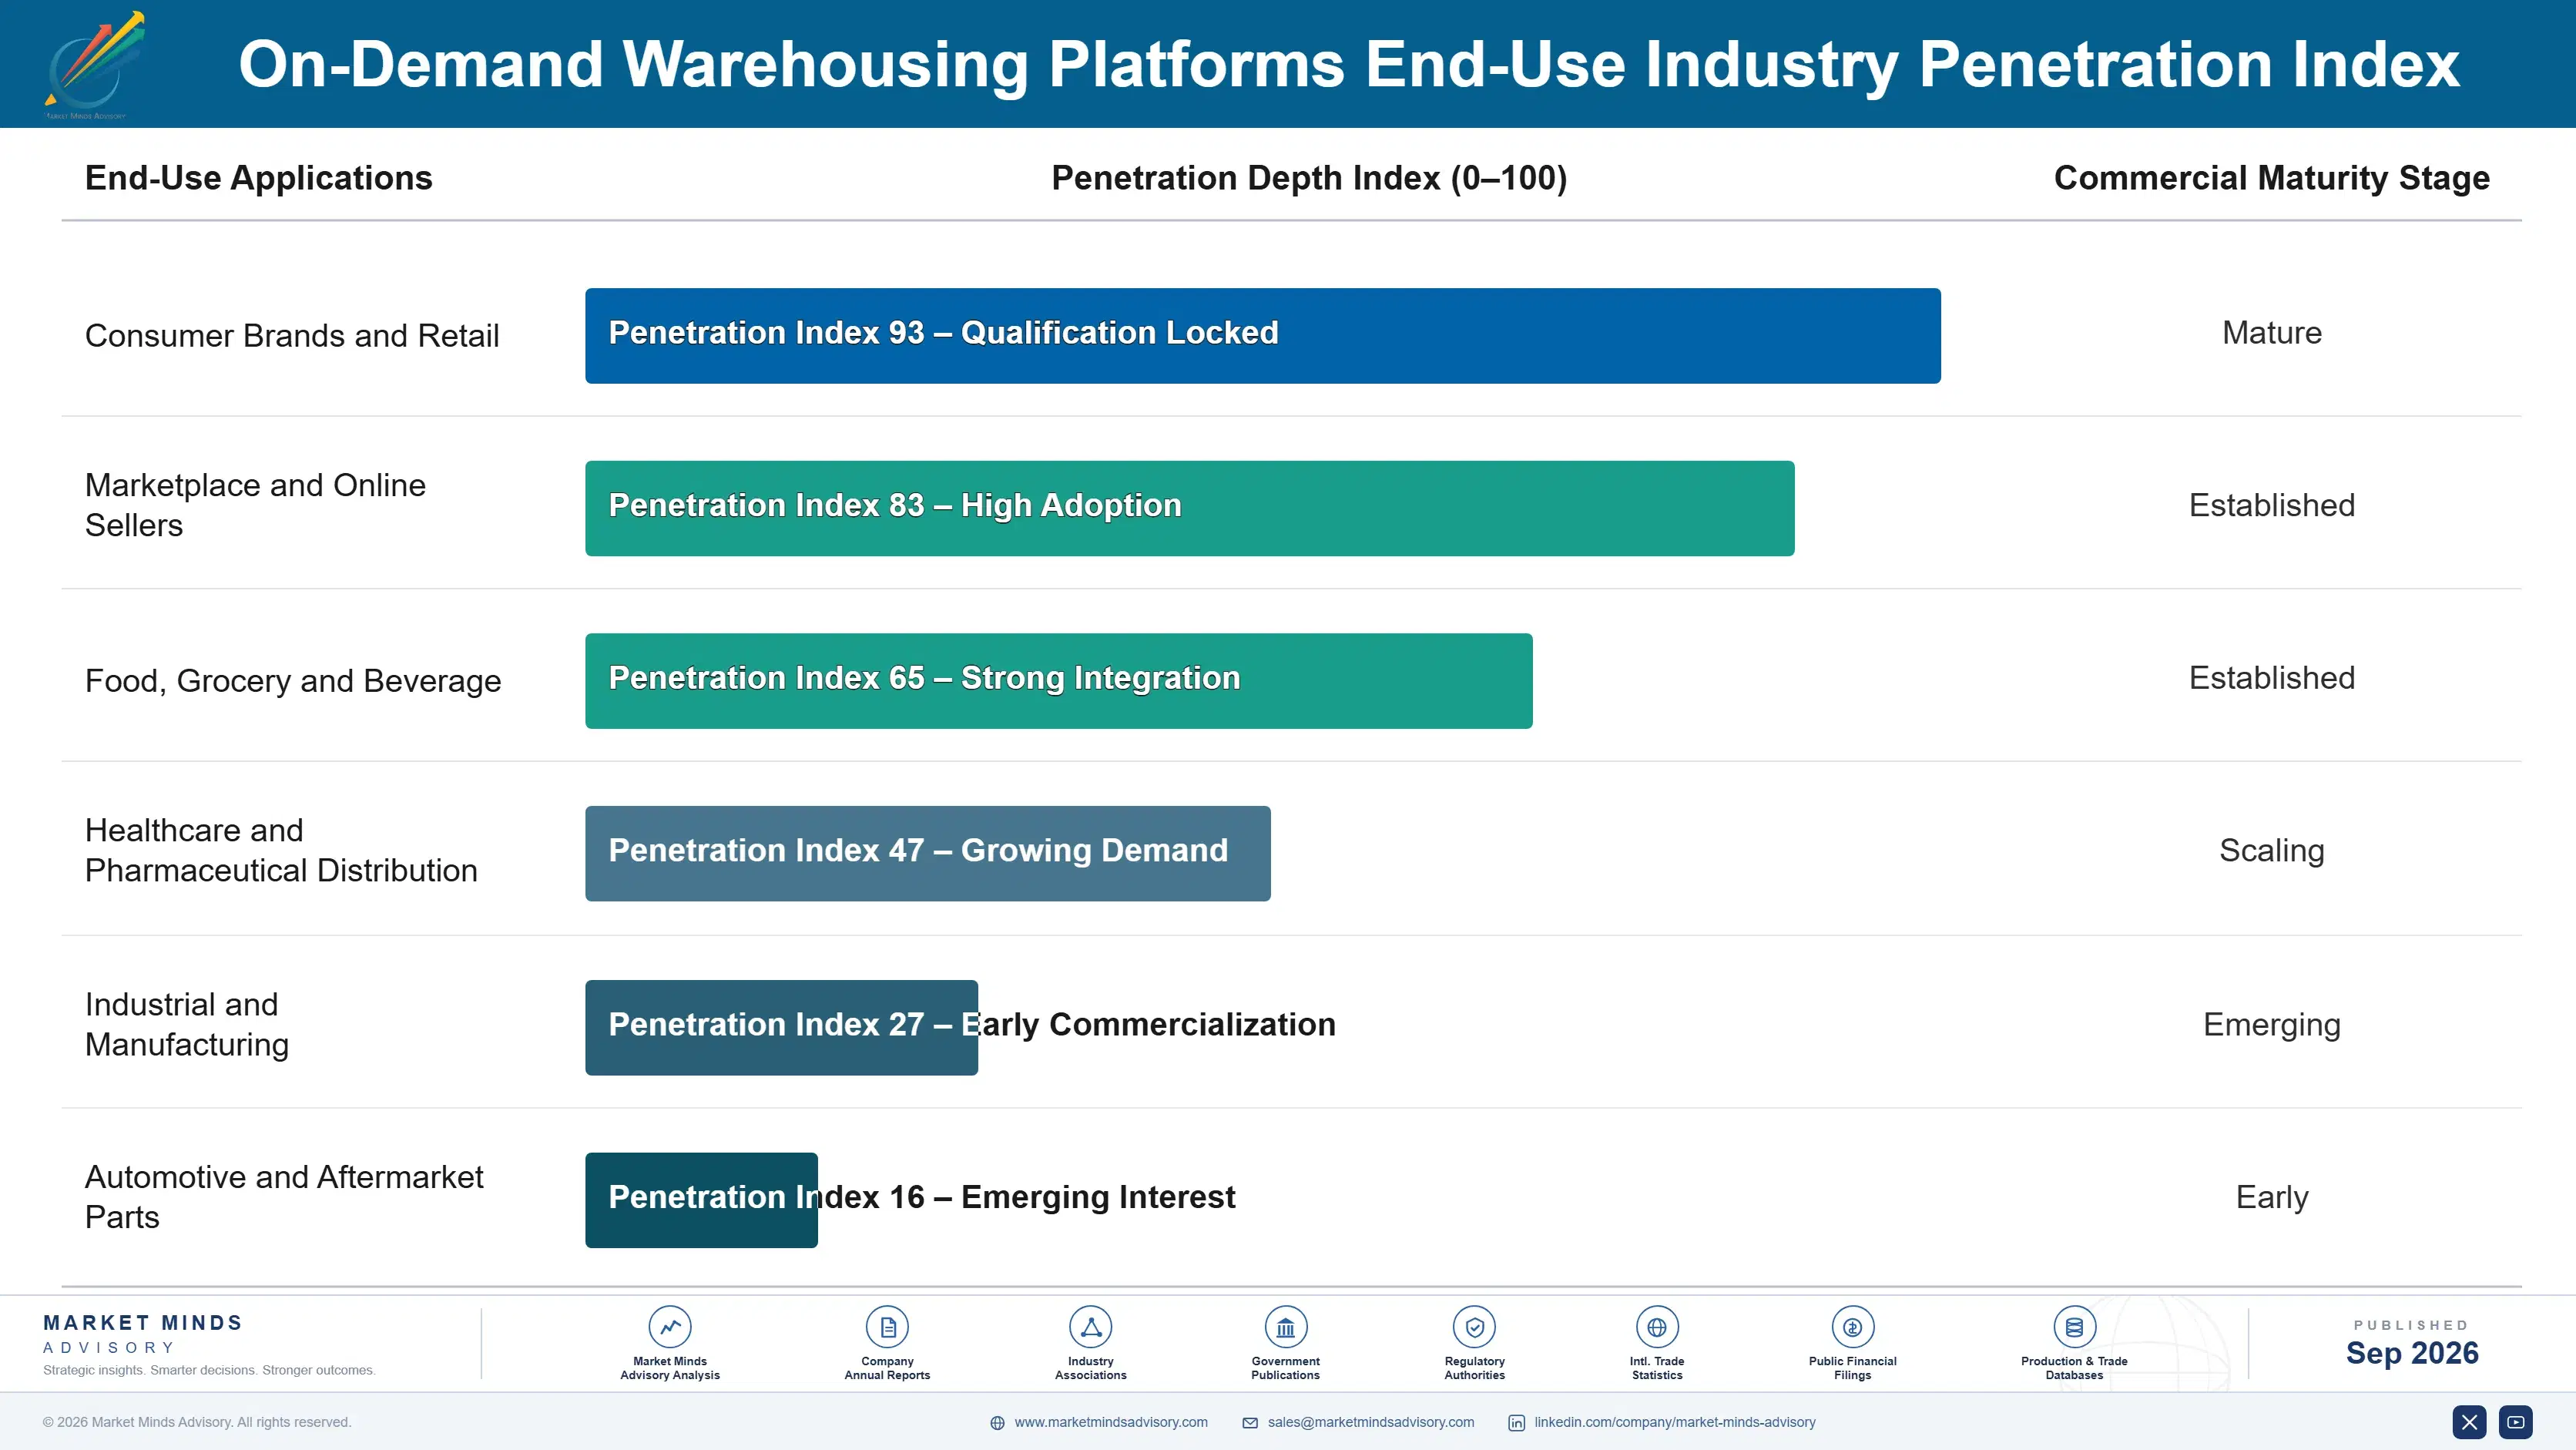
How This Revenue Repeats

Recurrence depends entirely on why the shipper came. Capacity bought for temporary overflow ends when the overflow does, which is why churn runs near 31% and growth requires constant replacement. Capacity bought as permanent network coverage renews annually because the shipper has no intention of building six nodes themselves. The same platform sells both, producing completely different lifetime values from customers that look identical at acquisition.
Adoption depth varies sharply by shipper type. Mid-sized consumer brands use managed network coverage continuously and integrate it into their order routing. Large retailers use surge capacity at peak and return to their own networks afterwards. Industrial shippers use port-adjacent staging around trade disruption. Marketplace sellers use fulfilment services broadly and switch readily on price. Grocery and cold chain shippers use specialist capacity deeply, since alternatives barely exist.

The buyer has moved from operations toward supply chain leadership. A warehouse manager once bought overflow space to solve an immediate problem within a small budget. Today a supply chain director buys network coverage as a design decision evaluated against building or leasing, with a larger budget and longer horizon. Platforms selling problem relief address the buyer whose purchase never recurs.
on-demand-warehousing-platforms-market-end-use-penetration-index-1788423753633

What Makes This Model Durable

These are among the four positions where our research anticipates prominent divergence between winners and laggards over the coming forecast period. Each is grounded in the demand model, the regulatory perimeter, and the announced capacity pipeline.
01 / OPERATING CONTROL OWNERSHIP

Run the network, because customers judge the service

Matching leaves service quality with independent operators the platform cannot direct, and inconsistency across sites drives churn near 31% within the first year regardless of how good the software is. Platforms imposing operating standards, common systems and supervised staffing hold customers roughly 3 times longer and price better, because the shipper is buying an outcome rather than an arrangement. Every platform that survived the last cycle made that trade, and the asset-light positioning turned out to be a funding story rather than an operating model.
02 / LABOUR SUPPLY CAPABILITY

Provide the people, not just the square footage

Fulfilment cost is roughly 58% labour, which means a platform brokering space alone has addressed the smaller half and left the harder half with a partner who may not manage it during peak. Platforms that recruit, train and direct warehouse labour capture around 40% more revenue per placement and hold customers through the periods when partner staffing typically fails. Becoming an employer across many submarkets is genuinely difficult, and shippers pay for it because unstaffed capacity during peak is worse than none.
03 / COUNTER-CYCLICAL CAPACITY CONTRACTING

Buy space when nobody wants it, not when everyone does

Operators sell spare capacity when vacancy is elevated and withdraw it the moment the market tightens, which left platforms unable to serve demand in 2021 and has repeated across earlier cycles too. Contracting multi-year capacity during soft periods costs real commitment and secures supply exactly when competitors have nothing at all to offer any customer. Vacancy has swung twice within five years, and the platforms that treated comfortable conditions as a buying opportunity kept customers who would otherwise have signed conventional leases.
04 / COVERAGE OVER OVERFLOW

Sell permanent network reach, not temporary problem relief

Overflow capacity is bought to fix a difficulty and ends when the difficulty does, producing revenue that never compounds and a customer who was never really acquired. Network coverage for fast delivery needs roughly 6 well-placed nodes that a shipper cannot justify building, and it is bought as a standing arrangement that renews. Platforms positioned on coverage achieve around 2 times the customer lifetime value and reach a supply chain director rather than an operations manager solving this quarter's problem.

Engagement Snapshot From the Field

A live engagement with an industry participant carrying material or product regulatory and market exposure ahead of a defining policy shift, showing how our research translates into a defensible multi-year portfolio strategy.
MARKET MINDS ADVISORY · CLIENT ENGAGEMENT SUMMARY
On-Demand Warehousing Platforms Producer Strategic Portfolio Review and Transition Roadmap 2026·Investment Scenario on On-Demand Warehousing Platforms Exposure Evaluation 2025-26
CLIENT PROFILE
A consumer brand group with annual online revenue near USD 340 million across four brands (client-reported, unverified by MMA), shipping from two owned distribution centres and using on-demand capacity for seasonal surge. Delivery performance had fallen behind competitors in three regional markets, and returns were being processed through exactly the same facilities that handled outbound orders.
STRATEGIC CHALLENGE
Management had approved leasing a third distribution centre at an estimated USD 14 million over five years to improve delivery coverage (client-reported, unverified by MMA). The surge capacity arrangement in use had produced inconsistent service across placements, and nobody had established whether the coverage problem required owned facilities or could be solved with contracted network capacity.
MMA APPROACH
MMA modelled delivery coverage against node location rather than against total capacity, which the group had never separated, and tested owned, leased and platform-supplied options against the same service target. We interviewed 13 internal stakeholders, five platforms and two contract logistics providers. Evaluation weighted operating consistency and node geography ahead of headline rate per pallet or per order.
KEY FINDINGS
  1. Two additional nodes in specific locations would have delivered the target coverage, and neither was where the proposed third distribution centre was going to be built.
  2. Service inconsistency traced to three partner sites running different warehouse systems, and the platform had no visibility into picking accuracy at any of them.
  3. Returns processing through outbound facilities was degrading peak outbound performance by roughly 14% on order cycle time during the busiest six weeks.
  4. Platforms offering directly operated nodes quoted rates around 18% higher than partner-only alternatives and demonstrated materially better service consistency in every reference check conducted.
CLIENT PROFILE
A consumer brand group with annual online revenue near USD 340 million across four brands (client-reported, unverified by MMA), shipping from two owned distribution centres and using on-demand capacity for seasonal surge. Delivery performance had fallen behind competitors in three regional markets, and returns were being processed through exactly the same facilities that handled outbound orders.
STRATEGIC CHALLENGE
Management had approved leasing a third distribution centre at an estimated USD 14 million over five years to improve delivery coverage (client-reported, unverified by MMA). The surge capacity arrangement in use had produced inconsistent service across placements, and nobody had established whether the coverage problem required owned facilities or could be solved with contracted network capacity.
MMA APPROACH
MMA modelled delivery coverage against node location rather than against total capacity, which the group had never separated, and tested owned, leased and platform-supplied options against the same service target. We interviewed 13 internal stakeholders, five platforms and two contract logistics providers. Evaluation weighted operating consistency and node geography ahead of headline rate per pallet or per order.
KEY FINDINGS
  1. Two additional nodes in specific locations would have delivered the target coverage, and neither was where the proposed third distribution centre was going to be built.
  2. Service inconsistency traced to three partner sites running different warehouse systems, and the platform had no visibility into picking accuracy at any of them.
  3. Returns processing through outbound facilities was degrading peak outbound performance by roughly 14% on order cycle time during the busiest six weeks.
  4. Platforms offering directly operated nodes quoted rates around 18% higher than partner-only alternatives and demonstrated materially better service consistency in every reference check conducted.
RECOMMENDED STRATEGY
Phase 1: Abandon the third distribution centre and contract two platform-operated nodes in the specific locations that coverage modelling identified as necessary. Phase 2: Require directly operated or system-standardised sites in the agreement, accepting materially higher rates in exchange for measurable and reportable service consistency. Phase 3: Move returns processing to dedicated reverse logistics capacity so that peak outbound performance stops being degraded by inbound returns volume.
OUTCOME
Delivery coverage targets were met within five months at roughly USD 3.9 million annually against the USD 14 million capital commitment avoided (client-reported, unverified by MMA). Peak outbound cycle time improved once returns were separated out, and service consistency complaints fell substantially across all four brands.

Frequently Asked Questions

Foundational context covering the market sizes, CAGR, scope, country, region and competition that inform every finding below. This section is provided to cover basics and most often pre-purchase conversations, answered from the MMA Primary Research Dataset.

What is the current size of the On-Demand Warehousing Platforms Market?

The market was worth USD 3.2 billion in 2025 and reaches USD 3.60 billion in 2026. Managed network capacity rather than overflow storage accounts for most of the growth.

How large will the On-Demand Warehousing Platforms Market be by 2036?

MMA forecasts USD 11.79 billion by 2036, an expansion of 3.28 times over the forecast period. That represents USD 8.19 billion of incremental annual revenue against 2026.

What is the CAGR for the On-Demand Warehousing Platforms Market 2026 to 2036?

The base case is 12.6% compound annual growth, with a bull case at 13.8% and a bear case at 11.4%. Warehouse vacancy conditions separate the three scenarios.

Which segment is growing fastest?

Managed fulfilment network capacity grows at 18.9%, half again the market rate of 12.6%. Pure matching could not hold customers, with churn near 31% in the first year.

Who are the major companies in the On-Demand Warehousing Platforms Market?

Flexe, Stord, Ware2Go, Flowspace and ShipBob lead on measured platform revenue. Together they hold roughly 46%, and the leaders now resemble contract logistics providers more than marketplaces.

Which country is growing fastest?

India grows fastest at 17.8%, on warehouse market formalisation that created professionally operated regional capacity where informal and unmanaged storage had previously dominated across most states.

Report Segmentation Architecture

The full report scope spans multiple orthogonal segmentation dimensions, with cross-tabulated demand data provided for each dimension pair. Coverage extends further to regional breakdowns, trend trajectories, and the competitive detail needed to support segment-level decision-making.

By Primary Market Dimension

  • Short-Term Overflow Storage
  • Managed Fulfilment Network Capacity
  • Peak Season Surge Capacity
  • Cross-Border and Port-Adjacent Staging
  • Returns Processing and Reverse Logistics
  • Cold and Specialty Handling Capacity

By End-Use Industry

  • Consumer Brands and Retail
  • Marketplace and Online Sellers
  • Food, Grocery and Beverage
  • Healthcare and Pharmaceutical Distribution
  • Industrial and Manufacturing
  • Automotive and Aftermarket Parts

By Commercial Dimension

  • Direct Shipper Contracts
  • Enterprise Network Agreements
  • Partner Warehouse Supply
  • Directly Operated Nodes
  • Logistics Provider Partnerships
  • Marketplace Seller Programmes

By Region

  • North America
  • Western Europe
  • East Asia
  • South Asia and Pacific
  • Latin America
  • Middle East and Africa
  • Eastern Europe

Scope, Methodology, and Coverage

Every figure in this report is reproducible from documented input assumptions. The scope below maps the historical period, the forecast horizon, the segmentation dimensions, and the countries covered, alongside the underlying primary and qualitative methodology.
Historical Period
2020 to 2025
Forecast Period
2026 to 2036
Base Year
2025 (USD billions; MMA Primary Research Dataset, September 2026)
Market Definition
This market covers platforms matching shippers with warehouse and fulfilment capacity on flexible terms without a conventional lease, spanning short-term overflow storage, managed fulfilment network capacity, peak season surge capacity, cross-border and port-adjacent staging, returns processing and reverse logistics, and cold and specialty handling capacity. Revenue is measured as gross platform revenue including space, handling and fulfilment services billed to shippers, whether delivered through partner or directly operated facilities. Conventional multi-year warehouse leasing, contract logistics arrangements agreed outside a platform, freight brokerage, parcel and transport carriage, and warehouse management software sold standalone are excluded.
Quantitative Units
USD billions, gross platform revenue billed to shippers
Segmentation Dimensions
Service type, shipper industry, commercial model, region
Regions Covered
North America, Western Europe, East Asia, South Asia and Pacific, Latin America, Middle East and Africa, Eastern Europe
Countries Covered
United States, Canada, Mexico, Brazil, Chile, Colombia, United Kingdom, Netherlands, Germany, France, Spain, Italy, Belgium, Sweden, Poland, Czechia, China, Japan, South Korea, Taiwan, Singapore, India, Indonesia, Vietnam, Australia, United Arab Emirates, Saudi Arabia, South Africa
Key Companies Profiled
Flexe, Stord, Ware2Go, Flowspace, ShipBob, Chunker, WareSpace, Cubework, GEODIS, DHL Supply Chain, XPO, NFI Industries, Ryder System, Kuehne and Nagel, DP World, Lineage, Americold, Shipfusion, Radial, Hive
Quantitative Methodology
Primary survey, n=3,800 respondents, Q4 2025, six countries; demand-side model with trade association cross-validation
Qualitative Methodology
47 expert interviews, Q4 2025; applied to validate demand model assumptions, identify emerging dynamics, and assess competitive positioning
Report Format
PDF and XLSX data workbook (Word format preview document)
Publisher
Market Minds Advisory
Report Code
MMA-2026-TEC-901
Published
September 2026
Contact
sales@marketmindsadvisory.com | www.marketmindsadvisory.com

Purchase the full On-Demand Warehousing Platforms Market Report (2026 to 2036).

The full MMA report explains why every platform in this category quietly stopped being a marketplace, and what the resulting operating model actually costs to run. It sizes the market to 2036 across six service types, seven regions and 28 countries, with segment growth rates and regional demand mechanisms set out in full. Competitive analysis covers 20 participants assessed on measured platform revenue, including moat and risk assessment for the two leaders. The report quantifies cost structure, labour exposure and margin architecture across three portfolio tiers, alongside churn and lifetime value by service type. It closes with four strategic verdicts and an anonymised consumer brand engagement.
Six service types sized to 2036
Seven regions with demand mechanism analysis
Twenty participants on consistent revenue basis
Churn, labour cost and vacancy benchmarks
Margin architecture across three portfolio tiers
Anonymised consumer brand fulfilment network engagement

Built For The People Who Decide

From boardroom strategy to bench-side execution, this report is read cover-to-cover by leaders shaping the next decade of their industry, turning demand scenarios, market dynamics and valuation benchmarks into decisions.
CXOs/ Presidents/ VPs/ Managers
M&A and Corporate Development
Strategy Teams and R&D Heads
Procurement and Product Directors
Regulatory and Compliance Leaders
Investor Relations and Equity Analysts