Market Minds Advisory
On-Demand Delivery Management Solution Market

On-Demand Delivery Management Solution Market: On-Demand Delivery Management Solution Market: Density Economics, Courier Supply and The Last Two Hundred Metres 2026 to 2036

Routing software optimises the part of a delivery that was never really the problem. The expensive minutes all happen after the vehicle stops, and almost nobody is building for that.

Lead Analyst

Published

September 2026

Make Smarter Decisions with Customized Research Insights

Request a free sample report and evaluate market opportunities, growth trends, and competitive dynamics relevant to your business needs.

2025 MARKET VALUE$3.8BMarket Size 2025
2036 FORECAST VALUE$14.0BBase Case , 2026 to 2036
CAGR 2026 TO 203612.6 %Bull 13.9% / Bear 11.4%
INCREMENTAL OPPORTUNITY$9.7BNet 10- year value creation
EXPANSION MULTIPLE3.26x2036 value over 2026 base
Strategic Levers
M&A Pipeline
Regional Outlook
Country Rankings
Competitive Intelligence
Segmental Deep-dive
Call-Us : 91 93563 13602

Executive Snapshot and Market Trajectory.

Routing software optimises the part of a delivery that was never really the problem at all. The expensive minutes happen after the vehicle stops: finding the entrance, the lift, the correct door and somebody actually willing to answer it. Very little software addresses any of that.
The market reaches USD 4.3 billion in 2026 and USD 14.0 billion by 2036, a 3.26 times expansion at 12.6% annually. Courier supply and marketplace balancing systems grow at 18.9%, half again the market rate of 12.6%, because having enough riders available at the right moment matters far more than routing them cleverly. East Asia holds 32% of global spending, above the usual band ceiling, and Indonesia compounds fastest of any market measured at 20.4%.
Five vendors hold just 36% of licence and subscription revenue, because the largest operators build their own systems entirely and the rest buy from a genuinely crowded field of specialists. Bringg, Onfleet, Shipsy, FarEye and Locus lead what remains of the commercial part of this market. Delivery density rather than any software capability at all is what actually determines whether these operations make money.
Market Definition
This report covers on-demand delivery management software by function class: courier supply and marketplace balancing systems, dynamic dispatch and assignment engines, route optimisation and sequencing tools, customer communication and tracking interfaces, proof of delivery and exception handling, and delivery analytics and network planning platforms. It excludes warehouse management and fulfilment systems, freight and long-haul transportation management, vehicle telematics hardware, consumer-facing marketplace applications sold to end customers, and payment processing platforms.
Base Year Value
$3.8B in 2025 (MMA Primary Research Dataset, September 2026)
Forecast Period
2026 to 2036, eleven discrete annual values
CAGR
12.6% base case. Bull 13.9%. Bear 11.4%.
Fastest Growth Segment
Courier Supply And Marketplace Balancing Systems: 18.9% CAGR
Fastest Growth Country
Indonesia: 20.4% CAGR
Fastest Growth Region
South Asia and Pacific: 14.9% CAGR
Largest Region
East Asia: 32% of 2025 global value
Market Leaders
Bringg, Onfleet, Shipsy, FarEye and Locus lead on on-demand delivery management software licence and subscription revenue. Source: MMA Analysis.
Primary Survey
n=3,800 procurement and R&D decision-makers, Q4 2025, six countries
Methodology
Demand-side build-up, cross-validated against public data, 47 expert interviews

On-Demand Delivery Management Solution Market Forecast Scenarios

on-demand-delivery-management-solution-market-size-forecast-scenario-1789996517775
Between 2020 and 2025 the category compounded at 11.3%, through a period that contained one enormous distortion. Delivery volume surged, operators scaled without much regard for unit economics, and software was bought to handle growth rather than to make it profitable. The correction that followed was brutal for operators and quietly useful for vendors, because the survivors started asking about cost per delivery.
The base case holds 12.6% on three mechanisms. Courier supply balancing keeps growing because rider availability at peak moments determines whether an operator can accept orders at all. Delivery density improves as volumes concentrate in fewer neighbourhoods, which changes what the software must optimise for. And rapid urbanisation right across Southeast Asia and India keeps creating delivery networks in cities where organised logistics of any kind barely existed a decade ago.
The bull case at 13.9% assumes operators consolidate faster than expected, since the survivors run larger networks needing more sophisticated systems than the fragmented field did. The bear case at 11.4% is in-house development: the largest operators build their own platforms, and every operator that reaches sufficient scale eventually asks whether it should be paying somebody else for something so central.

The Last Two Hundred Metres

The industry optimises the wrong half of the problem and has done for years. Around 46% of delivery minutes are spent after the vehicle has stopped: finding the building entrance, waiting for a lift, locating the right door and getting somebody to answer it. Routing software addresses the other half brilliantly and the expensive half hardly at all, which is why route optimisation is now close to a commodity.
TOP FIVE CONCENTRATION36%Low, since the largest operators build their own systems instead
POST-STOP TIME SHARE46%Delivery minutes spent after the vehicle has already stopped
DROPS PER HOUR THRESHOLD4 dropsDensity below which most delivery economics stop working entirely
COURIER FILL RATE78%Peak demand periods with sufficient riders available to accept
FAILED DELIVERY RATE6%Attempts requiring a second visit or alternative arrangement
OPERATOR NET MARGIN3%Typical result across the established on-demand delivery operators
Density is what actually determines whether any of this works commercially. Below roughly four drops an hour the economics stop functioning at almost any wage level, which is why operators concentrate volume into fewer neighbourhoods rather than covering wider areas. Software that improves density is worth considerably more than software that improves routing efficiency within a sparse network that was never going to be profitable regardless.
The third constraint is courier supply, which is a marketplace problem rather than a logistics one. Peak demand periods have sufficient riders available only around 78% of the time, and an order that cannot be accepted is revenue that simply never existed. Courier supply and marketplace balancing systems grow at 18.9% against 12.6% for the market, because operators finally worked out where the constraint sits.
"Every pitch in this category shows a map with a nicely optimised route on it. Nobody shows the rider standing outside a residential block at ten at night trying to work out which of forty buzzers to press. That is where the money goes and almost nobody is building for it."
Director, Last Mile Logistics and Delivery Technology Practice · MMA Technology Practice · September 2026

Market Trends

Courier Availability Replaces Routing As The Binding Constraint

Peak demand periods have sufficient riders available only around 78% of the time, and an order an operator simply cannot accept is revenue that never existed at all rather than revenue merely delayed. That makes marketplace balancing considerably more valuable than any amount of routing cleverness applied to riders who have not turned up for the shift. Courier supply and marketplace balancing systems grow at 18.9% against 12.6% for the market. Incentive design, shift forecasting and rider retention have all become software problems rather than operations problems anybody solves manually.
Market Impact: Indonesia compounds at 20.4% yearly

Density Economics Drive Network Contraction Rather Than Growth

Below roughly four drops an hour the unit economics of on-demand delivery stop working at almost any realistic wage level, which is precisely why surviving operators concentrate volume into fewer neighbourhoods rather than extending their coverage outward. That inverts the entire growth logic this whole industry ran on for the better part of a decade. Software that raises the effective density is worth considerably more than software optimising routes inside a sparse network that was never going to be commercially viable regardless of how well anybody happened to plan it.
Market Impact: Failed attempts reach 6% typically

Market Opportunities and Growth Drivers

Urbanisation Creates Networks Where None Previously Existed

Rapid urban growth right across Southeast Asia and India keeps creating delivery demand in cities where organised logistics barely existed a decade ago, and those networks get built with modern software right from the outset rather than migrated from anything older. Indonesia compounds at 20.4% annually, faster than any other market measured anywhere in the world, on urban delivery demand growing alongside smartphone penetration and payment infrastructure at the same time. Those operators also start out with density concentrations that Western networks spent years learning to build deliberately for themselves.
Market Impact: Concentration caps at just 36%

Failed Deliveries Carry Costs Operators Finally Measure

Around 6% of all delivery attempts require a second visit or some alternative arrangement, and each one of those costs roughly what the original attempt cost while generating no additional revenue whatsoever for anybody. Operators running at three percent net margin have finally started measuring that cost properly rather than treating it as unavoidable operational friction. Proof of delivery and exception handling tools consequently grow at 13.4% as a direct result, because reducing the failure rate converts directly into margin in a way that routing improvements have rarely managed to.
Market Impact: Operators net roughly 3% margin

Market Restraints and Challenges

Largest Operators Build Their Own Platforms Instead

Any operator reaching sufficient scale eventually asks whether it should be paying somebody else for a system this central to how it makes money, and the largest ones consistently conclude that it should not. The root cause is that delivery management is the operating core of these businesses rather than any kind of supporting function. Commercially this caps concentration at just 36% and removes the very biggest accounts entirely. Mitigation runs through mid-market operators, through specialist delivery verticals, and through components that are simply too costly for anybody to rebuild internally.
Market Impact: Fill rates reach only 78%

Operator Margins Leave Almost No Software Budget

Established on-demand delivery businesses now run at roughly three percent net margin, which leaves very little room for software spending that does not pay back inside a single quarter. The root cause is a competitive arrangement where consumers compare delivery fees directly and switch between operators without any hesitation at all. Commercially this forces every single purchase through a payback test that most software simply fails. Mitigation runs through courier fill rate and failed delivery reduction, both of which convert directly into measurable margin rather than into any claimed efficiency.
Market Impact: Economics break below 4 drops
3 additional market trends, 4 additional growth drivers, and 2 additional restraints and challenges are covered in the full report. Contact sales@marketmindsadvisory.com to access the complete intelligence.

Segment CAGR and Growth Architecture

Segmentation follows function class, since each addresses a different part of the delivery problem and carries quite different commercial value to an operator running on thin margins. Six classes cover the market, spanning courier balancing, dynamic dispatch, route optimisation, customer communication, proof of delivery and network analytics. Operator type is a separate dimension entirely.
on-demand-delivery-management-solution-market-market-share-analysis-1789996518384

Courier Supply And Marketplace Balancing Systems

Courier supply and marketplace balancing systems grow at 18.9%, half again the market rate of 12.6%, because rider availability rather than routing intelligence determines whether an operator can accept an order at all. Peak periods have sufficient couriers available only around 78% of the time, and an order that cannot be accepted is revenue that never existed rather than revenue delayed. Incentive design, shift forecasting and retention modelling have become software problems rather than operations problems anybody handles manually. This is the segment where operators now spend first, having spent the better part of a decade spending on routing capability instead. The shift happened quickly once the correction forced it.
CAGR 18.9%

Proof Of Delivery And Exception Handling

Proof of delivery and exception handling tools compound at 13.4% because roughly 6% of delivery attempts require a second visit or alternative arrangement, and each one costs approximately what the original attempt did while generating no additional revenue at all. Operators running at three percent net margin have finally started measuring that properly rather than accepting it as unavoidable friction. Reducing that failure rate converts directly into margin, which is the test that every software purchase now has to pass before approval. Address quality also varies enormously between individual markets. Access instructions, recipient availability prediction and safe-place handling arrangements are where most of the actual improvement comes from in practice.
CAGR 13.4%
Full segment breakdown across 6 segments available in the complete report.

Regional Architecture and Country Demand Map

East Asia holds 32% of spending, above the usual band, because urban density across Chinese, Japanese and Korean cities supports delivery economics that most Western networks cannot match at all. South Asia and Pacific follows at 21%, far above band, on rapid urban network growth.

East Asia

East Asia takes 32% of spending, above the 30% band ceiling, on urban density that supports delivery economics most Western networks simply cannot reach. Chinese cities routinely deliver at drop densities several times the four an hour threshold below which economics stop working, which changes what the software has to optimise for entirely. Japanese and South Korean operators run high service level networks where failed delivery rates are considerably lower than elsewhere. Domestic platforms serve the great majority of the Chinese market directly themselves. Growth at 13.8% sits above the global rate on continuing volume growth rather than on any network expansion. Density here changes what the software must optimise for.
Share: 32% | CAGR: 13.8% (2026 to 2036)

South Asia and Pacific

South Asia and Pacific takes 21% of category spending, far above the 12% band ceiling, because delivery networks right across India and Southeast Asia are being built at a pace and a scale that no other region anywhere matches. Indonesia compounds at 20.4% annually, faster than any market measured anywhere, on urban delivery demand growing alongside smartphone penetration and digital payment infrastructure all at the same time. Those networks deploy modern delivery software from the outset rather than migrating away from anything older. Indian operators run at densities that make the unit economics work in places where Western equivalents struggle rather badly. Regional specialist vendors hold particularly strong positions here.
Share: 21% | CAGR: 14.9% (2026 to 2036)
Regional intelligence for 5 additional markets available in the complete report: North America, Western Europe, Latin America, Middle East and Africa, Eastern Europe. Contact sales@marketmindsadvisory.com.
on-demand-delivery-management-solution-market-country-cagr-analysis-1789996518907

Where Delivery Software Earns Money

Operators run on three percent net margins and reject anything without a quick payback, the very largest ones simply build their own systems entirely instead, and the expensive half of every delivery all happens after the vehicle has already stopped. The four levers below follow those conditions rather than any argument about routing algorithms.

Solve Courier Supply Before Routing Efficiency

Peak periods have sufficient riders available only around 78% of the time, and an order that cannot be accepted is simply revenue which never existed at all rather than revenue merely delayed. That makes marketplace balancing considerably more valuable than routing intelligence applied to couriers who have not turned up for the shift. Vendors still leading with route optimisation are selling into a problem that operators have largely solved already. Those leading with courier fill rate instead are selling against the one constraint that actually caps revenue every single evening.
Market Impact: Fill rates reach only 78% during peak periods

Attack The Minutes After The Vehicle Stops

Around 46% of all delivery minutes are spent after the vehicle has already stopped, finding entrances, waiting for lifts and locating the right doors, and almost no software addresses any of it. Access instructions, building intelligence and recipient availability prediction are where all of that remaining time actually sits. Vendors competing on route optimisation alone are competing over the half of the problem that has already been thoroughly solved by everybody involved. The unsolved half is considerably larger, and nobody at all has yet built a genuinely credible product for it.
Market Impact: Post-stop time absorbs 46% of all delivery minutes

Price Against Failed Delivery Cost Directly

Roughly 6% of all delivery attempts require a second visit costing approximately what the first one did, while generating no additional revenue whatsoever for anybody. At three percent net margin that failure rate consumes a genuinely meaningful share of everything an operator actually earns. Vendors presenting general efficiency improvements are offering savings that the operator will discount heavily before the meeting even ends. Those presenting failure rate reduction instead are offering a number the operator already tracks and can verify directly against its own operational reporting without any assistance whatever.
Market Impact: Failed attempts consume 6% of every single delivery

Follow Networks Being Built From Nothing

Urban delivery networks right across Southeast Asia and India are being built now rather than migrated from anything older, and they deploy modern software from the very outset without any legacy system to displace first. Indonesia compounds at 20.4% annually on exactly that kind of expansion happening right now. Those operators also start out with drop densities above the four an hour threshold that Western networks spent years learning to engineer deliberately. Vendors organised around displacing incumbent systems at mature operators instead face a considerably harder commercial task than any of that.
Market Impact: Indonesia alone compounds at 20.4% every single year

Who Controls the Margin Pool

Five vendors hold just 36% of licence and subscription revenue, because the largest delivery operators build their own systems entirely and the remainder buy from a genuinely crowded field of specialists. Bringg, Onfleet, Shipsy, FarEye and Locus lead the commercial market. All participants here are assessed consistently on on-demand delivery management software licence and subscription revenue rather than on any broader logistics technology business they operate.
Competition runs on courier supply capability and on failed delivery reduction far more than on routing quality, which most credible products now handle comparably well anyway. The second dimension is regional operating knowledge, because address conventions, payment behaviour and courier labour markets differ enough between regions that international products frequently underperform local specialists in ways that surprise nobody actually operating there.

Pressure comes from the operators building their own platforms internally once they reach sufficient scale, which removes those particular accounts permanently rather than merely temporarily. Rankings shift wherever networks are being built entirely new rather than where established operators simply replace their systems, particularly across Indonesia, India and the Gulf, where urban delivery demand keeps on expanding rapidly.
on-demand-delivery-management-solution-market-company-positioning-matrix-1789996519442

Competitive Moat and Risk Dimensions

BRINGG

Moat: Enterprise Retailer Integration Depth

Bringg holds positions with large retailers running delivery alongside their own commerce operations, which requires integration into order management and inventory systems pure delivery platforms never touch. That integration takes months to build and reaches a buyer with considerably more software budget than any pure delivery operator holds. Retail customers also carry none of the three percent margin constraint.
BRINGG

Risk: Pure Operator Exclusion

Enterprise retail integration matters very little to a dedicated delivery operator running on thin margins and evaluating everything on quarterly payback. Those operators are where courier supply and density problems concentrate most acutely. Depth in one buyer type does not transfer to the other, and the two evaluate software on almost entirely different grounds.
SHIPSY

Moat: Emerging Market Operating Knowledge

Shipsy built around operating conditions across India, Southeast Asia and the Gulf, where informal address systems, cash handling and motorcycle fleets change what the software must actually do. That knowledge came from deployments rather than from product design, and international vendors consistently underestimate how much it matters. Those regions also contain the fastest growing delivery networks anywhere.
SHIPSY

Risk: Margin Pressure In Core Markets

Operators across these regions run on even thinner margins than Western equivalents and negotiate software pricing accordingly on every renewal. Operating knowledge wins the account and does not command premium pricing from a customer earning three percent. Growth in seat count does not necessarily convert into proportionate revenue growth in those markets.

Players Tracked

Prominent Players

Bringg
Onfleet
Shipsy
FarEye
Locus

Other Key Players

Descartes Systems Group
Manhattan Associates
Oracle Transportation Management
Route4Me
Tookan
Dispatch Science
Onro
Track-POD
GSMtasks
Detrack
LogiNext
WorkWave
OptimoRoute
Nash
Zippykind

Recent Developments

APRIL 2025

Operators Shift Software Spending Toward Courier Supply

Several large delivery operators shifted software investment from route optimisation toward courier supply and marketplace balancing capability, an operational repositioning rather than any corporate transaction. Peak demand periods have sufficient riders available only around 78% of the time, and an order that cannot be accepted is revenue that never existed.
Signal: An order that nobody can accept is revenue which never existed rather than revenue merely delayed.
OCTOBER 2024

Indonesian Urban Delivery Networks Expand Across Secondary Cities

Indonesian delivery operators expanded urban networks into secondary cities alongside smartphone and payment infrastructure growth, capacity development rather than any corporate transaction. Those networks deploy modern delivery management software from the outset rather than migrating from anything older, and start at drop densities that support workable unit economics.
Signal: Networks built entirely new start above the density threshold that the older networks spent years engineering.
JULY 2025

European Regulation Reshapes Courier Marketplace Requirements

European authorities across several countries advanced courier employment status regulation affecting how delivery marketplaces may allocate work, a regulatory development rather than any commercial transaction. Those rules shape marketplace balancing systems directly, since incentive design and shift allocation must operate within constraints that vary considerably between jurisdictions.
Signal: Courier employment rules now constrain how balancing systems are able to allocate work between available riders.

What Delivery Software Costs

Cloud infrastructure and real-time processing absorb roughly 36% of vendor cost of delivery, driven by the continuous location and dispatch traffic these systems carry. Implementation and integration services take around 23%, since every operator's fleet arrangement differs. Product engineering absorbs about 27%, concentrated in marketplace balancing and regional adaptation, and support takes most of the remaining balance.
Cloud infrastructure pricing rose materially through 2023 and 2024 as demand outpaced provider capacity, and vendors on per-delivery pricing absorbed most of that movement rather than repricing operators running on three percent margins. Oracle Annual Report 2024 and Descartes Systems Group Annual Report 2024 both record infrastructure cost as a significant operating variable. Vendors with efficient real-time architectures managed that period considerably better than those built on heavier processing.

The competitive disadvantage mechanism is per-delivery infrastructure cost rather than headline cloud pricing. A vendor whose architecture handles a delivery event cheaply can price against operators earning three percent, while one carrying heavier processing cannot reach that price point at all. Exposure concentrates among vendors built for enterprise logistics volumes rather than for the transaction counts an on-demand network generates every single day.
on-demand-delivery-management-solution-market-cost-volatility-analysis-1789996519637

Engineer Cost Per Delivery Event Downward

Infrastructure absorbs roughly 36% of delivery cost and scales directly with transaction volume rather than with customer count. Architectures handling each delivery event cheaply can price against operators earning three percent net margin, while heavier ones simply cannot reach that price point. The engineering investment sits in real-time efficiency rather than in feature breadth.

Build Regional Variants Rather Than One Product

Address conventions, payment behaviour and courier labour rules differ enough between regions that a single product underperforms local specialists everywhere it operates. Engineering absorbs around 27% of cost, and spending it on genuine regional adaptation rather than universal features reaches markets growing considerably faster. Vendors treating regional difference as configuration rather than product consistently lose to specialists who understood otherwise.

Price On Outcomes Operators Already Measure

Operators running at three percent margin reject software without quarterly payback, and they already track courier fill rate and failed delivery rate closely. Pricing against improvements in numbers they measure themselves removes the credibility problem that efficiency claims always face. Vendors pricing per seat or per vehicle are asking an operator to fund something whose return they cannot verify independently.

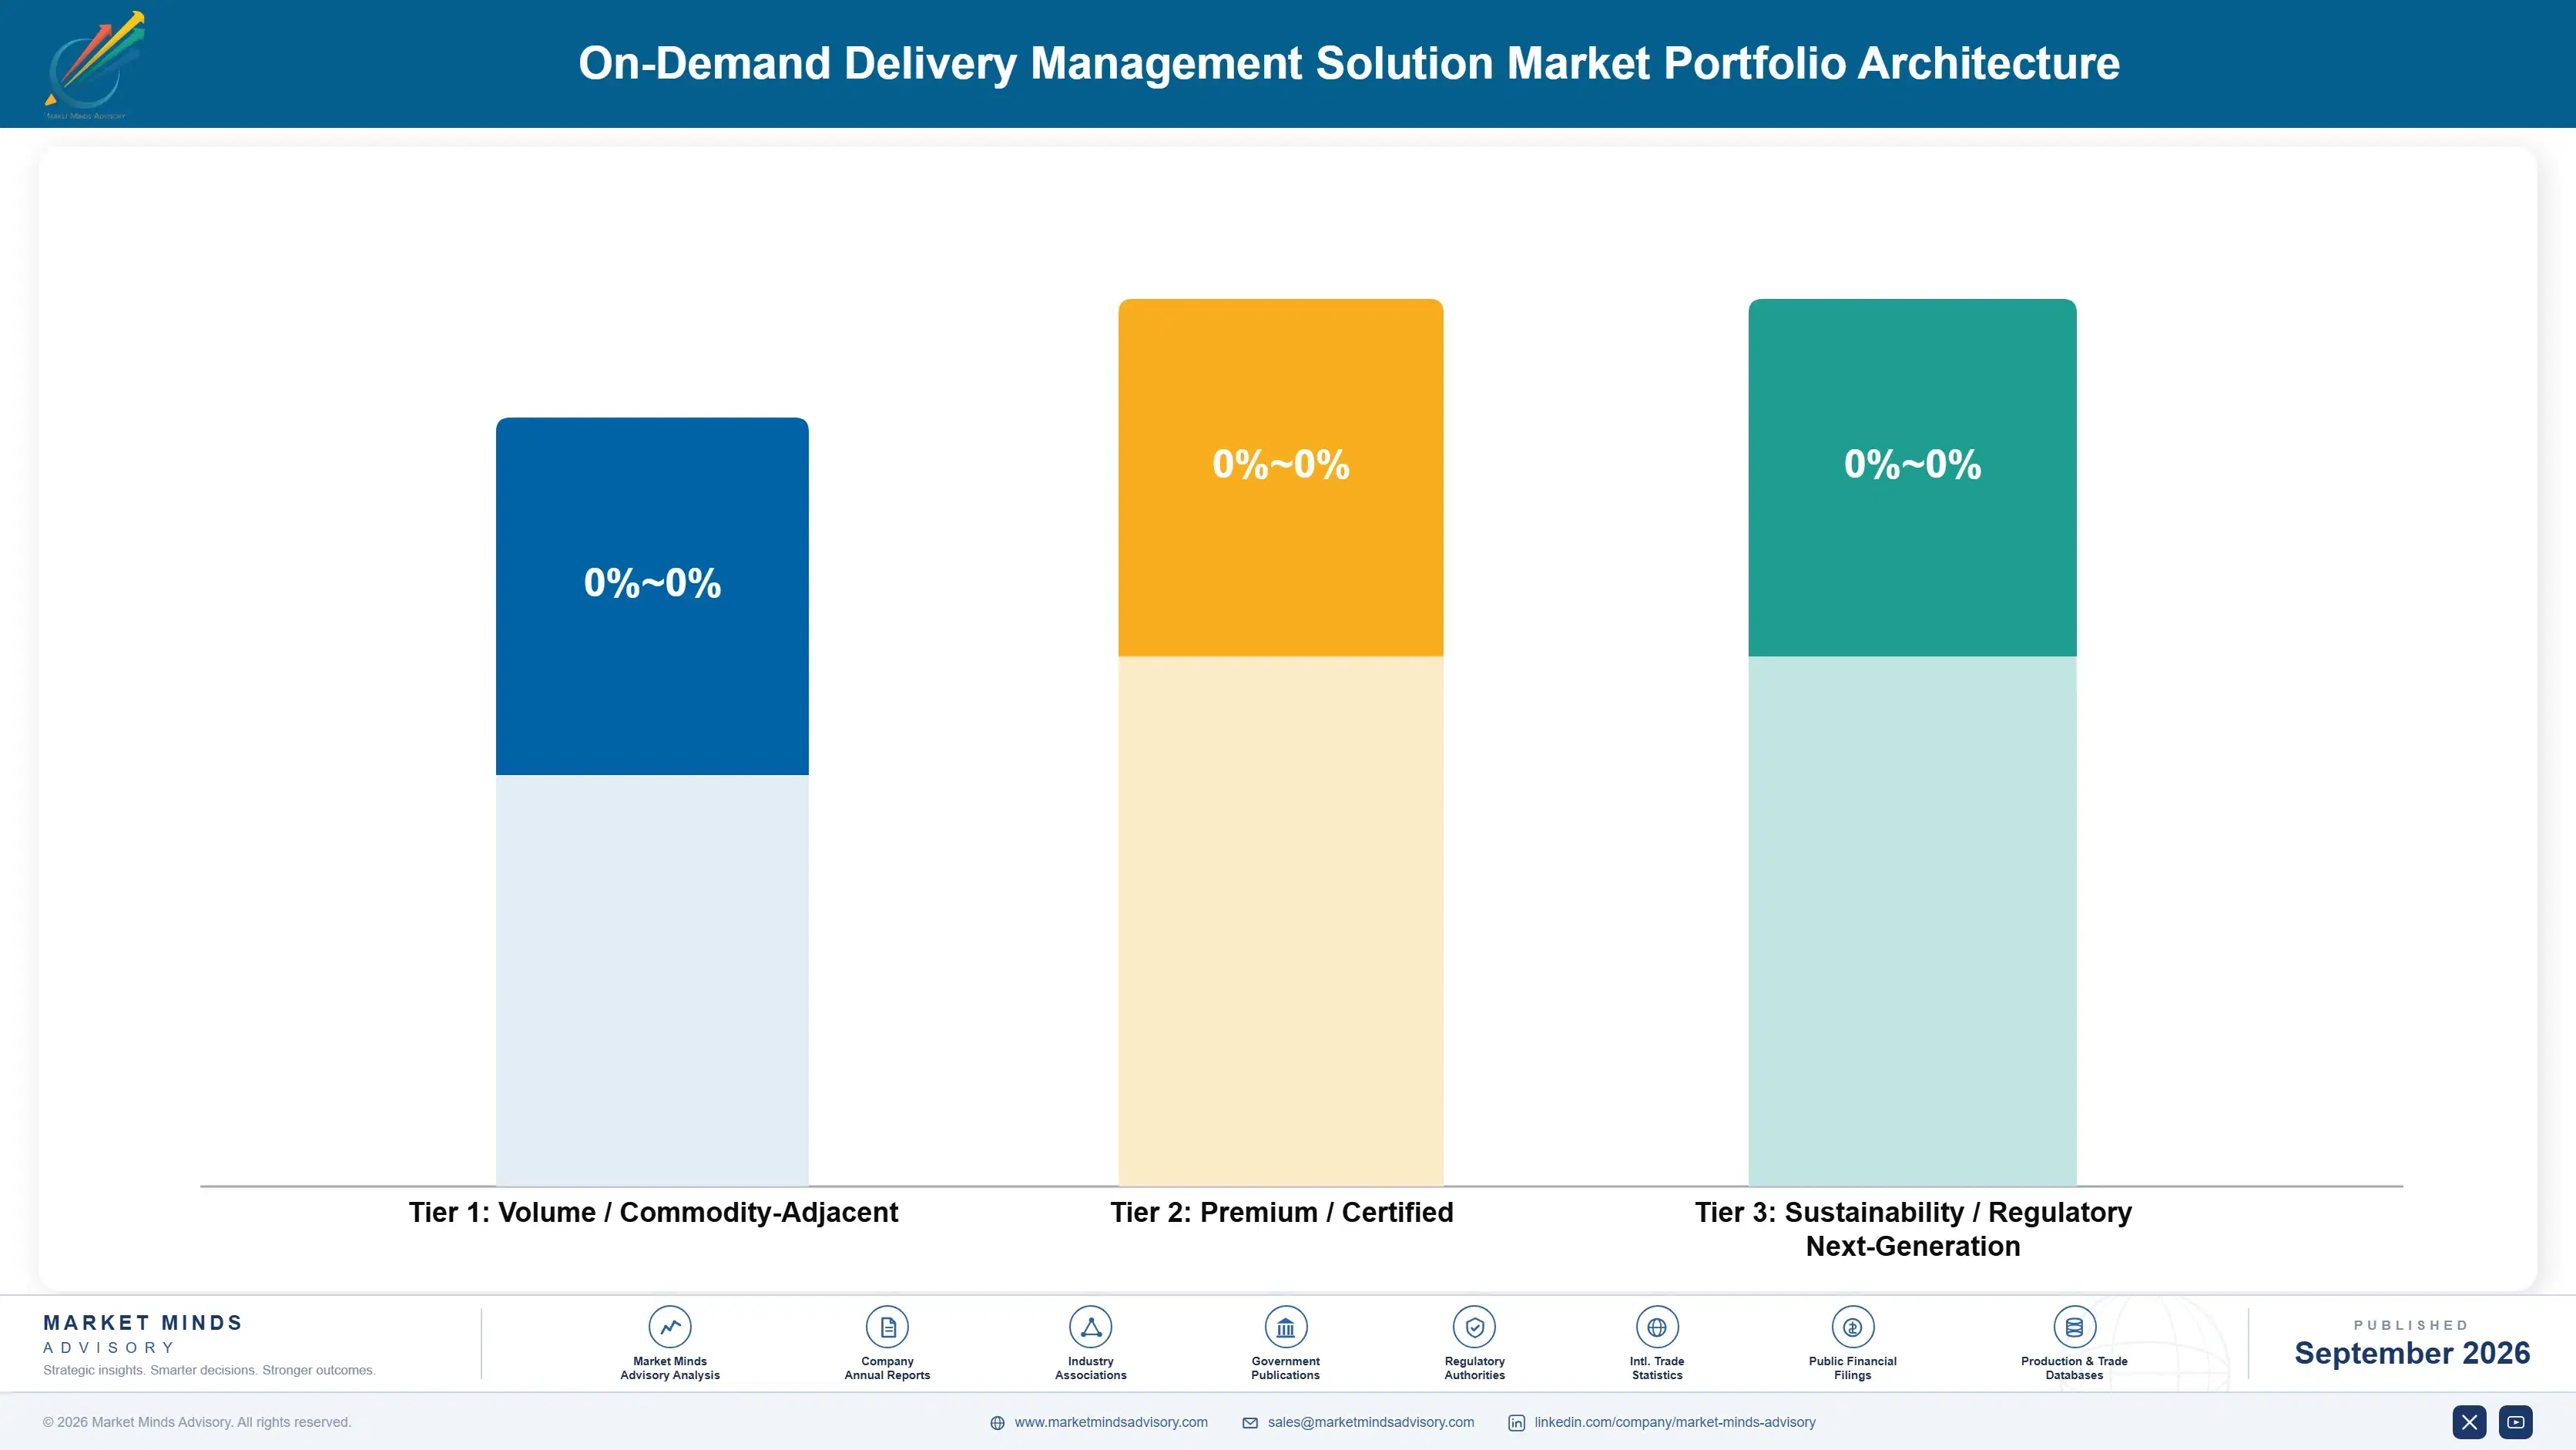
Portfolio Architecture for Margin Defence

Margin architecture separates on whether a function addresses a constraint the operator can quantify. Route optimisation and sequencing tools earn least, since capability is broadly comparable and operators regard it as solved. Customer communication interfaces sit above on integration content. Courier supply balancing, proof of delivery and network analytics earn most, because each addresses something an operator measures and can attribute margin improvement to directly.
The volume versus premium tension runs between the crowded functions and the scarce ones. Routing and tracking are supplied by dozens of vendors and priced accordingly. Marketplace balancing and building intelligence are supplied by very few and priced far better. Vendors investing engineering into routing refinement are improving a function their customers already consider adequate while ignoring where the money actually is.

High-value pools concentrate in courier supply balancing and in the post-stop problem nobody has solved. Balancing requires marketplace design capability that logistics software teams generally lack. Building intelligence requires data nobody has assembled at scale and that no single operator can gather alone. Both are genuinely difficult, which is precisely why they remain valuable while routing has not.

Volume / Commodity-Adjacent

Route optimisation and sequencing tools at standard capability, where dozens of vendors offer broadly comparable function and operators regard the problem as thoroughly solved. The twelve point spread separates vendors with efficient real-time architectures from those carrying heavier processing cost per delivery event.
Gross Margin: 46% to 58%

Premium / Certified

Dynamic dispatch engines and customer communication interfaces, where integration depth and reliability determine selection alongside price across operator types. The twelve point spread tracks how much regional adaptation each vendor genuinely provides against how much it merely configures superficially.
Gross Margin: 62% to 74%

Sustainability / Regulatory / Next-Generation

Courier supply balancing, proof of delivery handling and network analytics platforms, each addressing constraints an operator measures directly and attributes margin improvement to. The twelve point spread reflects marketplace design capability, which logistics software teams have generally not built.
Gross Margin: 76% to 88%
on-demand-delivery-management-solution-market-portfolio-architecture-1789996520136

High-value Sub-segments and Strategic Watch-out

Courier Supply And Marketplace Balancing Systems

Grows at fully 18.9% because rider availability rather than any routing intelligence determines whether an operator can accept an order at all. The twelve point spread here reflects marketplace design capability. Peak demand periods have sufficient couriers available only around 78% of the time anywhere.
Gross Margin: 76% to 88%

Proof Of Delivery And Exception Handling

Grows at fully 13.4% because roughly 6% of all attempts require a second visit costing what the first one did without any additional revenue. The twelve point spread here reflects exception handling depth. Failure rate reduction converts directly into margin at operators earning three percent.
Gross Margin: 76% to 88%

Dynamic Dispatch And Assignment Engines

Grows at fully 12.1% as operators now assign work across mixed fleets of employed, contracted and marketplace couriers all at once. The twelve point spread here reflects mixed fleet integration depth. Employment status regulation across several jurisdictions now constrains how any assignment may actually operate.
Gross Margin: 62% to 74%

Route Optimisation And Sequencing Tools

Grows at only 6.8%, slowest of the six function classes, on capability that dozens of vendors supply and operators regard as thoroughly solved. The twelve point spread here reflects architecture efficiency. It optimises the half of a delivery that was never the expensive part anyway.
Gross Margin: 46% to 58%

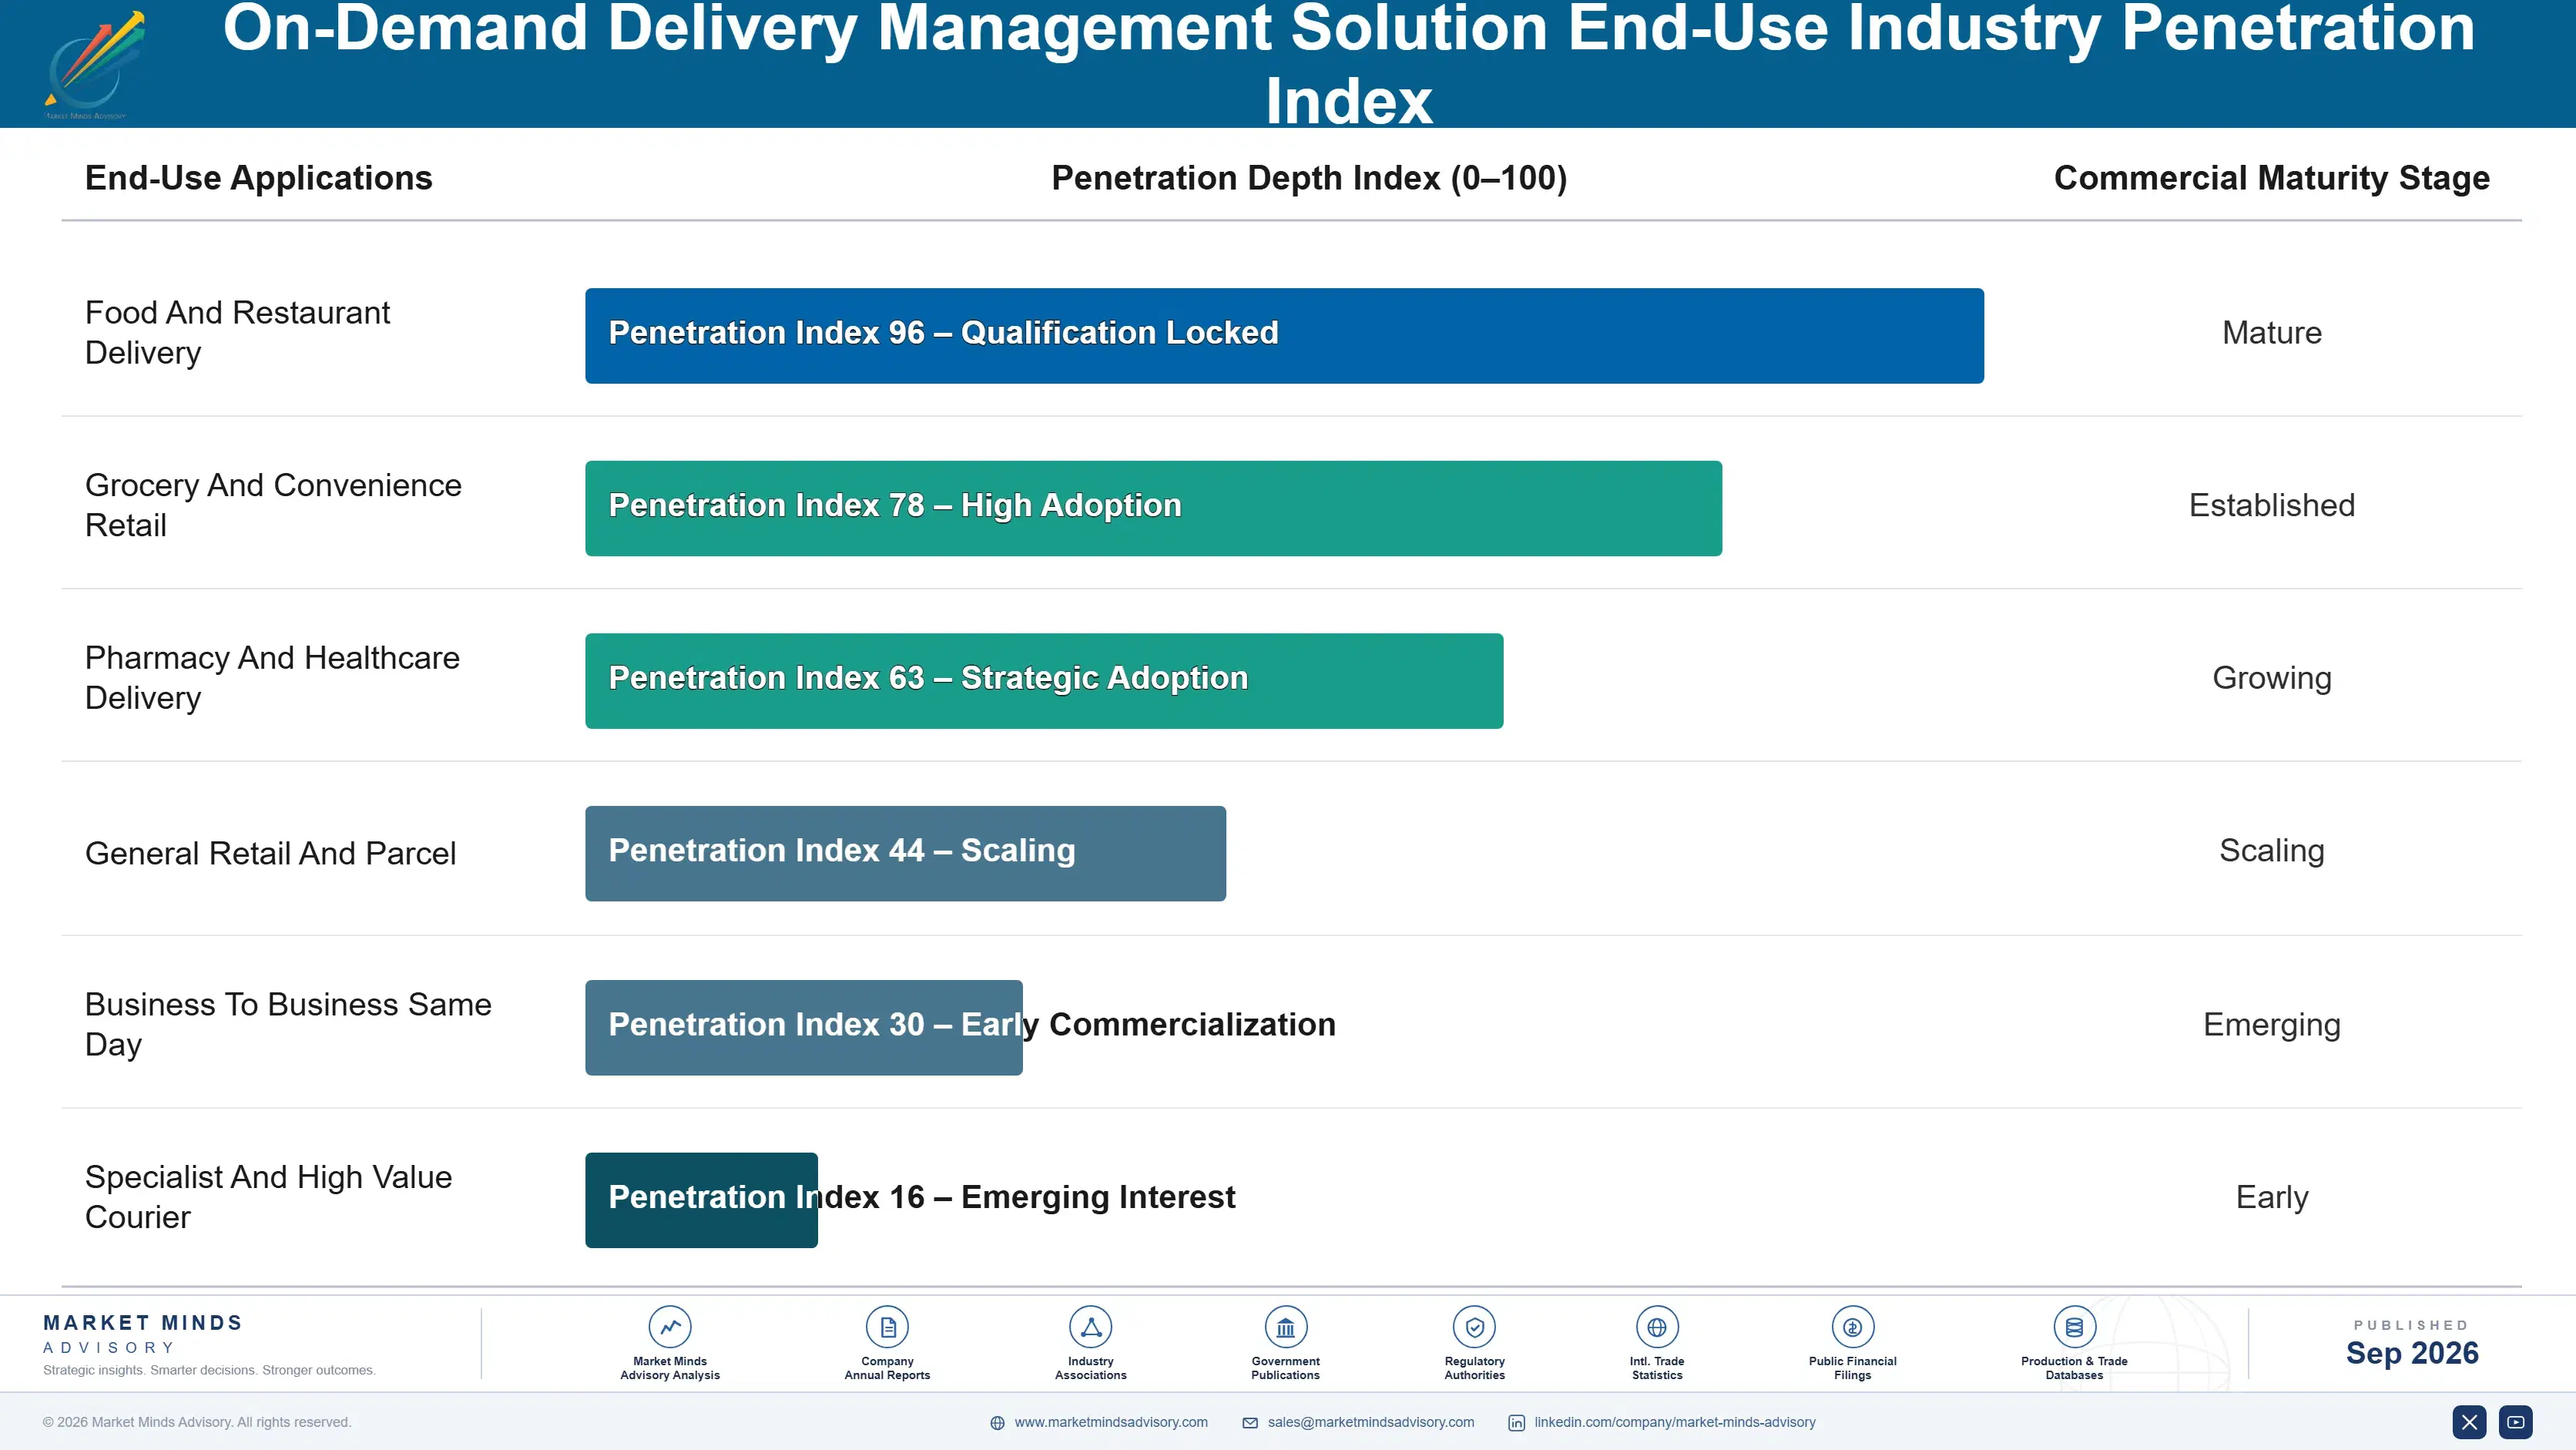
Why Operators Rarely Switch

The annuity here is operational dependency rather than any contract. A delivery management system dispatches work minute by minute, and an operator cannot pause deliveries while it changes platforms any more than a warehouse can stop shipping. Migration means running two systems in parallel through peak periods with couriers who will not tolerate confusion. Operators consequently persist with adequate systems far longer than software quality alone would justify.
Depth varies sharply by function and by how much operator-specific data has accumulated. A marketplace balancing system holding years of courier behaviour and incentive response data is deeply embedded, since that history is what makes the predictions work. A proof of delivery system holding access instructions per address is similarly fixed. Route optimisation is barely embedded at all, and operators swap it without much thought when something cheaper appears.

The buyer sits in operations rather than technology, and evaluates on a three percent margin that shapes every conversation. An operations director assesses courier fill rate and failed delivery rate because those convert into margin. A technology function might appreciate architecture quality and does not hold the budget. Vendors selling technical sophistication to technology teams are addressing somebody who cannot authorise the purchase.
on-demand-delivery-management-solution-market-end-use-penetration-index-1789996520629

What Wins Delivery Accounts

These are among the four positions where our research anticipates prominent divergence between winners and laggards over the coming forecast period. Each is grounded in the demand model, the regulatory perimeter, and the announced capacity pipeline.
01 / COURIER SUPPLY POSITIONING

Sell Fill Rate Before Selling Routing

Peak demand periods have sufficient riders available only around 78% of the time, and an order that an operator simply cannot accept is revenue which never existed at all rather than revenue merely delayed to later. That makes marketplace balancing capability considerably more valuable than any routing intelligence applied to couriers who have not turned up for their shift. Vendors still leading with route optimisation are selling into a problem that operators have largely considered thoroughly solved for years now.
02 / POST-STOP PROBLEM BUILDING

Build For The Final Two Hundred Metres

Around 46% of all delivery minutes are spent after the vehicle has already stopped, finding building entrances, waiting for lifts and locating the correct doors, and almost no software anywhere addresses any part of that at all. Access instructions, building intelligence and recipient availability prediction together are where all of that remaining expensive time actually sits. Vendors competing on route optimisation alone are competing over the half of the problem that everybody in this category has already thoroughly solved between them.
03 / MEASURABLE MARGIN PRICING

Sell Against Numbers Operators Already Track

Roughly 6% of all delivery attempts require a second visit costing approximately what the first one did, while generating no additional revenue whatsoever for the operator who has to make it. At three percent net margin that failure rate consumes a genuinely meaningful share of everything the whole business actually earns in a year. Vendors presenting general efficiency improvements are offering savings that the operator will discount heavily before the meeting has even finished, because nobody involved can verify any of them independently.
04 / NEW NETWORK COVERAGE

Deploy Where Nothing Needs Replacing First

Urban delivery networks right across Southeast Asia and India are being built now rather than migrated from anything older at all, and they deploy modern software from the very outset with no legacy system to displace first. Indonesia compounds at 20.4% annually on exactly that kind of expansion, which continues at genuinely considerable pace. Those operators also start out with drop densities well above the four an hour threshold that Western networks spent years learning to engineer deliberately for themselves.

Engagement Snapshot From the Field

A live engagement with an industry participant carrying material or product regulatory and market exposure ahead of a defining policy shift, showing how our research translates into a defensible multi-year portfolio strategy.
MARKET MINDS ADVISORY · CLIENT ENGAGEMENT SUMMARY
On-Demand Delivery Management Solution Producer Strategic Portfolio Review and Transition Roadmap 2026·Investment Scenario on On-Demand Delivery Management Solution Exposure Evaluation 2025-26
CLIENT PROFILE
A delivery operator running networks across four cities in two countries, having contracted its coverage after the market correction and now attempting to return to growth profitably. Software spending had been cut heavily and the remaining platform handled routing well while offering essentially nothing on courier supply, which was exactly where the operator kept losing orders.
STRATEGIC CHALLENGE
Operations wanted to expand coverage back into neighbourhoods abandoned during the correction. Finance refused on the grounds that those areas had never been profitable. Nobody had measured drop density by neighbourhood or established how many orders were being declined for want of available couriers, and both questions turned out to determine the answer.
MMA APPROACH
MMA measured drop density and courier fill rate by neighbourhood and by time of day across all four cities. We separated orders declined for lack of riders from those lost to competitors, and assessed the incumbent platform and three alternatives specifically on marketplace balancing capability. Work drew on 47 expert interviews conducted in Q4 2025 with operators and software vendors.
KEY FINDINGS
  1. Around 2 in 10 orders during peak periods were declined for want of an available courier rather than lost to any competitor on price or speed.
  2. Only two of the four cities cleared four drops an hour outside the central districts, which explained the earlier profitability problem entirely.
  3. The incumbent platform offered no incentive modelling or shift forecasting capability whatsoever, and none had ever been requested (client-reported, unverified by MMA).
  4. Failed delivery rates ran materially higher in one city because address quality was worse, which no routing improvement would ever have addressed.
CLIENT PROFILE
A delivery operator running networks across four cities in two countries, having contracted its coverage after the market correction and now attempting to return to growth profitably. Software spending had been cut heavily and the remaining platform handled routing well while offering essentially nothing on courier supply, which was exactly where the operator kept losing orders.
STRATEGIC CHALLENGE
Operations wanted to expand coverage back into neighbourhoods abandoned during the correction. Finance refused on the grounds that those areas had never been profitable. Nobody had measured drop density by neighbourhood or established how many orders were being declined for want of available couriers, and both questions turned out to determine the answer.
MMA APPROACH
MMA measured drop density and courier fill rate by neighbourhood and by time of day across all four cities. We separated orders declined for lack of riders from those lost to competitors, and assessed the incumbent platform and three alternatives specifically on marketplace balancing capability. Work drew on 47 expert interviews conducted in Q4 2025 with operators and software vendors.
KEY FINDINGS
  1. Around 2 in 10 orders during peak periods were declined for want of an available courier rather than lost to any competitor on price or speed.
  2. Only two of the four cities cleared four drops an hour outside the central districts, which explained the earlier profitability problem entirely.
  3. The incumbent platform offered no incentive modelling or shift forecasting capability whatsoever, and none had ever been requested (client-reported, unverified by MMA).
  4. Failed delivery rates ran materially higher in one city because address quality was worse, which no routing improvement would ever have addressed.
RECOMMENDED STRATEGY
Phase 1: Phase one: add marketplace balancing capability before expanding coverage, since declined orders in existing areas exceeded the opportunity in abandoned ones. Phase 2: Phase two: expand only into neighbourhoods clearing four drops an hour, rather than restoring the coverage map that had previously failed. Phase 3: Phase three: address the failed delivery problem in the worst city through access data rather than through any further routing work.
OUTCOME
The operator added courier balancing capability and expanded selectively rather than restoring the old coverage map (client-reported, unverified by MMA). Accepted order volume rose measurably without any coverage expansion at all. Density and fill rate are now measured by neighbourhood before any expansion decision, which is the change that outlasted the engagement.

Frequently Asked Questions

Foundational context covering the market sizes, CAGR, scope, country, region and competition that inform every finding below. This section is provided to cover basics and most often pre-purchase conversations, answered from the MMA Primary Research Dataset.

What is the current size of the On-Demand Delivery Management Solution Market?

Global value reaches USD 4.3 billion in 2026, measured as licence and subscription revenue across six function classes. The 2025 base is USD 3.8 billion.

How large will the On-Demand Delivery Management Solution Market be by 2036?

The market reaches USD 14.0 billion by 2036, an increase of USD 9.7 billion across the forecast period. That represents 3.26 times expansion from the 2026 base.

What is the CAGR for the On-Demand Delivery Management Solution Market 2026 to 2036?

The base case runs at 12.6% annually, with a bull case at 13.9% if operator consolidation accelerates and a bear case at 11.4% if more large operators build their own platforms internally.

Which segment is growing fastest?

Courier supply and marketplace balancing systems grow at 18.9%, half again the market rate of 12.6%. Rider availability matters far more than routing them cleverly.

Who are the major companies in the On-Demand Delivery Management Solution Market?

Bringg, Onfleet, Shipsy, FarEye and Locus lead on licence and subscription revenue, together holding 36%. Descartes Systems Group, LogiNext and OptimoRoute all hold smaller positions.

Which country is growing fastest?

Indonesia leads at 20.4%, on urban delivery demand growing alongside smartphone penetration and digital payment infrastructure at once. India and Brazil both follow behind it.

Report Segmentation Architecture

The full report scope spans multiple orthogonal segmentation dimensions, with cross-tabulated demand data provided for each dimension pair. Coverage extends further to regional breakdowns, trend trajectories, and the competitive detail needed to support segment-level decision-making.

By Function Class

  • Courier Supply And Marketplace Balancing Systems
  • Proof Of Delivery And Exception Handling
  • Dynamic Dispatch And Assignment Engines
  • Delivery Analytics And Network Planning Platforms
  • Customer Communication And Tracking Interfaces
  • Route Optimisation And Sequencing Tools

By End-Use Industry

  • Food And Restaurant Delivery
  • Grocery And Convenience Retail
  • Pharmacy And Healthcare Delivery
  • General Retail And Parcel
  • Business To Business Same Day
  • Specialist And High Value Courier

By Commercial Dimension

  • Direct Operator Subscription
  • Retailer Owned Delivery Programmes
  • Third Party Logistics Provider Deployment
  • Marketplace Platform Integration
  • Per Delivery Transaction Pricing
  • Regional Reseller And Partner Channel

By Region

  • North America
  • Western Europe
  • East Asia
  • South Asia and Pacific
  • Latin America
  • Middle East and Africa
  • Eastern Europe

Scope, Methodology, and Coverage

Every figure in this report is reproducible from documented input assumptions. The scope below maps the historical period, the forecast horizon, the segmentation dimensions, and the countries covered, alongside the underlying primary and qualitative methodology.
Historical Period
2020 to 2025
Forecast Period
2026 to 2036
Base Year
2025 (USD billions; MMA Primary Research Dataset, September 2026)
Market Definition
This report covers on-demand delivery management software by function class: courier supply and marketplace balancing systems, dynamic dispatch and assignment engines, route optimisation and sequencing tools, customer communication and tracking interfaces, proof of delivery and exception handling, and delivery analytics and network planning platforms. It excludes warehouse and fulfilment systems, freight transportation management, vehicle telematics hardware, consumer marketplace applications, and payment processing platforms.
Quantitative Units
USD millions, licence and subscription revenue basis; managed deliveries; drops per courier hour; courier fill rate as a percentage; failed delivery rate as a percentage; post-stop time as a share of delivery minutes.
Segmentation Dimensions
Function class; end-use delivery category; commercial purchase and pricing route; geography across seven regions.
Regions Covered
North America, Western Europe, East Asia, South Asia and Pacific, Latin America, Middle East and Africa, Eastern Europe
Countries Covered
China, Japan, South Korea, Indonesia, India, Vietnam, Thailand, Singapore, Australia, United States, Canada, Mexico, Brazil, Colombia, United Kingdom, Germany, France, Spain, Poland, United Arab Emirates.
Key Companies Profiled
Bringg, Onfleet, Shipsy, FarEye, Locus, Descartes Systems Group, Manhattan Associates, Route4Me, Tookan, Track-POD, Detrack, LogiNext, WorkWave, OptimoRoute, Nash.
Quantitative Methodology
Primary survey, n=3,800 respondents, Q4 2025, six countries; demand-side model with trade association cross-validation
Qualitative Methodology
47 expert interviews, Q4 2025; applied to validate demand model assumptions, identify emerging dynamics, and assess competitive positioning
Report Format
PDF and XLSX data workbook (Word format preview document)
Publisher
Market Minds Advisory
Report Code
MMA-2026-TEC-821
Published
September 2026
Contact
sales@marketmindsadvisory.com | www.marketmindsadvisory.com

Purchase the full On-Demand Delivery Management Solution Market Report (2026 to 2036).

This report sizes the global on-demand delivery management software market from 2026 to 2036 across six function classes, six delivery categories and seven regions. It explains why routing software optimises the half of a delivery that was never expensive, quantifying post-stop time at roughly 46% of delivery minutes. Courier fill rate at around 78% during peak periods is analysed as the constraint that actually caps operator revenue. Delivery density below four drops an hour is examined as the threshold where unit economics stop working entirely. Regional analysis explains why East Asia leads at 32% of spending.
Six function classes sized through to 2036
Post-stop delivery time quantified against routing optimisation
Courier fill rate assessed as the binding revenue constraint
Twenty named vendors assessed on subscription revenue
Four revenue levers with quantified commercial impact
Anonymised delivery operator unit economics engagement documented fully

Built For The People Who Decide

From boardroom strategy to bench-side execution, this report is read cover-to-cover by leaders shaping the next decade of their industry, turning demand scenarios, market dynamics and valuation benchmarks into decisions.
CXOs/ Presidents/ VPs/ Managers
M&A and Corporate Development
Strategy Teams and R&D Heads
Procurement and Product Directors
Regulatory and Compliance Leaders
Investor Relations and Equity Analysts