Market Minds Advisory
Olive Phenolic Complexes for Metabolic Health Market

Olive Phenolic Complexes for Metabolic Health Market: Olive Phenolic Complexes for Metabolic Health Market. Health Claim Substantiation and Mill Byproduct Supply Shape Ingredient Economics.

Olive phenolic extracts are moving from niche antioxidants into clinically dosed metabolic health ingredients, yet harvest volatility, mill wastewater supply, and tight European claim rules decide which extractors can standardize potency and earn premium contracts.

Lead Analyst

Published

September 2026

Make Smarter Decisions with Customized Research Insights

Request a free sample report and evaluate market opportunities, growth trends, and competitive dynamics relevant to your business needs.

2025 MARKET VALUE$0.8BMarket Size 2025
2036 FORECAST VALUE$2.5BBase Case , 2026 to 2036
CAGR 2026 TO 203611.0 %Bull 12.3% / Bear 9.7%
INCREMENTAL OPPORTUNITY$1.6BNet 10- year value creation
EXPANSION MULTIPLE2.84x2036 value over 2026 base
Strategic Levers
M&A Pipeline
Regional Outlook
Country Rankings
Competitive Intelligence
Segmental Deep-dive
Call-Us : 91 93563 13602

Executive Snapshot and Market Trajectory.

Olive phenolics have a rare advantage in nutraceuticals: a regulator has already accepted that they protect blood lipids from oxidative damage. That claim opened a pathway for hydroxytyrosol, oleuropein, and related compounds to be sold as measured, standardized ingredients for blood sugar, cholesterol, and vascular health products.
Standardized hydroxytyrosol extracts are growing fastest, supported by clinical trials on glycemic control and blood pressure and by brands that want dose-defined capsules and functional beverages. Western Europe holds the largest share because Spain, Italy, and Greece supply the raw material and the health claim framework, while North America leads spend on finished supplements and East Asia adds premium demand. India and Australia lead growth outside the established Western markets. Raw material supply stays concentrated.
The competitive field mixes Spanish extraction specialists, global botanical houses, and nutrition companies that buy or license actives. Advantage comes from controlled raw material supply, verified potency, and clinical dossiers rather than price. Regulation cuts both ways, because European claim language rewards proven dosage while novel food reviews and labeling rules slow unproven products and favor documented suppliers with audited quality systems. Buyers reward audited quality systems and documented potency.
Market Definition
Olive phenolic complexes for metabolic health comprise standardized extracts and concentrates of hydroxytyrosol, oleuropein, tyrosol, and related olive secoiridoids, derived from olive fruit, leaf, and mill by-products and sold as ingredients for dietary supplements, functional foods, and medical nutrition targeting blood sugar, lipid, and vascular health. The scope excludes olive oil sold as food, cosmetic and topical olive actives, and finished consumer supplements.
Base Year Value
$0.8B in 2025 (MMA Primary Research Dataset, September 2026)
Forecast Period
2026 to 2036, eleven discrete annual values
CAGR
11.0% base case. Bull 12.3%. Bear 9.7%.
Fastest Growth Segment
Hydroxytyrosol-Standardized Extracts: 15.0% CAGR
Fastest Growth Country
India: 14.5% CAGR
Fastest Growth Region
South Asia and Pacific: 13.0% CAGR
Largest Region
Western Europe: 34% of 2025 global value
Market Leaders
Nutrafur, Indena, dsm-firmenich, Kemin Industries, Layn Natural Ingredients. Source: MMA Analysis, company annual reports.
Primary Survey
n=3,800 procurement and R&D decision-makers, Q4 2025, six countries
Methodology
Demand-side build-up, cross-validated against public data, 47 expert interviews

Olive Phenolic Complexes for Metabolic Health Market Forecast Scenarios

olive-phenolic-complexes-for-metabolic-health-mark-size-forecast-scenario-1789752426047
Between 2020 and 2025, the category moved from a small antioxidant niche toward metabolic health, as clinical studies on glucose response, blood pressure, and cholesterol gave brands dosing evidence. Demand accelerated after pandemic-era interest in cardiometabolic prevention, though drought-hit harvests in Spain and Italy in 2022 and 2023 disrupted raw material supply and pushed extract prices up sharply, limiting volume growth in some years.
The base case assumes 11.0% annual growth through 2036, built on three named mechanisms: wider use of hydroxytyrosol in dose-defined supplements backed by clinical trials on glycemic control, expansion of mill wastewater and leaf extraction capacity in Spain, Italy, and Morocco that lowers unit cost, and growing retail acceptance of functional beverages and gummies that carry standardized polyphenol content. Rising metabolic syndrome prevalence keeps the buyer base expanding steadily. Each mechanism reinforces the others.
The bull case, at 12.3%, needs a new or broadened health claim for glycemic control and steady harvests. The bear case, at 9.7%, reflects another drought cycle, regulatory rejection of blood sugar claims, and competition from cheaper green tea, berberine, and grape seed polyphenol ingredients that sell on price in cardiometabolic products. Either scenario keeps the base trajectory broadly intact.

Clinical Dosing and Mill Byproduct Supply Define Extract Value

Olive phenolic complexes are extracted from the fruit, leaves, and wastewater generated during olive oil milling, where most of the polyphenols end up rather than in the oil. That origin matters commercially. Mills produce wastewater as a disposal problem, extractors turn it into a concentrated ingredient, and the cost of raw material stays low, but recovery per tonne is small and standardization requires careful process control.
MARKET CONCENTRATION41% CR5Top five suppliers hold a substantial combined ingredient share
STANDARDIZED EXTRACT PRICE$310 per kgHigh-potency hydroxytyrosol sells far above crude olive extracts
TOP PRODUCING COUNTRY44% shareSpain supplies nearly half of world extract raw material
TYPICAL CLINICAL DOSE15 mgStudies use small daily doses of hydroxytyrosol equivalents
RAW MATERIAL COST SHARE38% of COGSOlive leaf and mill water dominate extraction production cost
EXTRACTION YIELD0.4%Very little active compound is recovered per tonne processed
Metabolic health is the growth engine. Clinical studies link hydroxytyrosol and oleuropein to lower post-meal glucose, improved lipid profiles, and better arterial function, and brands are building capsules, powders, and beverages around defined doses. Buyers ask for verified content by HPLC testing, low pesticide residue, and traceable origin, and suppliers that provide clinical dossiers can charge several times the price of general olive extracts.
The market is still narrow and specialist. A handful of Spanish and Italian extractors control most supply, global botanical houses add formulation and distribution, and supplement brands hold consumer relationships. Harvest variation, patent positions on extraction methods, and claim rules across Europe, the United States, and Asia shape who can grow, and mid-sized suppliers increasingly form alliances with mills to secure raw material.
"Olive mills have been paying to dispose of the most valuable part of the fruit. The winners in this market will be the extractors who turned that waste stream into a dose-verified ingredient and then proved it works."
Practice Lead, Nutraceutical Ingredients and Functional Nutrition Practice · MMA Nutraceutical Ingredients and Functional Nutrition Practice · September 2026

Market Trends

Clinical Trials Shift Olive Phenolics Toward Glucose and Lipid Claims

Clinical trials on hydroxytyrosol and oleuropein are moving beyond antioxidant markers toward glucose response, blood pressure, and lipid outcomes, giving brands the evidence needed for dose-defined products. Studies in Spain, Italy, and Australia have used daily doses between 5 and 30 milligrams, and supplement makers now design capsules and powders around those ranges. Suppliers that fund trials and publish dossiers gain pricing power, and buyers increasingly demand batch-level potency verification before signing annual supply contracts. Brands also use trial results in retailer negotiations, which shortens listing cycles and supports higher shelf prices for products that carry defined doses.
Market Impact: claim requires 5 mg per 20g

Mill Wastewater Extraction Plants Scale Across the Mediterranean Basin

Extractors are building plants that process olive mill wastewater and leaves at industrial scale, using membrane filtration, adsorption resins, and spray drying to make standardized powders. Spain, Italy, Greece, and Morocco host most new capacity, and mills sign long agreements to supply wastewater at low cost. Better recovery cuts unit cost, reduces environmental disposal burdens for mills, and supports sustainability claims that retail brands value in premium metabolic health products. Plants typically cost between $8 million and $15 million, and operators favor sites near clusters of mills so that wastewater does not need long transport before treatment begins.
Market Impact: 1 in 4 adults affected

Market Opportunities and Growth Drivers

EU Health Claim Sets Dose Benchmark for Olive Polyphenols

European Union Regulation 432/2012 permits a claim that olive oil polyphenols contribute to protecting blood lipids from oxidative stress, provided a product delivers at least 5 milligrams of hydroxytyrosol and derivatives per 20 grams of oil. That authorized wording gives ingredient suppliers a compliance benchmark, and brands use it to justify standardized doses in supplements and fortified foods, which supports recurring demand from regulated European markets and reference pricing in other regions. Retail brands in Germany and Spain already follow that threshold, and export markets increasingly copy the wording in their own product specifications.
Market Impact: Spanish harvests fell over 50%

Rising Metabolic Syndrome Prevalence Expands Preventive Supplement Buyers

Metabolic syndrome affects roughly one in four adults worldwide according to WHO estimates, and demand for preventive nutrition products is rising as health systems struggle with diabetes and cardiovascular costs. Consumers increasingly prefer plant-derived actives with clinical support over synthetic options, and physicians recommend food-based supplements alongside lifestyle changes. Brands that position olive phenolics for glucose and vascular health reach a growing buyer group that already spends on cardiometabolic supplements each month. Insurers and employers are also funding preventive nutrition programs, which widens distribution beyond pharmacies and specialty retail, and gives suppliers new volume channels.
Market Impact: roughly 70% botanical claims rejected

Market Restraints and Challenges

Drought-Driven Harvest Swings Disrupt Olive Raw Material Supply

Olive harvests swing sharply with weather, and drought cut Spanish production by more than 50% in some recent seasons, according to International Olive Council data. The root cause is climate stress on largely rain-fed groves. Lower harvests reduce mill wastewater and leaf supply, raising extract prices and delaying orders. Extractors respond by signing multi-year mill contracts, diversifying into Italy, Greece, and Morocco, and building storage for concentrated intermediates. Spot prices for leaf and wastewater rose 40% or more during shortages, and smaller extractors without contracts sometimes stopped production for weeks, losing customers to larger rivals.
Market Impact: trial doses span 5-30 mg

Restrictive Health Claim Approval Limits Marketing of Blood Sugar Benefits

Health claim approval remains restrictive, and authorities in Europe and elsewhere have rejected many botanical claims for lack of human evidence. The root cause is the high evidentiary bar and small trial sizes, which make results hard to replicate. Brands cannot advertise blood sugar benefits without approval, which slows retail conversion. Suppliers are funding larger randomized trials and pursuing structure-function claims in the United States to bridge the gap. Approval timelines run several years, and rejected dossiers rarely earn a second review without new trials, so capital committed to research can stay idle while competitors sell products without claims.
Market Impact: new capacity adds 20% supply
3 additional market trends, 4 additional growth drivers, and 3 additional restraints and challenges are covered in the full report. Contact sales@marketmindsadvisory.com to access the complete intelligence.

Segment CAGR and Growth Architecture

Olive phenolic complexes are segmented by extract composition, because active compound profile, standardization level, and source material determine potency, clinical evidence, and price more directly than product form does. Hydroxytyrosol-standardized extracts are attracting the most investment as brands seek dose-verified ingredients that match authorized claim language and published clinical trial protocols. Purity is the key differentiator.
olive-phenolic-complexes-for-metabolic-health-mark-market-share-analysis-1789752426221

Hydroxytyrosol-Standardized Extracts

Hydroxytyrosol-standardized extracts are the fastest-growing segment, covering concentrates and powders where hydroxytyrosol and its precursors are specified at fixed percentages, typically between 10% and 40%, and verified by chromatography. Buyers pay premiums because dose control supports the European claim and clinical protocols, and they can compare batches across suppliers. Extractors use acid or enzymatic hydrolysis to convert oleuropein into hydroxytyrosol, and those with proprietary processes hold patents that limit direct competition. Demand is strongest from supplement brands targeting glycemic and cardiovascular health. Pricing follows purity, and grades above 30% earn several times the price of basic olive extracts, while long-term contracts with supplement brands give producers visibility for capacity planning and justify investment in higher recovery equipment.
CAGR 15.0%

Oleuropein Leaf Extracts

Oleuropein leaf extracts are the second-fastest segment, made from olive leaves that are abundant, cheap, and available outside the milling season. Standardized to 15% to 40% oleuropein, they appeal to blood pressure and immune formulas and sell at lower prices than hydroxytyrosol grades. Leaf sourcing is less tied to oil harvests, so supply is steadier, though bitter taste limits use in beverages and gummies. Producers in Italy, Turkey, and Tunisia compete on price and consistent potency across multiple shipments each year. Demand comes mainly from European and North American supplement brands, and steady leaf supply lets producers offer fixed pricing for a full year, which many buyers value. Sales are growing fastest in blended formulas that pair oleuropein with chromium.
CAGR 12.5%
Full segment breakdown across 6 segments available in the complete report.

Regional Architecture and Country Demand Map

Value follows olive geography and regulatory clarity. Western Europe leads because raw material, extraction capacity, and the only authorized claim sit there, while North America dominates finished supplement spend, and India and Australia are the fastest-growing consumer markets in Asia Pacific. Asian demand is still emerging.

North America

North America holds 26% share, driven by the United States, where dietary supplement brands, direct-to-consumer subscription businesses, and physician-led metabolic health programs create the largest finished-product demand. Structure-function rules let brands describe glucose and vascular support without preapproval, though the FDA requires substantiation, so clinical dossiers carry value. Suppliers benefit from strong online retail, while extract imports from Spain and Italy expose buyers to freight cost and harvest swings. Canada adds steady demand through natural health product licensing. Insurers and employers are starting to fund preventive nutrition, and contract manufacturers in the Midwest offer formulation support that shortens launch times for new brands. Retail chains also ask for third-party testing certificates on every supplied lot.
Share: 26% | CAGR: 11.5% (2026 to 2036)

Western Europe

Western Europe holds 34% share, above its usual band, because Spain, Italy, and Greece supply most raw material and extraction capacity, and because the region hosts the only authorized olive polyphenol health claim. Value sits where mills, extractors, and claim-driven brands meet, so the region leads by geography and regulation, not only consumption. Germany, France, and the United Kingdom add supplement demand, and pharmacies favor documented dosages that fit the claim wording. Spanish mills and extractors operate close together, which keeps logistics cost low and supports fast sampling for buyers. The Mediterranean diet has strong consumer recognition, so brands market olive products with less education spending, and pharmacies in Germany and France stock dose-labeled capsules.
Share: 34% | CAGR: 9.5% (2026 to 2036)
Regional intelligence for 5 additional markets available in the complete report: East Asia, South Asia and Pacific, Latin America, Middle East and Africa, Eastern Europe. Contact sales@marketmindsadvisory.com.
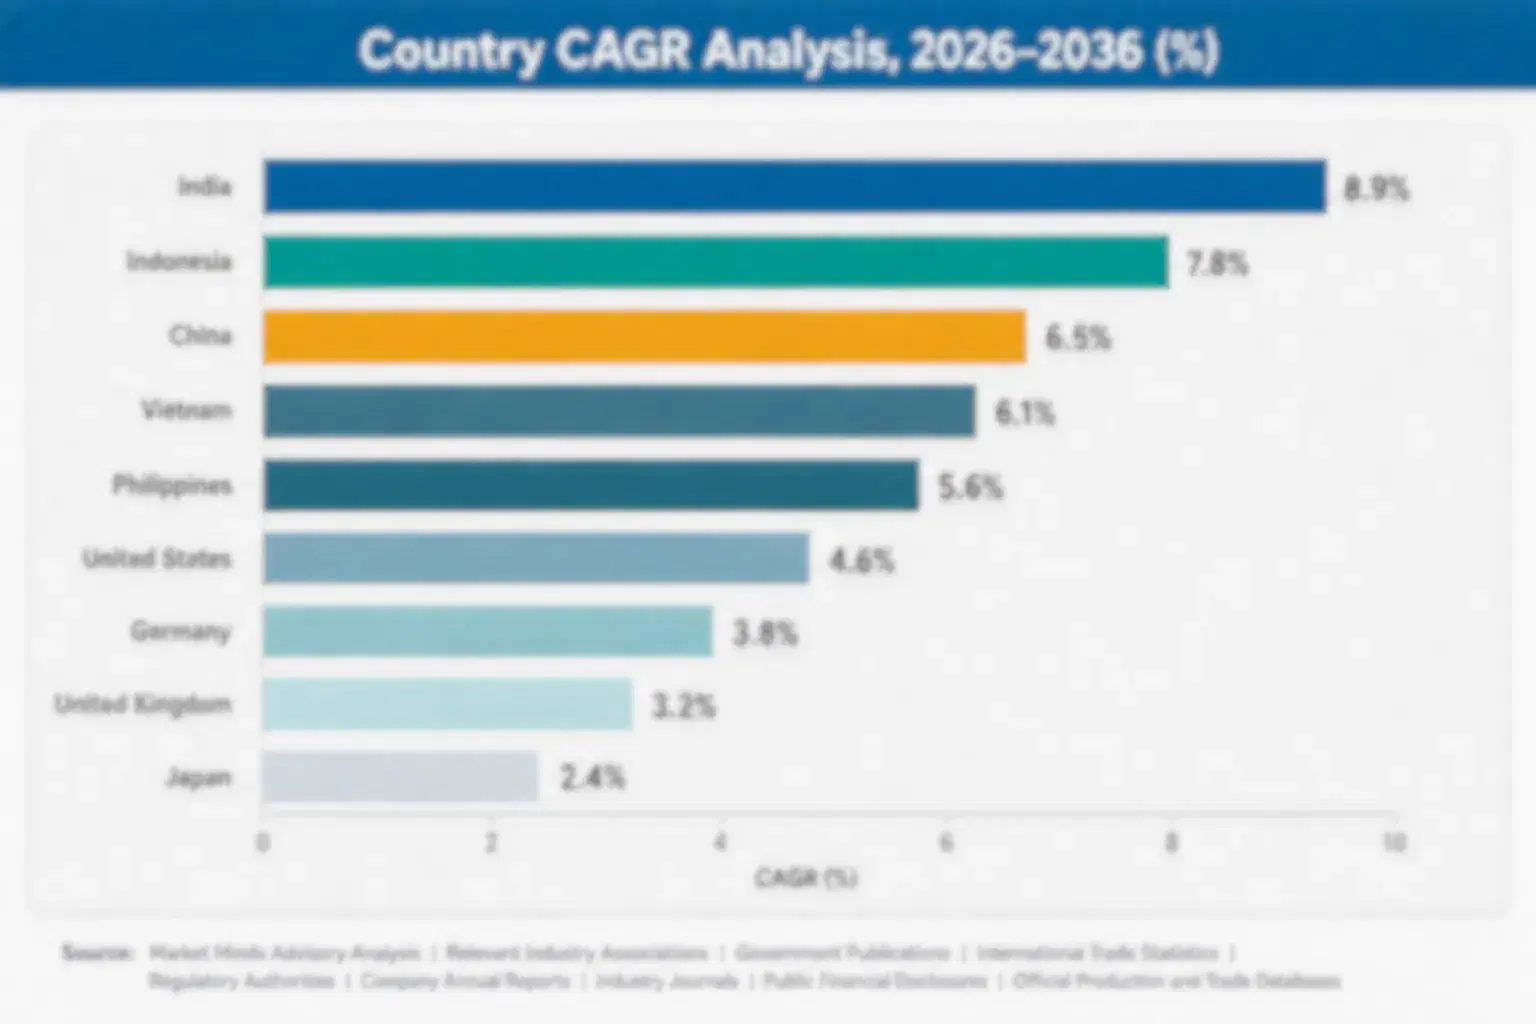
olive-phenolic-complexes-for-metabolic-health-mark-country-cagr-analysis-1789752426399

Four Profit Levers for Olive Phenolic Suppliers

Margin in olive phenolics comes from turning a low-cost mill by-product into standardized, clinically supported actives rather than selling crude olive extract on price. Suppliers that lock in raw material, raise hydroxytyrosol purity, fund human trials, and move into finished dose formats capture far more value per kilogram than commodity extractors. Each route needs different capital.

Raising Hydroxytyrosol Purity Through Proprietary Extraction Processes

Moving from 10% to 40% hydroxytyrosol standardization can lift selling price by 3 to 4 times per kilogram, because supplement brands need concentrated actives to fit capsules and gummies at clinical doses. Suppliers with membrane, resin, and hydrolysis expertise achieve higher yield, and patents deter imitation. Capital cost is significant, but purity premiums repay investment within three to four years for plants that run near capacity. Larger plants also report lower cost per kilogram at higher volumes, which lets the leading extractors defend prices against imports while still funding new capacity and quality testing every year.
Market Impact: higher purity lifts price 3 to 4 times

Funding Human Trials to Support Dose-Specific Product Claims

A randomized trial costs between $400,000 and $900,000 but lets suppliers charge 25% to 40% more per kilogram and win exclusive positioning with premium brands. Published dossiers help brands defend structure-function claims in the United States and negotiate with European regulators. Suppliers that co-fund studies with universities or clinics also gain marketing content, and results often lead to multi-year supply agreements. Contracts of three years or more are common, and brands often share formulation data to speed approval, which lowers commercial risk. Trial results also support entry into Japan and Korea, where evidence-based ingredients earn faster approval.
Market Impact: trial-backed grades earn 25% to 40% premiums per kilogram

Locking In Mill Contracts to Stabilize Raw Material Costs

Long agreements with olive mills for wastewater and leaf supply reduce exposure to harvest swings that can double spot prices in drought years. Extractors that secure three to five year contracts across Spain, Italy, and Morocco protect roughly 8% to 12% of gross margin during shortages. Some mills accept revenue sharing, which aligns incentives and encourages investment in on-site pre-concentration equipment that improves recovery. Suppliers also negotiate quality clauses on polyphenol content, so mills that deliver consistent wastewater earn priority, and extractors gain forward visibility that helps them quote annual prices to brands with confidence.
Market Impact: contracts protect 8% to 12% of gross margin

Moving Into Finished Dose Formats With Brand Partners

Supplying encapsulated or gummy-ready blends, rather than raw extract, lets suppliers keep 15% to 20% more margin and shorten customer development time. Brands lacking formulation skill value ready-to-fill blends with stability data. Suppliers must invest in stability testing, taste masking, and packaging, and they need quality systems that support contract manufacturing. The step also builds customer loyalty through shared product development. Ready blends also reduce customer inventory of separate actives, and suppliers report order sizes rising by roughly 30% once a brand adopts a finished format, because reorders become simpler and more frequent throughout the year.
Market Impact: finished formats add 15% to 20% margin for suppliers

Who Controls the Margin Pool

Olive phenolic supply is moderately concentrated, with the top five suppliers holding about 41% of global revenue, the basis used throughout this section. Nutrafur, Indena, dsm-firmenich, Kemin Industries, and Layn Natural Ingredients lead through standardized extracts, clinical dossiers, and distribution, while a long tail of Spanish, Italian, and Indian extractors supplies mid-grade material. The gap between leaders and challengers is wide.
Competition centers on three dimensions: verified hydroxytyrosol purity and batch consistency, secure access to mill wastewater and leaf supply, and clinical evidence that supports dose-specific claims. Leaders sign annual contracts with supplement brands and fund human trials, while challengers compete on price and flexible minimum orders. Patent positions on extraction routes and stability data on gummies and beverages create additional differentiation.

Emerging pressure comes from Indian and Chinese extractors offering cheaper leaf grades, from botanical houses acquiring Spanish specialists, and from food companies seeking direct mill partnerships. Rankings are likely to shift where suppliers gain claim-supporting trial data or lose raw material access in drought years. Acquisitions of extraction plants and licensing deals for patented processes will reorder positions faster than organic capacity growth.
olive-phenolic-complexes-for-metabolic-health-mark-company-positioning-matrix-1789752426580

Competitive Moat and Risk Dimensions

NUTRAFUR

Moat: Spanish Mill Access and Expertise

Nutrafur sits close to Spanish olive mills and has decades of experience turning wastewater and leaf material into standardized polyphenol extracts, giving it raw material access, process know-how, and regulatory familiarity with the European claim. Long relationships with supplement brands and published stability data help it keep contracts even when cheaper extracts appear from other regions.
NUTRAFUR

Risk: Harvest Concentration Raises Supply Risk

Nutrafur's dependence on Spanish supply means drought years can cut raw material access and lift costs sharply, and diversification across other countries takes time. Larger botanical groups can source from several regions, and buyers seeking multi-origin security may split orders, leaving Nutrafur exposed to volume loss during shortages.
DSM-FIRMENICH

Moat: Global Formulation and Distribution Scale

dsm-firmenich combines nutrition science, formulation capability, and global distribution to supply brands with tested ingredient systems rather than raw extract. Its regulatory teams support claims across regions, and its scale allows investment in clinical trials that smaller extractors cannot afford. Customers value single-source supply across vitamins, lipids, and botanical actives in one qualified relationship.
DSM-FIRMENICH

Risk: Portfolio Breadth Dilutes Olive Focus

Olive phenolics are a small line inside a broad nutrition portfolio, so they compete for capital and attention with larger categories. Specialist extractors can move faster on new grades and offer more flexible minimum orders, and dsm-firmenich must rely partly on outside raw material suppliers whose quality it cannot fully control.

Players Tracked

Prominent Players

Nutrafur
Indena
dsm-firmenich
Kemin Industries
Layn Natural Ingredients

Other Key Players

Genosa
Oliphenolia
Sabinsa Corporation
Martin Bauer Group
Euromed
Monteloeder
Natac Group
Naturex
Provital Group
Bioiberica
Lonza
Glanbia Nutritionals
Kerry Group
Cargill
Archer Daniels Midland

Recent Developments

FEBRUARY 2026

Nutrafur Expands Hydroxytyrosol Concentrate Capacity in Andalusia

Nutrafur completed an organic capacity expansion at its Spanish plant, adding membrane filtration and resin adsorption lines to produce higher-purity hydroxytyrosol concentrates. The project is internal capital spending, not an acquisition. It increases output for supplement customers, improves recovery from mill wastewater, and reduces reliance on outside contract processors.
Signal: Shows leading extractors investing in purity and capacity to serve dose-defined supplement demand across major markets.
NOVEMBER 2025

dsm-firmenich Signs Olive Polyphenol Supply Agreement With Brand Partner

dsm-firmenich signed a multi-year supply agreement with a European supplement brand for standardized olive polyphenol ingredients. The deal is a commercial contract, not an equity stake. It fixes volumes and potency specifications, provides the brand with regulatory support, and gives dsm-firmenich predictable demand for its sourced olive extract.
Signal: Confirms multi-year supply contracts are becoming standard for clinically positioned olive phenolic ingredients sold to European brands.
MAY 2026

Indena Acquires Italian Olive Leaf Extraction Business

Indena completed the acquisition of an Italian olive leaf extraction business with standardized oleuropein grades and certified organic supply. The purchase adds leaf sourcing outside the oil milling season, and gives Indena access to Italian supplement customers. Management said the plant will follow Indena quality systems.
Signal: Reflects botanical houses buying regional extractors to secure raw material and broaden metabolic health portfolios steadily.

Where Olive Extract Costs Come From

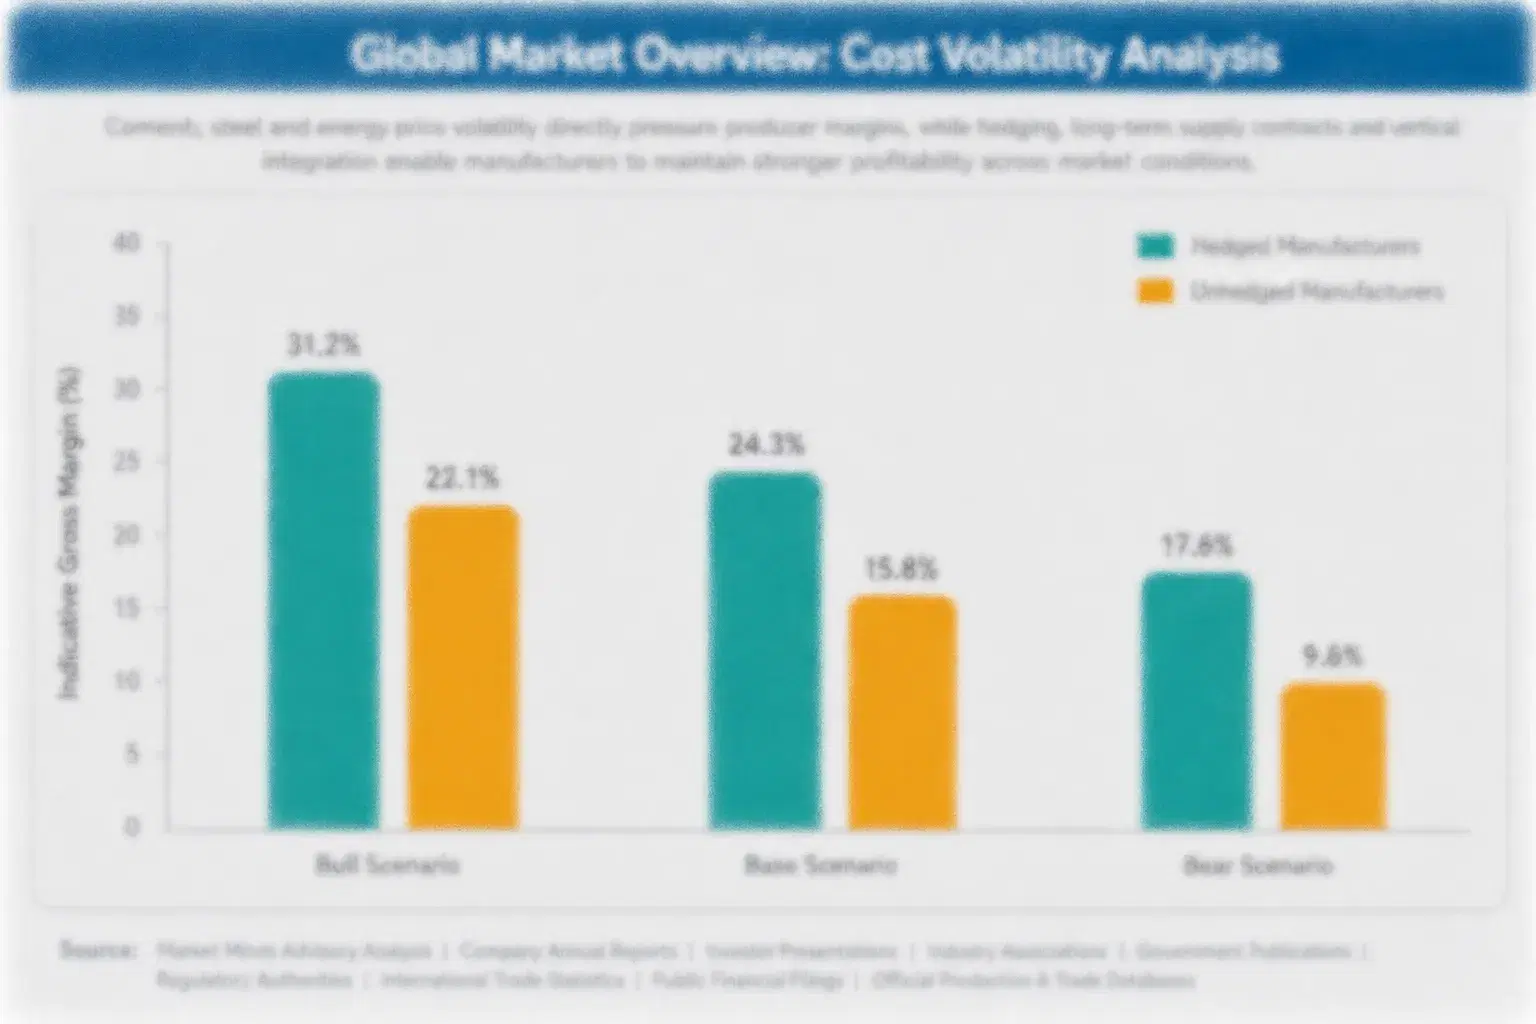
Raw material accounts for roughly 38% of cost of goods, with olive leaves and mill wastewater sourced mainly from Spain, Italy, Greece, and Tunisia. Solvents, resins, membranes, and drying energy contribute a further 30%, and testing, packaging, and labor make up the rest, so extraction efficiency and harvest volumes largely determine unit cost and gross margin. Supply is concentrated in southern Europe.
The International Olive Council reported that Spanish olive oil output fell sharply in the 2022 and 2023 seasons because of drought, and the European Commission tracked price rises that fed through to olive by-product costs. Extractors reported spot leaf and wastewater prices rising 40% or more, forcing surcharges on supplement customers and delaying orders until new harvest material became available and contract volumes were confirmed.

Exposure varies by supplier. Extractors with mill contracts and multi-country sourcing absorb drought better than firms buying spot material from brokers, and large botanical houses can pass costs through by contract. Spanish specialists face the sharpest swings, while Indian and Chinese leaf processors compete on lower input cost but carry quality and traceability risks that premium buyers penalize. Buyers seldom accept surcharges without proof.
olive-phenolic-complexes-for-metabolic-health-mark-cost-volatility-analysis-1789752426765

Signing Multi-Year Mill and Leaf Supply Contracts

Extractors negotiate three to five year agreements with mills and leaf aggregators, fixing price bands and volumes across Spain, Italy, and Morocco. Contracts reduce spot exposure and improve production planning, though they lock in costs when harvests are strong. Mills also gain predictable revenue from wastewater they would otherwise pay to dispose of. Both sides plan capacity with confidence.

Diversifying Sourcing Across Countries and Harvest Calendars

Sourcing from both Northern and Southern Hemisphere olive regions, and from leaf and wastewater streams, smooths supply through weather shocks. Suppliers in Australia, Chile, and Tunisia offer counter-seasonal material, though each origin needs separate quality validation. Multi-origin sourcing raises testing costs, but it protects customer commitments during drought seasons and improves negotiating leverage with regional mills.

Investing in Higher-Recovery Extraction Technology

Membrane filtration, improved resins, and enzymatic hydrolysis raise yield per tonne of raw material, reducing the cost impact of expensive harvest years. Gains of 10% to 20% in recovery are common with new equipment. Capital cost is meaningful, but suppliers also gain higher purity grades that command better prices and support premium customer contracts.

Portfolio Architecture for Margin Defence

Margins run from thin returns on crude olive extracts to strong profits on standardized, clinically supported hydroxytyrosol grades, with gross margin widening several-fold between the bottom and top tiers. Purity, patent protection, and trial evidence add pricing power over what starts as the same mill by-product, and buyers pay for reliability because supplement brands cannot afford failed potency tests or claim disputes.
Volume and premium pull in different directions. Crude and low-standardization extracts sell in large lots to price-sensitive buyers, but they earn modest margins and face competition from cheaper botanical polyphenols. Clinically backed grades sell in smaller lots at much higher margins yet need extraction investment, trial funding, and audited quality systems, so suppliers must choose how much capital to commit to premium positioning.

High-value pools concentrate in hydroxytyrosol grades above 30% purity for glycemic and vascular health, finished dose blends with stability data, and organic or traceable extracts for premium European and North American brands. These segments benefit from documented evidence, recurring orders, and limited competition from small extractors. Suppliers combining raw material security, purity, and clinical dossiers hold advantages that are difficult to replicate quickly.

Volume / Commodity-Adjacent Tier

Crude olive leaf and fruit extracts with low standardization, sold on price to supplement and food makers through distributors, with thin margins, spot pricing, and exposure to harvest swings and competing botanical polyphenols worldwide.
Gross Margin: 18%-28%

Premium / Certified Tier

Standardized hydroxytyrosol and oleuropein extracts verified by chromatography, with organic or quality certification, sold under annual contracts to brands that require documented potency, traceable origin, and regulatory support and batch testing records.
Gross Margin: 35%-48%

Sustainability / Regulatory / Next-Generation Tier

Trial-backed hydroxytyrosol grades, finished dose blends, and patented extracts positioned for authorized claims, low-waste sourcing, and next-generation glycemic health formulations, with proprietary process protection and extensive supporting dossiers, plus stability data for beverages.
Gross Margin: 45%-60%
olive-phenolic-complexes-for-metabolic-health-mark-portfolio-architecture-1789752426955

High-value Sub-segments and Strategic Watch-out

Hydroxytyrosol-Standardized Extracts

Hydroxytyrosol-standardized extracts combine the fastest growth with strong pricing, as brands seek dose-verified actives for glucose and vascular products. Patents, purity, and trial dossiers protect margins, though capital needs are high, and suppliers must keep raw material access steady across drought seasons to honor annual supply contracts.
Gross Margin: 45%-60%

Oleuropein Leaf Extracts

Oleuropein leaf extracts offer solid growth and attractive margins, because leaves are abundant, available year-round, and less tied to oil harvests. They serve blood pressure and immune formulas, though bitterness limits beverage use, and price competition from Turkish, Tunisian, and Indian suppliers keeps upward pressure on volume rather than margin.
Gross Margin: 35%-48%

Whole Olive Polyphenol Powders

Whole olive polyphenol powders form the volume core of the category, moving the largest tonnage to supplement and functional food makers at moderate prices. Margins are exposed to harvest swings and buyer negotiation, so returns depend on extraction efficiency, contract discipline, and steady quality rather than differentiation.
Gross Margin: 25%-35%

Competing Botanical Polyphenols

Green tea, grape seed, and berberine ingredients form the main strategic watch-out, since they target the same glycemic and cardiometabolic buyers at lower cost and with established supply. If trial evidence for olive phenolics weakens or claims stall, brands may switch, slowing premium grades and pressuring supplier pricing broadly.
Gross Margin: n/a (substitution risk)

Why Brands Keep Olive Suppliers

Olive phenolic demand behaves like an annuity once a supplement brand builds a product around a specific extract. Clinical dose, potency, and taste profile are tied to one supplier's ingredient, so switching means new stability studies, label changes, and possible loss of claim support. Annual agreements reinforce repeat orders, and brands often accept moderate price increases to protect supply continuity and customer trust.
Stickiness varies by end-use vertical. Supplement brands with clinical positioning show the deepest loyalty because their marketing depends on the ingredient's published evidence. Functional beverage and food makers switch more often, since taste and cost dominate, and medical nutrition buyers demand full documentation and rarely change suppliers. Pharmacy and cosmetic-adjacent buyers purchase on price and change frequently, making that group less attractive for long-term planning.

Buyer profiles are changing. Younger consumers and digitally native brands look for clean, plant-based ingredients with visible clinical proof and sustainability credentials, and they favor suppliers that publish trial data and origin traceability. Older buyers anchor on physician recommendation and established brands. Suppliers must serve both groups, but growth concentrates among brands that market metabolic health through subscription models and content-driven education.
olive-phenolic-complexes-for-metabolic-health-mark-end-use-penetration-index-1789752427138

MMA Verdict on Olive Phenolic Strategy

These are among the four positions where our research anticipates prominent divergence between winners and laggards over the coming forecast period. Each is grounded in the demand model, the regulatory perimeter, and the announced capacity pipeline.
01 / PURITY AND PROCESS IP

Invest in Higher Purity Extraction and Patent Protection

Moving from 10% to 40% hydroxytyrosol standardization can lift price by 3 to 4 times per kilogram, and patented processes deter imitation by cheaper extractors. Suppliers that fund membrane, resin, and hydrolysis upgrades will hold pricing power as brands demand dose-verified actives for capsules and gummies. MMA advises committing capital within the next 18 months, before competitors build similar capacity and premium grades become more contested and widely available, which is why early action matters more than the exact equipment choice at any single site.
02 / CLINICAL EVIDENCE FUNDING

Fund Human Trials to Earn Premium Dose Positioning

Hydroxytyrosol-standardized extracts grow about 1.36 times faster than the market, and trial-backed grades earn 25% to 40% premiums per kilogram. A single randomized study costing under $1 million can secure exclusive supply agreements with premium brands and support structure-function claims in the United States. MMA recommends co-funding studies with universities and brands, focusing on glucose response and blood pressure outcomes where the evidence base is strongest, because early trial results shape which brands choose exclusive supply and where regulators focus their attention.
03 / RAW MATERIAL SECURITY

Lock Mill and Leaf Contracts Across Multiple Countries

Drought cut Spanish olive output by more than 50% in recent seasons and pushed spot raw material costs up 40% or more, which hit margins for unprotected extractors. Three to five year agreements across Spain, Italy, and Morocco protect 8% to 12% of gross margin during shortages. MMA regards multi-origin sourcing as the foundation of every credible supply commitment to brand customers, and unprotected extractors have already lost customers to rivals with steadier supply, so sourcing discipline now separates survivors from followers.
04 / FINISHED FORMAT PARTNERSHIPS

Move Into Ready-to-Fill Dose Blends With Brands

Supplying stability-tested blends for capsules and gummies lets suppliers keep 15% to 20% more margin than raw extract and shortens customer development cycles. Brands lacking formulation skill value taste masking, stability data, and quality systems, which build loyalty. MMA advises starting with two anchor customers, then extending the range as evidence and volumes grow, while preserving quality controls needed for regulated markets, because contract customers value simplicity and are unlikely to return to sourcing separate raw actives once a blend performs.

Engagement Snapshot From the Field

A live engagement with an industry participant carrying material or product regulatory and market exposure ahead of a defining policy shift, showing how our research translates into a defensible multi-year portfolio strategy.
MARKET MINDS ADVISORY · CLIENT ENGAGEMENT SUMMARY
Olive Phenolic Complexes for Metabolic Health Producer Strategic Portfolio Review and Transition Roadmap 2026·Investment Scenario on Olive Phenolic Complexes for Metabolic Health Exposure Evaluation 2025-26
CLIENT PROFILE
The client is a mid-sized Spanish olive extractor with two plants and roughly $48 million in annual revenue (client-reported, unverified by MMA), selling crude olive leaf and fruit extracts to distributors across Europe. Most volume carried low standardization, gross margin sat near 20% (client-reported, unverified by MMA), and the company had no clinical dossier or direct relationships with supplement brands.
STRATEGIC CHALLENGE
Cheaper Indian and Turkish leaf extracts were eroding prices, and drought had pushed raw material costs up sharply, compressing margin. Leadership needed a strategy that moved volume toward standardized hydroxytyrosol grades, secured mill supply, and created evidence-backed differentiation without overextending capital or losing existing distributor relationships that funded operations. Timing mattered because a new harvest was six months away.
MMA APPROACH
MMA benchmarked 12 extractors on purity, cost structure, and clinical positioning, interviewed supplement brand formulators and regulatory advisers about dose and claim needs, and modeled the economics of a hydroxytyrosol concentrate line, a co-funded human trial, and multi-year mill contracts across three countries under bull, base, and bear harvest scenarios.
KEY FINDINGS
  1. Standardized 30% hydroxytyrosol grades sold at about 3.5 times the price per kilogram of crude extract and required one additional resin and membrane line.
  2. Four supplement brands indicated they would sign annual contracts if potency was verified by chromatography and a supporting human study existed before year end.
  3. Multi-year mill contracts in Spain and Morocco could protect roughly 10% of gross margin during a drought year like 2023, based on the client's current volume mix.
  4. A co-funded 12-week glucose response trial would cost about $600,000 and could support structure-function claims in the United States, and give sales teams a persuasive story for premium brands.
CLIENT PROFILE
The client is a mid-sized Spanish olive extractor with two plants and roughly $48 million in annual revenue (client-reported, unverified by MMA), selling crude olive leaf and fruit extracts to distributors across Europe. Most volume carried low standardization, gross margin sat near 20% (client-reported, unverified by MMA), and the company had no clinical dossier or direct relationships with supplement brands.
STRATEGIC CHALLENGE
Cheaper Indian and Turkish leaf extracts were eroding prices, and drought had pushed raw material costs up sharply, compressing margin. Leadership needed a strategy that moved volume toward standardized hydroxytyrosol grades, secured mill supply, and created evidence-backed differentiation without overextending capital or losing existing distributor relationships that funded operations. Timing mattered because a new harvest was six months away.
MMA APPROACH
MMA benchmarked 12 extractors on purity, cost structure, and clinical positioning, interviewed supplement brand formulators and regulatory advisers about dose and claim needs, and modeled the economics of a hydroxytyrosol concentrate line, a co-funded human trial, and multi-year mill contracts across three countries under bull, base, and bear harvest scenarios.
KEY FINDINGS
  1. Standardized 30% hydroxytyrosol grades sold at about 3.5 times the price per kilogram of crude extract and required one additional resin and membrane line.
  2. Four supplement brands indicated they would sign annual contracts if potency was verified by chromatography and a supporting human study existed before year end.
  3. Multi-year mill contracts in Spain and Morocco could protect roughly 10% of gross margin during a drought year like 2023, based on the client's current volume mix.
  4. A co-funded 12-week glucose response trial would cost about $600,000 and could support structure-function claims in the United States, and give sales teams a persuasive story for premium brands.
RECOMMENDED STRATEGY
Phase 1: Phase 1 (Months 1-6): Sign mill contracts in Spain and Morocco and install a resin and membrane line for 30% hydroxytyrosol concentrate. Phase 2: Phase 2 (Months 7-15): Co-fund a randomized glucose trial and qualify the new grade with four supplement brand customers and agree annual volume terms. Phase 3: Phase 3 (Months 16-30): Launch encapsulation-ready blends and expand into North American distribution using published trial results while keeping quality controls audit-ready.
OUTCOME
Within 30 months, the client moved about 35% of volume into standardized grades and raised gross margin from 20% to an estimated 32% (client-reported, unverified by MMA). Four brands signed annual contracts, mill agreements held costs stable through a weak harvest, and revenue reached roughly $64 million (client-reported, unverified by MMA) without adding a third plant.

Frequently Asked Questions

Foundational context covering the market sizes, CAGR, scope, country, region and competition that inform every finding below. This section is provided to cover basics and most often pre-purchase conversations, answered from the MMA Primary Research Dataset.

What is the current size of the Olive Phenolic Complexes for Metabolic Health Market?

The global olive phenolic complexes for metabolic health market was valued at $0.8 billion in 2025. This covers standardized hydroxytyrosol, oleuropein, and related extracts sold as ingredients for metabolic health uses.

How large will the Olive Phenolic Complexes for Metabolic Health Market be by 2036?

MMA projects the market will reach approximately $2.5 billion by 2036. This represents cumulative growth of roughly $1.6 billion over the full ten-year forecast window.

What is the CAGR for the Olive Phenolic Complexes for Metabolic Health Market 2026 to 2036?

The market is forecast to grow at an 11.0% compound annual rate between 2026 and 2036. The bull case reaches 12.3% while the bear case falls to 9.7%.

Which segment is growing fastest?

Hydroxytyrosol-Standardized Extracts is the fastest-growing segment at 15.0% CAGR, roughly 1.36 times the overall market rate. Oleuropein Leaf Extracts follows as the second-fastest segment at 12.5%.

Who are the major companies in the Olive Phenolic Complexes for Metabolic Health Market?

Leading companies include Nutrafur, Indena, dsm-firmenich, Kemin Industries, and Layn Natural Ingredients. These five suppliers together hold an estimated 41% of total global market revenue today.

Which country is growing fastest?

India is the fastest-growing major market, expanding at approximately 14.5% CAGR each year. Rising diabetes prevalence and expanding online supplement retail are driving this above-market growth.

Report Segmentation Architecture

The full report scope spans multiple orthogonal segmentation dimensions, with cross-tabulated demand data provided for each dimension pair. Coverage extends further to regional breakdowns, trend trajectories, and the competitive detail needed to support segment-level decision-making.

By Primary Market Dimension

  • Hydroxytyrosol-Standardized Extracts
  • Oleuropein Leaf Extracts
  • Tyrosol and Secoiridoid Complexes
  • Olive Fruit Water Concentrates
  • Whole Olive Polyphenol Powders
  • Olive Phenolic Synergy Blends

By End-Use Industry

  • Dietary Supplements
  • Functional Foods and Beverages
  • Medical Nutrition
  • Sports and Active Nutrition
  • Pharmaceutical-Adjacent Nutraceuticals

By Commercial Dimension

  • Direct Brand Supply Contracts
  • Ingredient Distributor Channels
  • Contract Manufacturer Supply
  • Private Label Programs

By Region

  • North America
  • Western Europe
  • East Asia
  • South Asia and Pacific
  • Latin America
  • Middle East and Africa
  • Eastern Europe

Scope, Methodology, and Coverage

Every figure in this report is reproducible from documented input assumptions. The scope below maps the historical period, the forecast horizon, the segmentation dimensions, and the countries covered, alongside the underlying primary and qualitative methodology.
Historical Period
2020 to 2025
Forecast Period
2026 to 2036
Base Year
2025 (USD billions; MMA Primary Research Dataset, September 2026)
Market Definition
Olive phenolic complexes for metabolic health comprise standardized extracts and concentrates of hydroxytyrosol, oleuropein, tyrosol, and related olive secoiridoids, derived from olive fruit, leaf, and mill by-products and sold as ingredients for dietary supplements, functional foods, and medical nutrition targeting blood sugar, lipid, and vascular health. The scope excludes olive oil sold as food, cosmetic and topical olive actives, and finished consumer supplements.
Quantitative Units
USD billions (current prices); metric tons for volume references
Segmentation Dimensions
By Extract Composition and Standardization; By End-Use Industry; By Commercial Dimension; By Region
Regions Covered
North America, Western Europe, East Asia, South Asia and Pacific, Latin America, Middle East and Africa, Eastern Europe
Countries Covered
USA, Canada, Spain, Italy, Greece, Germany, France, UK, Japan, South Korea, China, India, Australia, Brazil, Mexico, Chile, Argentina, Morocco, Tunisia, Egypt, Turkey, UAE, Saudi Arabia, Poland, Czechia, Romania, Portugal, Netherlands, Switzerland, Singapore, and additional markets relevant to this sector
Key Companies Profiled
Nutrafur, Indena, dsm-firmenich, Kemin Industries, Layn Natural Ingredients, Genosa, Oliphenolia, Sabinsa Corporation, Martin Bauer Group, Euromed, Monteloeder, Natac Group, Naturex, Provital Group, Bioiberica, Lonza, Glanbia Nutritionals, Kerry Group, Cargill, Archer Daniels Midland
Quantitative Methodology
Primary survey, n=3,800 respondents, Q4 2025, six countries; demand-side model with trade association cross-validation
Qualitative Methodology
47 expert interviews, Q4 2025; applied to validate demand model assumptions, identify emerging dynamics, and assess competitive positioning
Report Format
PDF and XLSX data workbook (Word format preview document)
Publisher
Market Minds Advisory
Report Code
MMA-2026-HLT-245
Published
September 2026
Contact
sales@marketmindsadvisory.com | www.marketmindsadvisory.com

Purchase the full Olive Phenolic Complexes for Metabolic Health Market Report (2026 to 2036).

The full report delivers a detailed assessment of olive phenolic extract supply, clinical evidence, and competitive positioning through 2036. It includes segment forecasts by extract composition and standardization, country-level data for all seven world regions, and profiles of the twenty companies most relevant to extraction and ingredient supply. Analysts also receive input cost modeling and portfolio margin benchmarking built from MMA's primary research dataset. A scenario planning module lets subscribers stress-test bull and bear assumptions against harvest and claim outcomes. Quarterly updates keep the whole dataset current throughout.
Ten-year segment and regional demand forecasts
Extract purity and pricing benchmark tracking
Competitive benchmarking of top twenty suppliers
Harvest and raw material cost sensitivity modeling
Health claim regulatory comparison across key regions
Quarterly primary survey data update access

Built For The People Who Decide

From boardroom strategy to bench-side execution, this report is read cover-to-cover by leaders shaping the next decade of their industry, turning demand scenarios, market dynamics and valuation benchmarks into decisions.
CXOs/ Presidents/ VPs/ Managers
M&A and Corporate Development
Strategy Teams and R&D Heads
Procurement and Product Directors
Regulatory and Compliance Leaders
Investor Relations and Equity Analysts