Market Minds Advisory
OLED Market

OLED Market: OLED Market. Foldable Devices Push Display Manufacturing Past Rigid Panel Limits

Foldable smartphones and wearable displays are pushing panel makers past the physical limits rigid glass substrates were built around, forcing an entire manufacturing base to retool around flexible substrates within a single product generation.

Lead Analyst

Published

September 2026

Make Smarter Decisions with Customized Research Insights

Request a free sample report and evaluate market opportunities, growth trends, and competitive dynamics relevant to your business needs.

2025 MARKET VALUE$52.0BMarket Size 2025
2036 FORECAST VALUE$173.9BBase Case , 2026 to 2036
CAGR 2026 TO 203611.6 %Bull 12.8% / Bear 10.4%
INCREMENTAL OPPORTUNITY$115.9BNet 10- year value creation
EXPANSION MULTIPLE3.00x2036 value over 2026 base
Strategic Levers
M&A Pipeline
Regional Outlook
Country Rankings
Competitive Intelligence
Segmental Deep-dive
Call-Us : 91 93563 13602

Executive Snapshot and Market Trajectory.

OLED displays have moved from a premium smartphone differentiator to the default display technology across phones, wearables, and increasingly automotive dashboards as manufacturing costs decline and flexible substrate yields improve. Device makers now specify OLED before finalizing product design, a reversal from treating it as a premium upgrade option.
Flexible and foldable OLED displays are growing fastest as foldable smartphone adoption accelerates beyond early adopters, while micro-OLED microdisplay panels consolidate a separate but adjacent segment concentrated in East Asia's dense panel fabrication base and North America's expanding augmented reality headset design activity. Device makers increasingly demand documented panel lifespan and burn-in resistance. That requirement barely existed as a standard procurement criterion five years ago.
Large panel manufacturers compete against a handful of specialized microdisplay startups now bundling OLED into broader display module platforms, and rising demand for measurable panel yield improvement is starting to separate manufacturers with genuine field-proven production lines from those still selling on theoretical brightness specifications alone. Manufacturers that document concrete yield data are winning larger multi-year device maker contracts that smaller unproven competitors increasingly cannot match on credibility in this consolidating category today.
Market Definition
This report defines the OLED Market as organic light-emitting diode display panels and lighting products used in smartphones, televisions, wearables, automotive displays, and lighting applications. It excludes LCD and micro-LED display technologies and OLED materials sold as standalone chemical inputs.
Base Year Value
$52.0B in 2025 (MMA Primary Research Dataset, September 2026)
Forecast Period
2026 to 2036, eleven discrete annual values
CAGR
11.6% base case. Bull 12.8%. Bear 10.4%.
Fastest Growth Segment
Flexible and Foldable OLED Displays: 19.4% CAGR
Fastest Growth Country
China: 14.2% CAGR
Fastest Growth Region
South Asia and Pacific: 13.7% CAGR
Largest Region
East Asia: 40% of 2025 global value
Market Leaders
Samsung Display, LG Display, BOE Technology, Visionox, and Tianma Microelectronics. Source: MMA Analysis based on company disclosures and shipped panel unit estimates.
Primary Survey
n=3,800 procurement and R&D decision-makers, Q4 2025, six countries
Methodology
Demand-side build-up, cross-validated against public data, 47 expert interviews

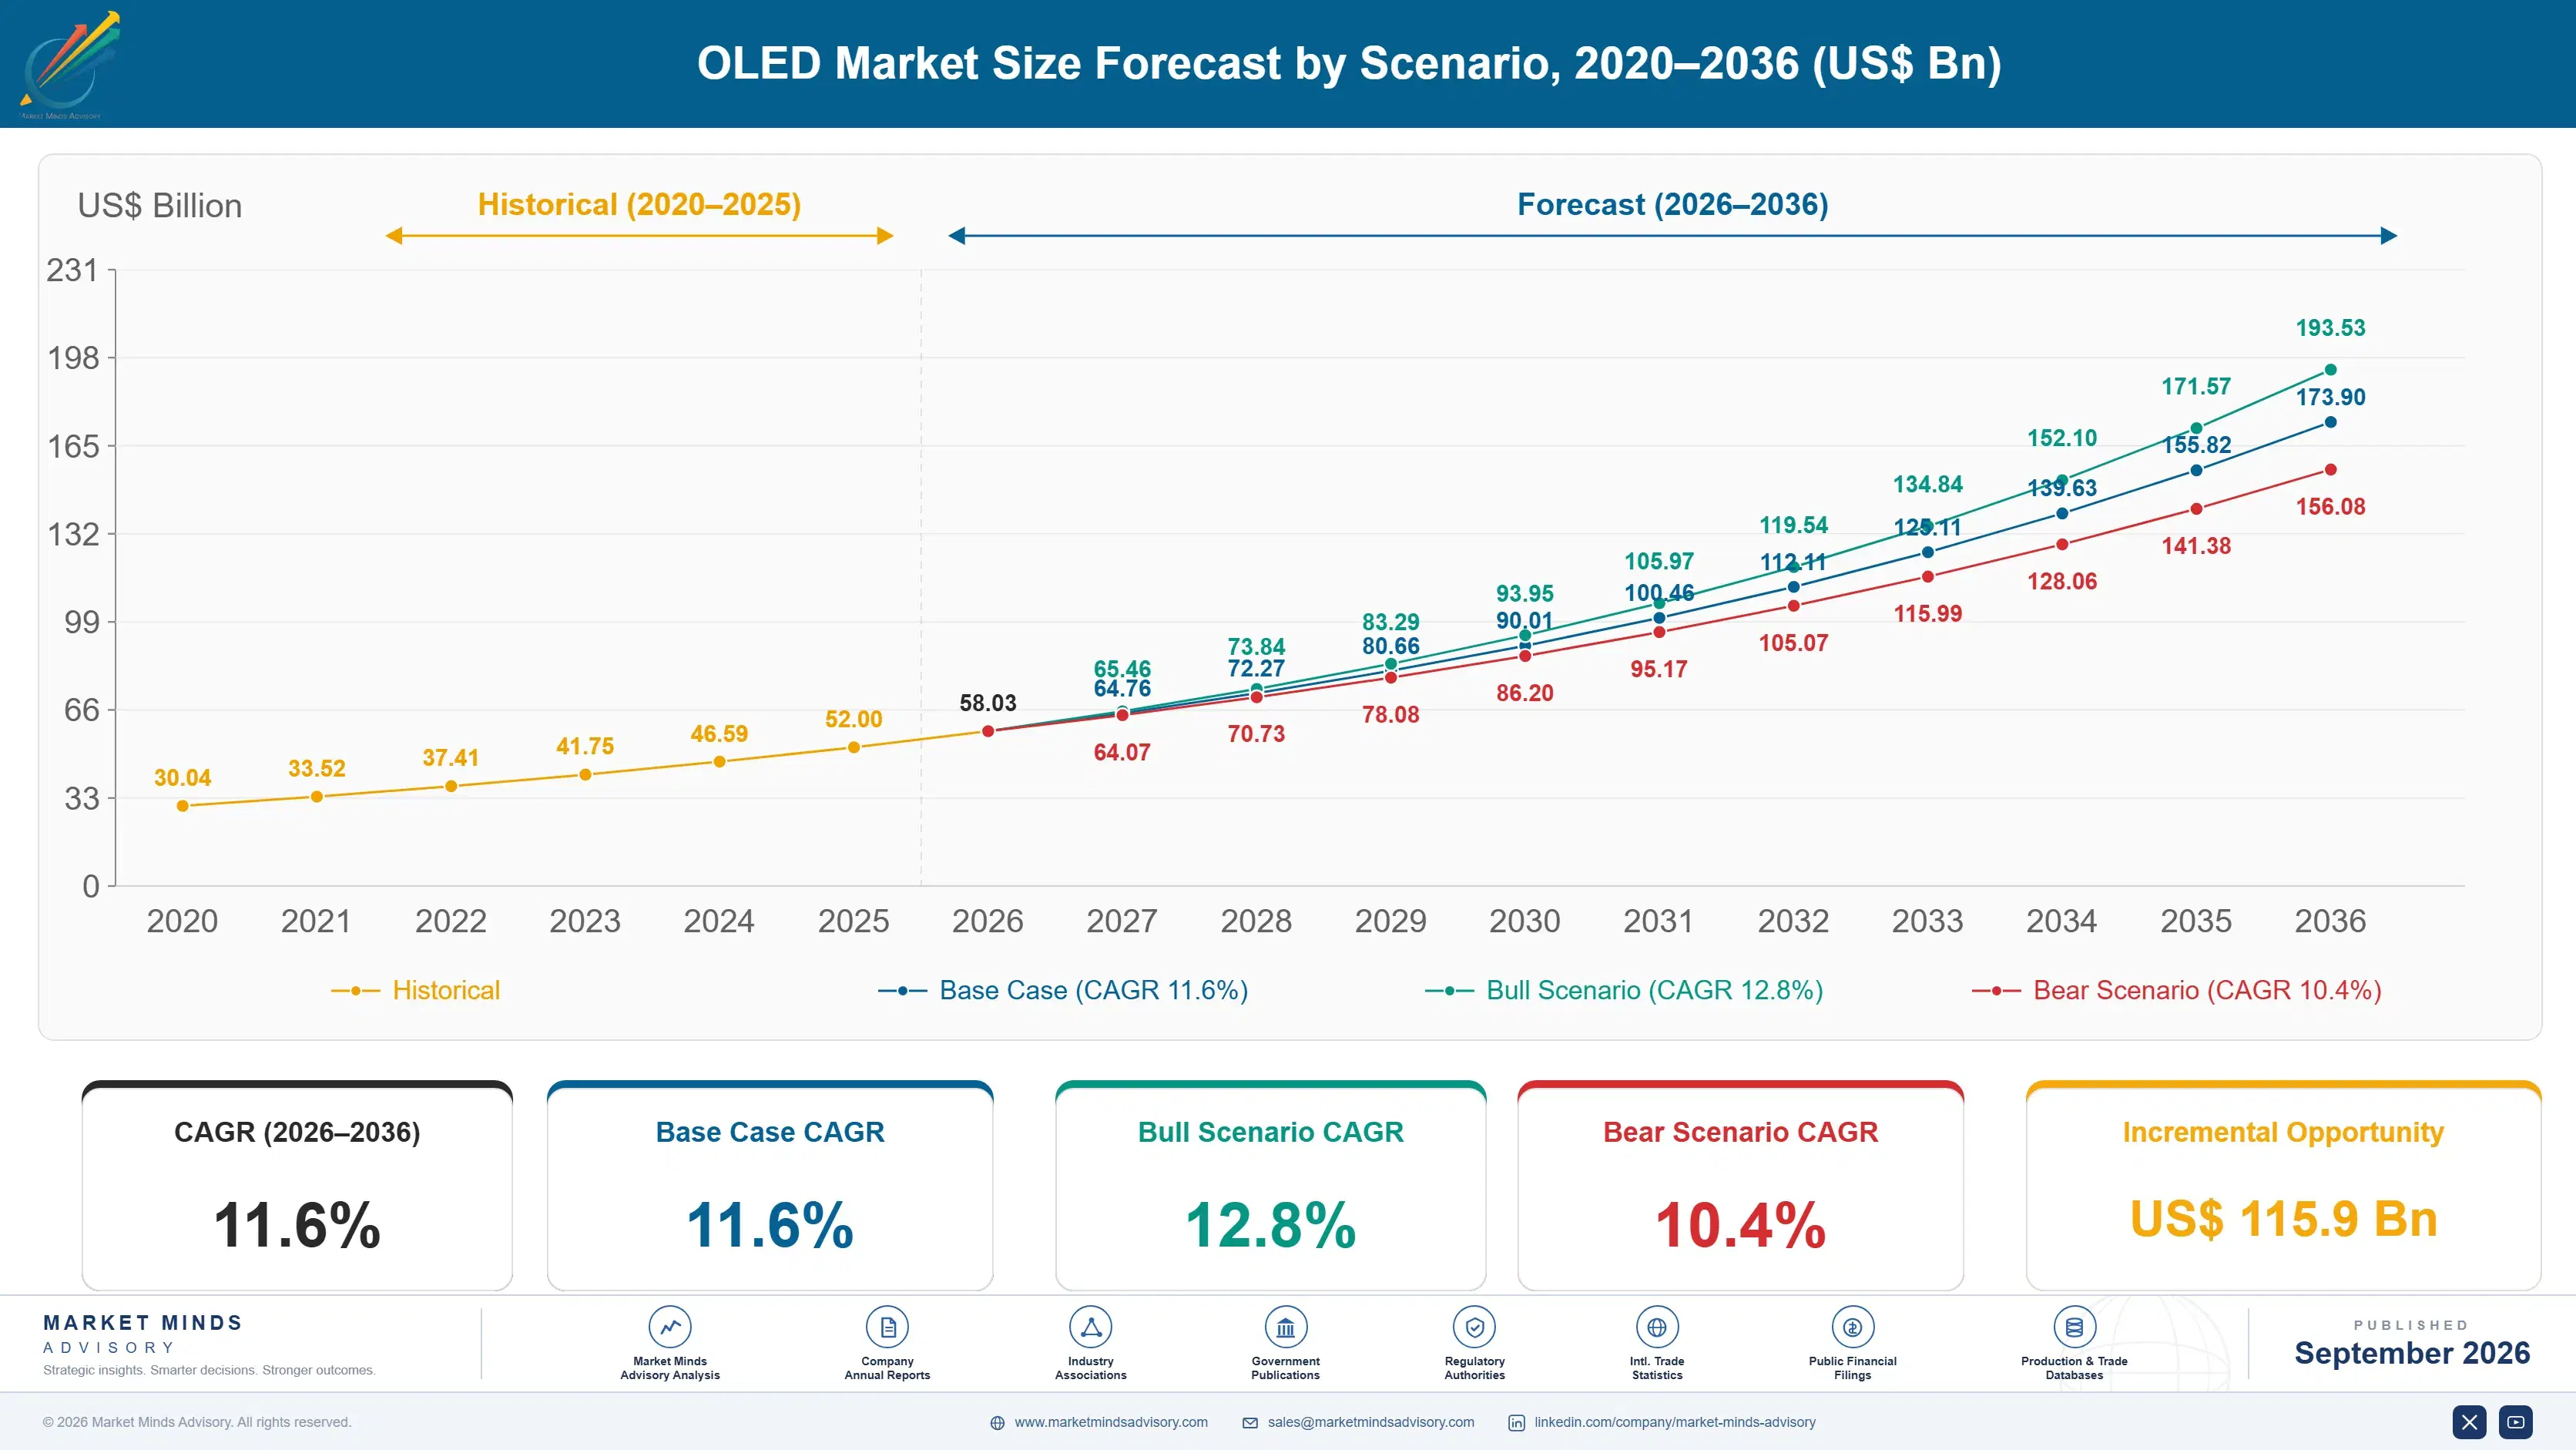
OLED Market Forecast Scenarios

oled-market-size-forecast-scenario-1789990470093
Between 2020 and 2025 the market accelerated as smartphone OLED adoption spread beyond flagship models into mid-range devices, expanding at roughly 10.6% annually as manufacturing yields improved enough to bring costs closer to parity with LCD alternatives. Several major device makers standardized on OLED across broader product lines during this period. That momentum has continued.
MMA's base case assumes 11.6% annual growth through 2036, anchored to three mechanisms: expanding foldable and flexible device adoption requiring OLED's inherent bendability that LCD technology cannot replicate, rising automotive display content adopting OLED for its contrast and design flexibility advantages, and continued yield improvement bringing OLED costs closer to parity with mature LCD manufacturing. Manufacturers that can demonstrate documented yield improvement across multiple panel sizes are winning larger device maker contracts that smaller single-format competitors increasingly cannot compete for.
The bull case rests on automotive OLED adoption accelerating faster than currently planned as electric vehicle interior design differentiation intensifies. The bear case centers on micro-LED technology maturing faster than expected and capturing premium television and large-format display share that OLED currently holds. That risk is most acute for manufacturers concentrated heavily on large-format television panels rather than diversified mobile and automotive applications.

From Premium Upgrade to Default Display

OLED displays began as a premium smartphone feature valued mainly for deeper blacks and thinner form factors rather than genuine manufacturing cost advantage. Manufacturers have since layered on flexible substrate production, foldable hinge-compatible panel design, and automotive-grade reliability testing, turning a premium differentiator into a design-critical display technology that determines device form factor. Designers now treat this as a core input rather than a cosmetic add-on.
AVERAGE PANEL YIELD RATE82%Typical share of fabricated panels meeting quality specifications
PANEL LIFESPAN30,000 hoursTypical operating time before noticeable brightness degradation occurs
TOP PRODUCING COUNTRY SHARE48%South Korea share of global OLED panel manufacturing revenue
FLEXIBLE PANEL ADOPTION RATE44%Share of smartphone OLED panels now using flexible substrates
AVERAGE PANEL REPLACEMENT CYCLE3 yearsTypical device upgrade cycle driving panel replacement demand
DEPOSITION EQUIPMENT COST SHARE34%Share of panel production cost tied to deposition equipment
Pricing now varies sharply by flexibility requirement and panel size. Basic rigid OLED panels charge moderate per-unit pricing, while flexible and foldable variants command premium pricing that scales with documented bend-cycle durability testing across thousands of fold cycles. Device makers increasingly accept higher panel costs after a durability failure convinces product teams that bend-cycle testing depth is genuinely worth paying for.
Large panel manufacturers are acquiring specialized microdisplay startups rather than building comparable augmented reality optics expertise in-house, buying microdisplay know-how and existing headset maker relationships rather than fabrication capacity alone. That acquisition pattern is starting to squeeze independent boutique panel makers that lack the scale to invest in comparable flexible substrate infrastructure larger competitors now offer standard. Independent panel makers that survive increasingly specialize in niches larger manufacturers overlook.
"Nobody switches panel suppliers over a brightness spec sheet. They switch after a foldable device fails at fold cycle forty thousand during a competitor's stress test video."
Director, Display Technology and Consumer Electronics Practice · MMA Technology Practice · September 2026

Market Trends

Foldable Device Adoption Drives Flexible Panel Innovation

Smartphone makers continue expanding foldable device lineups beyond flagship showcases into mid-range product tiers, pushing panel manufacturers to improve flexible substrate durability and cost efficiency simultaneously across every product line. This shift accelerated sharply once several major device makers publicly disclosed fold-cycle durability improvements after switching to newer flexible substrate materials. Roughly 44% of smartphone OLED panels now use flexible substrates, up meaningfully from a smaller share just a few years ago. Manufacturers lacking documented flexible substrate capability increasingly lose design wins to competitors with proven foldable panel performance data.
Market Impact: Mid-range OLED adoption grew 21% yearly

Automotive Interior Design Expands OLED Display Adoption

Automakers are increasingly specifying OLED displays for vehicle dashboards and infotainment systems, valuing the technology's design flexibility and superior contrast over traditional LCD alternatives for premium interior differentiation across model lines. This shift reflects growing recognition that electric vehicle interior design has become a genuine competitive differentiator as powertrain technology increasingly converges across manufacturers. Panel makers lacking automotive-grade qualification increasingly lose bids to competitors that can demonstrate validated reliability under vehicle operating conditions. Roughly 18% of new vehicle models now specify OLED displays, a pace that continues accelerating each year.
Market Impact: Wearable panel orders rose 16% yearly

Market Opportunities and Growth Drivers

Smartphone Manufacturers Standardize OLED Across Product Tiers

Smartphone manufacturers continue extending OLED adoption from flagship models into mid-range and budget product tiers as manufacturing yields improve and per-unit costs decline toward parity with LCD alternatives. Device makers increasingly qualify multiple panel suppliers per product line to reduce single-source supply risk, a diversification pattern that expands the addressable supplier base beyond incumbent relationships. Manufacturers with demonstrated yield credentials increasingly capture design wins across multiple product lines simultaneously rather than single contracts. Some manufacturers now maintain dedicated device maker account teams purely to serve this growing qualification demand. across every major market.
Market Impact: adds 34% to deposition equipment cost

Wearable Device Growth Expands Small-Format Panel Demand

Smartwatches and other wearable devices continue driving demand for small-format OLED panels optimized for power efficiency and always-on display capability that LCD technology struggles to match at comparable battery life and cost. Device makers increasingly recognize that display power consumption directly determines wearable battery life, a critical purchasing consideration for consumers evaluating competing devices carefully. Manufacturers serving this segment report meaningfully stronger order growth than those focused purely on smartphone panels. Several manufacturers have hired dedicated wearable account teams purely to serve this expanding demand across major device programs nationwide.
Market Impact: micro-LED may capture 12% share

Market Restraints and Challenges

Fine Metal Mask Manufacturing Limits Production Scale

Fine metal mask deposition equipment used in OLED panel fabrication remains expensive and technically difficult to manufacture at the precision required for high-resolution panels, creating a genuine barrier to rapid capacity expansion. The root cause is that fine metal mask technology requires specialized manufacturing expertise concentrated among a small number of equipment suppliers globally. The commercial impact is that roughly 34% of panel production cost now goes toward deposition equipment and related fine metal mask infrastructure. Some manufacturers are responding by investing in alternative deposition technologies specifically to reduce dependence on fine metal mask suppliers.
Market Impact: 44% of panels use flexible substrates

Micro-LED Technology Competition Threatens Premium Segment

Micro-LED display technology, still early in commercialization, threatens to capture premium television and large-format display share that OLED currently holds as the premium display technology of choice. The root cause is that micro-LED offers brightness and longevity advantages that OLED's organic materials cannot fully match, particularly for large-format applications facing extended usage hours. The commercial impact is that OLED manufacturers face pressure to accelerate their own roadmap improvements to defend premium positioning. Some manufacturers are responding by investing directly in micro-LED research to hedge against this competitive transition over time.
Market Impact: 18% of vehicles now specify OLED
3 additional market trends, 4 additional growth drivers, and 2 additional restraints and challenges are covered in the full report. Contact sales@marketmindsadvisory.com to access the complete intelligence.

Segment CAGR and Growth Architecture

OLED segments by physical panel format rather than end-use application, since flexibility and substrate design determine manufacturing process and cost structure far more than the device category a panel eventually ships into across every product tier. Flexible and foldable OLED displays are the fastest growing category as foldable smartphone adoption accelerates across the industry.
oled-market-market-share-analysis-1789990470639

Flexible and Foldable OLED Displays

This segment covers OLED panels manufactured on flexible polyimide substrates rather than rigid glass, enabling curved, bendable, and foldable device form factors that rigid panels cannot support. Demand is concentrated among premium and increasingly mid-range smartphone makers competing on foldable device differentiation, along with wearable device manufacturers requiring curved display surfaces. Vendors in this segment differentiate on fold-cycle durability measured across hundreds of thousands of repetitions, crease visibility minimization, and yield consistency at high-volume production scale. Growth here outpaces every other segment because foldable device adoption is accelerating simultaneously across nearly every major smartphone maker worldwide. Vendors without this capability increasingly struggle to win the largest smartphone maker qualifications available.
CAGR 19.4%

Micro-OLED (Microdisplay) Panels

This segment covers extremely small, high-pixel-density OLED panels manufactured directly on silicon wafers rather than glass substrates, designed for near-eye display applications including augmented and virtual reality headsets. Demand comes from headset manufacturers requiring pixel densities far beyond what conventional OLED manufacturing processes can achieve on standard substrates. Vendors compete on pixel density scaling for immersive resolution, power efficiency critical for battery-powered wearable headsets, and manufacturing yield at the extremely fine feature sizes microdisplay production requires. Growth here trails the flexible panel segment but remains well above the broader market average as headset adoption expands. Enterprise buyers increasingly evaluate pixel density depth above nominal brightness specifications alone. That documentation increasingly determines which suppliers make the qualified vendor list.
CAGR 16.8%
Full segment breakdown across 7 segments available in the complete report.

Regional Architecture and Country Demand Map

East Asia dominates well beyond the typical regional band on the sheer concentration of panel fabrication capacity in South Korea, China, and Japan, while South Asia and Pacific grows fastest as India's expanding electronics assembly base continues scaling rapidly to serve growing regional device demand.

North America

The United States hosts a concentration of device brand headquarters and augmented reality headset design centers specifying OLED and microdisplay panels for flagship products, even though domestic panel fabrication capacity remains minimal. Domestic brand owners drive substantial demand through design specification and procurement decisions even without manufacturing panels locally, giving this region meaningful commercial weight despite its limited fabrication footprint. Canada contributes a smaller but steady share, anchored by its own display research institutions. Domestic design activity increasingly specifies microdisplay panels directly into headset architectures, reinforcing demand for suppliers offering integration support alongside panel supply. Investment in domestic display research capability continues expanding across several major design clusters. Suburban design centers continue investing further in headset optics research.
Share: 24% | CAGR: 12.2% (2026 to 2036)

Western Europe

Germany, France, and the United Kingdom together account for most regional demand, driven by automotive electronics manufacturers specifying OLED displays for premium vehicle interiors and dense consumer electronics distribution networks. Compliance requirements under European automotive quality standards shape panel qualification protocols more directly here than in markets with lighter regulatory obligations, pushing suppliers toward rigorous documentation practices. Adoption of automotive OLED trails East Asia by roughly a year on average, reflecting more conservative automotive procurement cycles among established European suppliers. Growth remains solid even so, as electric vehicle interior differentiation spreads across the region. Several manufacturers are investing in automotive qualification to meet rising interior design requirements. Regulatory clarity is helping accelerate broader regional adoption steadily.
Share: 19% | CAGR: 10.3% (2026 to 2036)
Regional intelligence for 5 additional markets available in the complete report: East Asia, South Asia and Pacific, Latin America, Middle East and Africa, Eastern Europe. Contact sales@marketmindsadvisory.com.
oled-market-country-cagr-analysis-1789990471185

Where Panel Makers Capture More Margin

Manufacturers are finding revenue growth less in one-time panel sales and more in ongoing qualification and design-win relationships, since device makers who already trust a supplier with a validated flexible panel design are genuinely and unusually reluctant to switch even when a competitor offers meaningfully lower unit pricing elsewhere. across the entire broader market.

Documented Durability Testing Certification Service Programs

Manufacturers are offering paid fold-cycle durability testing services that generate documented reliability data device makers can present during their own product certification reviews, turning what was previously an informal quality claim into a billable certification service. Device makers preparing for flagship product launches increasingly require this documentation before finalizing a supplier relationship. Early adopters report attach rates around 24% among premium device maker accounts within the first product cycle after launch, concentrated among makers facing their own downstream warranty pressure. Renewal rates among certified accounts consistently exceed the broader customer base.
Market Impact: adds roughly 24% attach rate among device makers

Flexible Panel Upgrade Conversion Pathway Programs

Manufacturers increasingly design upgrade paths that convert standard rigid panel customers into flexible panel relationships after demonstrating measurable form factor improvement on a customer's own device design during a trial production run. These flexible panel deployments now command roughly 55% higher unit pricing and represent the fastest-growing revenue segment within existing customer relationships across the manufacturer's book of business. Roughly one in three customers who trial flexible panels retain them permanently rather than reverting. Application engineers also generate valuable customer insight manufacturers use to identify candidates. Retention on these upgraded accounts runs meaningfully higher than standard tiers.
Market Impact: flexible panel upgrades command roughly 55% higher pricing

White-Label Microdisplay Licensing Partnership Service Programs

Some manufacturers now license their proprietary microdisplay design and fabrication technology directly to headset makers building custom optics platforms, a distribution channel that bypasses direct panel sales entirely and predictably. Early licensing deals report margins roughly 30 percentage points higher than comparable direct sales contracts, since the underlying design development cost is already covered by the manufacturer's own platform investment across its customer base. Headset makers value gaining proven microdisplay capability without building comparable expertise in-house from scratch. Manufacturers increasingly treat this licensing channel as a genuine second business line.
Market Impact: microdisplay licensing revenue now grows roughly 20% yearly

Multi-Product Device Maker Consolidation Agreement Programs

Large device makers running dozens of product lines across multiple categories need supply agreements that guarantee consistent panel quality and delivery schedules across every product while still accommodating design changes on individual devices. Manufacturers offering this multi-product consistency charge substantial premiums over single-product pricing, since the quality control infrastructure required to guarantee consistency across products is considerably higher than most competitors have built well at scale. Customers adopting multi-product agreements increase average contract value by roughly 45% compared to single-product arrangements. These agreements typically span multiple years across a customer's full product lineup.
Market Impact: increases contract value by roughly 45% per product

Who Controls the Margin Pool

The OLED Market shows high concentration, with the top five manufacturers, evaluated on shipped panel unit volume, holding roughly 78% combined share. Samsung Display and LG Display lead on flexible substrate manufacturing scale and large-format panel expertise respectively, but the gap to BOE Technology has narrowed sharply as it bundles panels into existing Chinese device maker relationships customers never intended to procure separately. That shift alone is reshaping how device makers evaluate suppliers.
Current competitive activity centers on flexible substrate manufacturing scale-up, with nearly every manufacturer racing to build production lines capable of high-volume foldable panel output rather than limited demonstration capacity alone. Manufacturers are also investing heavily in microdisplay technology, since headset makers increasingly treat pixel density as a baseline procurement requirement rather than an optional feature anymore.

Emerging pressure comes from micro-LED technology developers extending into premium large-format display categories, a fast-moving competitive threat established OLED incumbents were genuinely slow to anticipate. Rankings could shift meaningfully over the next several years if large Chinese panel makers continue absorbing independent microdisplay specialists through acquisition, particularly among mid-market device makers unwilling to manage multiple supplier relationships simultaneously.
oled-market-company-positioning-matrix-1789990471714

Competitive Moat and Risk Dimensions

SAMSUNG DISPLAY

Moat: Deepest Flexible Substrate Manufacturing

Samsung Display built dedicated high-volume flexible substrate manufacturing capacity specifically for foldable device production over several years of continuous facility investment, creating throughput capability that newer entrants cannot replicate quickly without comparable capital commitment. Large smartphone makers already qualified on Samsung panels are reluctant to requalify.
SAMSUNG DISPLAY

Risk: Customer Concentration Revenue Risk

Samsung Display's revenue remains heavily concentrated among a small number of large smartphone customers, creating meaningful exposure if any single customer shifts sourcing or delays a planned device launch, a risk more diversified competitors serving multiple end markets and geographies face considerably less acutely. Enterprise buyers increasingly weigh this tradeoff.
BOE TECHNOLOGY

Moat: Rapidly Scaling Domestic Capacity

BOE Technology has expanded flexible substrate production capacity faster than most competitors over the past several years, backed by substantial domestic government support that gives it capital access advantages foreign competitors operating in China cannot match on comparable terms or timelines. Retention among its largest domestic accounts consistently outperforms newer entrants.
BOE TECHNOLOGY

Risk: Trailing Yield and Quality Reputation

BOE Technology's yield rates and quality consistency still trail established Korean manufacturers on the most demanding flagship device qualifications, keeping it winning mid-range and domestic Chinese device contracts while struggling to displace incumbents at the very top of the premium smartphone segment worldwide. Investors increasingly weigh this quality gap when comparing valuations.

Players Tracked

Prominent Players

Samsung Display
LG Display
BOE Technology
Visionox
Tianma Microelectronics

Other Key Players

AU Optronics
Innolux Corporation
Royole Corporation
EverDisplay Optronics
China Star Optoelectronics Technology
Japan Display
Kunshan Govisionox Optoelectronics
Truly Semiconductors
Sony Semiconductor Solutions
eMagin Corporation
Kopin Corporation
MICROOLED
WiseChip Semiconductor
Yungu Display
TCL CSOT

Recent Developments

FEBRUARY 2026

Samsung Display acquired a smaller microdisplay startup to accelerate its augmented reality optics roadmap, adding silicon-based panel design capability that would otherwise have taken its engineering team well over a year to build natively from scratch. The deal closed for an undisclosed sum and integrates fully within two quarters.
Signal: Panel manufacturers are increasingly buying microdisplay depth instead of slowly building it out fully on their own.
SEPTEMBER 2025

BOE Technology expanded its production capacity with a new flexible substrate line aimed squarely at foldable smartphone orders, a segment it had previously served only through limited-capacity legacy production lines. The expansion followed extensive customer demand signals gathered across several large device maker accounts. Financial terms were not disclosed.
Signal: Chinese panel makers are expanding flexible substrate capacity to meet growing foldable demand across every region.
MAY 2025

LG Display signed a multi-year supply agreement with a major automotive manufacturer to serve as its preferred OLED vendor across twelve vehicle programs worldwide, formalizing a relationship that previously existed only informally between the two companies for several years beforehand. Financial terms remain undisclosed publicly.
Signal: Automakers are formalizing preferred panel supplier arrangements to standardize interior display quality fleet-wide across every program.

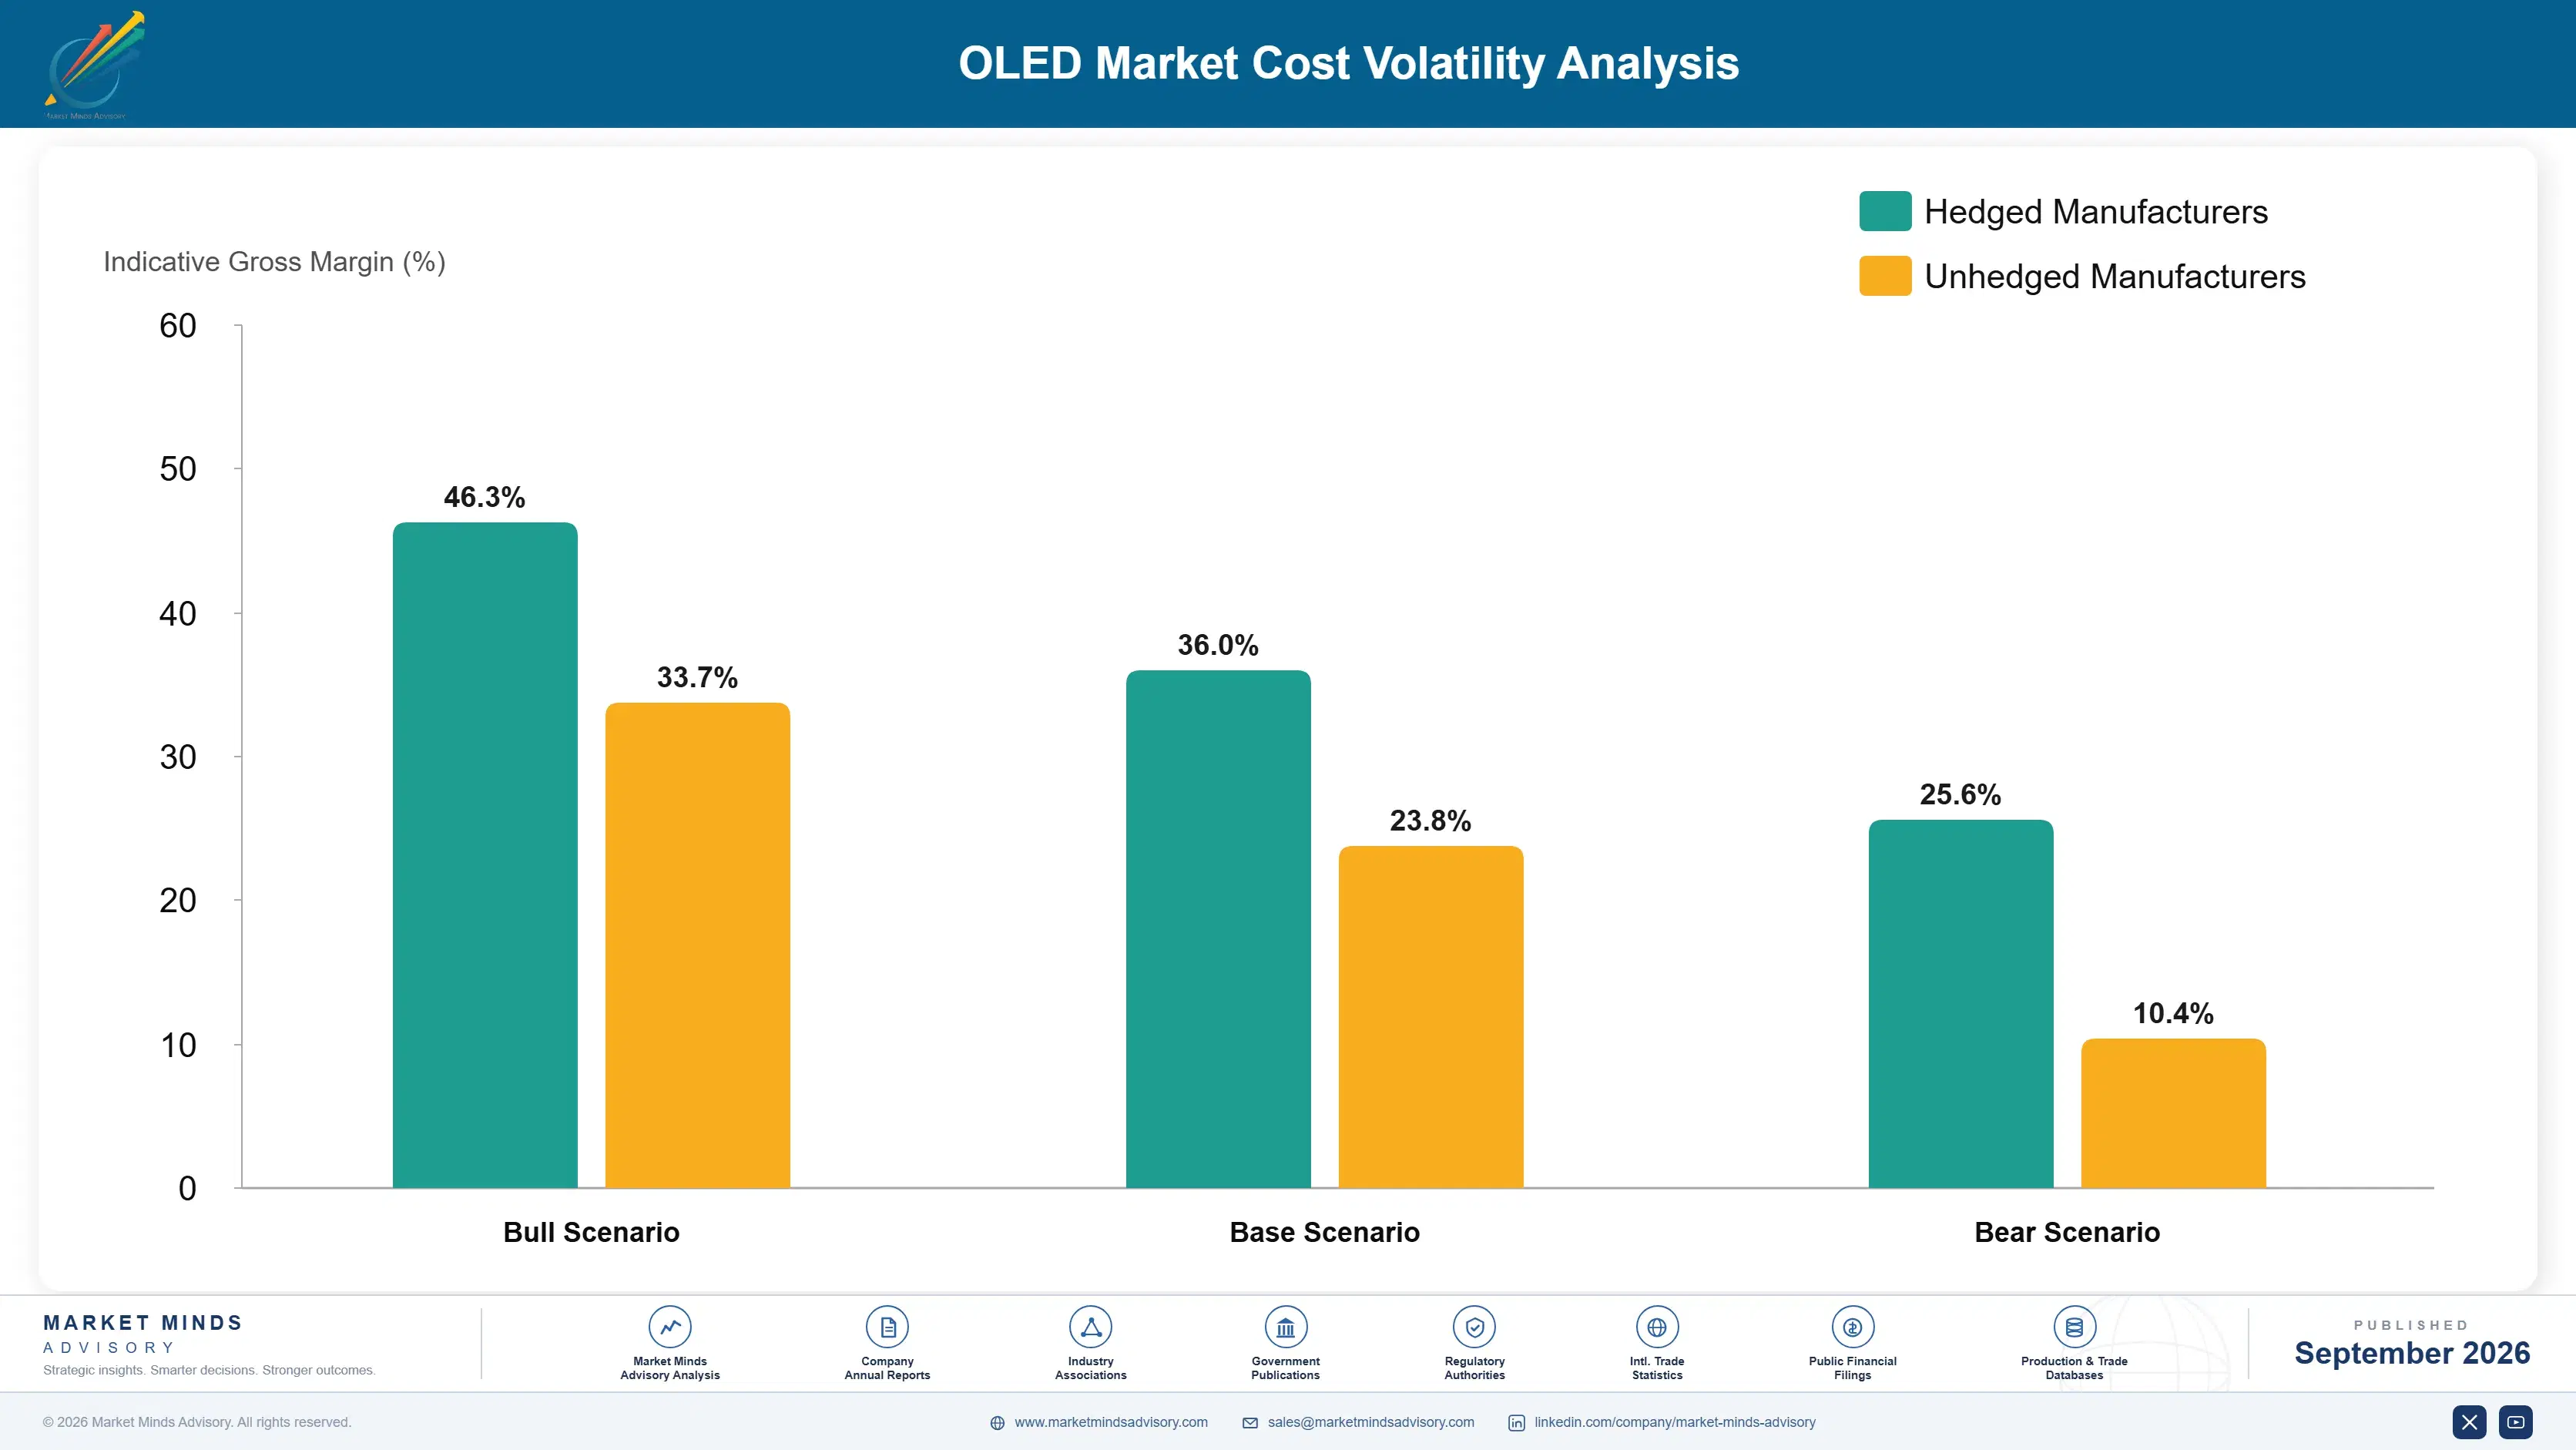
Deposition Equipment and Materials Cost Exposure

Fine metal mask deposition equipment and organic emissive materials together represent roughly 34% of a panel manufacturer's total production cost, since achieving reliable pixel-level material deposition demands considerably more precision equipment investment than LCD manufacturing ever required. Skilled process engineers capable of optimizing deposition yield are the second largest input, sourced primarily from South Korean, Japanese, and Chinese labor markets.
A major materials supplier's 2025 emissive material shortage, documented in the company's annual report, forced several smaller panel manufacturers to delay production by roughly two months, temporarily slowing shipment schedules for affected device maker programs. Larger manufacturers with pre-negotiated volume contracts largely avoided the disruption entirely, widening the competitive gap. The episode pushed several affected manufacturers to diversify materials sourcing across additional suppliers going forward.

Smaller panel manufacturers without volume purchasing power face materially higher per-unit materials costs than the largest three manufacturers, a disadvantage that compounds over time as scale advantages widen with each panel generation. Manufacturers headquartered in regions with direct materials supplier relationships, including South Korea and Japan, hold a durable cost advantage over competitors dependent entirely on imported materials shipped from elsewhere.
oled-market-cost-volatility-analysis-1789990471910

Diversified Multi-Supplier Materials Sourcing Agreements

Larger manufacturers are qualifying secondary emissive materials suppliers to reduce exposure to any single supplier's pricing changes or capacity constraints during periods of tight availability. This diversification adds modest qualification cost upfront but meaningfully shortens recovery time during future material shortages. These qualification programs typically span several months per additional supplier. across every affected material category.

Long-Term Volume Purchase Commitments

Manufacturers with sufficient scale are negotiating multi-year materials purchase agreements that lock in favorable pricing ahead of demand spikes across the emissive materials supply chain. Smaller manufacturers lacking this leverage remain more exposed to spot market price swings during periods of tight availability. These agreements typically span two to three years across major suppliers.

In-House Materials Synthesis Capability Investment

Some manufacturers are investing in in-house emissive materials synthesis capability to reduce dependence on external suppliers for critical deposition inputs. This investment requires meaningful upfront capital but reduces long-term exposure to third-party pricing and availability fluctuations. Manufacturers pursuing this expect payback within roughly three years. of sustained deployment volume growth across manufacturing facilities globally.

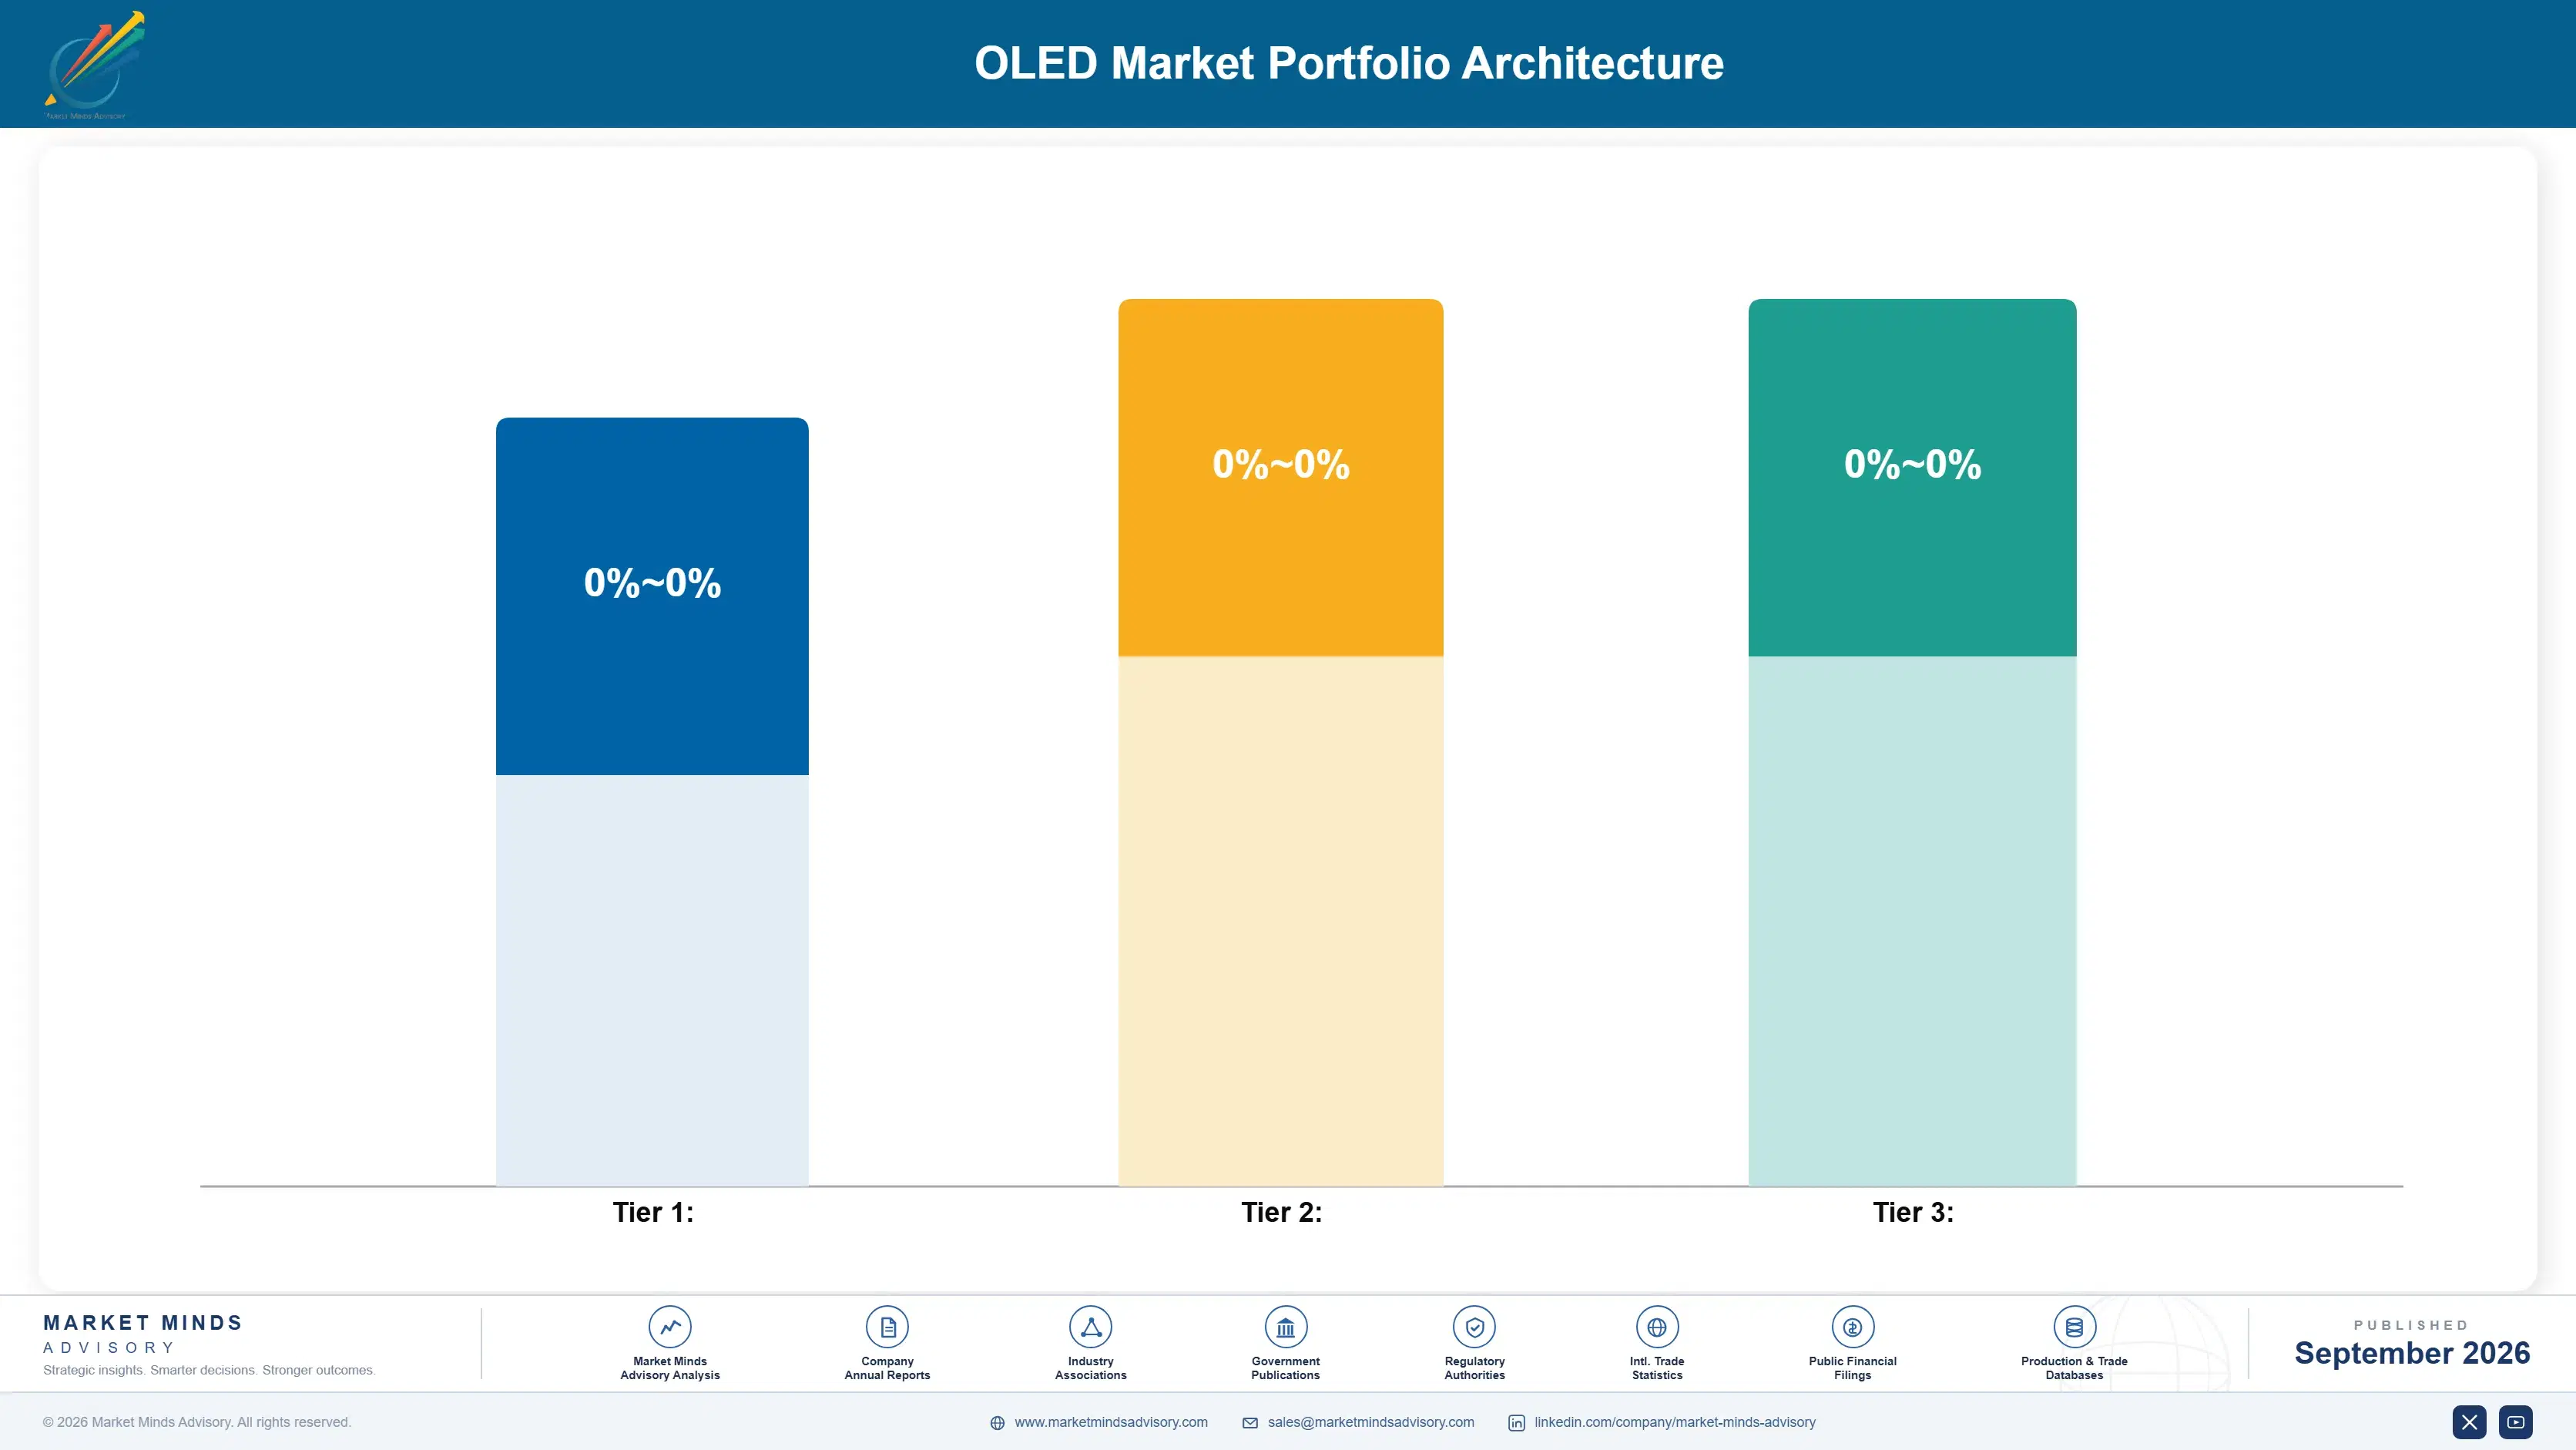
Portfolio Architecture for Margin Defence

OLED manufacturers run distinctly different margin economics across their product tiers, with basic rigid panels sold at competitive pricing against a growing field of Chinese entrants, while flexible and microdisplay tiers carry meaningfully higher gross margins that reflect real manufacturing engineering complexity rather than brand premium alone, a gap that keeps widening as foldable adoption grows.
The tension between volume and premium tiers is intensifying as flexible substrate manufacturing spreads beyond the largest device makers who adopted foldable panels earliest, pulling mid-range smartphone makers toward flexibility capability that used to be reserved for flagship devices exclusively. Manufacturers that cannot differentiate premium tiers beyond basic rigid panels are seeing commoditization pressure spread upward through the market faster than most anticipated. That commoditization pressure is only becoming more pronounced with time.

High-value margin pools concentrate around flexible and foldable panels, microdisplay licensing, and multi-product device maker consolidation agreements, all of which combine deep engineering investment with genuine switching-cost lock-in once a device design's panel specification lives permanently inside the customer's qualified architecture. Basic rigid panels generate steady but increasingly thin margins that continue eroding as Chinese manufacturers multiply capacity. That divergence deepens with every new panel generation.

Basic rigid OLED panels sold to smaller device makers and less demanding applications, priced competitively against numerous Chinese entrants with minimal switching friction for cost-conscious customers. with minimal upfront investment required.
Gross Margin

Flexible and foldable panels, documented durability certification, and automotive-grade qualification sold primarily to premium device makers preparing for flagship product launches and vehicle interior programs. across every major device category.
Gross Margin

Multi-product consolidation agreements, microdisplay licensing, and emerging micro-LED hybrid capability aimed at customers managing evolving display technology competition that continues intensifying year over year. and downstream regulatory pressures today. across the industry.
Gross Margin
oled-market-portfolio-architecture-1789990472422

High-value Sub-segments and Strategic Watch-out

Flexible and Foldable OLED Displays

The highest-value, highest-growth segment as foldable smartphone adoption accelerates across major device makers, requiring substrate durability that legacy rigid panels were never designed to support at this scale. forcing rapid vendor re-engineering across nearly every established manufacturer right now today. globally across every product category. right now today.

Micro-OLED (Microdisplay) Panels

High-value with more moderate growth, driven by augmented reality headset adoption rather than new market expansion, sold primarily as a premium tier to existing customers already committed to a qualified supplier relationship. and its downstream headset product roadmap ahead. for the foreseeable future ahead. and beyond.

Rigid OLED Displays

The volume core of the market, serving standard smartphone and television applications with reliable but less differentiated performance, generating steady but thinner margins than the premium tiers above it. across virtually every geography and device type currently served. worldwide right now for every application. currently served.

OLED Lighting Panels

A strategic watch-out as LED lighting alternatives improve efficiency and threaten to compress standalone OLED lighting margins from below, particularly among applications wanting a single cost-effective solution instead. to reduce total integration cost over time. over the long run for every application type. currently served.

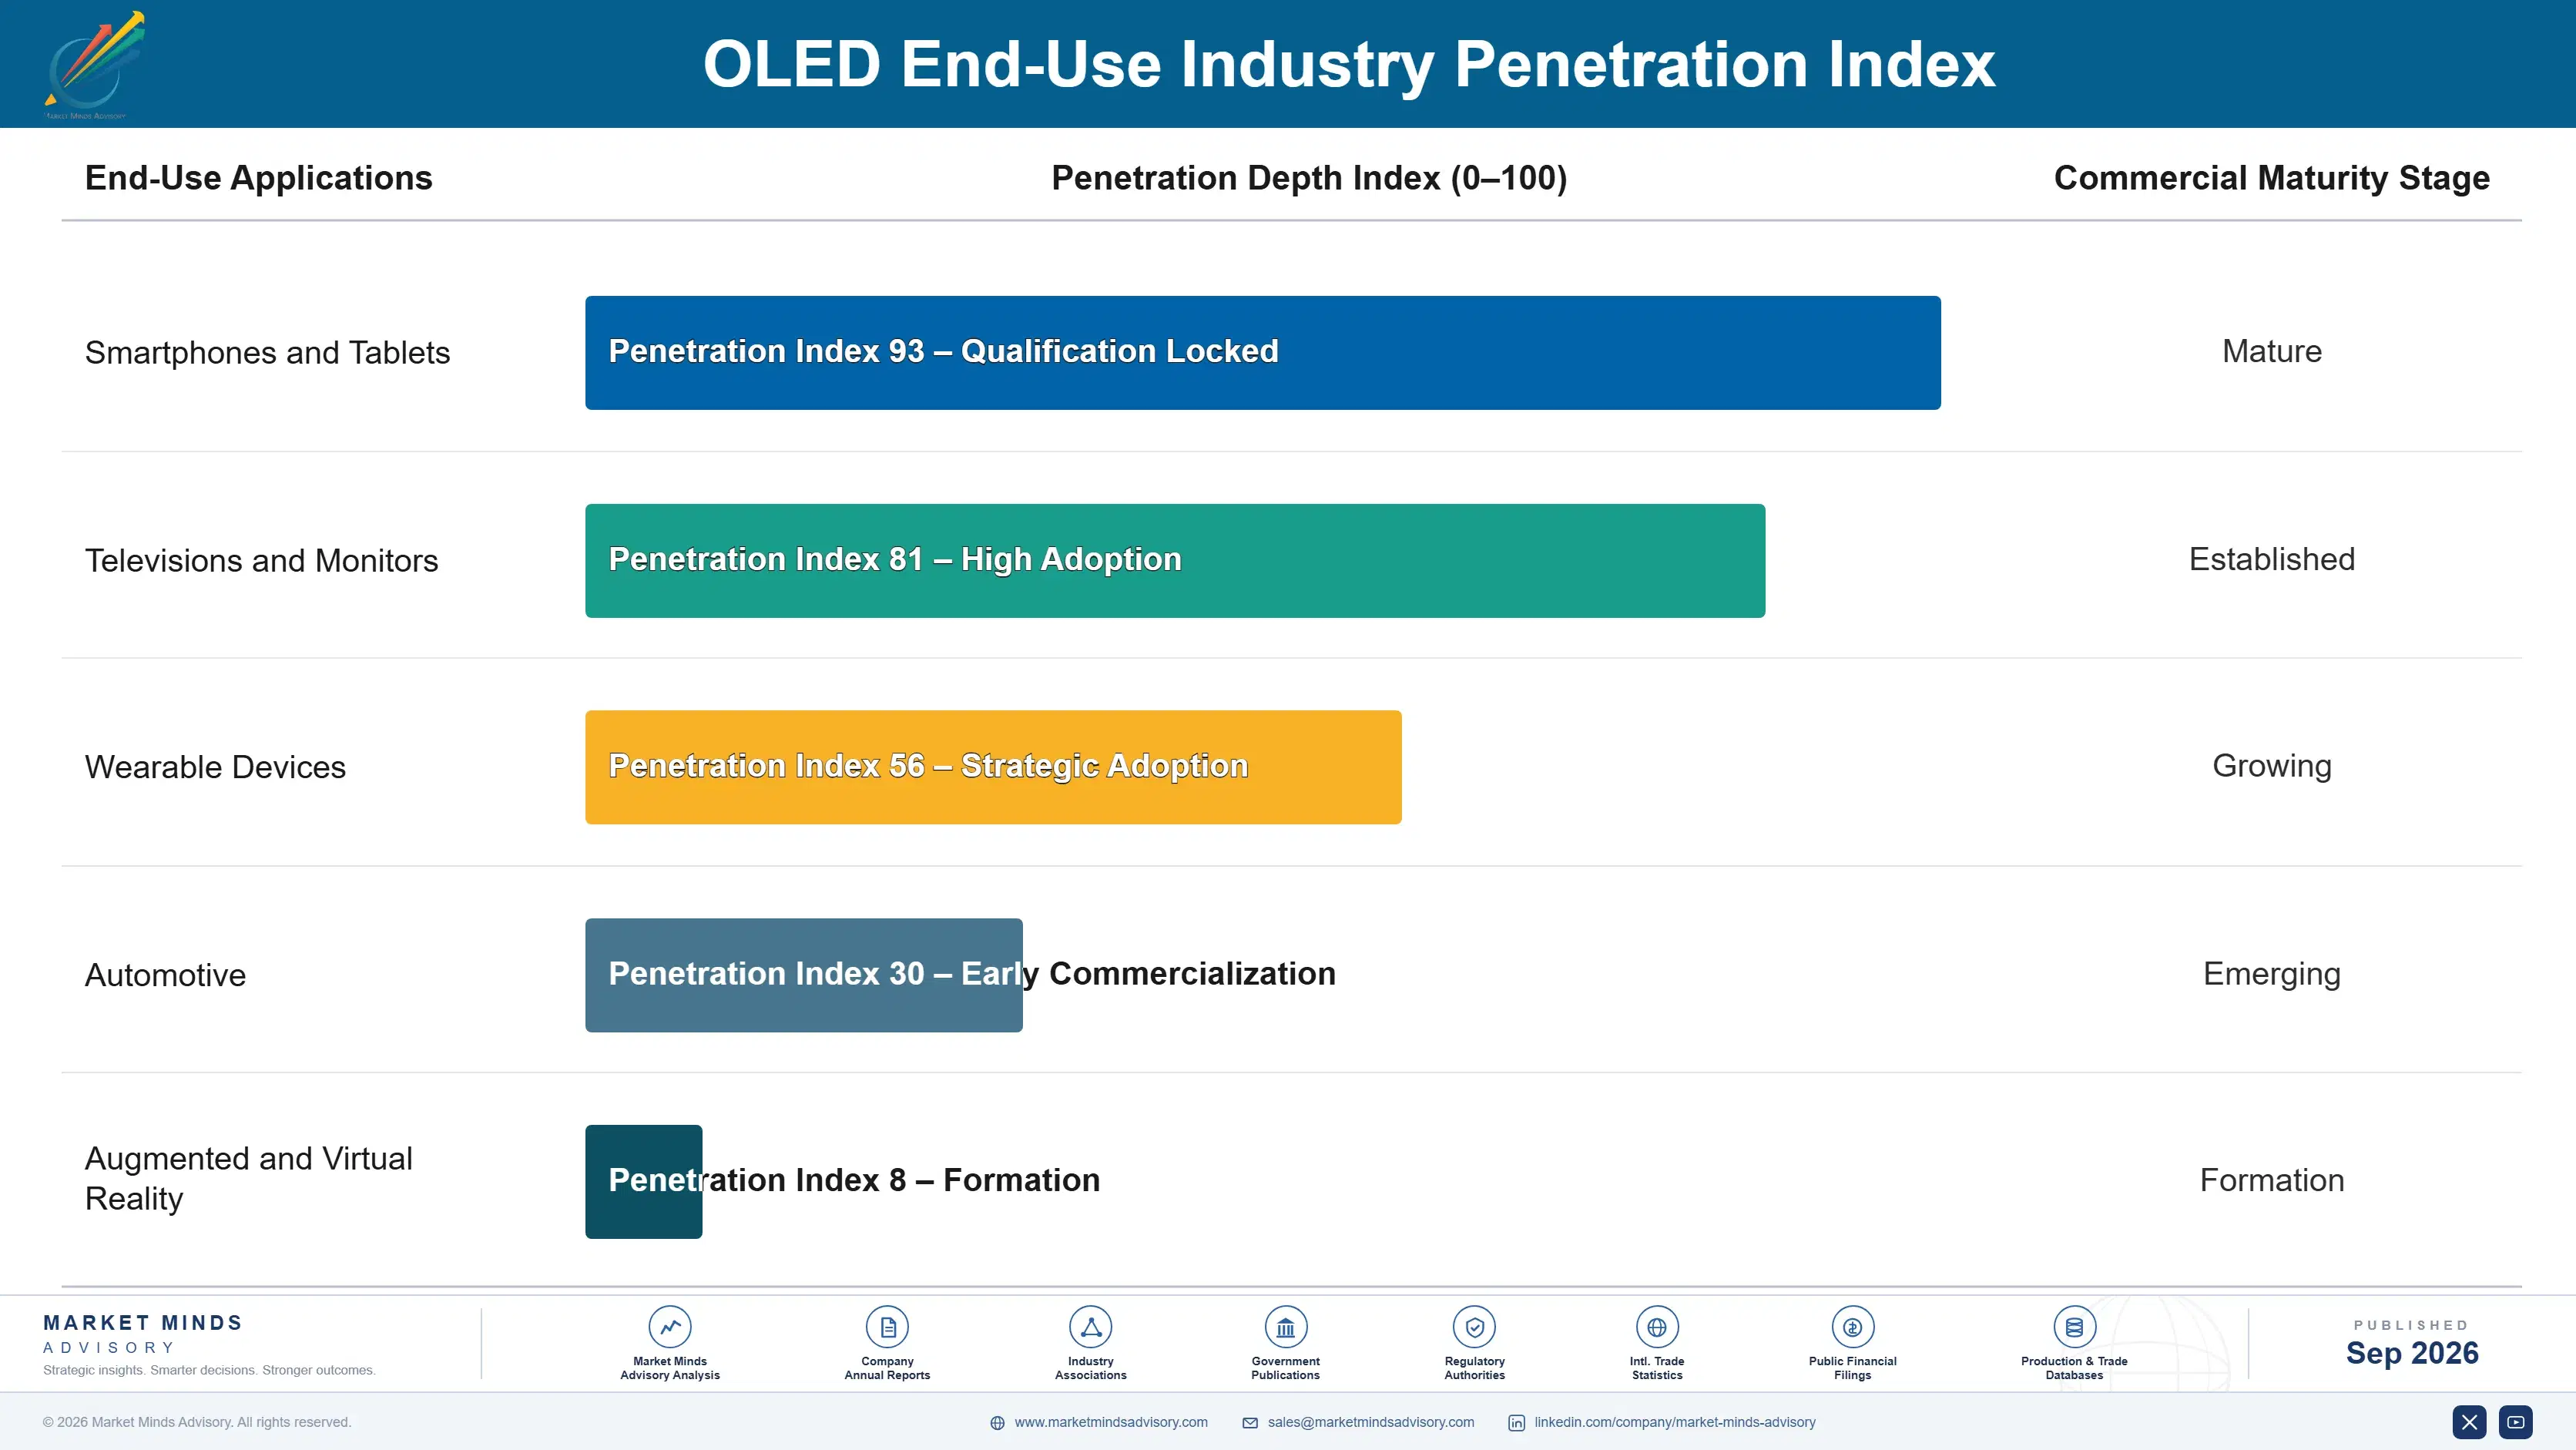
Design Wins as Multi-Year Annuities

OLED panel relationships behave like annuities once a device design is qualified, since a customer's product architecture and manufacturing tooling become tied to that specific panel's dimensions and interface specifications within months of design freeze. Switching panel suppliers means redesigning device architecture around a competitor's specifications, a cost that keeps gross design retention rates well above eighty-five percent across the category even when competitors offer meaningfully lower unit pricing.
Adoption depth varies considerably by end-use vertical. Smartphone and wearable manufacturers show the deepest platform dependency, since design cycles require consistent, high-frequency panel sourcing that reinforces supplier preference across product generations. Automotive and industrial customers adopt more gradually but at higher per-unit value, where reliability certification and long product lifecycles matter more than raw cost, giving suppliers a long runway of incremental feature adoption.

Buyer profiles are shifting generationally as device designers who grew up specifying rigid LCD panels give way to a cohort fluent in flexible, foldable display architecture from the start of their careers. That newer generation evaluates panel suppliers more like design partners than commodity component vendors, weighing manufacturing yield consistency and durability testing depth alongside traditional cost criteria when making procurement decisions.
oled-market-end-use-penetration-index-1789990472906

Where MMA Sees the Advantage

These are among the four positions where our research anticipates prominent divergence between winners and laggards over the coming forecast period. Each is grounded in the demand model, the regulatory perimeter, and the announced capacity pipeline.
01 / FLEXIBLE MANUFACTURING SCALE

Build foldable production capacity before rivals reach it

Manufacturers that invest early in high-volume flexible substrate manufacturing capacity hold a durable edge as foldable device adoption accelerates across nearly every major smartphone maker simultaneously and without pause. This capability is genuinely difficult to build quickly, which is exactly why manufacturers without it are losing design wins to specialists with proven flexible manufacturing throughput today. MMA expects this gap to widen considerably further before it narrows, rewarding manufacturers willing to invest in production capacity now rather than waiting until later.
02 / DURABILITY CERTIFICATION PACKAGING

Bundle documented fold-cycle testing as a premium tier

Device makers preparing for flagship product launches pay considerably more for manufacturers that provide documented fold-cycle durability data than for manufacturers offering basic panels without validation testing, and that gap is only growing wider with each passing model year. That willingness to pay is not yet fully priced into most manufacturers' current pricing structures across the category today. Real margin is being left on the table for any manufacturer willing to formalize this documentation into a distinct, clearly marketed service tier.
03 / MICRODISPLAY HEADSET EXPANSION

Target headset makers scaling augmented reality product lines

Headset makers scaling augmented and virtual reality product lines represent the highest-value expansion opportunity in the category, since few competitors have built genuinely convincing microdisplay pixel density at truly meaningful yield today across every product type. This gap is exactly why microdisplay licensing deals command considerably higher margins once a headset maker adopts them across its entire product lineup. MMA sees this segment as considerably underserved relative to its genuine commercial value, and expects competition here to intensify quite markedly.
04 / MICRO-LED COMPETITIVE THREAT

Watch micro-LED technology mature in premium large-format displays

Micro-LED technology maturing faster than expected in premium large-format display categories poses the clearest competitive threat to established OLED manufacturers over the next several years, particularly among manufacturers genuinely unwilling to invest in hybrid display research today at all. Incumbent OLED manufacturers that fail to differentiate meaningfully beyond current brightness and longevity limitations risk losing exactly the accounts that fund their growth today and well into tomorrow. MMA expects this competitive pressure to intensify rather than fade anytime soon now.

Engagement Snapshot From the Field

A live engagement with an industry participant carrying material or product regulatory and market exposure ahead of a defining policy shift, showing how our research translates into a defensible multi-year portfolio strategy.
MARKET MINDS ADVISORY · CLIENT ENGAGEMENT SUMMARY
OLED Producer Strategic Portfolio Review and Transition Roadmap 2026·Investment Scenario on OLED Exposure Evaluation 2025-26
CLIENT PROFILE
The client is a mid-size smartphone brand launching its first foldable device, having previously used only rigid OLED panels sourced from a single long-standing supplier. Engineering leadership had no prior experience evaluating flexible panel vendors and faced a fixed product launch date tied to a major retail partnership that could not be delayed without significant financial and reputational cost.
STRATEGIC CHALLENGE
Product leadership needed to select a flexible panel vendor capable of meeting fold-cycle durability requirements within a compressed timeline without deep internal display expertise to evaluate competing durability claims independently. A wrong choice risked delaying the product launch and damaging the brand's retail partnership. Board members were also concerned about the financial exposure from missing the committed launch window entirely.
MMA APPROACH
MMA analysts benchmarked five leading flexible panel vendors against a consistent commercially relevant basis covering documented fold-cycle durability data, manufacturing capacity, and integration timeline for comparable foldable device programs. Analysts also interviewed reference smartphone brands directly to validate vendor marketing claims independently before finalizing a recommendation. This cross-referencing surfaced meaningful discrepancies between vendor-reported durability testing and what comparable brands had actually experienced.
KEY FINDINGS
  1. Only two of the five evaluated vendors had independently verified fold-cycle durability data credible enough to support the compressed, tight launch timeline.
  2. Panel yield rates varied enormously across vendors, with the strongest candidate showing meaningfully fewer defects during pilot production runs consistently and overall.
  3. Vendor pricing models diverged sharply between flat per-unit pricing and volume-tiered discount structures, with tiered discounts proving more cost-effective at the client's target scale.
  4. Two vendors lacked prior experience with the client's specific hinge mechanism design, requiring considerable additional integration testing before either could be approved.
CLIENT PROFILE
The client is a mid-size smartphone brand launching its first foldable device, having previously used only rigid OLED panels sourced from a single long-standing supplier. Engineering leadership had no prior experience evaluating flexible panel vendors and faced a fixed product launch date tied to a major retail partnership that could not be delayed without significant financial and reputational cost.
STRATEGIC CHALLENGE
Product leadership needed to select a flexible panel vendor capable of meeting fold-cycle durability requirements within a compressed timeline without deep internal display expertise to evaluate competing durability claims independently. A wrong choice risked delaying the product launch and damaging the brand's retail partnership. Board members were also concerned about the financial exposure from missing the committed launch window entirely.
MMA APPROACH
MMA analysts benchmarked five leading flexible panel vendors against a consistent commercially relevant basis covering documented fold-cycle durability data, manufacturing capacity, and integration timeline for comparable foldable device programs. Analysts also interviewed reference smartphone brands directly to validate vendor marketing claims independently before finalizing a recommendation. This cross-referencing surfaced meaningful discrepancies between vendor-reported durability testing and what comparable brands had actually experienced.
KEY FINDINGS
  1. Only two of the five evaluated vendors had independently verified fold-cycle durability data credible enough to support the compressed, tight launch timeline.
  2. Panel yield rates varied enormously across vendors, with the strongest candidate showing meaningfully fewer defects during pilot production runs consistently and overall.
  3. Vendor pricing models diverged sharply between flat per-unit pricing and volume-tiered discount structures, with tiered discounts proving more cost-effective at the client's target scale.
  4. Two vendors lacked prior experience with the client's specific hinge mechanism design, requiring considerable additional integration testing before either could be approved.
RECOMMENDED STRATEGY
Phase 1: Select the vendor with the strongest verified fold-cycle durability data and negotiate a volume-tiered pricing structure right away immediately today. Phase 2: Begin integration testing immediately on a pilot production batch before committing to the full product-wide rollout that was originally planned. Phase 3: Require weekly manufacturing status reporting through the production process to catch delays before they affect the planned launch date entirely.
OUTCOME
The brand selected its preferred vendor and completed panel production within the required timeline, launching its foldable device on schedule with the retail partnership intact. Leadership credited the independent vendor comparison with avoiding a costly delay that would have jeopardized the retail launch (client-reported, unverified by MMA).

Frequently Asked Questions

Foundational context covering the market sizes, CAGR, scope, country, region and competition that inform every finding below. This section is provided to cover basics and most often pre-purchase conversations, answered from the MMA Primary Research Dataset.

What is the current size of the OLED Market?

The OLED Market reached approximately $52.0 billion in 2025. This figure covers organic light-emitting diode display panels used in smartphones, televisions, wearables, and automotive displays.

How large will the OLED Market be by 2036?

MMA projects the market will reach approximately $173.9 billion by 2036 under the base case scenario. That represents roughly three times its 2026 starting value over the forecast period.

What is the CAGR for the OLED Market 2026 to 2036?

The base case CAGR is 11.6% across the 2026 to 2036 forecast period. Bull and bear scenarios range from roughly 10.4% to 12.8% depending on foldable device adoption pace.

Which segment is growing fastest?

Flexible and Foldable OLED Displays is growing fastest at a 19.4% CAGR, roughly 1.67 times the overall market rate. Demand is concentrated among smartphone makers scaling foldable device lineups.

Who are the major companies in the OLED Market?

Samsung Display, LG Display, BOE Technology, Visionox, and Tianma Microelectronics are the five leading manufacturers evaluated on shipped panel volume. The top five hold roughly 78% combined share.

Which country is growing fastest?

China is growing fastest at a 14.2% CAGR, driven by BOE Technology and Visionox rapidly expanding domestic flexible substrate manufacturing capacity to close the technology gap.

Report Segmentation Architecture

The full report scope spans multiple orthogonal segmentation dimensions, with cross-tabulated demand data provided for each dimension pair. Coverage extends further to regional breakdowns, trend trajectories, and the competitive detail needed to support segment-level decision-making.

By Primary Market Dimension

  • AMOLED (Active-Matrix OLED) Displays
  • Flexible and Foldable OLED Displays
  • Rigid OLED Displays
  • OLED Lighting Panels
  • Micro-OLED (Microdisplay) Panels
  • OLED Materials and Manufacturing Equipment

By End-Use Industry

  • Smartphones and Tablets
  • Televisions and Monitors
  • Wearable Devices
  • Automotive
  • Augmented and Virtual Reality

By Commercial Dimension

  • Original Equipment Manufacturers
  • Headset and Wearable Brands
  • Direct Sales Channel
  • Licensing Channel

By Region

  • North America
  • Western Europe
  • East Asia
  • South Asia and Pacific
  • Latin America
  • Middle East and Africa
  • Eastern Europe

Scope, Methodology, and Coverage

Every figure in this report is reproducible from documented input assumptions. The scope below maps the historical period, the forecast horizon, the segmentation dimensions, and the countries covered, alongside the underlying primary and qualitative methodology.
Historical Period
2020 to 2025
Forecast Period
2026 to 2036
Base Year
2025 (USD billions; MMA Primary Research Dataset, September 2026)
Market Definition
This report defines the OLED Market as organic light-emitting diode display panels and lighting products used in smartphones, televisions, wearables, automotive displays, and lighting applications. It excludes LCD and micro-LED display technologies and OLED materials sold as standalone chemical inputs.
Quantitative Units
USD billions, percentage CAGR
Segmentation Dimensions
By Primary Market Dimension, By End-Use Industry, By Commercial Dimension, By Region
Regions Covered
North America, Western Europe, East Asia, South Asia and Pacific, Latin America, Middle East and Africa, Eastern Europe
Countries Covered
South Korea, China, Japan, United States, Germany, United Kingdom, France, India, Australia, Brazil, Mexico, Saudi Arabia, United Arab Emirates, South Africa, Poland, Vietnam
Key Companies Profiled
Samsung Display, LG Display, BOE Technology, Visionox, Tianma Microelectronics, and 15 additional named competitors
Quantitative Methodology
Primary survey, n=3,800 respondents, Q4 2025, six countries; demand-side model with trade association cross-validation
Qualitative Methodology
47 expert interviews, Q4 2025; applied to validate demand model assumptions, identify emerging dynamics, and assess competitive positioning
Report Format
PDF and XLSX data workbook (Word format preview document)
Publisher
Market Minds Advisory
Report Code
MMA-2026-TEC-247
Published
September 2026
Contact
sales@marketmindsadvisory.com | www.marketmindsadvisory.com

Purchase the full OLED Market Report (2026 to 2036).

This report provides a comprehensive analysis of the global OLED Market through 2036, covering market sizing and segmentation trends. It maps regional demand patterns across all seven major world regions and examines competitive dynamics among leading panel manufacturers. The analysis also covers input cost exposure and revenue diversification strategies available to market participants. It draws on primary survey data from 3,800 respondents and 47 expert interviews conducted in the fourth quarter of 2025. Readers gain a structured view of where flexible substrate adoption is heading and which commercial strategies are working.
Detailed market sizing and ten-year forecast
Segment-level growth and market share analysis
Regional demand and competitive intensity mapping
Profiles of twenty leading OLED manufacturers
Revenue diversification and pricing strategy insights
Primary survey and expert interview data

Built For The People Who Decide

From boardroom strategy to bench-side execution, this report is read cover-to-cover by leaders shaping the next decade of their industry, turning demand scenarios, market dynamics and valuation benchmarks into decisions.
CXOs/ Presidents/ VPs/ Managers
M&A and Corporate Development
Strategy Teams and R&D Heads
Procurement and Product Directors
Regulatory and Compliance Leaders
Investor Relations and Equity Analysts