Market Minds Advisory
Old Corrugated Containers Market

Old Corrugated Containers Market: E-Commerce Volume and Export Grade Trading Redraw Recovered Fiber Economics

Paper mills are competing harder for consistent old corrugated container supply as recycled content mandates tighten, forcing recovery operators to expand collection density faster than typical infrastructure cycles allow while export trading keeps shifting.

Lead Analyst

Bilal Shaikh

Published

September 2026

Make Smarter Decisions with Customized Research Insights

Request a free sample report and evaluate market opportunities, growth trends, and competitive dynamics relevant to your business needs.

2025 MARKET VALUE$28.0BMarket Size 2025
2036 FORECAST VALUE$45.4BBase Case , 2026 to 2036
CAGR 2026 TO 20364.5 %Bull 5.8% / Bear 3.2%
INCREMENTAL OPPORTUNITY$16.2BNet 10- year value creation
EXPANSION MULTIPLE1.55x2036 value over 2026 base
Strategic Levers
M&A Pipeline
Regional Outlook
Country Rankings
Competitive Intelligence
Segmental Deep-dive
Call-Us : 91 93563 13602

Executive Snapshot and Market Trajectory

Paper mills are competing harder for consistent old corrugated container supply as recycled content mandates tighten faster than collection infrastructure investment cycles allow, reshaping which recovery operators secure long-term mill supply contracts across most major consumer markets and every price tier and region tracked.
E-commerce reverse logistics is the second clear growth driver, and commercial momentum concentrates in retail back-of-store and residential curbside collection channels, where consistent bale quality increasingly determines which recovery operator wins a mill's supply contract ahead of price alone. East Asia leads regional volume by a wide margin, reflecting China's unmatched containerboard recycling capacity and its position as the dominant consumer of recovered fiber globally and domestically.
No single recovery operator holds commanding share, and five players together account for roughly a third of global revenue, reflecting a fragmented field where regional waste haulers and material recovery facilities compete credibly against integrated paper company collection networks across most price tiers and served geographies worldwide today and beyond. Export grade quality and mill supply contracts shape purchasing decisions as much as collection volume does, and that dependency keeps deepening as compliance scrutiny intensifies.
Market Definition
The Old Corrugated Containers Market covers the collection, sorting, baling, and trading of recovered corrugated cardboard as a recycled fiber feedstock for containerboard and other paper grade production, spanning pre-consumer industrial and post-consumer residential and retail sources. It excludes virgin kraft linerboard production, mixed paper grades other than corrugated, and finished containerboard or box manufacturing sold as separate categories.
Base Year Value
$28.0B in 2025 (MMA Primary Research Dataset, August 2026)
Forecast Period
2026 to 2036, eleven discrete annual values
CAGR
4.5% base case. Bull 5.8%. Bear 3.2%.
Fastest Growth Segment
E-Commerce Reverse Logistics OCC: 7.5% CAGR
Fastest Growth Country
Vietnam: 6.5% CAGR
Fastest Growth Region
South Asia and Pacific: 6.0% CAGR
Largest Region
East Asia: 33% of 2025 global value
Market Leaders
Smurfit WestRock plc, International Paper Company, Waste Management Inc, Republic Services Inc, Pratt Industries Inc. Source: MMA Analysis based on company annual reports.
Primary Survey
n=3,800 procurement and R&D decision-makers, Q4 2025, six countries
Methodology
Demand-side build-up, cross-validated against public data, 47 expert interviews

Old Corrugated Containers Market Forecast Scenarios

old-corrugated-containers-market-size-forecast-scenario-1787308169905
Between 2020 and 2025 the market grew steadily as e-commerce packaging volume expanded recovered fiber generation across most major consumer markets and product categories, interrupted briefly by China's import restrictions on recovered paper in 2021 before recovering through 2022 as Southeast Asian mills absorbed redirected export volume and containerboard demand normalized. The historical CAGR ran at roughly 3.5%.
The base case assumes steady 4.5% annual growth through 2036, anchored to three commercial mechanisms: rising e-commerce packaging volume expanding recovered fiber generation across most major consumer markets worldwide and every distribution channel and warehouse type, recycled content mandates pushing containerboard mills toward higher-quality consistent OCC supply contracts across most producing regions and geographies, and export grade trading shifting toward Southeast Asian and South Asian mills expanding their own recycled containerboard production capacity.
The bull case centers on recycled content mandates tightening faster than currently modeled across additional major containerboard-producing markets and geographies worldwide and well beyond. The bear case centers on continued trade policy disruption affecting export grade flows, compressing recovery operator margins enough to delay collection infrastructure investment for smaller regional operators facing tighter capital constraints.

Bale Quality Reshapes Mill Supply Economics

Containerboard mills increasingly treat consistent bale quality as a mandatory supply specification rather than a negotiable preference, since contamination and moisture variability now directly affect mill production efficiency and recycled content compliance documentation across most producing regions, account tiers, mill categories, grade classifications, export destinations, contract structures, audit requirements, and quality benchmarks tracked worldwide.
MARKET CONCENTRATIONCR5 32%Reflects a fragmented field of regional recovery operators
AVERAGE SELLING PRICE$95-185 per tonVaries considerably by grade and export destination market
TOP PRODUCING COUNTRYUnited States, 22% shareLargest base of recovered corrugated collection infrastructure available
TRADE INTENSITY34% cross-border volumeShare of recovered fiber sold outside its country of collection
RECOVERY RATE88-92% of generated volumeTypical share of corrugated packaging recovered for recycling
CONTAMINATION RATE3-8% of collected balesTypical non-fiber contamination share affecting overall bale grade
Collection density now shapes which recovery operator wins a mill's long-term supply contract more than spot price alone does, since a recovery operator without consistent volume creates supply reliability risk that mills increasingly refuse to accept regardless of the cost savings from a cheaper but less consistent supplier lacking comparable track record, certification history, audit documentation, quality assurance, reliable delivery windows, long-term account stability, and demonstrated overall reliability.
Over the next decade, integrated recovery networks combining residential curbside, retail back-of-store, and e-commerce reverse logistics collection will likely become the default supply model for major containerboard mills, narrowing the gap between operators built for single-channel volume and those engineered for full-spectrum recovery across every collection channel, geographic market served, mill account type, contract structure negotiated, grading standard applied, and every certification requirement.
"A bale of OCC used to be judged on weight alone. Now a mill will reject a load over moisture content that would have been waved through five years ago."
Director, Materials and Recycling Practice · MMA Chemicals and Materials Practic

Market Trends

Recycled Content Mandates Tighten Mill Supply Requirements

Recycled content regulation across the European Union and an expanding number of North American states is pushing containerboard mills to secure higher-quality, consistently graded OCC supply contracts ahead of tightening compliance documentation deadlines across most producing regions and mill categories. Several major containerboard producers have publicly committed to increasing recycled fiber content in their board grades by 2030, and recovery operators report meaningfully higher long-term contract volume from mills facing the tightest recycled content deadlines compared to mills in markets with more permissive fiber sourcing requirements and longer compliance windows.
Market Impact: Adds roughly 2.5% annual demand gro
E-Commerce Reverse Logistics Expands Collection Channels

E-commerce fulfillment and reverse logistics operations are becoming a meaningful new OCC collection channel as retailers and logistics providers recover corrugated packaging directly from distribution centers rather than relying solely on downstream residential or retail collection across most consumer markets, shipping corridors, and warehouse networks nationwide and abroad. Recovery operators report meaningfully higher e-commerce-sourced OCC volume from logistics providers running dedicated reverse logistics programs than from those without comparable infrastructure, and this gap is widening as more e-commerce operators treat packaging recovery as a measurable sustainability metric and reporting requirement.
Market Impact: Adds roughly 2.0% annual demand gro

Market Opportunities and Growth Drivers

Rising Containerboard Demand Expands Recovered Fiber Need

Containerboard production capacity continues expanding across most major consumer markets as e-commerce and consumer goods packaging volume grows, directly widening the addressable recovered fiber requirement for mills relying on OCC as their primary feedstock and input material. Industry trade association data shows meaningfully rising containerboard production capacity in several large-population countries, and each additional ton of new mill capacity represents incremental OCC demand across the recovery supply chain. This capacity expansion trend is expected to continue for at least the next decade given sustained underlying packaging demand growth across most tracked markets.
Market Impact: Reduces premium grade yield by 12%

Virgin Fiber Cost Pressure Favors Recycled Feedstock

Virgin kraft pulp costs have remained meaningfully elevated relative to recovered fiber across most major producing regions, sustaining a durable cost advantage that continues favoring OCC as the preferred containerboard feedstock over virgin alternatives across most producing mill categories. Mills report meaningfully higher recycled fiber utilization rates among producers citing feedstock cost management as their primary sourcing driver, rather than sustainability positioning alone. This cost-driven recycled fiber preference is expected to persist for at least the next several years given current virgin pulp capacity constraints across most producing regions worldwide.
Market Impact: Compresses export margins by 6 poin

Market Restraints and Challenges

Contamination Rates Limit Premium Grade Availability

Single-stream residential recycling collection continues producing meaningfully higher contamination rates than source-separated commercial collection, limiting how much collected OCC volume qualifies for premium double-sorted grade pricing that mills increasingly demand across most contract negotiations and supply relationships. The root cause is that single-stream collection systems prioritize collection convenience and participation rates over material purity, a tradeoff municipal recycling programs have historically accepted to maximize overall recovery volume across their territories and service areas. Recovery operators are increasingly investing in optical sorting technology to improve contamination removal from single-stream collected material.
Market Impact: Shifts roughly 18% of contract volu

Trade Policy Volatility Disrupts Export Grade Flows

Recovered paper export policy has shown meaningful volatility over the past five years as major importing countries have periodically tightened contamination standards and licensing requirements, disrupting established export grade trade flows and compressing recovery operator margins on short notice across multiple trade routes. The root cause is that recovered fiber import policy remains subject to environmental and trade policy priorities that shift independently of underlying market fundamentals, leaving exporters exposed to abrupt demand loss and pricing shifts. Recovery operators are increasingly diversifying export destinations to reduce dependence on any single importing market.
Market Impact: Expands e-commerce volume 15% yearl
3 additional market trends, 4 additional growth drivers, and 3 additional restraints and challenges are covered in the full report. Contact sales@marketmindsadvisory.com to access the complete intelligence.

Segment CAGR and Growth Architecture

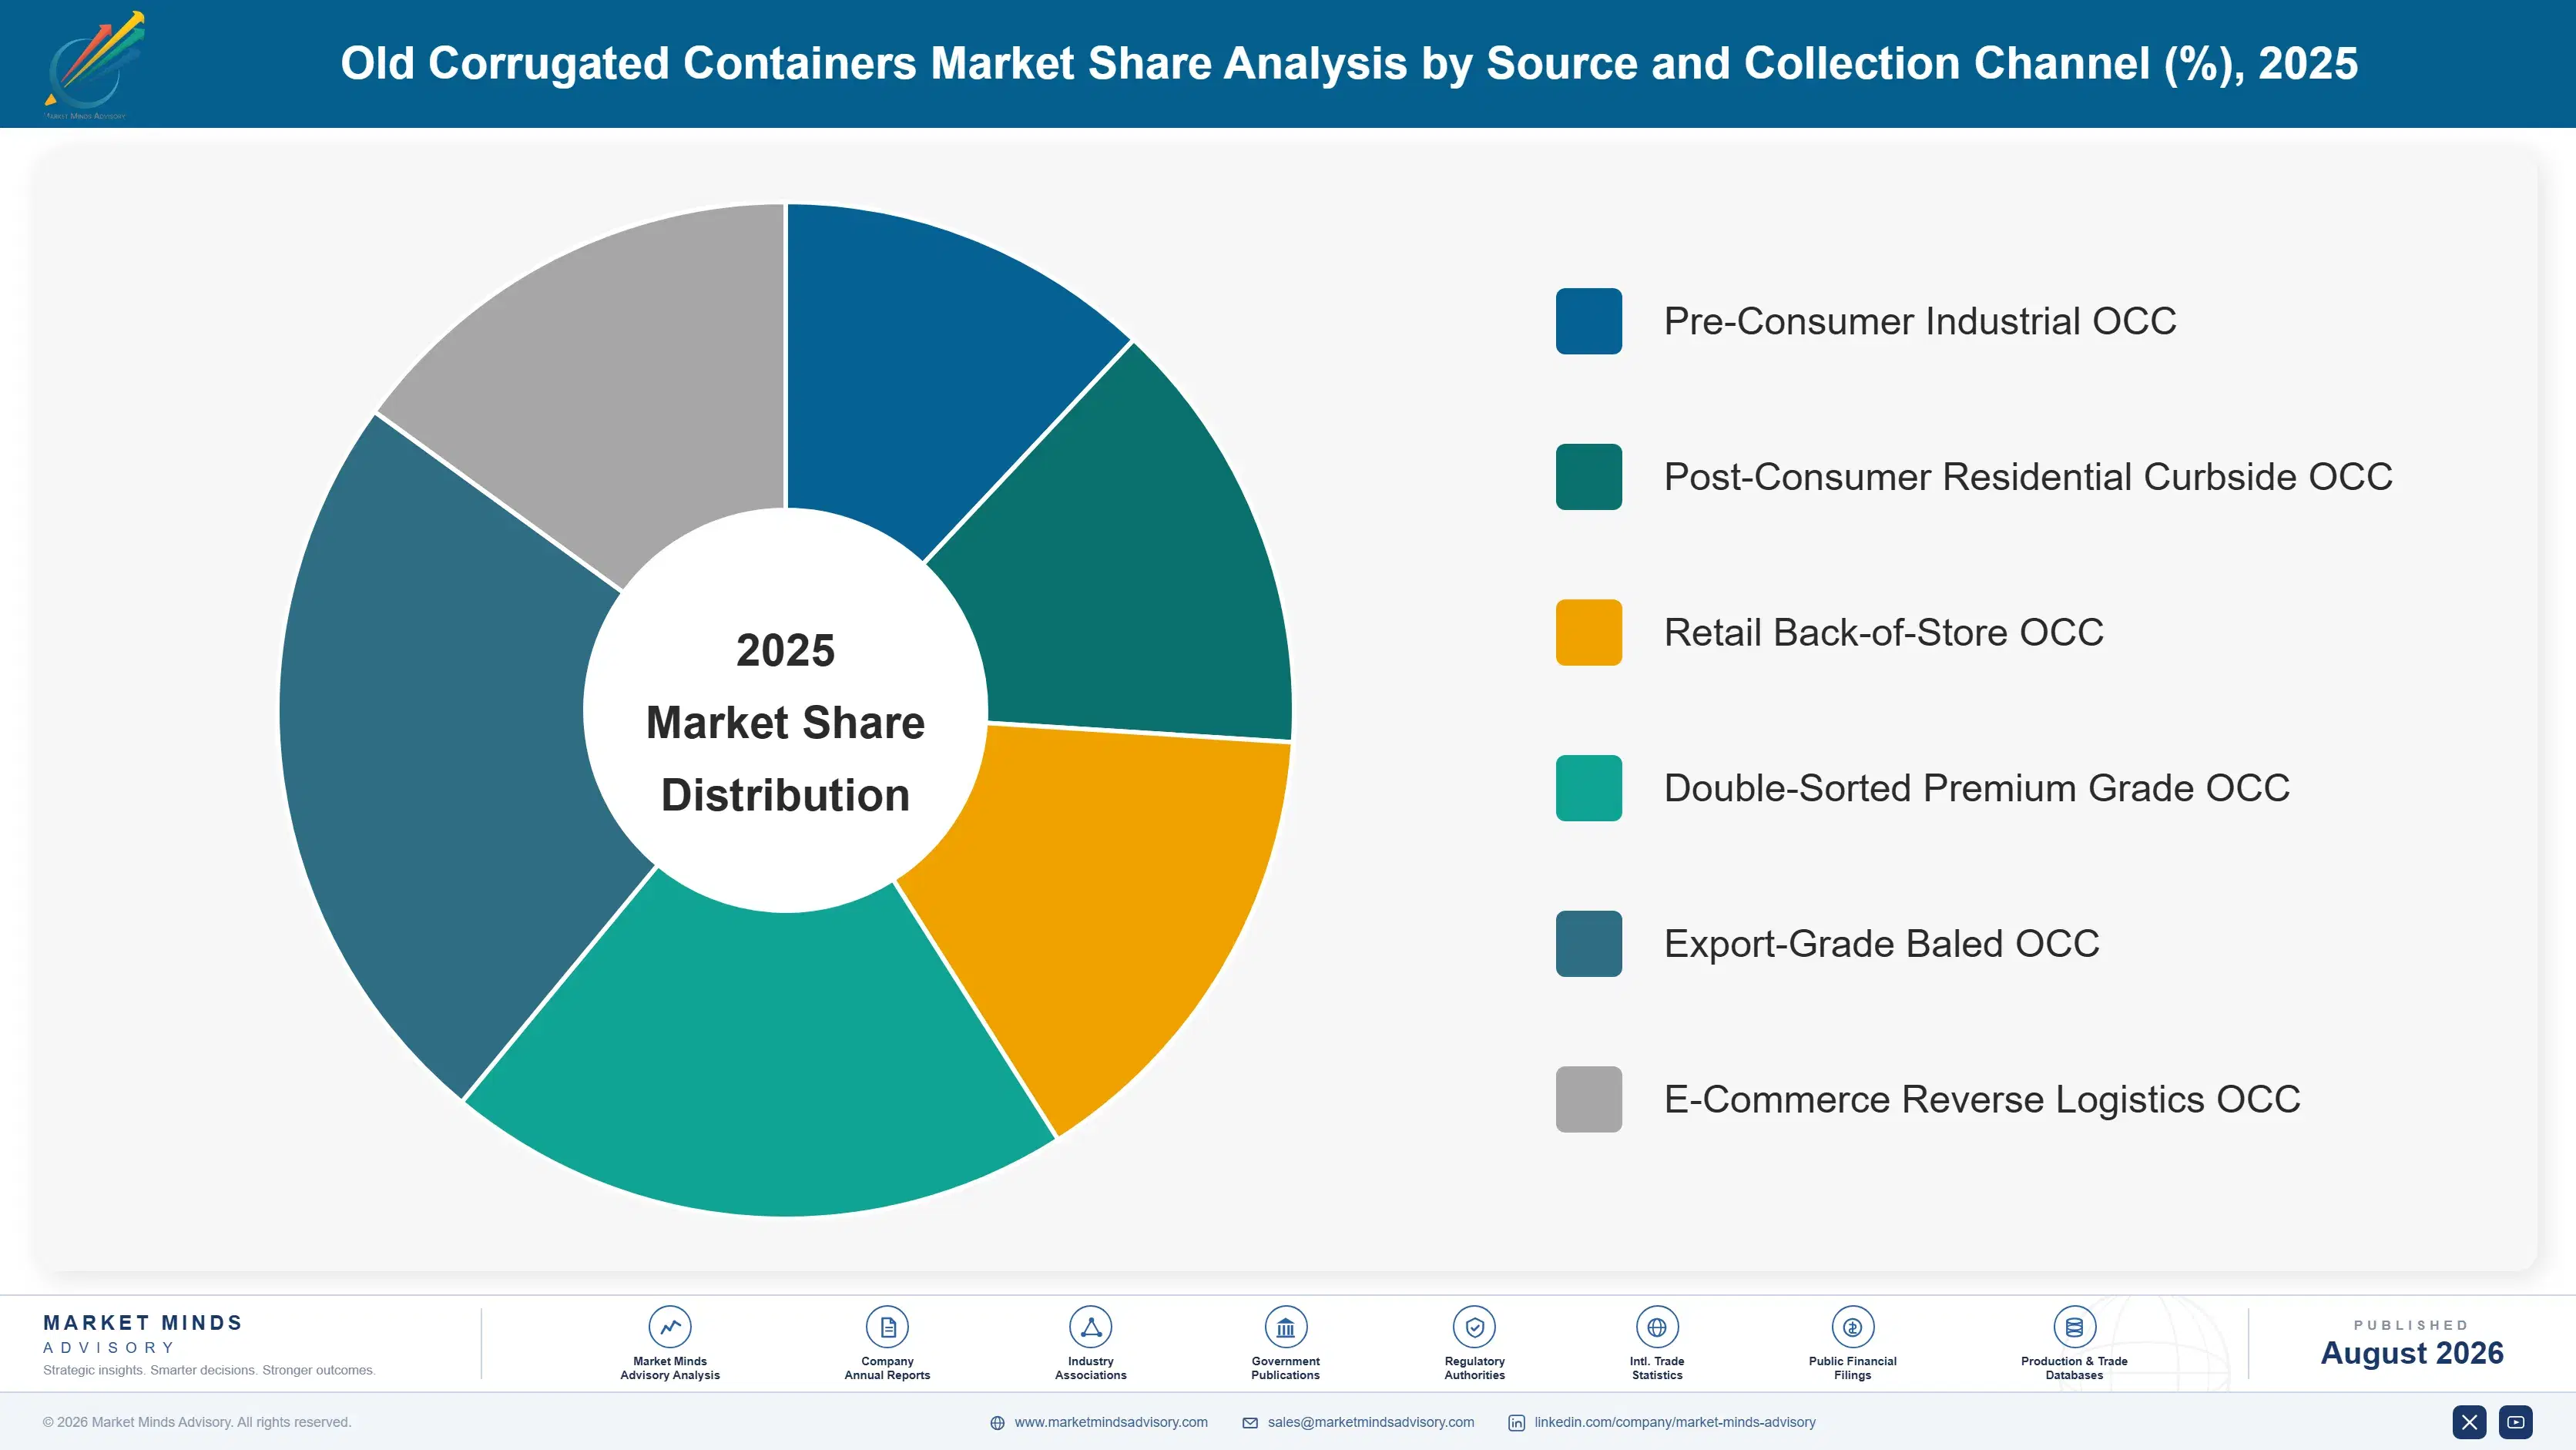
The market segments by source and collection channel, spanning pre-consumer industrial, post-consumer residential curbside, retail back-of-store, double-sorted premium grade, export-grade baled, and e-commerce reverse logistics OCC, since each channel follows a distinct collection infrastructure and bale quality profile across most tracked categories, geographies, account tiers, mill supply relationships, grading standards, and every export route tracked.
old-corrugated-containers-market-market-share-analysis-1787308170443

E-Commerce Reverse Logistics OCC

E-commerce reverse logistics OCC is the fastest-growing segment as retailers and logistics providers increasingly recover corrugated packaging directly from distribution centers rather than relying solely on downstream residential or retail collection channels and municipal recycling systems nationwide and abroad. Recovery operators have invested heavily in dedicated collection infrastructure at fulfillment centers, addressing the logistics coordination gap that historically limited broader e-commerce operator participation in structured recovery programs and sustainability reporting. Major e-commerce and logistics companies increasingly specify dedicated reverse logistics recovery as their default sustainability practice, and recovery operators supplying this segment report meaningfully higher volume growth than operators focused primarily on legacy residential collection channels without comparable infrastructure investment.
CAGR 7.5%

Export-Grade Baled OCC

Export-grade baled OCC is growing quickly as Southeast Asian and South Asian containerboard mills expand recycled production capacity faster than their domestic recovered fiber generation can supply, sustaining strong import demand for consistently graded export bales across multiple trade routes, shipping lanes, and port destinations worldwide. Recovery operators have invested in improving bale density and contamination screening to meet increasingly strict import specifications, addressing quality concerns that historically limited broader mill confidence in export-sourced material and long-distance shipping. Large containerboard producers across the region increasingly specify long-term export supply agreements as their default sourcing strategy, broadening the addressable market considerably beyond the spot-trading-only positioning export OCC held five years ago.
CAGR 6.0%
Full segment breakdown across 6 segments available in the complete report.

Regional Architecture and Country Demand Map

East Asia carries the largest regional share by a wide margin, reflecting China's unmatched containerboard recycling capacity, while South Asia and Pacific posts the fastest regional growth rate off a considerably smaller existing installed base and mill footprint currently tracked across the entire region and country base.

East Asia

China carries a share of regional demand well above the standard band for this market, a concentration justified by its position as the world's largest containerboard producer and consumer of recovered fiber, having built out domestic recycling capacity following its 2018 restriction on imported recovered paper and subsequent domestic collection investment across most provinces. Japan contributes a mature, well-organized collection infrastructure serving domestic mills with consistent, low-contamination bale quality. South Korea's packaging manufacturing sector adds steady additional regional volume tied to its own containerboard production base. Domestic Chinese recovery operators increasingly compete on collection density and sorting technology, reinforcing steady infrastructure investment across most major manufacturing hubs in the region.
Share: 33% | CAGR: 5.5% (2026 to 2036)

North America

The United States carries the largest share of regional demand, supported by a large domestic collection infrastructure alongside strong containerboard mill capacity and export-oriented recovery operations serving multiple international markets and trade routes worldwide and beyond every border. Canada contributes steady additional volume tied to its own recovery infrastructure, often served by the same operators supplying the United States market with comparable collection and baling capability and equipment. E-commerce fulfillment volume growth across both countries has concentrated fresh collection investment near major distribution and logistics hubs and warehouse corridors. Recycled content mandates across an increasing number of states continue pushing mills toward long-term supply contracts ahead of formal regulatory deadlines.
Share: 24% | CAGR: 4.5% (2026 to 2036)
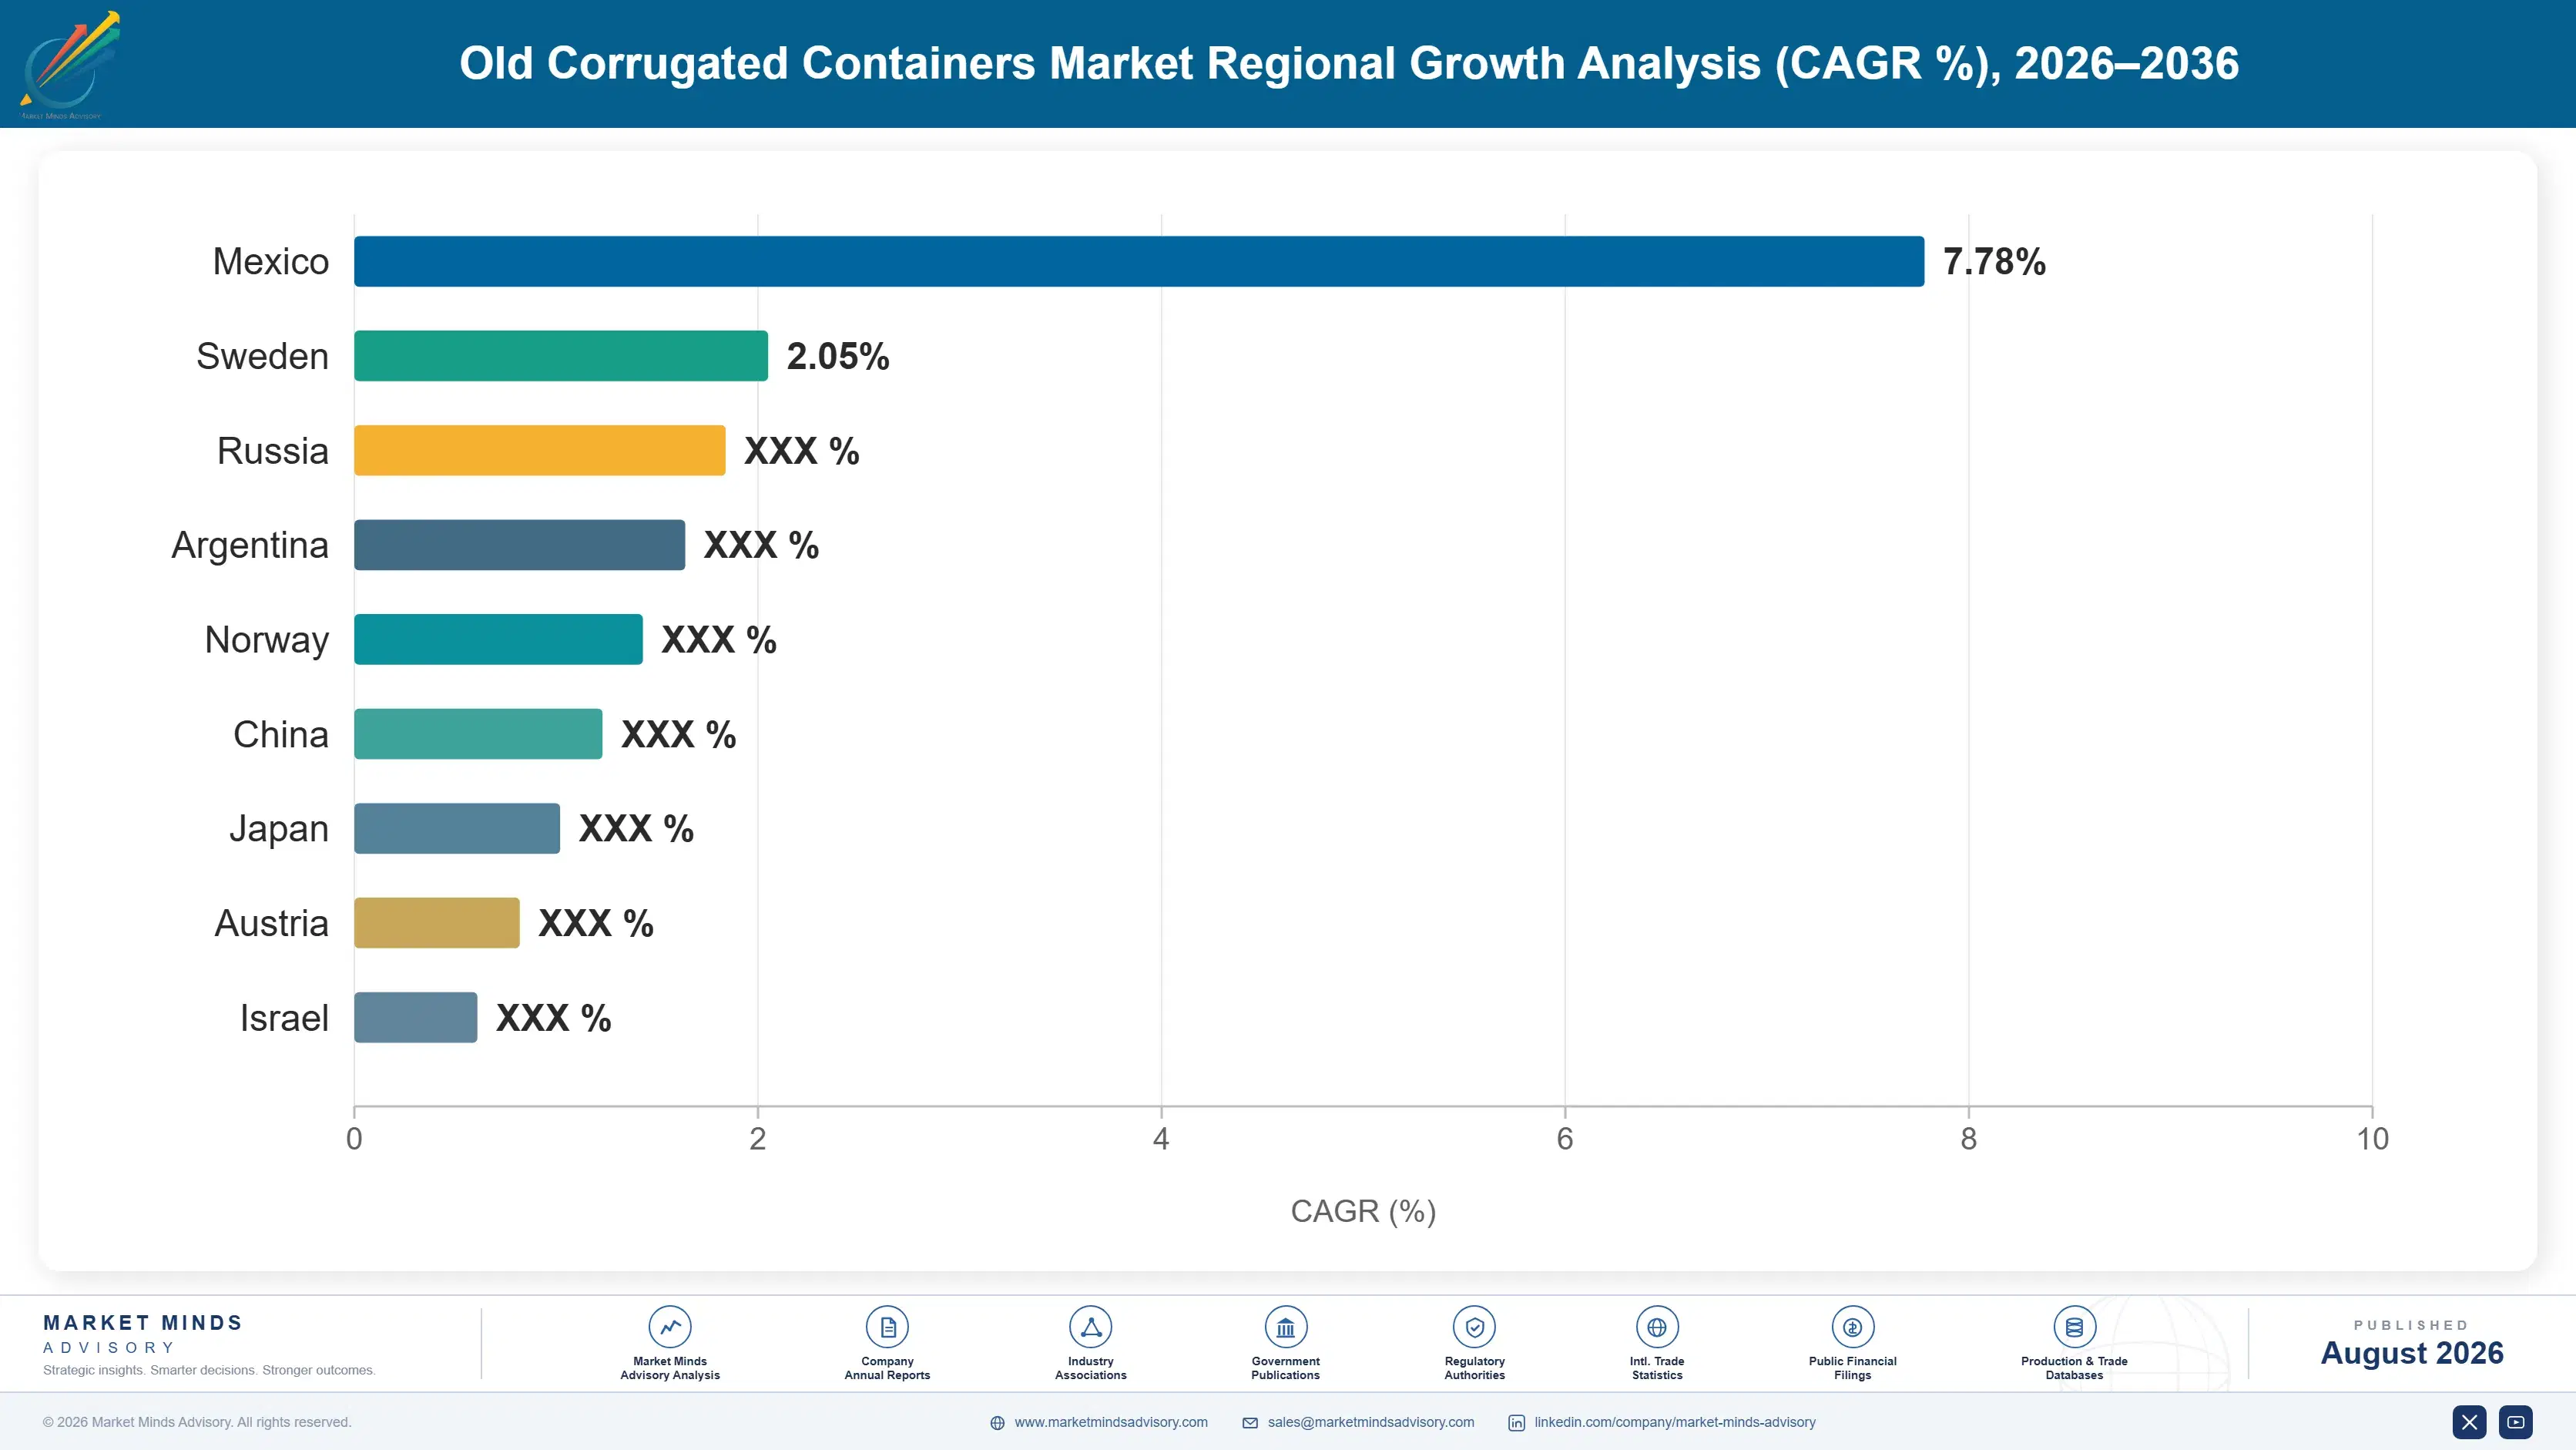
Regional intelligence for 5 additional markets available in the complete report: Western Europe, South Asia and Pacific, Latin America, Middle East and Africa, Eastern Europe. Contact sales@marketmindsadvisory.com.
old-corrugated-containers-market-country-cagr-analysis-1787308170966

Where Recovery Operators Can Grow Margin

Beyond volume growth, recovery operators have several concrete paths to lift revenue per mill account, spanning premium grade sorting services, long-term supply contract agreements, export logistics partnerships, and collection density expansion layered on top of the core recovered fiber sale and its full lifetime value across every account tier, geography, grade category, and mill relationship.

Premium Grade Sorting and Certification Services

Recovery operators increasingly invest in optical sorting and certification services that upgrade mixed OCC into premium double-sorted grade material, converting a commodity transaction into a higher-margin sale worth roughly 15 to 25% more per ton than standard mixed grade pricing across most contract terms and account relationships built over time, volume, and years of steady delivery. Mills favor working with operators offering certified premium grade material because it reduces contamination-related production disruption, creating strong incentive to pay a premium for consistently sorted, certified supply over cheaper, less consistent alternatives lacking comparable documentation.
Market Impact: Adds 15 to 25% premium per ton sold

Long-Term Mill Supply Contract Agreements Signed

Recovery operators winning long-term supply contracts with major containerboard mills capture predictable recurring volume rather than relying on volatile spot market pricing, typically securing 3 to 5 years of guaranteed offtake worth roughly 10 to 15% more in contract stability value than comparable spot market transactions across the same volume and account relationship built over multiple renewal cycles and years of service. This account continuity meaningfully reduces the cost of ongoing sales pursuit and gives operators forward visibility into collection infrastructure investment that spot market trading never provides at comparable predictability.
Market Impact: Adds roughly 10 to 15% of contract

Export Logistics and Freight Consolidation Partnerships

Recovery operators increasingly partner with freight consolidators and ocean carriers to secure preferential export shipping rates and container availability, expanding the addressable export customer base into mills that would otherwise face inconsistent logistics access given constrained container capacity during peak shipping seasons and port congestion at major terminals worldwide and well beyond. These logistics partnerships typically reduce per-ton export shipping cost by roughly 8 to 12%, making export sales considerably more competitive against domestic mill alternatives during periods of tight ocean freight capacity and rising fuel costs across the network.
Market Impact: Cuts export shipping cost by roughl

Collection Density Expansion Into Underserved Markets

Recovery operators expanding collection density into underserved suburban and rural markets capture incremental volume that competitors without comparable route density cannot economically service, typically growing addressable collection volume by 12 to 18% within newly served territories over a multi-year buildout period and route expansion program spanning several counties, municipalities, and collection zones across the region and neighboring service areas. This geographic expansion meaningfully reduces per-ton collection cost as route density improves, giving operators a cost advantage that thinner competing networks cannot match at comparable scale, territorial reach, or long-term efficiency.
Market Impact: Grows addressable volume by 12 to 1

Who Controls the Margin Pool

Five recovery operators hold 32% of global revenue, a fragmented field reflecting relatively low barriers to entry in standard collection compared to the specialized sorting and export logistics capability that separates International Paper and Waste Management from the next tier of regional and mid-sized challengers, including Smurfit WestRock, Republic Services, and Pratt Industries, none of which currently matches their combined scale.
Current competitive activity centers on three dimensions: expanding premium grade sorting capability ahead of recycled content mandate deadlines across most major markets and mill categories, building long-term mill supply contract relationships that lock in predictable volume, and winning export logistics partnerships that secure preferential shipping access to Southeast Asian and South Asian containerboard mills.

Emerging pressure comes from regional waste haulers and material recovery facility operators offering lower-cost standard collection with increasingly credible sorting capability, gaining ground fastest among mid-sized mills in price-sensitive export markets across South Asia and parts of Latin America and Eastern Europe. Rankings among the established multinational leaders are unlikely to shift materially before 2030, but the standard-grade segment is becoming considerably more contested territory as regional operators close the technical gap.
old-corrugated-containers-market-company-positioning-matrix-1787308171487

Competitive Moat and Risk Dimensions

INTERNATIONAL PAPER COMPANY

Moat: Integrated Mill Supply Relationships

International Paper's integrated ownership of both collection infrastructure and containerboard mills gives it a supply chain cost advantage that competitors relying on third-party mill relationships cannot easily replicate, and this integration becomes more valuable as recycled content mandates increase the strategic importance of guaranteed fiber supply.
INTERNATIONAL PAPER COMPANY

Risk: High Fixed Infrastructure Cost

International Paper's sustained investment in proprietary collection fleets and sorting facilities creates a meaningful fixed cost structure that leaner regional haulers do not carry, potentially limiting its flexibility to scale down collection capacity during periods of softer containerboard demand across its network and account portfolio.
WASTE MANAGEMENT INC

Moat: Collection Network Density Scale

Waste Management's extensive residential and commercial collection network gives it access to recovered fiber volume that pure-play recovery operators without comparable route density cannot easily match, and this scale advantage increasingly matters as mills prioritize consistent, high-volume supply relationships over spot market transactions and short-term deals.
WASTE MANAGEMENT INC

Risk: Lower Average Bale Grade Quality

Waste Management's reliance on single-stream residential collection exposes it to higher contamination rates than operators focused on source-separated commercial collection, potentially limiting its ability to command premium grade pricing without additional sorting technology investment across its network, territory, municipal service contracts, and full collection fleet.

Players Tracked

Prominent Players

Smurfit WestRock plc
International Paper Company
Waste Management Inc
Republic Services Inc
Pratt Industries Inc

Other Key Players

Cascades Inc
Sonoco Recycling LLC
Veolia Environnement SA
Suez SA
Nine Dragons Paper Holdings Limited
Lee & Man Paper Manufacturing Limited
Oji Holdings Corporation
Cheng Loong Corporation
GreenWaste Recovery Inc
Casella Waste Systems Inc
Georgia-Pacific LLC
Packaging Corporation of America
Graphic Packaging Holding Company
Greif Inc
Waste Connections Inc

Recent Developments

MARCH 2026

International Paper Expands Optical Sorting Network

International Paper announced expanded optical sorting capacity across several regional material recovery facilities to increase premium double-sorted grade yield from single-stream collected material and municipal collection systems. The investment targeted mills facing the tightest recycled content compliance deadlines first, with broader rollout planned through the following fiscal year.
Signal: Optical sorting investment to lift premium
OCTOBER 2025

Waste Management Acquires Regional Recovery Operator

Waste Management completed the acquisition of a regional recovery and baling operator to expand its collection density in a fast-growing e-commerce fulfillment corridor and surrounding distribution territory. The deal brought additional sorting and baling capacity in-house, expanding Waste Management's recovered fiber footprint considerably beyond its prior regional presence.
Signal: Regional recovery and baling capacity is q
JUNE 2025

Pratt Industries Signs Long-Term Export Supply Agreement

Pratt Industries entered a long-term export supply agreement with a major Vietnamese containerboard producer covering consistent export-grade OCC volume across a multi-year term and multiple shipping routes. The agreement was a supply contract, not a joint venture or acquisition, covering export volume commitments across the mill's expansion plan.
Signal: Multi-year, guaranteed-volume export suppl

Collection Fleet and Sorting Technology Exposure

Collection fleet fuel and sorting facility labor together represent roughly 46% of operating cost for a typical recovery operation, with fuel costs tied to broader petroleum markets and skilled sorting labor increasingly concentrated in facilities investing in optical sorting technology requiring specialized technical operators and maintenance staff trained on modern equipment, diagnostics, and calibration software.
The 2021 to 2022 global fuel price volatility, driven by geopolitical supply disruption and refining capacity constraints, pushed collection fleet operating costs meaningfully higher across most major markets, with several recovery operators reporting margin compression in company annual reports covering that period. The International Energy Agency's transport fuel market analysis of that period noted the disproportionate impact on logistics-intensive industries reliant on diesel-powered collection fleets without comparable fuel hedging programs in place.

Smaller recovery operators without long-term fuel hedging agreements or route density efficiency bear considerably more exposure to cost swings than the largest players, who can negotiate volume discounts and secure priority fuel allocation during shortages. This dynamic reinforces the advantage already held by the leading operators, since a fuel cost spike can compress a smaller competitor's margins while larger players continue serving mill contracts profitably and protecting relationships.
old-corrugated-containers-market-cost-volatility-analysis-1787308171686

Fleet Fuel Hedging Program Adoption

Larger recovery operators are increasingly adopting fuel hedging programs that lock in collection fleet fuel costs across multi-month periods, trading some pricing flexibility for cost predictability across budget planning cycles that stretch well beyond typical spot fuel purchasing arrangements used by smaller regional competitors, independent haulers, and municipal contractors serving comparable territories nationwide and abroad.

Route Density Optimization Software Investment

Recovery operators are increasingly investing in route optimization software that improves collection density per fleet mile driven, reducing per-ton fuel exposure without reducing collection volume, a step that meaningfully improves margin resilience during periods of elevated fuel pricing across their operating territories, service areas, municipal contract zones, and regional accounts nationwide, abroad, and across every collection route.

Long-Term Sorting Technology Service Contracts

Recovery operators are increasingly negotiating multi-year service and maintenance contracts with optical sorting equipment manufacturers, trading some pricing flexibility for predictable technical support costs across their sorting facility investment portfolio and equipment maintenance schedules spanning multiple regions, facilities, account relationships, vendor partnerships, long-term service agreements, warranty commitments, and comprehensive technical staff training and certification programs.

Portfolio Architecture for Margin Defence

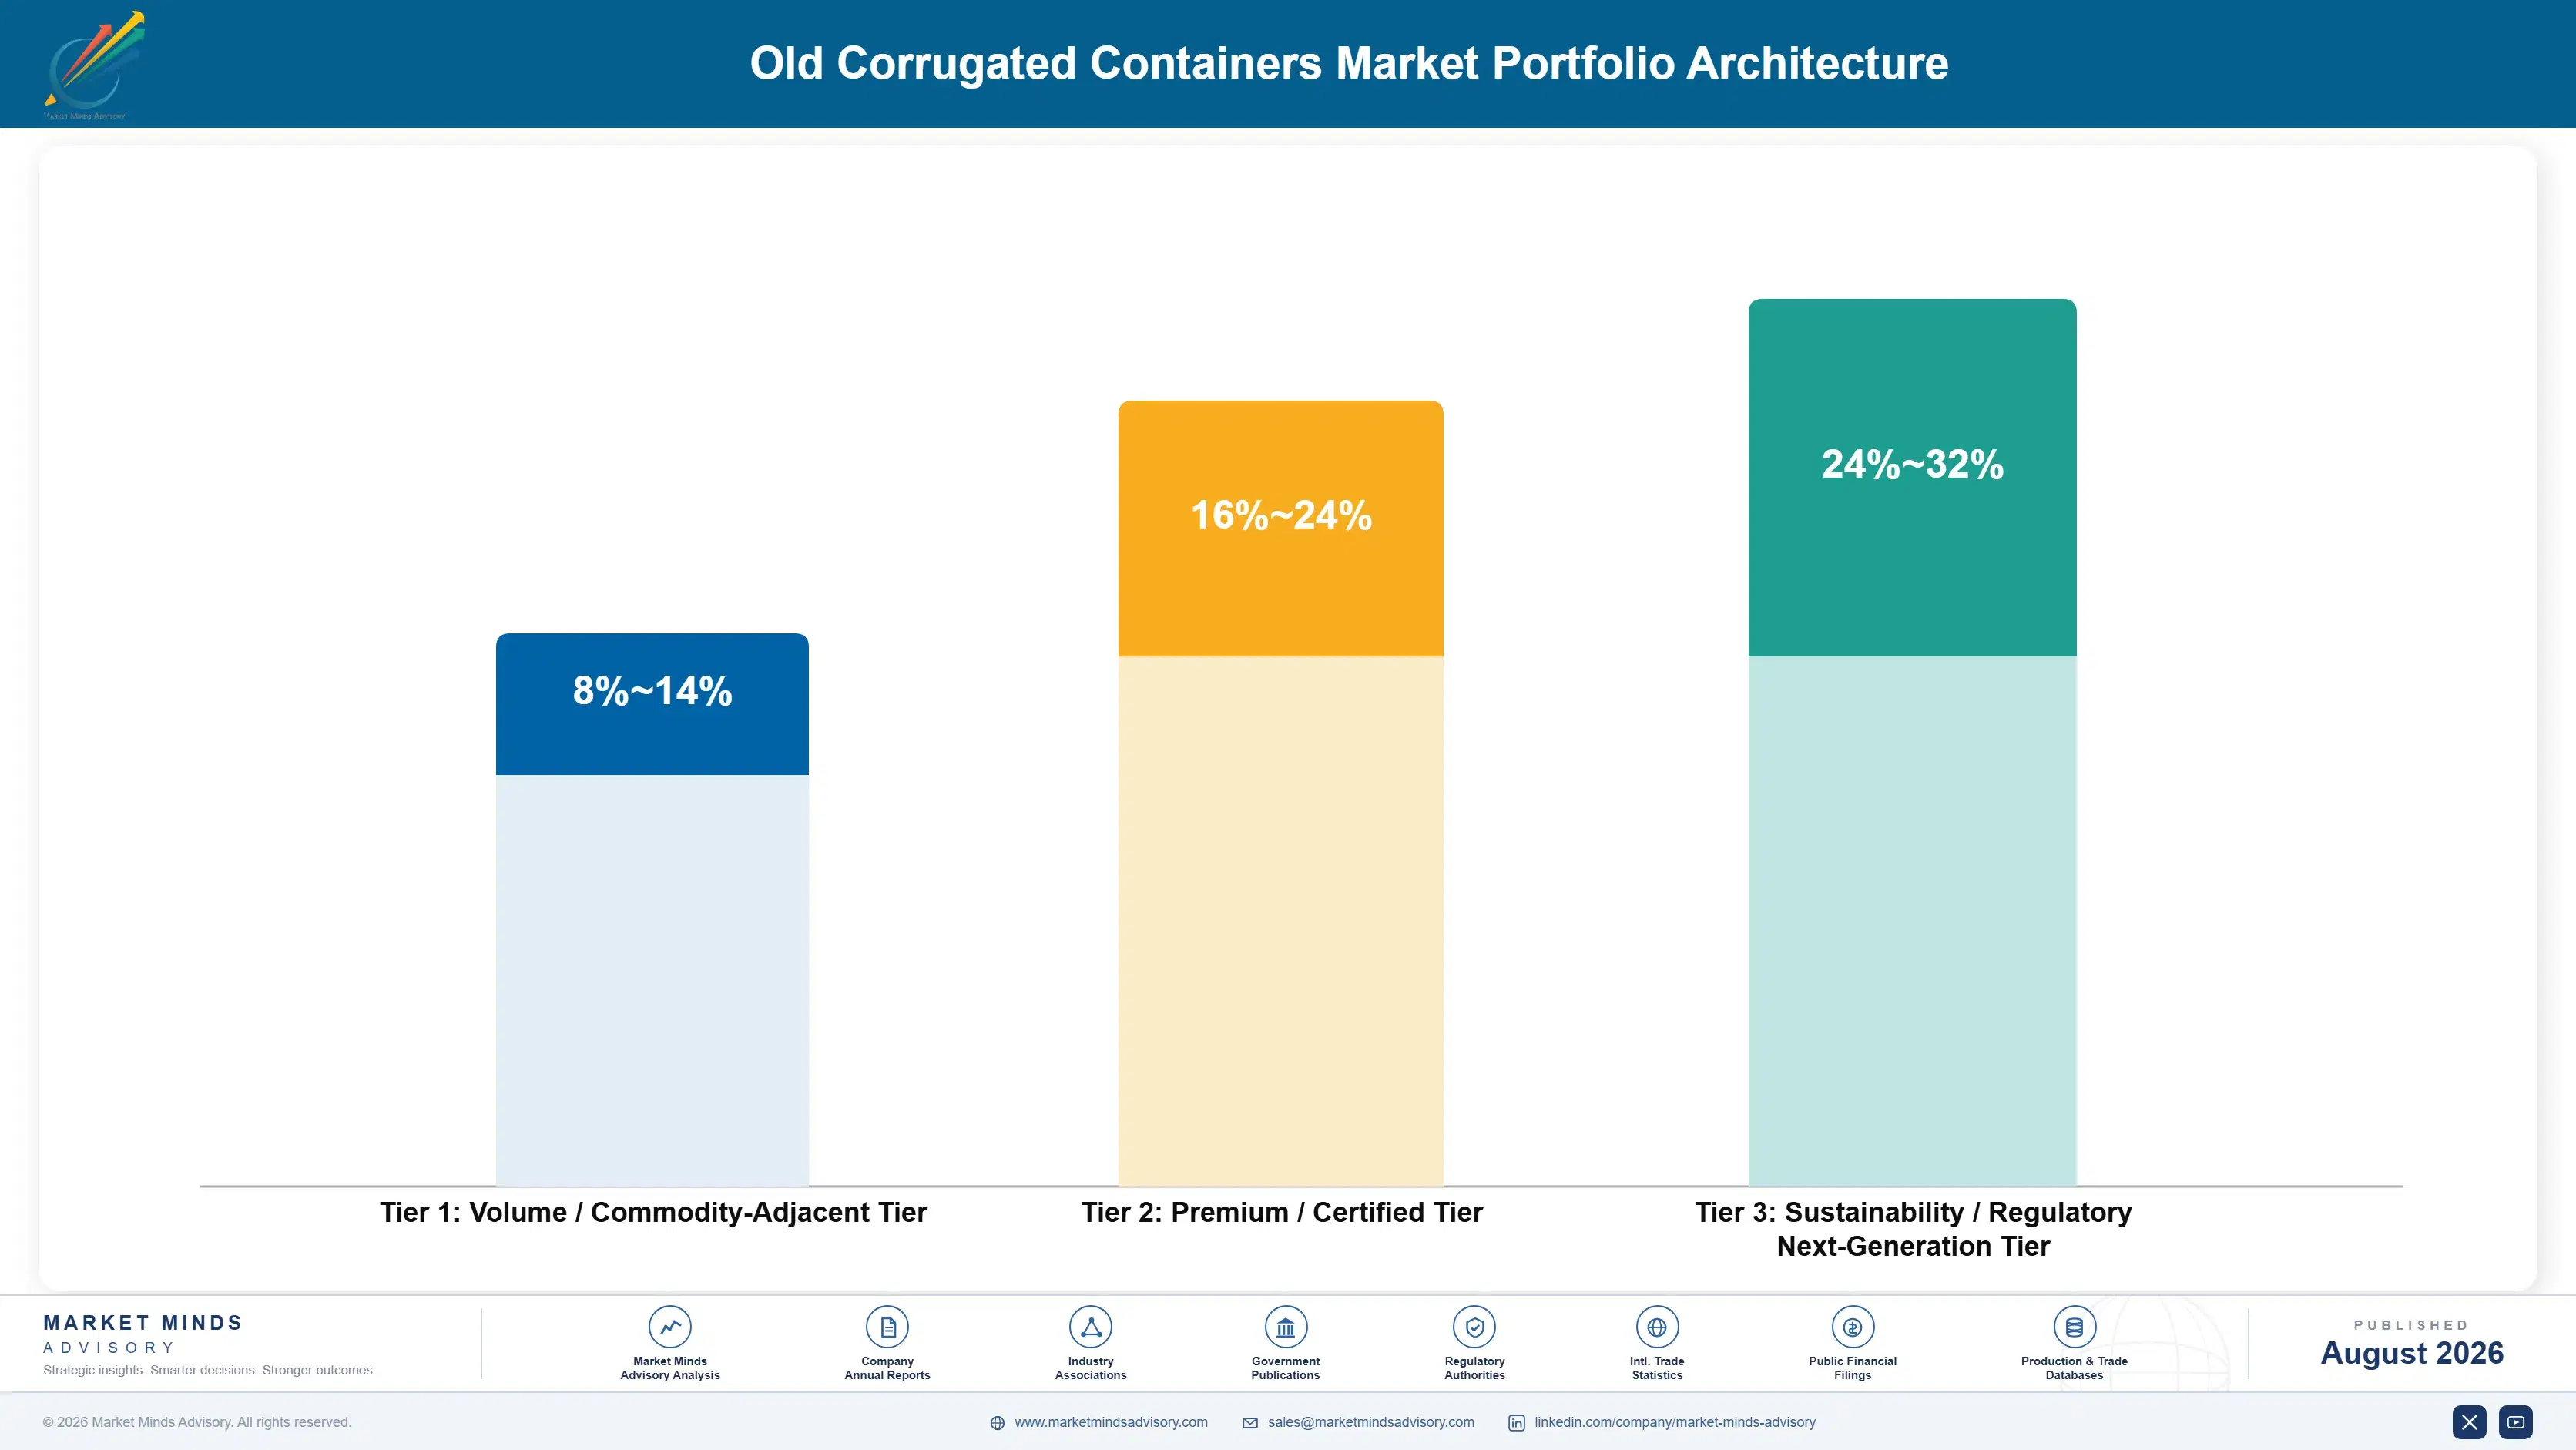
The market organizes into three tiers by grade quality and margin profile. Volume-tier standard mixed OCC covers the broadest collection base, sold largely as a commodity through established mill relationships at index-linked pricing negotiated across regular cycles. Premium-tier double-sorted and certified export grade material commands meaningfully higher prices tied to contamination consistency and documentation that mills increasingly value over volume alone.
Gross margins widen considerably moving up the tiers, since premium and export-certified grades carry disproportionate pricing power relative to their incremental sorting cost, while standard mixed grades compete primarily on index price against a growing field of regional operators entering the value tier from multiple geographies. Mills rarely downgrade supply quality requirements once contamination and documentation benefits have been realized in production consistency data and mill uptime metrics.

High-value margin pools concentrate in premium sorted material bundled with long-term supply contracts, where recurring contract revenue carries substantially wider margin than the underlying spot commodity sale that first brought the mill account onto the operator's platform in the first place. This dynamic is reshaping how operators prioritize account investment across their commercial and sales teams.

Volume / Commodity-Adjacent Tier

Standard mixed OCC sold largely as a commodity through established mill relationships at index-linked pricing, competing primarily on volume against a growing field of regional operators with limited grade differentiation.
Gross Margin: 8-14%

Premium / Certified Tier

Double-sorted premium grade material carrying stronger contamination and consistency credentials, commanding meaningfully wider margins than standard mixed grades while requiring greater sorting technology investment, validation, equipment maintenance, and precise calibration.
Gross Margin: 16-24%

Sustainability / Regulatory / Next-Generation Tier

Certified export-grade material bundled with long-term supply contracts, representing the newest category and commanding the highest margins given recycled content compliance documentation and contract stability advantage across most producing regions.
Gross Margin: 24-32%
old-corrugated-containers-market-portfolio-architecture-1787308172197

High-value Sub-segments and Strategic Watch-out

Premium Sorted OCC With Long-Term Contracts

Premium sorted OCC paired with long-term supply contracts combines the category's fastest growth with its widest margins, drawing concentrated recovery operator investment as recycled content mandates increasingly require this capability across mill relationships worldwide, every producing region, account category, grading standard, certification requirement, and export destination.
Gross Margin: 26-34%

Export-Grade Baled OCC

Export-grade baled OCC delivers strong unit growth on the back of Southeast Asian and South Asian containerboard capacity expansion, though margins sit a tier below fully domestic premium contracts, supported by broadening mill demand across the region, neighboring trade partners, expanding shipping corridors, and new port infrastructure.
Gross Margin: 14-22%

Standard Mixed Grade OCC

Standard mixed grade OCC remains the category's volume backbone across established collection relationships worldwide, competing on index price that leaves thin margins and limited room for meaningful grade differentiation across most geographies, account types, collection channels, mill supply arrangements, pricing structures, and contract terms tracked.
Gross Margin: 6-12%

Contamination-Prone Single-Stream Collection

Contamination-prone single-stream residential collection still generating a meaningful volume share warrants monitoring as mill grade requirements continue tightening, a dynamic that could compress this once-acceptable collection channel faster than smaller operators currently plan for in their own sorting, equipment, and capital investment strategies and budget cycles.
Gross Margin: 4-10%

Supply Contracts and Mill Retention

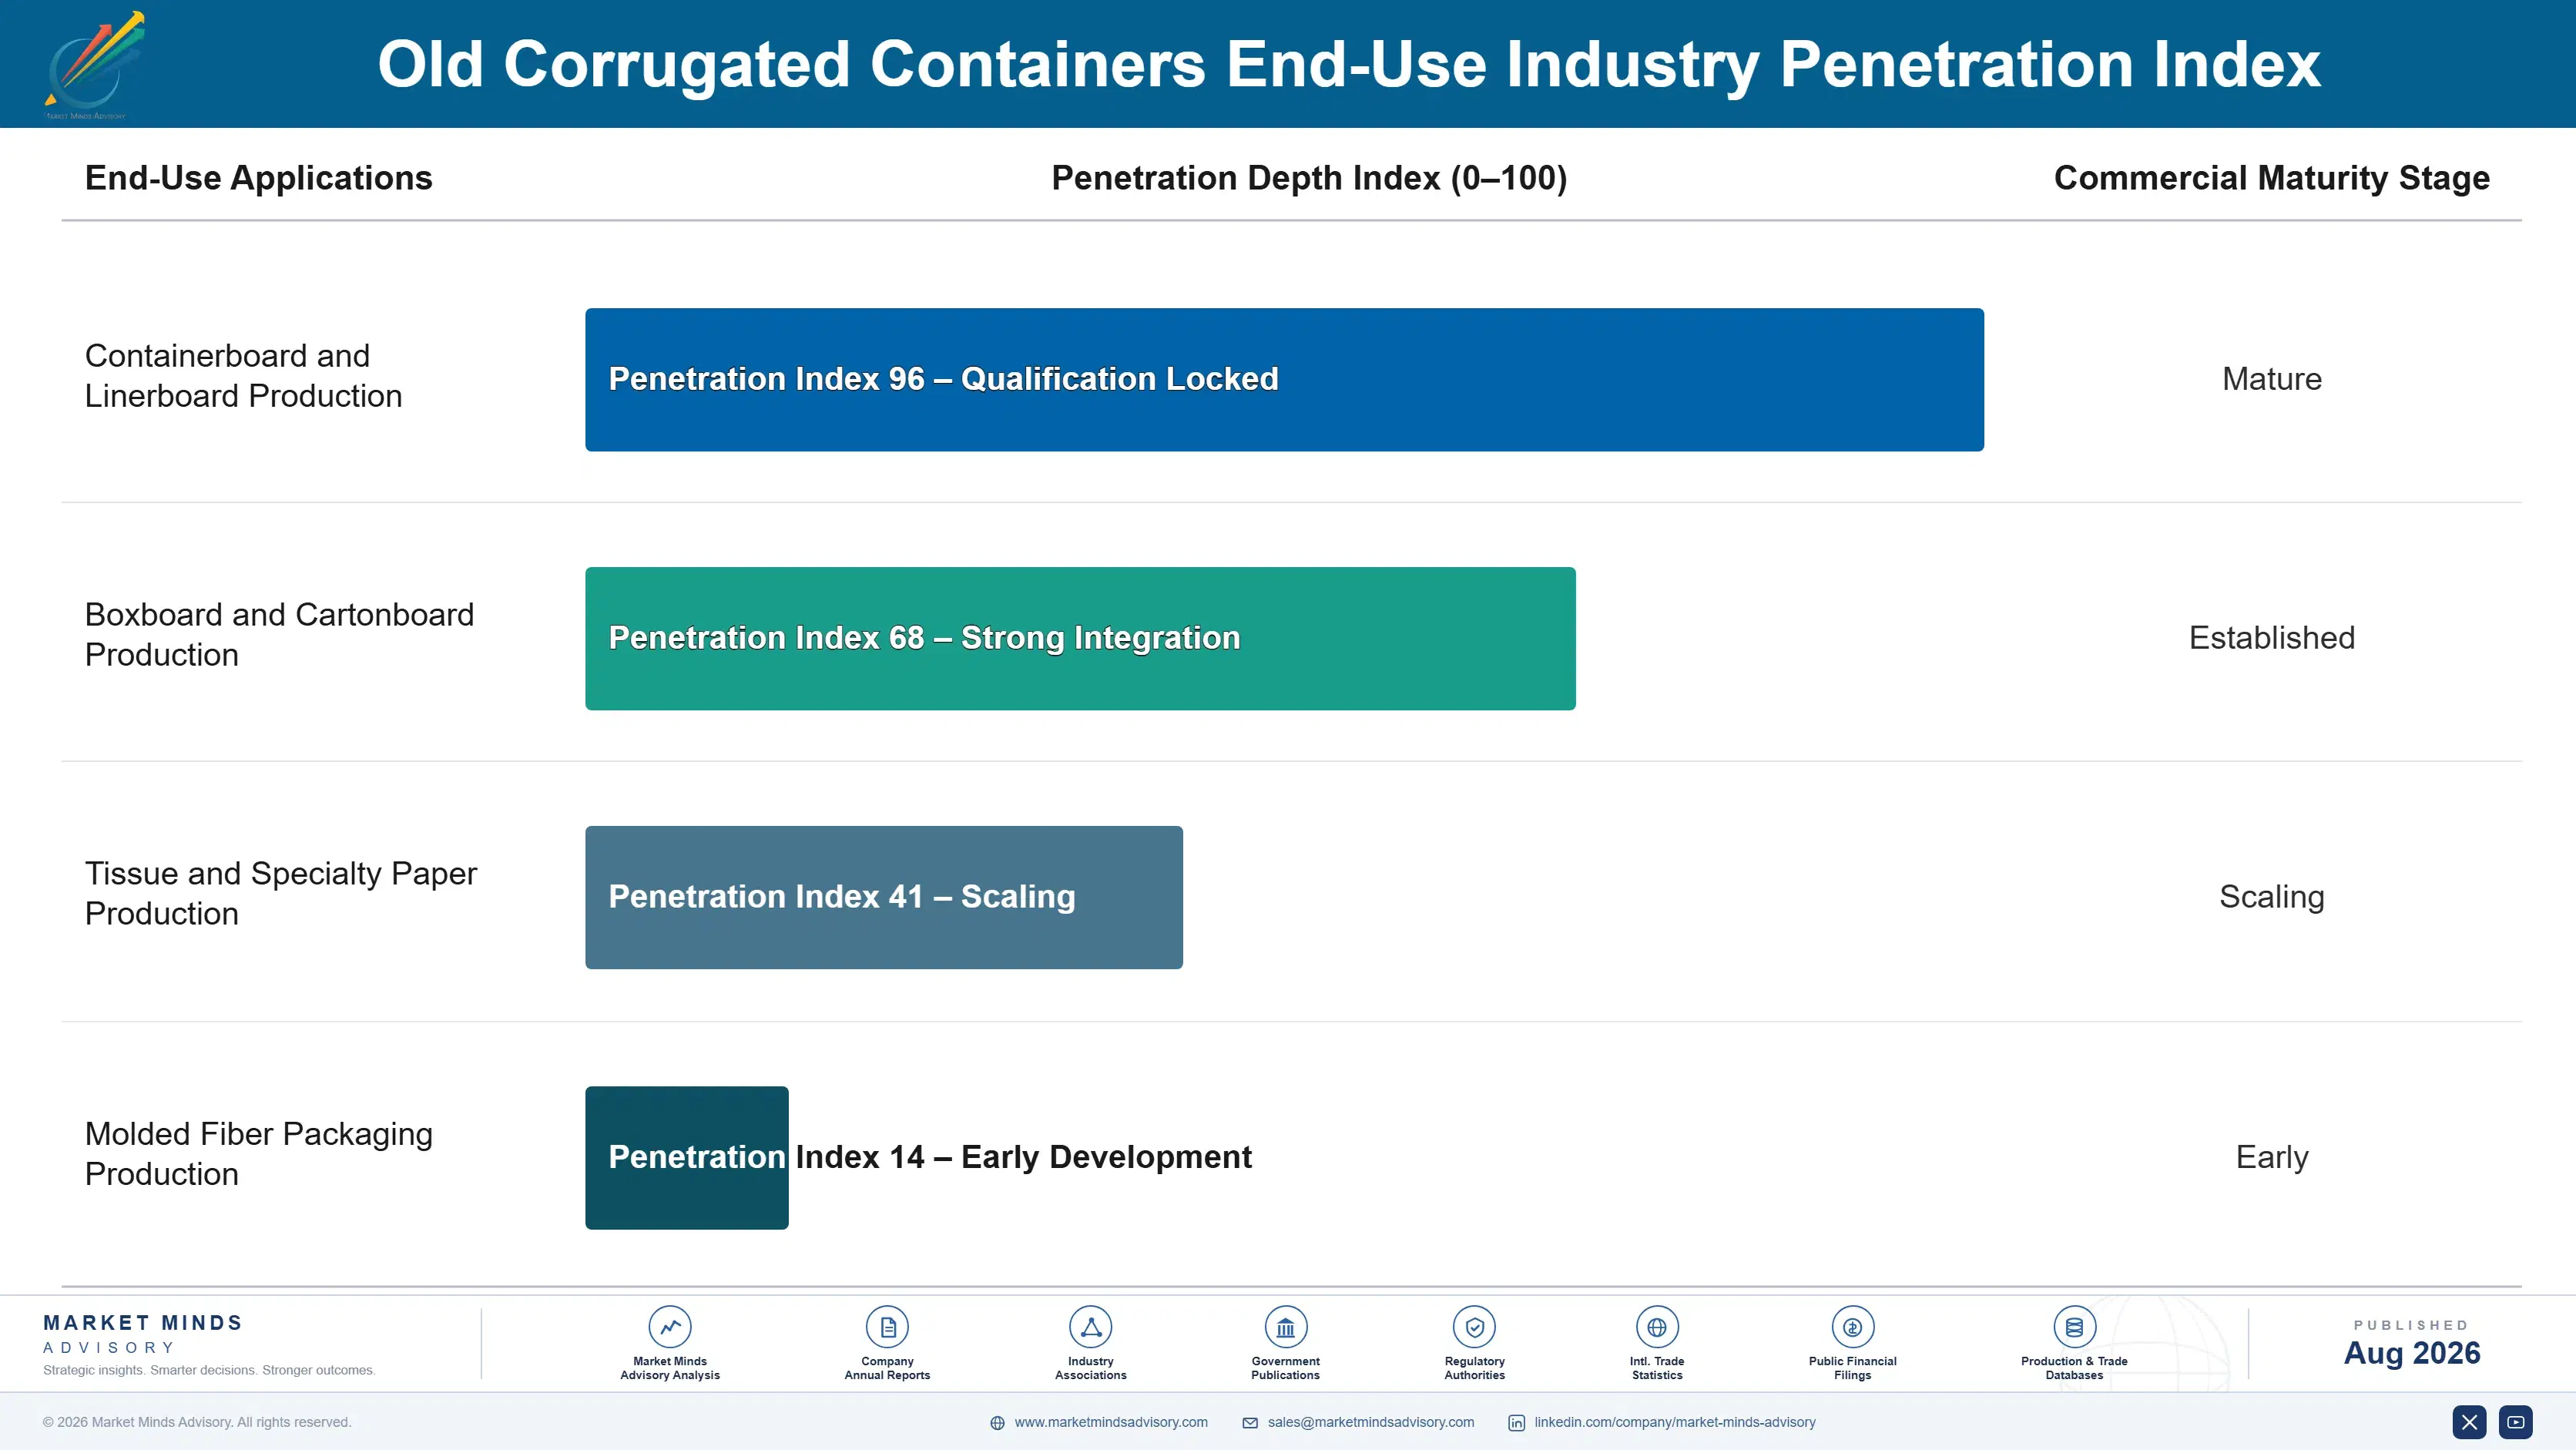
Recovery operators generate recurring revenue through long-term mill supply contracts far more than through any single spot market transaction, since a mill, once satisfied with an operator's bale consistency and delivery reliability, typically continues that relationship across successive supply cycles rather than reopening sourcing to competitive spot bidding each purchase period, budget review, contract renewal negotiation, and every annual audit.
Adoption depth varies considerably by end-use vertical. Large integrated containerboard producers adopt premium sorted and certified export formats fastest and often serve as reference accounts recovery operators use to influence broader industry grading standards, while smaller regional mills typically remain price-sensitive spot market buyers before committing to long-term contract volume across their supply chains, procurement budgets, and annual planning cycles.

Buyer profiles are shifting generationally as younger mill procurement managers who trained during the sustainability-reporting era show far greater comfort specifying certified, documented fiber supply than an older cohort that historically defaulted to spot market purchasing based on price alone before considering supply chain documentation at all. This generational shift is accelerating purchasing decisions where younger staff increasingly hold full budget authority and technical sign-off.
old-corrugated-containers-market-end-use-penetration-index-1787308172687

Positioning for the Supply Contract Shift

These are among the four positions where our research anticipates prominent divergence between winners and laggards over the coming forecast period. Each is grounded in the demand model, the regulatory perimeter, and the announced capacity pipeline.
01 / PREMIUM SORTING STRATEGY

Operators without sorting capability will lose contracts to faster movers

Premium sorted OCC commands meaningfully higher pricing and mill loyalty than standard mixed grade material, and recovery operators without competitive sorting technology risk losing consideration entirely as recycled content mandates continue tightening across major containerboard markets. This gap is widening as more mills cite bale consistency as their primary sourcing driver, and that delay carries real commercial consequence for operators slow to invest in a competitive offering. Companies that close this gap early stand to capture disproportionate share of the fastest-growing segment before rankings solidify further.
02 / LONG-TERM CONTRACT INVESTMENT

Supply agreements will separate durable mill loyalty from spot trading

Recovery operators winning long-term mill supply contracts capture predictable recurring volume rather than competing transaction by transaction, and operators without this capability increasingly lose account relationships to competitors who have already built these contract partnerships across major containerboard mill networks. This gap is widening as more mills seek supply reliability amid recycled content compliance pressure, and that delay carries real commercial consequence as spot volatility keeps rising. Companies that build this capability early stand to capture disproportionate long-term mill loyalty.
03 / EXPORT LOGISTICS INVESTMENT

Freight partnerships will bring export markets within reach for operators

Southeast Asian and South Asian mills without reliable export supply access represent a meaningful underserved market, and recovery operators offering export logistics partnerships convert this access constraint into both new adoption and incremental margin across their account base and referral network. This opportunity is widening as regional containerboard capacity expands faster than domestic fiber generation, and delayed investment in export logistics capability carries real commercial cost. Companies that build this capability early stand to capture disproportionate share of this underserved segment.
04 / COLLECTION INFRASTRUCTURE DEPTH

Route density will separate margin leaders from cost-exposed rivals

Dense collection route networks require capital and territorial relationships that few recovery operators currently possess at scale, and companies with the deepest route density investment capture disproportionate volume simply by being able to guarantee reliable collection that disrupts weaker rivals with thinner networks and less consistent service. Operators still exposed to sparse route coverage increasingly lose contract consideration to competitors who can demonstrate reliable, predictable collection volume. That gap widens further with every new territory a leading operator adds to its network.

Engagement Snapshot From the Field

A live engagement with an industry participant carrying material or product regulatory and market exposure ahead of a defining policy shift, showing how our research translates into a defensible multi-year portfolio strategy.
MARKET MINDS ADVISORY · CLIENT ENGAGEMENT SUMMARY
Old Corrugated Containers Producer Strategic Portfolio Review and Transition Roadmap 2026·Investment Scenario on Old Corrugated Containers Exposure Evaluation 2025-26
CLIENT PROFILE
The client is a regional waste and recycling company operating twelve material recovery facilities across the southeastern United States, serving municipal and commercial collection contracts with approximately $540 million in annual revenue (client-reported, unverified by MMA). The company sought to secure long-term containerboard mill supply contracts ahead of rising spot market volatility and pricing pressure.
STRATEGIC CHALLENGE
The company's existing OCC sales relied primarily on spot market transactions, and leadership needed clear, defensible data on premium sorting investment returns before committing fresh capital across its full twelve-facility network and its upcoming annual capital budget planning cycle with its board of directors, finance committee, and senior operations leadership.
MMA APPROACH
MMA benchmarked premium sorting investment costs and long-term contract pricing data across three mill relationships against the company's current spot market baseline, incorporating facility-specific volume and contamination rates across the network and every collection territory served. The analysis modeled projected outcomes over a four-year forward planning horizon under two contract adoption scenarios developed with the client's commercial team.
KEY FINDINGS
  1. Premium sorting investment was projected to increase average realized pricing by roughly 18% across all twelve evaluated facilities and collection territories served.
  2. Four of the company's twelve facilities had contamination rates low enough to qualify for premium grade certification without additional sorting equipment investment.
  3. Long-term contract pricing stability was projected to reduce revenue volatility by roughly 30% compared to the company's prior spot market sales approach.
  4. A phased, facility-by-facility sorting upgrade sequenced carefully around contract renewal timing minimized disruption compared to upgrading all twelve facilities simultaneously at once.
CLIENT PROFILE
The client is a regional waste and recycling company operating twelve material recovery facilities across the southeastern United States, serving municipal and commercial collection contracts with approximately $540 million in annual revenue (client-reported, unverified by MMA). The company sought to secure long-term containerboard mill supply contracts ahead of rising spot market volatility and pricing pressure.
STRATEGIC CHALLENGE
The company's existing OCC sales relied primarily on spot market transactions, and leadership needed clear, defensible data on premium sorting investment returns before committing fresh capital across its full twelve-facility network and its upcoming annual capital budget planning cycle with its board of directors, finance committee, and senior operations leadership.
MMA APPROACH
MMA benchmarked premium sorting investment costs and long-term contract pricing data across three mill relationships against the company's current spot market baseline, incorporating facility-specific volume and contamination rates across the network and every collection territory served. The analysis modeled projected outcomes over a four-year forward planning horizon under two contract adoption scenarios developed with the client's commercial team.
KEY FINDINGS
  1. Premium sorting investment was projected to increase average realized pricing by roughly 18% across all twelve evaluated facilities and collection territories served.
  2. Four of the company's twelve facilities had contamination rates low enough to qualify for premium grade certification without additional sorting equipment investment.
  3. Long-term contract pricing stability was projected to reduce revenue volatility by roughly 30% compared to the company's prior spot market sales approach.
  4. A phased, facility-by-facility sorting upgrade sequenced carefully around contract renewal timing minimized disruption compared to upgrading all twelve facilities simultaneously at once.
RECOMMENDED STRATEGY
Phase 1: Phase 1 (Months 1-3): Complete a thorough, detailed facility evaluation and contamination rate assessment across the full twelve-facility recovery network. Phase 2: Phase 2 (Months 4-16): Execute phased sorting upgrades starting with the four facilities already positioned for premium grade certification and sorting. Phase 3: Phase 3 (Months 17-30): Complete sorting upgrades across remaining facilities sequenced around contract renewal and annual budget review cycles ahead.
OUTCOME
The company selected a phased premium sorting upgrade strategy across its full network, prioritizing its four best-positioned facilities first. Projected annual revenue uplift reached approximately $9.2 million (client-reported, unverified by MMA) against the prior spot market baseline across the company's full twelve-facility recovery network and territory.

Frequently Asked Questions

Foundational context covering the market sizes, CAGR, scope, country, region and competition that inform every finding below. This section is provided to cover basics and most often pre-purchase conversations, answered from the MMA Primary Research Dataset.

What is the current size of the Old Corrugated Containers Market?

The Old Corrugated Containers Market was valued at approximately $28.0 billion globally in 2025. This includes pre-consumer, post-consumer, premium, and export grade material formats worldwide.

How large will the Old Corrugated Containers Market be by 2036?

The market is projected to reach approximately $45.4 billion by 2036, roughly 1.55 times its 2026 value. Growth is driven by recycled content mandates and e-commerce volume.

What is the CAGR for the Old Corrugated Containers Market 2026 to 2036?

The base case CAGR is 4.5% annually, with a bull case of 5.8% and a bear case of 3.2%. This reflects steady demand growth alongside accelerating premium grade sorting adoption.

Which segment is growing fastest?

E-commerce reverse logistics OCC is the fastest-growing segment, expanding at roughly 7.5% annually. Growing e-commerce fulfillment recovery programs are driving this shift across most markets.

Who are the major companies in the Old Corrugated Containers Market?

Leading companies include Smurfit WestRock, International Paper, Waste Management, Republic Services, and Pratt Industries. Together these five hold roughly 32 percent of total global revenue.

Which country is growing fastest?

Vietnam is the fastest-growing country, expanding at roughly 6.5% annually through 2036. This reflects rapidly expanding containerboard mill capacity across the entire domestic manufacturing economy.

Report Segmentation Architecture

The full report scope spans multiple orthogonal segmentation dimensions, with cross-tabulated demand data provided for each dimension pair. Coverage extends further to regional breakdowns, trend trajectories, and the competitive detail needed to support segment-level decision-making.

By Source and Collection Channel

  • Pre-Consumer Industrial OCC
  • Post-Consumer Residential Curbside OCC
  • Retail Back-of-Store OCC
  • Double-Sorted Premium Grade OCC
  • Export-Grade Baled OCC
  • E-Commerce Reverse Logistics OCC

By End-Use Industry

  • Containerboard and Linerboard Production
  • Boxboard and Cartonboard Production
  • Tissue and Specialty Paper Production
  • Molded Fiber Packaging Production

By Commercial Dimension

  • Spot Market Trading
  • Long-Term Mill Supply Contract
  • Export Supply Agreement
  • Municipal and Commercial Collection Contract

By Region

  • East Asia
  • North America
  • Western Europe
  • South Asia and Pacific
  • Latin America
  • Middle East and Africa
  • Eastern Europe

Scope, Methodology, and Coverage

Every figure in this report is reproducible from documented input assumptions. The scope below maps the historical period, the forecast horizon, the segmentation dimensions, and the countries covered, alongside the underlying primary and qualitative methodology.
Historical Period
2020 to 2025
Forecast Period
2026 to 2036
Base Year
2025 (USD billions; MMA Primary Research Dataset, August 2026)
Market Definition
The Old Corrugated Containers Market covers the collection, sorting, baling, and trading of recovered corrugated cardboard as a recycled fiber feedstock for containerboard and other paper grade production, spanning pre-consumer industrial and post-consumer residential and retail sources. It excludes virgin kraft linerboard production, mixed paper grades other than corrugated, and finished containerboard or box manufacturing sold as separate categories.
Quantitative Units
USD billions (current prices); metric tons where applicable
Segmentation Dimensions
By Source and Collection Channel; By End-Use Industry; By Commercial Dimension; By Region
Regions Covered
East Asia, North America, Western Europe, South Asia and Pacific, Latin America, Middle East and Africa, Eastern Europe
Countries Covered
USA, China, Germany, France, UK, Japan, South Korea, India, Australia, Canada, Brazil, Mexico, Indonesia, Vietnam, Thailand, Malaysia, UAE, Saudi Arabia, South Africa, Nigeria, Turkey, Poland, Netherlands, Italy, Spain, Sweden, Switzerland, Argentina, Colombia, Singapore, and additional markets relevant to this sector
Key Companies Profiled
Smurfit WestRock plc, International Paper Company, Waste Management Inc, Republic Services Inc, Pratt Industries Inc, Cascades Inc, Sonoco Recycling LLC, Veolia Environnement SA, Suez SA, Nine Dragons Paper Holdings Limited, Lee & Man Paper Manufacturing Limited, Oji Holdings Corporation, Cheng Loong Corporation, GreenWaste Recovery Inc, Casella Waste Systems Inc, Georgia-Pacific LLC, Packaging Corporation of America, Graphic Packaging Holding Company, Greif Inc, Waste Connections Inc
Quantitative Methodology
Primary survey, n=3,800 respondents, Q4 2025, six countries; demand-side model with trade association cross-validation
Qualitative Methodology
47 expert interviews, Q4 2025; applied to validate demand model assumptions, identify emerging dynamics, and assess competitive positioning
Report Format
PDF and XLSX data workbook (Word format preview document)
Publisher
Market Minds Advisory
Report Code
MMA-2026-CHM-157
Published
August 2026
Contact
sales@marketmindsadvisory.com | www.marketmindsadvisory.com

Purchase the full Old Corrugated Containers Market Report (2026 to 2036).

The full report delivers detailed segmentation across all six source and collection channel categories, with country-level sizing for all thirty-one covered markets. It profiles the complete competitive landscape of all twenty companies named in this summary, including moat and risk analysis for the two leading recovery operators. Multi-year forecast models are provided under base, bull, and bear scenarios. Primary survey data drawn from mill procurement executives, recovery operator representatives, and logistics providers across six countries supports every major finding, and purchasers receive editable data files alongside the formatted report.
Recycled content mandate tracker by country and mill type
Bale grade and contamination benchmark comparison model
Export logistics economics calculator by trade route
Recovered fiber pricing tracker updated quarterly
Recovery operator collection capacity database by region
Competitive benchmarking across key recovery operators

Built For The People Who Decide

From boardroom strategy to bench-side execution, this report is read cover-to-cover by leaders shaping the next decade of their industry, turning demand scenarios, market dynamics and valuation benchmarks into decisions.
CXOs/ Presidents/ VPs/ Managers
M&A and Corporate Development
Strategy Teams and R&D Heads
Procurement and Product Directors
Regulatory and Compliance Leaders
Investor Relations and Equity Analysts