

Market Minds Advisory
Oil Filled Power Transformer Market

Oil Filled Power Transformer Market: Oil Filled Power Transformer Market. Renewable Interconnection Redraws Grid Equipment Procurement.

Grid modernization and renewable interconnection investment is pushing oil filled power transformer procurement toward larger, specialized units across China, India, and the United States at an unusually accelerating pace now.

Lead Analyst

Published

September 2026

Make Smarter Decisions with Customized Research Insights

Request a free sample report and evaluate market opportunities, growth trends, and competitive dynamics relevant to your business needs.

2025 MARKET VALUE$18.5BMarket Size 2025
2036 FORECAST VALUE$31.6BBase Case , 2026 to 2036
CAGR 2026 TO 20365.0 %Bull 6.2% / Bear 3.8%
INCREMENTAL OPPORTUNITY$12.2BNet 10- year value creation
EXPANSION MULTIPLE1.63x2036 value over 2026 base
Strategic Levers
M&A Pipeline
Regional Outlook
Country Rankings
Competitive Intelligence
Segmental Deep-dive
Call-Us : 91 93563 13602

Executive Snapshot and Market Trajectory.

Grid modernization programmes and renewable interconnection projects are forcing transformer manufacturers to expand capacity for larger, specialized units well ahead of replacement cycle forecasts made only a few years earlier, reshaping product roadmaps across major utility markets. Suppliers are scrambling to secure specialized winding materials this shift demands.
Commercial momentum concentrates around renewable interconnection and HVDC converter transformers, both requiring specialized winding designs and insulation systems beyond conventional distribution transformer engineering. East Asia leads volume production given China's dominant grid infrastructure investment, while India expands domestic manufacturing capacity to support its own rapid grid expansion programme under national electrification targets. Domestic manufacturing incentives in several major markets are further reshaping where transformer production capacity gets built over the coming several years considerably.
The competitive field remains moderately concentrated among established heavy electrical equipment manufacturers with decades of transformer engineering experience, though Chinese and Indian domestic suppliers are expanding aggressively on price and delivery scale. Insulation innovation and manufacturing capacity will determine which suppliers capture the largest share of renewable interconnection contracts over the coming decade, with rankings likely shifting as domestic suppliers gain ground. Order books already reflect this shift industry-wide.
Market Definition
This report covers oil filled power transformers used for voltage transformation in transmission and distribution grid applications, typically rated above 10 MVA. It excludes dry-type transformers, distribution transformers below 10 MVA, and instrument transformers used for metering and protection.
Base Year Value
$18.5B in 2025 (MMA Primary Research Dataset, September 2026)
Forecast Period
2026 to 2036, eleven discrete annual values
CAGR
5.0% base case. Bull 6.2%. Bear 3.8%.
Fastest Growth Segment
Renewable Interconnection Transformers: 8.5% CAGR
Fastest Growth Country
India: 7.5% CAGR
Fastest Growth Region
South Asia and Pacific: 7.0% CAGR
Largest Region
East Asia: 33% of 2025 global value
Market Leaders
Hitachi Energy, Siemens Energy, GE Vernova, Mitsubishi Electric, TBEA. Source: MMA Primary Research Dataset, July 2026.
Primary Survey
n=3,800 procurement and R&D decision-makers, Q4 2025, six countries
Methodology
Demand-side build-up, cross-validated against public data, 47 expert interviews

Oil Filled Power Transformer Market Forecast Scenarios

oil-filled-power-transformer-market-size-forecast-scenario-1788254923079
Oil filled power transformer demand grew steadily between 2020 and 2025, expanding at roughly 4.3 percent annually as grid replacement cycles and moderate capacity expansion sustained baseline order volume across most global utility markets. Growth remained closely tied to ordinary asset renewal rather than any specific renewable interconnection driven shift. Most demand tracked ordinary utility capital replacement budgets rather than dedicated renewable interconnection programmes.
The base case assumes steady commercial acceleration driven by three mechanisms: rapid renewable interconnection capacity additions requiring specialized transformer designs, grid modernization funding tied to aging infrastructure replacement, and growing HVDC transmission investment supporting long-distance power transfer projects. Combined, these forces support 5.0 percent compound annual growth through 2036 as specialized units gain further share of total shipments. Manufacturers are expanding specialized winding and insulation production capacity to meet this anticipated demand curve.
A bull scenario built around accelerated renewable capacity additions beyond current announced grid connection queues could push growth toward 6.2 percent, while a bear case tied to raw material cost volatility and slower grid funding could pull growth down toward 3.8 percent. Either path implies higher specialized shipments than currently supplied. Either path implies higher specialized shipments than currently supplied across grid markets.

Renewable Interconnection Redraws Transformer Procurement

Oil filled power transformer demand is shifting from standard grid replacement volume toward specialized units suited to renewable interconnection and HVDC transmission applications requiring different winding and insulation engineering. Utilities increasingly specify transformer suppliers by proven renewable interconnection deployment record rather than treating unit selection as an interchangeable commodity purchase decision. Certification programmes now take several months, a genuine barrier for manufacturers lacking specialized testing infrastructure.
MARKET CONCENTRATIONCR5 42%Top five manufacturers hold roughly two-fifths industry revenue
AVERAGE SELLING PRICE$1.2M per unitReflects typical mid-scale large power transformer unit pricing
TOP COUNTRY SHAREChina 26%Leads global demand through dominant grid infrastructure investment
CAPACITY UTILISATION76%Reflects steady manufacturing throughput across established production lines
TRADE INTENSITY32%Share of equipment value sourced through cross-border supply chains
FEEDSTOCK COST SHARE48% of COGSElectrical steel and copper inputs drive most manufacturing cost
Manufacturers face growing pressure to expand electrical steel sourcing and specialized winding engineering capability, a requirement grid operators now expect as standard for renewable interconnection contracts. This shift favors established suppliers with strong material sourcing relationships over smaller regional manufacturers focused purely on standard distribution-grade unit assembly. Suppliers lagging on sourcing investment risk losing shortlist positions even where their standard quality remains competitive.
Demand growth through 2036 depends heavily on renewable capacity additions translating into firm interconnection transformer orders rather than remaining announced but unbuilt grid connection queue capacity. China has moved furthest toward committed grid modernization investment, while many emerging grid markets still rely on standard replacement procurement rather than accelerated specialized capacity investment. Manufacturing lead times of twelve to eighteen months mean today's orders shape which suppliers dominate the coming demand wave.
"Nobody expected renewable interconnection to reshape transformer specifications this fast. Manufacturers without a credible specialized winding roadmap are already losing utility shortlist positions they held for years."
Senior Analyst, Grid Infrastructure Practice · MMA Construction and Industrial Equipment Practice · September 2026

Market Trends

Renewable Interconnection Drives Specialized Transformer Demand

Utility-scale solar and wind developers are increasingly requiring transformers with specialized winding designs and step-up voltage ratios suited to variable renewable generation profiles, a technical requirement conventional distribution-grade transformer designs were never optimized to meet at commercial volume across the industry. National grid operators in several major markets have updated interconnection standards to require enhanced harmonic filtering and voltage regulation capability for renewable-connected transformers. This shift is pulling forward manufacturing capacity investment that suppliers had previously modeled only for the early 2030s, compressing production lead times considerably across the entire specialized transformer supply chain.
Market Impact: Directs 25 billion dollars annually
HVDC Transmission Expansion Requires Converter Transformers

Long-distance HVDC transmission projects connecting remote renewable generation to load centers require specialized converter transformers with fundamentally different insulation and winding designs than conventional AC transmission transformers, reflecting the unique voltage stress patterns HVDC converter stations impose on connected equipment. China, India, and several European countries have announced new HVDC transmission corridors requiring dozens of converter transformer units over the coming decade. Suppliers without qualified HVDC converter transformer capability are increasingly excluded from these large infrastructure tenders entirely, a meaningful threat to manufacturers whose commercial position historically rested on conventional AC transformer quality alone.
Market Impact: Cuts transformer losses by 12 percent

Market Opportunities and Growth Drivers

Grid Modernization Funding Sustains Replacement Demand

National grid modernization programmes across major economies are directing substantial capital toward aging transformer fleet replacement, with many installed units approaching or exceeding their typical forty-year design service life across developed grid infrastructure. These programmes typically bundle replacement funding with efficiency and reliability improvement requirements, favoring manufacturers offering modern specialized designs over legacy conventional configurations from smaller regional manufacturers. Utilities receiving public modernization funding increasingly face reporting requirements around grid reliability and outage prevention, further reinforcing demand for higher-specification transformer equipment across most funded replacement projects underway. Equipment vendors are adjusting sales strategy accordingly across all major regional markets.
Market Impact: Adds 10 to 15 percent

Electrical Steel Efficiency Standards Drive Design Changes

Tightening energy efficiency standards for transformer core materials are pushing manufacturers toward higher-grade electrical steel and improved winding designs that reduce no-load and load losses across the equipment's multi-decade operating life. This regulatory pressure reflects growing scrutiny over grid-wide energy losses as utilities face mounting pressure to improve overall system efficiency amid rising electricity demand. Manufacturers able to demonstrate compliance with the newest efficiency standards are winning a disproportionate share of replacement and new-build contracts as procurement criteria tighten considerably across most developed markets. This efficiency gap is widening as procurement criteria tighten further across most major utility operators.
Market Impact: Adds 12 to 18 months

Market Restraints and Challenges

Electrical Steel Price Volatility Pressures Margins

Grain-oriented electrical steel prices fluctuate significantly given the material's specialized production process and concentrated global manufacturing capacity, exposing transformer manufacturers to significant margin risk during periods of elevated commodity volatility that are difficult to hedge across multi-year utility supply contracts. The root cause traces to grain-oriented electrical steel's highly specialized production process, with a small number of manufacturers worldwide controlling the large majority of global supply capacity. Manufacturers are mitigating this exposure through long-term supply agreements with steel producers and by exploring amorphous core alternatives in lower-loss applications where feasible.
Market Impact: Adds 45 GW annual capacity

Long Manufacturing Lead Times Delay Grid Projects

Large power transformers regularly require twelve to eighteen months of manufacturing lead time given custom engineering and testing requirements, a delay that increasingly constrains grid project timelines as renewable interconnection and modernization demand accelerates across most major markets. The root cause lies in the highly customized nature of large power transformer manufacturing, where each unit requires bespoke winding and insulation design rather than standardized mass production. Utilities are mitigating this through earlier procurement planning and by placing framework orders well ahead of actual project construction schedules. This constraint is intensifying in several key renewable interconnection regions.
Market Impact: Adds 15 GW HVDC transmission capacity
4 additional market trends, 3 additional growth drivers, and 3 additional restraints and challenges are covered in the full report. Contact sales@marketmindsadvisory.com to access the complete intelligence.

Segment CAGR and Growth Architecture

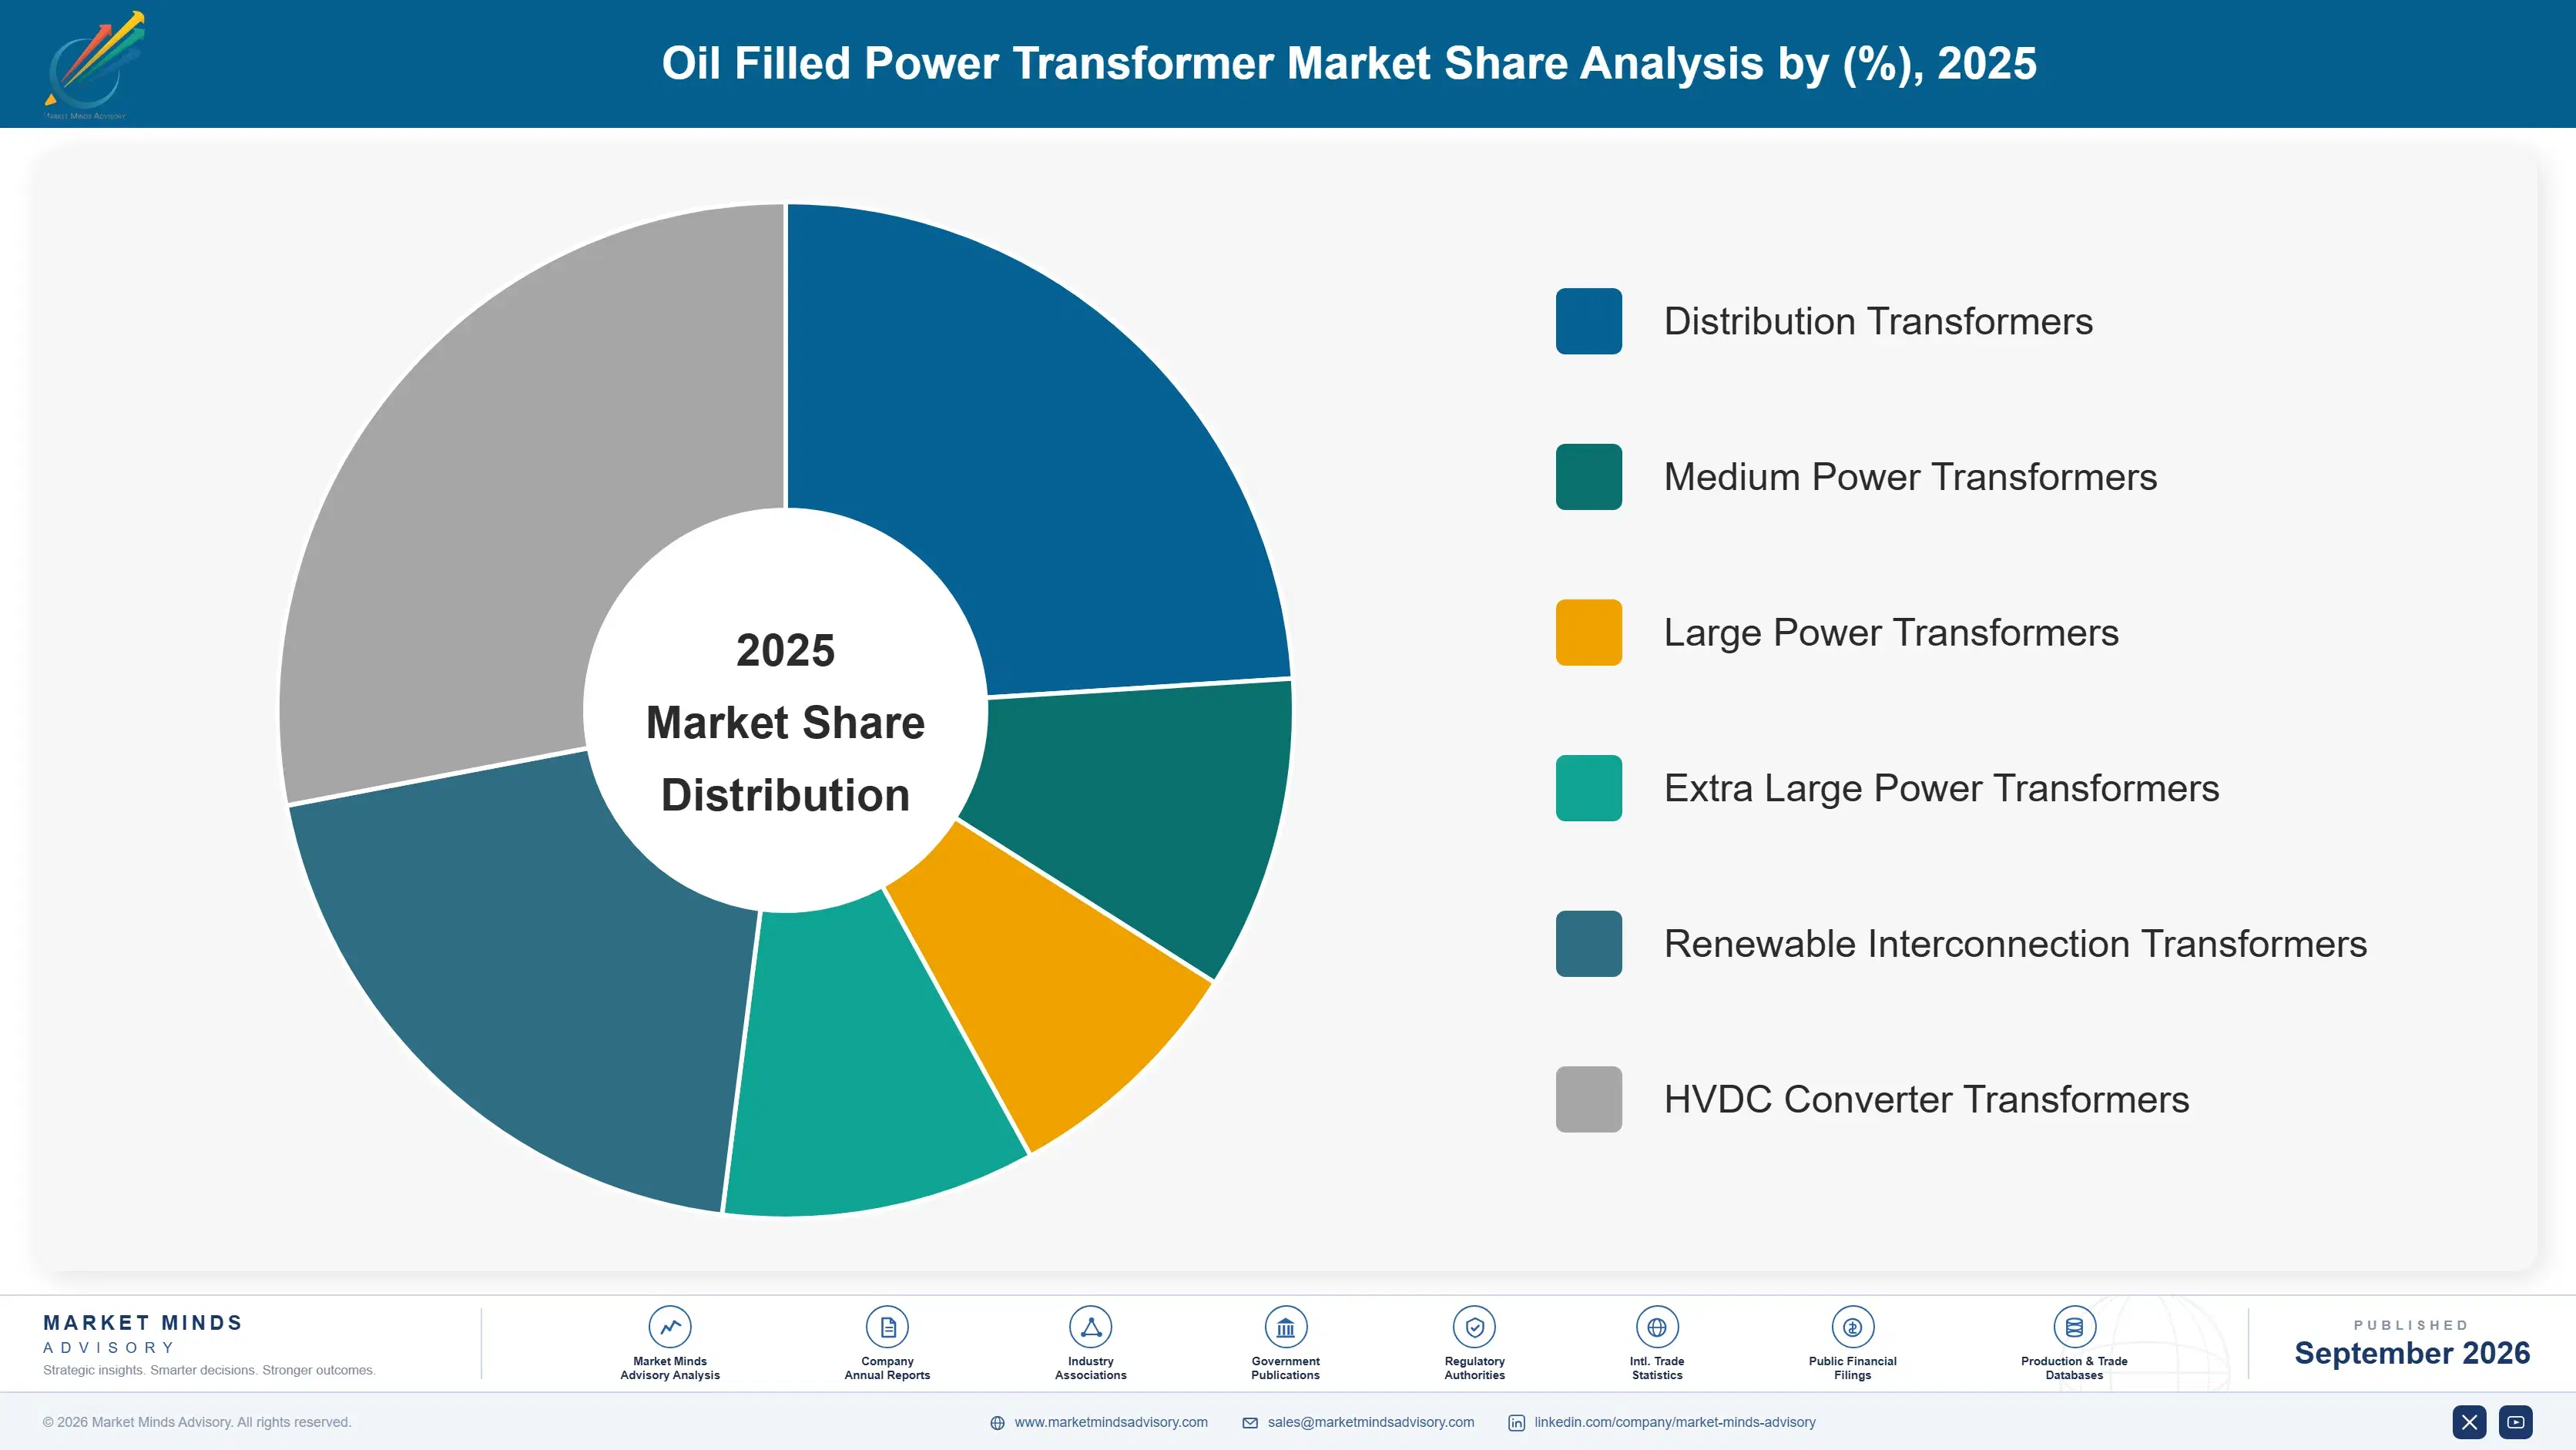
Oil filled power transformers segment by power rating and application, the primary axis of technical differentiation and manufacturing complexity across suppliers. Six categories span mature distribution-grade designs through fast-growing renewable interconnection and HVDC converter formats. Terminal buyers increasingly evaluate manufacturers on specialized engineering capability and testing infrastructure rather than price alone entirely now considerably.
oil-filled-power-transformer-market-market-share-analysis-1788254923663

Renewable Interconnection Transformers

Renewable interconnection transformers represent the fastest-growing application category, expanding at an estimated 8.5 percent annually as utility-scale solar and wind developers require specialized step-up and harmonic filtering capability suited to variable generation profiles. These units command meaningfully higher average selling prices than conventional distribution-grade transformers, reflecting the added winding complexity, enhanced insulation, and specialized testing bundled into the equipment package. Established manufacturers with strong electrical steel sourcing relationships are capturing a disproportionate share of this segment's growth, while smaller regional manufacturers focused purely on standard distribution-grade assembly struggle to compete on technical specification alone. Continued renewable capacity additions should sustain this segment's above-average growth pace well through the remainder of the forecast period.
CAGR 8.5%

HVDC Converter Transformers

HVDC converter transformers are expanding at an estimated 7.5 percent annually, the second-fastest pace in the category, driven heavily by long-distance transmission corridors connecting remote renewable generation to distant load centers across multiple continents. This format requires fundamentally different insulation and winding designs than conventional AC transmission transformers, reflecting the unique voltage stress patterns HVDC converter stations impose on connected equipment. Manufacturers offering qualified HVDC converter transformer capability are winning a growing share of these large infrastructure tenders as transmission corridor announcements accelerate across China, India, and Europe specifically. Continued HVDC corridor expansion should sustain this segment's above-average growth pace well through the remainder of the forecast period considerably. This trend continues broadly.
CAGR 7.5%
Full segment breakdown across 7 segments available in the complete report.

Regional Architecture and Country Demand Map

Regional demand concentrates heavily around China's dominant grid infrastructure investment, while India expands domestic manufacturing capacity under its own rapid grid expansion and electrification programmes considerably. North America and Europe follow at a more measured pace as grid modernization funding gradually reshapes replacement procurement across most developed utility markets.

East Asia

China's State Grid Corporation and Southern Power Grid together anchor the largest single regional share, driven by sustained transmission network expansion and renewable interconnection investment extending across multiple provinces annually. This concentration justifies a share above the typical regional band, since China alone represents the world's largest single transformer procurement market by installed unit volume. Japan and South Korea contribute meaningful demand through aging infrastructure replacement rather than network expansion specifically. Continued grid investment through the forecast period should sustain above-average regional growth relative to more mature Western markets elsewhere. South Korean manufacturers are also positioning to export qualified specialized units to neighboring Southeast Asian grid modernization markets. Continued export growth to Southeast Asia reinforces this region's commercial weight.
Share: 33% | CAGR: 6.0% (2026 to 2036)

North America

United States utilities are accelerating transformer procurement through federal grid modernization funding tied to renewable interconnection and wildfire mitigation programmes across western states specifically. Investor-owned utilities increasingly specify enhanced harmonic filtering and voltage regulation capability in new tender documents, reflecting growing regulatory scrutiny over grid reliability. Canadian utilities pursue similar upgrades at a more measured pace, tied primarily to ordinary asset renewal rather than dedicated modernization capital programmes. Growth here should track close to the global average as replacement cycles continue compressing across most major utility territories. Mexican utilities are also beginning to specify enhanced transformer designs in new industrial park interconnection projects near the border. Texas leads state-level investment given favorable grid policy.
Share: 22% | CAGR: 5.5% (2026 to 2036)
Regional intelligence for 5 additional markets available in the complete report: Western Europe, South Asia and Pacific, Middle East and Africa, Latin America, Eastern Europe. Contact sales@marketmindsadvisory.com.
oil-filled-power-transformer-market-country-cagr-analysis-1788254924182

Where Transformer Manufacturers Can Capture More Value

Beyond initial equipment sales, transformer manufacturers can capture additional value through service contracts, condition monitoring subscriptions, and specialized engineering positioning that extend well beyond a single capital transaction. Suppliers capturing these adjacent revenue streams early build deeper, stickier utility relationships than those competing purely on initial unit price. Contract structure shapes competitive positioning as much as underlying equipment technology now.

Bundle Oil Testing and Condition Monitoring Services

Manufacturers offering embedded condition monitoring hardware alongside subscription-based oil testing and analytics dashboards capture recurring revenue across the equipment's multi-decade operating life rather than a single transaction alone. These subscriptions typically add 8 to 12 percent to total contract value over the equipment's service life while deepening utility customer relationships through renewal cycles. Utilities increasingly favor suppliers offering this bundled monitoring structure since it improves predictive maintenance scheduling and reduces unplanned outage risk, a genuine commercial advantage over competitors offering equipment-only contracts without embedded analytics capability attached. Early adopters report higher customer retention.
Market Impact: Adds 8 to 12 percent recurring subscription revenue

Offer Extended Multi-Decade Maintenance Service Contracts

Suppliers bundling extended maintenance and oil replacement contracts alongside initial equipment sales capture meaningful aftermarket revenue while reducing customer switching costs across the equipment's multi-decade operating life. This approach suits utilities seeking predictable long-term maintenance budgeting rather than unplanned repair expenditure across their transmission and distribution networks. Extended maintenance contracts typically generate 10 to 15 percent of total contract value as ongoing service revenue, a meaningfully higher margin stream than equipment sales alone, while strengthening long-term customer retention across multiple decades industry-wide. This model also reduces customer churn risk across multiple future replacement cycles considerably.
Market Impact: Generates an estimated 10 to 15 percent revenue

Expand Specialized HVDC Converter Engineering Capability

Manufacturers expanding specialized HVDC converter transformer engineering capability capture a growing share of large infrastructure tenders where technical qualification barriers exclude conventional AC transformer specialists entirely. This approach suits established manufacturers already possessing insulation and winding design capability adaptable from other high-voltage product lines. Qualified HVDC converter transformer contracts typically command a 25 to 35 percent price premium over conventional AC transformers given the specialized engineering and testing requirements involved, positioning suppliers favorably against competitors lacking comparable technical capability. Manufacturers pursuing this path also strengthen long-term relationships beyond the initial infrastructure project delivery.
Market Impact: Commands an estimated 25 to 35 percent premium

Provide Long-Term Framework Supply Agreements Broadly

Suppliers offering multi-year framework supply agreements tied to utility grid modernization pipelines capture predictable recurring revenue while reducing customer switching risk across successive replacement cycles industry-wide. This approach suits utilities seeking supply chain certainty amid ongoing electrical steel cost volatility and lengthy manufacturing lead times across their broader replacement pipeline. Long-term framework agreements typically generate 10 to 15 percent price stability premiums for both parties relative to spot market procurement, a meaningfully valuable arrangement given persistent commodity price uncertainty across the category. This arrangement also deepens long-term customer relationships across multiple successive replacement cycles.
Market Impact: Generates an estimated 10 to 15 percent premium

Who Controls the Margin Pool

Concentration in this market sits at 42 percent among the top five manufacturers, reflecting a moderately fragmented industry structure given the capital intensity of large power transformer manufacturing balanced against numerous capable regional producers. Hitachi Energy leads through established global engineering scale and early renewable interconnection investment, while the gap between it and mid-tier challengers remains meaningful given specialized HVDC converter expertise required.
Current competitive activity centers on renewable interconnection product expansion, HVDC converter qualification, and domestic manufacturing capacity investment tied to national content requirements across several major markets. Several manufacturers have announced joint qualification programmes with grid operators to accelerate approved supplier status ahead of anticipated demand growth rather than waiting for formal tender processes to unfold naturally.

Emerging pressure comes from Chinese and Indian domestic manufacturers who lack the same global qualification track record but compete aggressively on price and delivery scale for standard distribution-grade product tiers. Rankings could shift meaningfully over the next three to five years if these manufacturers successfully expand specialized qualification capability, potentially displacing established suppliers whose commercial position rests heavily on legacy engineering reputation and long-standing utility relationships.
oil-filled-power-transformer-market-company-positioning-matrix-1788254924705

Competitive Moat and Risk Dimensions

HITACHI ENERGY

Moat: Early Renewable Interconnection Investment

Hitachi Energy's early investment in renewable interconnection transformer qualification testing gives it a proven track record with major grid operators that smaller specialist manufacturers cannot easily replicate within a comparable timeframe given the multi-year qualification cycles involved. This qualification track record compounds over time as reference installations accumulate across major grid operator accounts.
HITACHI ENERGY

Risk: Exposure to Regional Price Competition

The company's premium pricing position leaves it exposed to Chinese and Indian domestic manufacturers competing aggressively on price for standardized distribution-grade product tiers, particularly across emerging grid markets less focused on specialized qualification. Continued margin pressure in these segments could gradually erode overall profitability if the shift toward premium products doesn't accelerate.
SIEMENS ENERGY

Moat: Established HVDC Converter Expertise

Siemens Energy's decades-long HVDC converter transformer engineering expertise gives it a strong position in large transmission infrastructure tenders that conventional AC transformer specialists struggle to qualify for given the specialized technical requirements involved. This advantage strengthens further as more countries announce ambitious long-distance transmission corridor projects.
SIEMENS ENERGY

Risk: Slower Domestic Capacity Expansion

The company has moved more slowly than some rivals into domestic manufacturing capacity expansion within key emerging markets, risking share loss where content requirements increasingly favor locally manufactured equipment. Competitors moving faster on domestic manufacturing could capture meaningful qualified supplier share before Siemens Energy closes this gap.

Players Tracked

Prominent Players

Hitachi Energy
Siemens Energy
GE Vernova
Mitsubishi Electric
TBEA

Other Key Players

SPX Transformer Solutions
Toshiba Energy Systems
Hyundai Electric
CG Power and Industrial Solutions
Bharat Heavy Electricals
WEG
ABB
Fuji Electric
Hyosung Heavy Industries
Schneider Electric
Efacec
SGB-SMIT Group
Kirloskar Electric
Prolec GE
Emerson Electric

Recent Developments

FEBRUARY 2026

Hitachi Energy Expands Renewable Transformer Capacity

Hitachi Energy announced a capacity expansion at its Swedish manufacturing facility specifically to meet anticipated demand from renewable interconnection projects across Europe and North America over the coming several years of committed supply orders. The expansion increases annual qualified specialized unit output meaningfully beyond current levels.
Signal: Indicates established manufacturers are committing capital ahead of confirmed order volume materializing fully. Regional demand supports this confidence broadly.
OCTOBER 2025

Siemens Energy Signs HVDC Transmission Framework Agreement

Siemens Energy signed a multi-year framework supply agreement with a major grid operator covering HVDC converter transformers tied to a long-distance transmission corridor connecting remote renewable generation to load centers. The agreement establishes preferred supplier status ahead of individual project-level tenders over the coming years.
Signal: Shows grid operators locking in framework agreements early rather than competing on every individual tender. More deals expected soon.
MAY 2025

TBEA Completes Domestic Renewable Transformer Qualification

TBEA completed qualification testing for its renewable interconnection transformer product line with a leading Chinese grid operator, reporting harmonic filtering and voltage regulation performance comparable to established international competitors under equivalent testing conditions throughout the qualification process. Independent verification follows within several months from a third-party testing laboratory.
Signal: Suggests domestic Chinese suppliers are closing the technical gap with global engineering leaders. Pricing pressure on international suppliers may intensify.

Electrical Steel and Copper Cost Exposure

Grain-oriented electrical steel and copper together represent an estimated 48 percent of transformer manufacturing cost of goods sold, used extensively in cores and windings, with supply sourced predominantly from Japan, South Korea, and China's specialized fabrication facilities. Amorphous core alternatives carry lower no-load loss but require different manufacturing processes, shifting cost structure toward tooling rather than raw material procurement.
Electrical steel prices and lead times spiked sharply during 2021 and 2022 following pandemic-related production disruptions and surging global demand, a volatility event documented in IEA and broader steel industry reporting, which pushed manufacturing costs and delivery timelines higher for suppliers with fixed-price contracts already signed. Suppliers with flexible-price supply arrangements absorbed the volatility more effectively than those locked into long-term fixed contracts negotiated before the disruption began, illustrating the commercial value of adjustable pricing mechanisms.

Manufacturers reliant on spot market electrical steel purchasing face a genuine cost disadvantage against competitors with long-term supply agreements or vertically integrated steel sourcing that reduces exposure to price volatility. This disadvantage is most acute for smaller regional manufacturers lacking established steel producer relationships. Suppliers with vertically integrated sourcing maintain meaningfully better margin stability than smaller developers.
oil-filled-power-transformer-market-cost-volatility-analysis-1788254924899

Diversify Electrical Steel Supply Agreements

Manufacturers are pursuing long-term supply agreements with steel producers across multiple geographies, including European and North American specialty steel makers, to reduce single-region dependence and improve price predictability across multi-year transformer manufacturing and procurement contracts. This diversification has already reduced average exposure to any single steel producer by roughly one-quarter among leading manufacturers pursuing the approach.

Expand Vertically Integrated Steel Sourcing

Several larger manufacturers are pursuing vertically integrated steel sourcing relationships or equity stakes in specialty steel producers specifically to reduce exposure to spot market volatility, even while continuing to purchase supplemental volume from independent third-party suppliers as needed. Several manufacturers expect broader vertical integration to meaningfully reduce cost volatility within the next three to five years across the industry.

Portfolio Architecture for Margin Defence

The oil filled power transformer market organizes into three commercial tiers with meaningfully different margin economics. Volume-commodity distribution-grade units compete primarily on price and delivery reliability, generating moderate margins given standardized designs and intense regional price competition. Premium specialized units command higher margins by offering renewable interconnection and HVDC converter capability. Manufacturers still selling into the volume tier face gradual margin pressure as buyers grow sophisticated.
Sustainability and next-generation formats, particularly high-efficiency amorphous core and advanced insulation designs, represent the smallest but fastest-growing tier, carrying the highest margins given genuine technical differentiation and rising efficiency regulatory pressure. Manufacturers face a persistent tension between defending volume-tier revenue, still the largest absolute dollar pool today, and investing in premium capability where growth concentrates most heavily. Manufacturers hedging across tiers weather transitions more smoothly than specialists.

High-value pools increasingly concentrate around specialized renewable and HVDC transformers and bundled monitoring service contracts rather than standalone equipment sales alone across most major utility accounts. Manufacturers positioned only in the volume-commodity tier face gradual margin erosion as certified competitors capture disproportionate share of new qualification specifications, reinforcing the strategic case for premium tier investment ahead. This shift accelerates as buyers professionalize procurement and demand verified records.

Standard distribution-grade units compete on price and delivery reliability across mature replacement demand, generating moderate margins given intense competition among numerous regional manufacturers. These units remain the industry's proven commercial default despite emerging premium technology pressure from specialized segments.
Gross Margin

Specialized renewable interconnection and HVDC converter units command meaningfully higher margins, reflecting grid operator willingness to pay for demonstrated reliability and specialized engineering. Grid operators view this qualification as a genuine risk-reduction investment rather than discretionary spending.
Gross Margin

High-efficiency amorphous core and advanced insulation designs carry the highest margins given limited competition and genuine engineering differentiation across emerging efficiency-driven procurement programmes. Early commercial success here could meaningfully reshape long-term competitive positioning across the broader category.
Gross Margin
oil-filled-power-transformer-market-portfolio-architecture-1788254925399

High-value Sub-segments and Strategic Watch-out

Renewable Interconnection Transformers

This segment combines the highest current margins with the fastest growth trajectory, making it the clearest priority for manufacturer investment across winding engineering, insulation testing, and material sourcing capability. Suppliers moving early capture disproportionate reference project value across major utility accounts. Source: MMA Estimate, July 2026.

HVDC Converter Transformers

Strong margins paired with rapid growth make this segment a reliable secondary investment priority, particularly for manufacturers developing HVDC converter qualification to win large infrastructure tenders. Qualification success here strengthens negotiating position across the manufacturer's broader global supply chain considerably. Source: MMA Estimate, July 2026.

Large Power Transformers

This large, mature segment anchors current category revenue despite slower growth, and manufacturers must defend this volume base carefully while shifting incremental investment toward faster-growing premium categories. This remains the proven commercial default for most standard replacement contracts across the industry today. Source: MMA Estimate, July 2026.

Distribution Transformers

This segment faces meaningful displacement risk as utilities increasingly favor specialized units for renewable and efficiency reasons, making it a genuine strategic watch-out for manufacturers still exposed here. Few new commodity-only orders are expected going forward across most major markets. Source: MMA Estimate, July 2026.

Service Contracts Anchor Recurring Revenue

Power transformer sales increasingly bundle maintenance and testing service contracts, converting a single capital purchase into a recurring commercial relationship spanning the equipment's multi-decade operating life. Insulating oil requires periodic testing and eventual replacement given gradual degradation under continuous electrical and thermal stress, creating predictable aftermarket revenue for suppliers who win the initial installation contract. Suppliers structuring these contracts well retain relationships across decades rather than competing on price.
Adoption depth varies by end-use vertical. Utility transmission operators show the deepest commitment given binding grid reliability standards, while industrial facility operators adopt more cautiously, weighing capital cost against remaining useful life of existing installed equipment. Renewable interconnection projects sit between these two poles, adopting steadily as grid connection standards increasingly specify specialized transformer designs. This pattern means suppliers must tailor commercial terms across each buyer category.

Buyer profiles are shifting as procurement teams staffed by grid modernization specialists replace generalist engineers less familiar with insulation tradeoffs. Younger procurement teams increasingly demand condition monitoring data and predictive maintenance guarantees rather than relying on supplier reputation alone, reshaping how manufacturers must present technical evidence during tender evaluations. Manufacturers unable to produce this evidence risk losing evaluations to rivals with stronger track records.
oil-filled-power-transformer-market-end-use-penetration-index-1788254925878

Strategic Priorities For Transformer Manufacturers

These are among the four positions where our research anticipates prominent divergence between winners and laggards over the coming forecast period. Each is grounded in the demand model, the regulatory perimeter, and the announced capacity pipeline.
01 / SPECIALIZED PRODUCT INVESTMENT

Accelerate renewable interconnection capability over standard designs

Renewable interconnection transformers carry the fastest segment growth in the category, expanding at more than three-tenths faster than the overall market average through 2036 as solar and wind capacity additions accelerate. Manufacturers still allocating the bulk of engineering budgets toward incremental distribution-grade improvements risk ceding the highest-margin, fastest-growing tier to competitors already scaling specialized winding and insulation capability. Redirecting capital toward this technology now positions a manufacturer to capture premium grid contracts before rivals lock in qualified supplier status across major utility accounts.
02 / REGIONAL MANUFACTURING FOOTPRINT

Expand East Asian capacity while defending Western share

East Asia accounts for the largest single share of global demand overall, driven by China's dominant grid infrastructure investment through State Grid Corporation and Southern Power Grid. North America and Europe remain meaningfully sized markets given grid modernization funding, so manufacturers cannot treat them as secondary despite East Asia's clear volume lead. A balanced footprint spanning multiple regions reduces exposure to any single market's demand cycle or policy shift over the coming decade as investment accelerates across additional manufacturing regions.
03 / HVDC ENGINEERING PRIORITY

Invest in HVDC converter qualification capability now

HVDC converter transformers represent the second-fastest growing segment in the category, and manufacturers lacking dedicated internal qualification capability risk gradually losing large infrastructure tenders to competitors already demonstrating proven deployment records. HVDC converter engineering requires sustained metallurgical and electrical investment over multiple years before commercial qualification results materialize with major grid operators across the industry globally. Manufacturers that commit to this qualification path early will capture disproportionate share of transmission corridor contracts before the window narrows further across the industry.
04 / AFTERMARKET SERVICE EXPANSION

Build recurring monitoring and maintenance revenue streams now

Power transformers create a genuine and lasting opportunity for recurring condition monitoring and oil testing service contracts that traditional equipment-only sales never supported at meaningful commercial scale across their multi-decade operating life. These recurring revenue streams carry materially higher margins than one-time equipment sales and deepen utility relationships across multi-year renewal and replacement cycles considerably more. Manufacturers building these service capabilities now, rather than treating transformers as a pure hardware sale, will capture a disproportionate share of lifetime customer value ahead.

Engagement Snapshot From the Field

A live engagement with an industry participant carrying material or product regulatory and market exposure ahead of a defining policy shift, showing how our research translates into a defensible multi-year portfolio strategy.
MARKET MINDS ADVISORY · CLIENT ENGAGEMENT SUMMARY
Oil Filled Power Transformer Producer Strategic Portfolio Review and Transition Roadmap 2026·Investment Scenario on Oil Filled Power Transformer Exposure Evaluation 2025-26
CLIENT PROFILE
The client is a regional grid operator managing an aging transformer fleet with a substantial share of units approaching or exceeding their typical forty-year design service life across its transmission and distribution network (client-reported, unverified by MMA). The operator faced mounting pressure to accelerate replacement given both aging infrastructure risk and growing renewable interconnection queue demand.
STRATEGIC CHALLENGE
Leadership needed to decide whether to prioritize aging fleet replacement, renewable interconnection capacity expansion, or pursue a combined approach given constrained capital budgets across multiple competing infrastructure priorities. Internal estimates suggested deferring either priority risked meaningful reliability or interconnection queue delays within the next several years (client-reported, unverified by MMA).
MMA APPROACH
MMA conducted a structured assessment combining primary interviews with transformer manufacturers, competitive benchmarking of announced grid modernization programmes globally, and capital allocation modeling across combined replacement and expansion scenarios under consideration. The engagement drew on MMA's primary research dataset and expert interview programme to quantify realistic capacity and cost trajectories.
KEY FINDINGS
  1. Manufacturer lead times for specialized renewable interconnection units extended meaningfully longer than for conventional distribution-grade replacement units currently ordered across most vendor accounts.
  2. A combined procurement approach bundling aging fleet replacement with renewable interconnection capacity offered meaningful economies of scale in manufacturer negotiations (client-reported, unverified by MMA).
  3. Competing grid operators that had already committed to framework supply agreements were securing better pricing and priority delivery slots than those competing tender by tender.
  4. Condition monitoring integration during replacement added modest incremental cost but meaningfully improved long-term maintenance budget predictability across the operator's broader distribution network.
CLIENT PROFILE
The client is a regional grid operator managing an aging transformer fleet with a substantial share of units approaching or exceeding their typical forty-year design service life across its transmission and distribution network (client-reported, unverified by MMA). The operator faced mounting pressure to accelerate replacement given both aging infrastructure risk and growing renewable interconnection queue demand.
STRATEGIC CHALLENGE
Leadership needed to decide whether to prioritize aging fleet replacement, renewable interconnection capacity expansion, or pursue a combined approach given constrained capital budgets across multiple competing infrastructure priorities. Internal estimates suggested deferring either priority risked meaningful reliability or interconnection queue delays within the next several years (client-reported, unverified by MMA).
MMA APPROACH
MMA conducted a structured assessment combining primary interviews with transformer manufacturers, competitive benchmarking of announced grid modernization programmes globally, and capital allocation modeling across combined replacement and expansion scenarios under consideration. The engagement drew on MMA's primary research dataset and expert interview programme to quantify realistic capacity and cost trajectories.
KEY FINDINGS
  1. Manufacturer lead times for specialized renewable interconnection units extended meaningfully longer than for conventional distribution-grade replacement units currently ordered across most vendor accounts.
  2. A combined procurement approach bundling aging fleet replacement with renewable interconnection capacity offered meaningful economies of scale in manufacturer negotiations (client-reported, unverified by MMA).
  3. Competing grid operators that had already committed to framework supply agreements were securing better pricing and priority delivery slots than those competing tender by tender.
  4. Condition monitoring integration during replacement added modest incremental cost but meaningfully improved long-term maintenance budget predictability across the operator's broader distribution network.
RECOMMENDED STRATEGY
Phase 1: Phase one: sign a framework supply agreement bundling both replacement and interconnection needs to secure priority delivery and favorable pricing. Phase 2: Phase two: execute risk-based phased replacement prioritizing oldest and highest-fault-rate installations over the following three years of the modernization programme. Phase 3: Phase three: integrate condition monitoring capability across all replacements to build long-term predictive maintenance capability across the entire broader network.
OUTCOME
The operator signed a framework agreement securing priority delivery slots and began phased replacement ahead of schedule, reducing projected peak-year capital spending meaningfully versus the original uniform replacement plan (client-reported, unverified by MMA). The combined approach is now referenced internally as a template for future infrastructure programmes.

Frequently Asked Questions

Foundational context covering the market sizes, CAGR, scope, country, region and competition that inform every finding below. This section is provided to cover basics and most often pre-purchase conversations, answered from the MMA Primary Research Dataset.

What is the current size of the Oil Filled Power Transformer Market?

The oil filled power transformer market reached an estimated 18.5 billion dollars in 2025. Growth is driven by grid modernization and renewable interconnection investment across major global markets.

How large will the Oil Filled Power Transformer Market be by 2036?

MMA projects the market will reach approximately 31.7 billion dollars by 2036. This reflects sustained demand for specialized transformer designs across expanding grid infrastructure worldwide.

What is the CAGR for the Oil Filled Power Transformer Market 2026 to 2036?

The base case compound annual growth rate is 5.0 percent across the forecast period. Bull and bear scenarios range from 6.2 percent to 3.8 percent depending on renewable capacity pace.

Which segment is growing fastest?

Renewable interconnection transformers are the fastest-growing segment, expanding at 8.5 percent annually. That is roughly 1.7 times the overall market growth rate through the forecast period.

Who are the major companies in the Oil Filled Power Transformer Market?

Leading companies include Hitachi Energy, Siemens Energy, GE Vernova, Mitsubishi Electric, and TBEA. Together these five companies hold an estimated 42 percent combined market share.

Which country is growing fastest?

India leads regional growth at an estimated 7.5 percent annually through 2036. Expansion is driven by national electrification programmes and domestic manufacturing capacity growth nationwide.

Report Segmentation Architecture

The full report scope spans multiple orthogonal segmentation dimensions, with cross-tabulated demand data provided for each dimension pair. Coverage extends further to regional breakdowns, trend trajectories, and the competitive detail needed to support segment-level decision-making.
  • Distribution Transformers
  • Medium Power Transformers
  • Large Power Transformers
  • Extra Large Power Transformers
  • Renewable Interconnection Transformers
  • HVDC Converter Transformers
  • Utility Transmission Infrastructure
  • Utility Distribution Networks
  • Renewable Energy Generation
  • Industrial Facility Power
  • Rail and Transportation Power
  • Original Equipment Supply Contracts
  • Framework Supply Agreements
  • Condition Monitoring Subscriptions
  • Extended Maintenance Contracts

By Region

  • East Asia
  • North America
  • Western Europe
  • South Asia and Pacific
  • Middle East and Africa
  • Latin America
  • Eastern Europe

Scope, Methodology, and Coverage

Every figure in this report is reproducible from documented input assumptions. The scope below maps the historical period, the forecast horizon, the segmentation dimensions, and the countries covered, alongside the underlying primary and qualitative methodology.
Historical Period
2020 to 2025
Forecast Period
2026 to 2036
Base Year
2025 (USD billions; MMA Primary Research Dataset, September 2026)
Market Definition
This report covers oil filled power transformers used for voltage transformation in transmission and distribution grid applications, typically rated above 10 MVA. It excludes dry-type transformers, distribution transformers below 10 MVA, and instrument transformers used for metering and protection.
Quantitative Units
USD billions
Segmentation Dimensions
Regions Covered
East Asia, North America, Western Europe, South Asia and Pacific, Middle East and Africa, Latin America, Eastern Europe
Countries Covered
Key Companies Profiled
Hitachi Energy, Siemens Energy, GE Vernova, Mitsubishi Electric, TBEA, SPX Transformer Solutions, Toshiba Energy Systems, Hyundai Electric, CG Power and Industrial Solutions, Bharat Heavy Electricals, WEG, ABB, Fuji Electric, Hyosung Heavy Industries, Schneider Electric, Efacec, SGB-SMIT Group, Kirloskar Electric, Prolec GE, Emerson Electric
Quantitative Methodology
Primary survey, n=3,800 respondents, Q4 2025, six countries; demand-side model with trade association cross-validation
Qualitative Methodology
47 expert interviews, Q4 2025; applied to validate demand model assumptions, identify emerging dynamics, and assess competitive positioning
Report Format
PDF and XLSX data workbook (Word format preview document)
Publisher
Market Minds Advisory
Report Code
MMA-2026-CON-137
Published
September 2026
Contact
sales@marketmindsadvisory.com | www.marketmindsadvisory.com

Purchase the full Oil Filled Power Transformer Market Report (2026 to 2036).

This report provides a comprehensive analysis of the global oil filled power transformer market, covering market sizing, segmentation, regional dynamics, and competitive positioning through 2036. It examines the shift toward specialized renewable interconnection and HVDC converter designs. The analysis quantifies regional demand concentration across seven world regions and profiles the twenty leading manufacturers shaping category development. It draws on primary survey data spanning 3,800 respondents and expert interviews with 47 industry specialists. Company disclosures round out the evidence base supporting strategic decisions for manufacturers, utilities, and investors.
Ten-year global revenue and volume forecasts
Seven-region demand concentration and growth analysis
Twenty-company competitive benchmarking and profile analysis
Segment-level growth rate and margin data
Input cost and supply risk assessment
Strategic verdict and investment priority guidance

Built For The People Who Decide

From boardroom strategy to bench-side execution, this report is read cover-to-cover by leaders shaping the next decade of their industry, turning demand scenarios, market dynamics and valuation benchmarks into decisions.
CXOs/ Presidents/ VPs/ Managers
M&A and Corporate Development
Strategy Teams and R&D Heads
Procurement and Product Directors
Regulatory and Compliance Leaders
Investor Relations and Equity Analysts