Market Minds Advisory
Offshore Wind Market

Offshore Wind Market: Scaling Turbines, Shifting Supply Chains

Floating wind platforms are moving from pilot arrays toward commercial scale just as fixed-bottom project costs keep rising and United States permitting freezes stall a pipeline that developers spent a decade building toward construction.

Lead Analyst

David Horsley

Published

August 2026

Make Smarter Decisions with Customized Research Insights

Request a free sample report and evaluate market opportunities, growth trends, and competitive dynamics relevant to your business needs.

2025 MARKET VALUE$48.5BMarket Size 2025
2036 FORECAST VALUE$135.6BBase Case , 2026 to 2036
CAGR 2026 TO 20369.8 %Bull 11.0% / Bear 8.5%
INCREMENTAL OPPORTUNITY$82.4BNet 10- year value creation
EXPANSION MULTIPLE2.55x2036 value over 2026 base
Strategic Levers
M&A Pipeline
Regional Outlook
Country Rankings
Competitive Intelligence
Segmental Deep-dive
Call-Us : 91 93563 13602

Executive Snapshot and Market Trajectory

Offshore wind is bifurcating into two distinct businesses: a maturing fixed-bottom industry now facing cost discipline and supply chain consolidation, and an emerging floating segment still proving commercial viability at scale, with capital and policy attention increasingly favoring whichever segment can demonstrate bankable project economics fastest across markets.
China's state-backed developers and domestic turbine makers now install more offshore wind capacity annually than the rest of the world combined, pulling East Asia's regional share to 30%, the largest of any region tracked. Floating semi-submersible platforms grow fastest at 16.5%, roughly 1.68 times the overall rate, as Norway, South Korea, and France move pilot floating arrays toward first commercial-scale projects over the coming several years across multiple national programs.
Competitive intensity is reshaping fast: five companies control under two-thirds of installed and contracted capacity, yet Chinese turbine makers are winning export orders in markets that once belonged exclusively to European suppliers. Regulatory whiplash adds to this, as a United States permitting freeze has stalled several East Coast projects while South Korea and Taiwan accelerate approvals to attract the same investment America is losing to faster-moving regional competitors across the wider Asia-Pacific supply chain now.
Market Definition
The offshore wind market covers electricity generation and associated infrastructure from wind turbines installed in marine and coastal waters, spanning fixed-bottom foundations, floating platforms, subsea cabling, and offshore substations through to grid connection. It excludes onshore wind generation, offshore oil and gas infrastructure, and marine energy technologies such as tidal and wave power.
Base Year Value
$48.5B in 2025 (MMA Primary Research Dataset, August 2026)
Forecast Period
2026 to 2036, eleven discrete annual values
CAGR
9.8% base case. Bull 11.0%. Bear 8.5%.
Fastest Growth Segment
Floating Semi-Submersible Platforms: 16.5% CAGR
Fastest Growth Country
South Korea: 17.5% CAGR
Fastest Growth Region
South Asia and Pacific: 12.0% CAGR
Largest Region
East Asia: 30% of 2025 global value
Market Leaders
Ørsted, Vestas, Siemens Gamesa, GE Vernova, MingYang Smart Energy. Source: MMA Analysis based on company annual reports.
Primary Survey
n=3,800 procurement and R&D decision-makers, Q4 2025, six countries
Methodology
Demand-side build-up, cross-validated against public data, 47 expert interviews

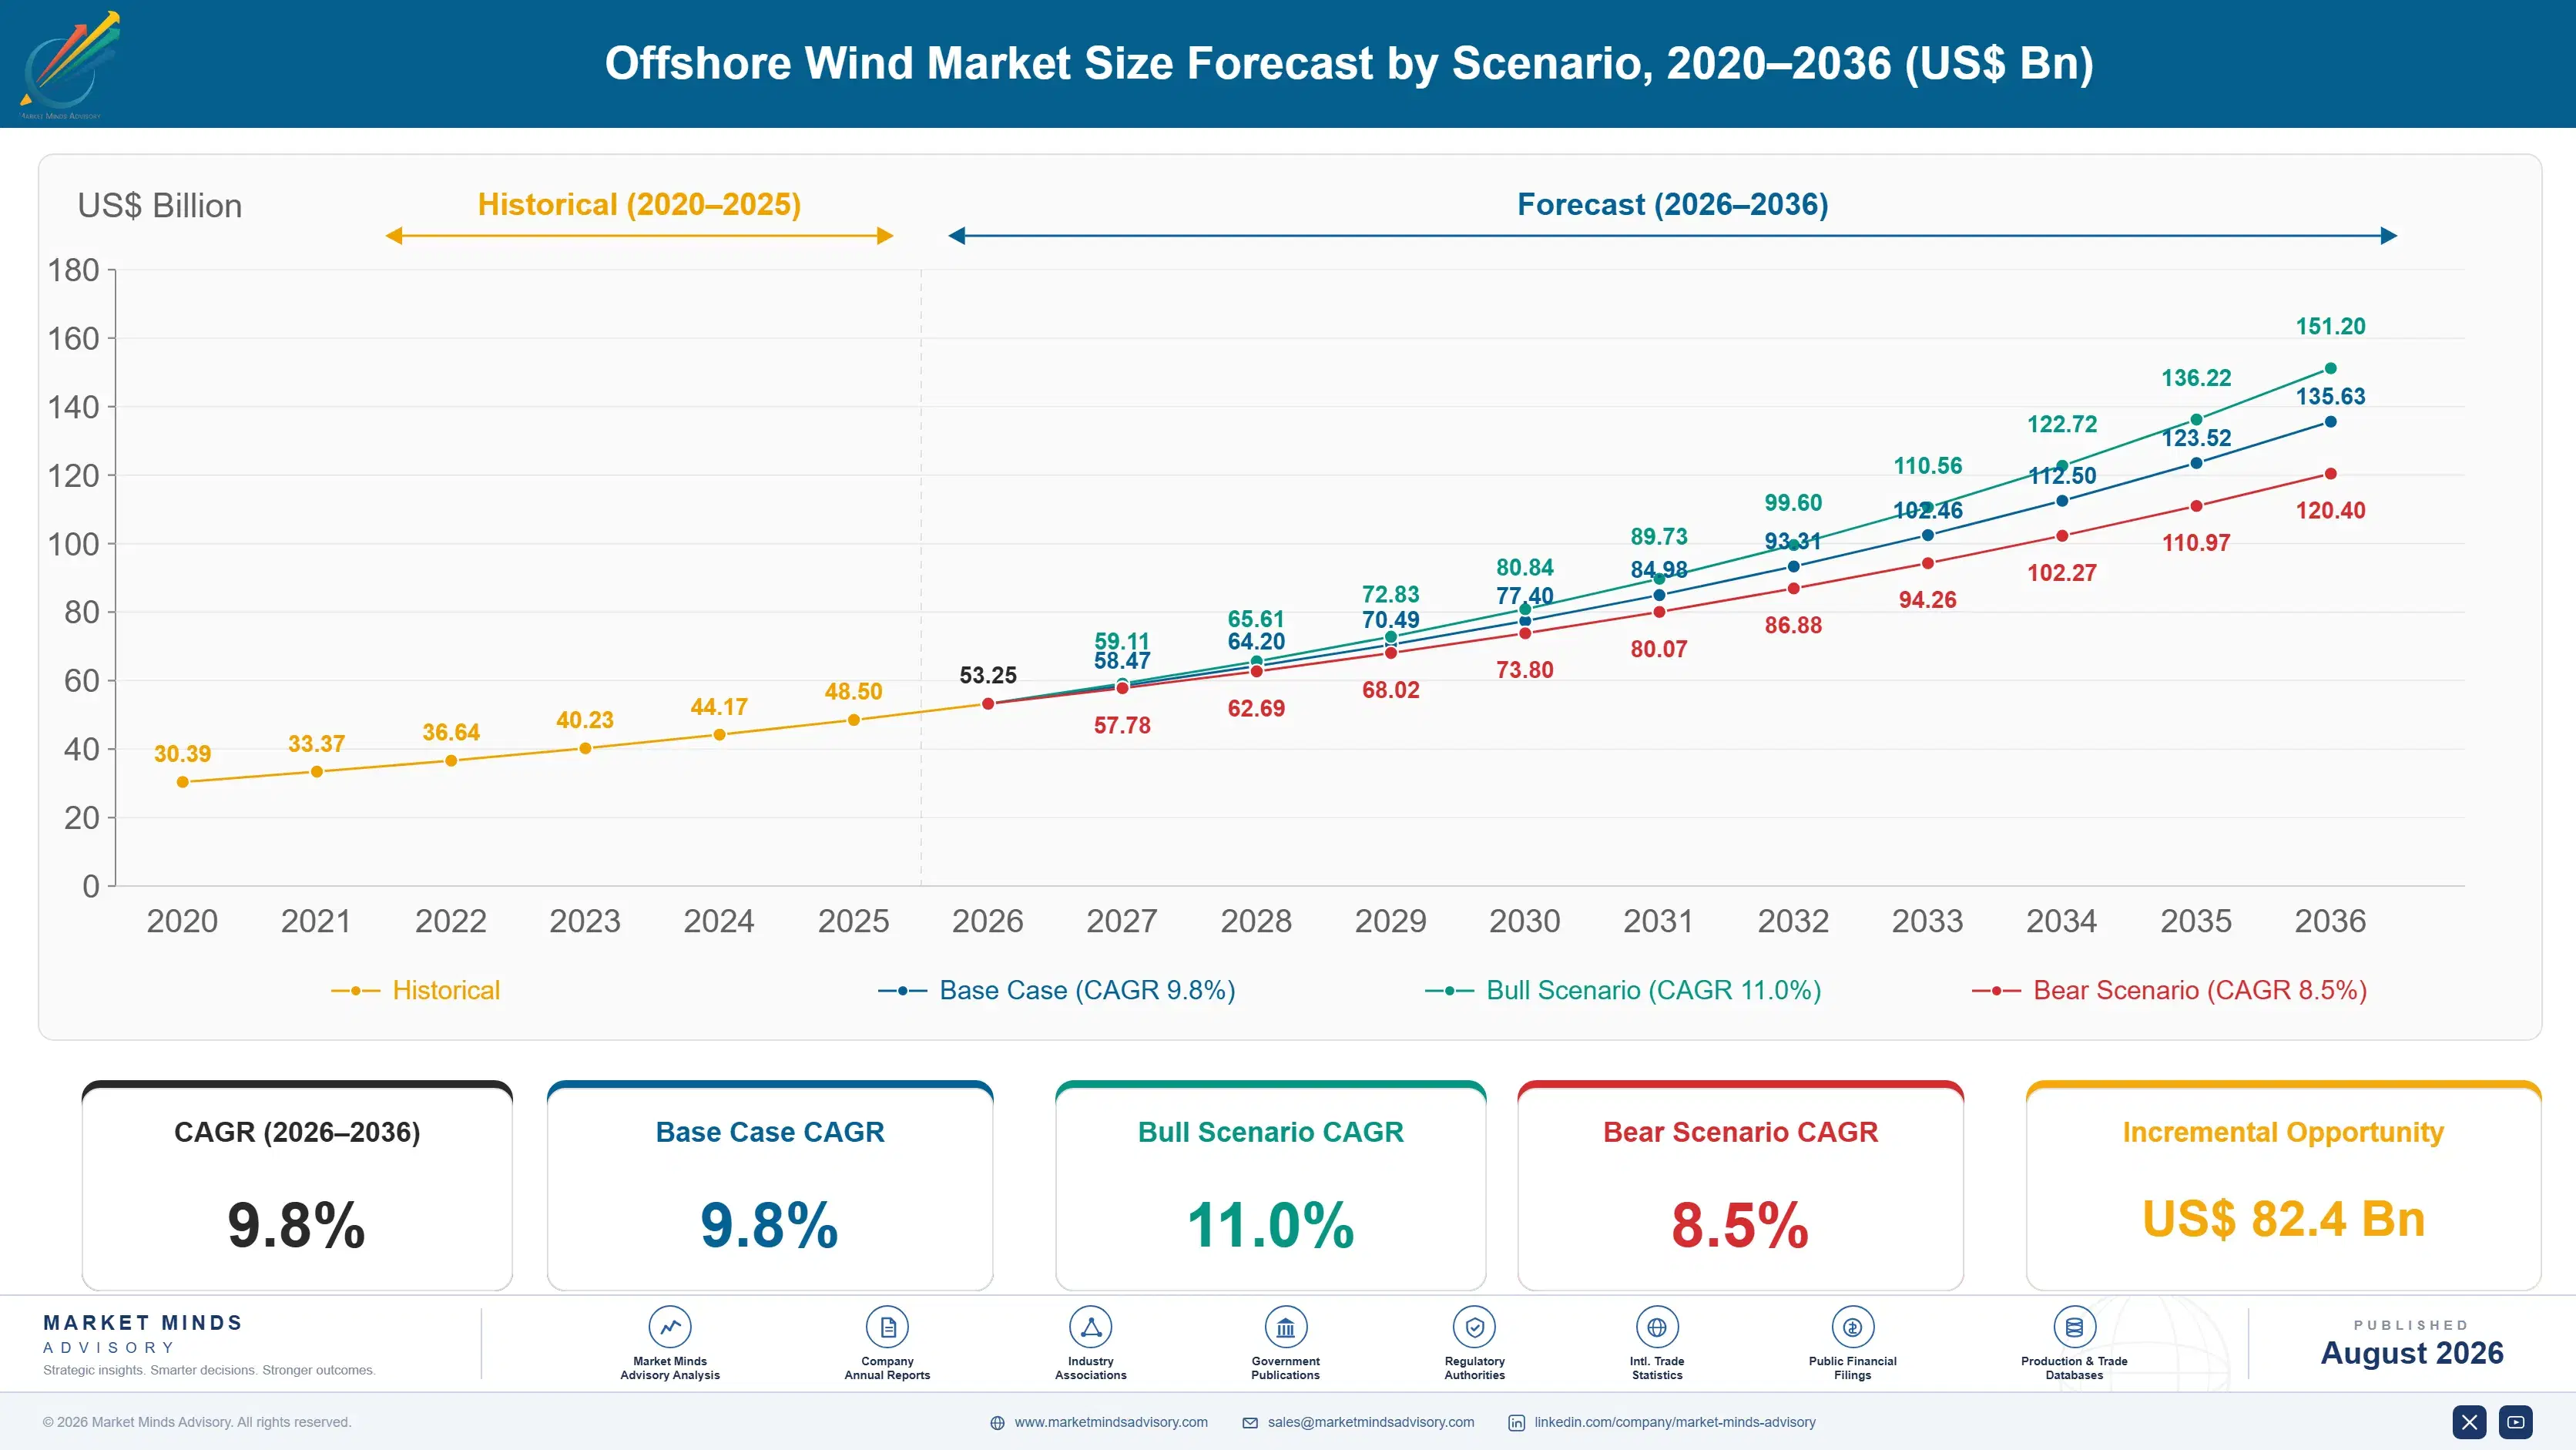
Offshore Wind Market Forecast Scenarios

offshore-wind-market-size-forecast-scenario-1787300702710
Between 2020 and 2025 the market grew at roughly 8.3% annually, held back by pandemic-era supply chain disruption and a 2022 to 2023 cost inflation shock that forced several European developers to renegotiate or cancel signed power purchase agreements. China's installation pace kept climbing through the period, offsetting European and American delays and giving the global total a steadier trajectory than any single region's experience suggests.
The base case carries the market to 9.8% annual growth through three mechanisms. First, China's domestic build-out keeps compounding as state utilities commit to multi-gigawatt tenders regardless of global cost trends. Second, floating wind technology is reaching commercial bankability in Norway, South Korea, and France, opening deep-water sites fixed-bottom foundations cannot reach. Third, turbine capacity per unit keeps scaling upward, letting developers extract more output from the same seabed footprint, improving project economics even where costs have risen.
The bull case, 11.0%, assumes the United States permitting freeze lifts within the forecast window and several stalled East Coast projects restart construction, adding meaningful pent-up capacity. The bear case, 8.5%, assumes continued permitting uncertainty and steel and vessel cost inflation keep pushing developers to delay final investment decisions, particularly across smaller European and American pipelines.

Scaling Turbines, Shifting Supply Chains

Three forces converge on this market simultaneously. Turbine capacity keeps scaling past 15 megawatts per unit, letting developers extract more output from the same seabed lease area. China's state-directed build-out keeps compounding independent of the cost and policy volatility disrupting European and American pipelines. And floating platforms are opening deep-water sites that fixed-bottom foundations physically cannot reach, expanding the addressable seabed area considerably.
MARKET CONCENTRATIONCR5: 64%Top five developers control most contracted capacity worldwide
LEVELIZED COST OF ENERGYUSD 60 to 95 per MWhCosts vary sharply by water depth and region
TOP PRODUCING COUNTRYChina: 48% of installsChinese yards now dominate global turbine and foundation output
CAPACITY FACTOR42% to 52%Offshore sites generate power far more consistently than onshore
FOUNDATION COST SHARE31% of COGSSteel foundations and installation dominate total project construction cost
DEVELOPMENT CYCLE7 to 10 yearsPermitting and construction still take far longer than expected
Commercially, offshore wind behaves like heavy infrastructure financed against decades-long power purchase agreements rather than a conventional equipment sale. Developers, utilities, and turbine makers share project risk across long construction timelines, and a single delayed permit or vessel shortage can push a multi-billion-dollar project's economics meaningfully. That capital intensity, more than any single technology choice, increasingly determines which developers can still compete.
Over the next decade expect continued consolidation among installation vessel operators as demand for specialized heavy-lift ships outstrips available fleet capacity across nearly every major region. Floating platforms will move from single-turbine pilots toward multi-gigawatt commercial arrays over the coming several years. And Chinese turbine exports will keep pressuring European and American manufacturers on price in markets well outside their traditional strongholds.
"Offshore wind used to be a European story with an American subplot. Now it's a Chinese story, and everyone else is negotiating around the edges of it."
Director, Renewable Energy Infrastructure Practice · MMA Energy Practice &

Market Trends

Floating Wind Reaches First Commercial-Scale Projects

Norway's Utsira Nord and South Korea's Ulsan floating wind zones have moved from pilot arrays toward multi-hundred-megawatt commercial tenders, with several projects targeting final investment decisions before 2028. France's three commercial floating pilot arrays, commissioned between 2024 and 2025, are providing the operating data developers need to underwrite larger projects at bankable financing terms. Floating platforms let developers access water depths beyond 60 meters that fixed-bottom foundations cannot economically reach, opening seabed area that dwarfs the shallow continental shelf sites the industry has relied on for its first two decades of commercial development.
Market Impact: Installs over 50% global capacity
Turbine Capacity Keeps Scaling Past 15 Megawatts

GE Vernova's Haliade-X and Siemens Gamesa's SG 14-236 DD platforms have pushed single-turbine capacity well past 14 megawatts, with several manufacturers now testing prototypes above 18 megawatts for deployment later this decade. Larger turbines mean fewer units per project, cutting foundation, cabling, and installation vessel time per megawatt installed, which materially improves project economics even as individual turbine cost rises. MingYang has pushed even further with a floating-specific platform exceeding 16 megawatts, aimed specifically at deep-water Asian markets where per-unit installation cost matters more than in shallower European waters generally seen today.
Market Impact: Adds 500 MW-plus corporate offtake deals

Market Opportunities and Growth Drivers

China's State-Directed Offshore Build-Out Keeps Compounding

China's National Energy Administration has set successive five-year targets that state utilities and provincial governments translate directly into tender volume, insulating the domestic pipeline from the cost inflation and permitting delays disrupting European and American projects. China installed more offshore wind capacity in recent years than the rest of the world combined, and domestic turbine makers including Goldwind, Envision, and MingYang now supply nearly the entire domestic market, having displaced the European suppliers that once dominated China's early offshore projects. That vertical domestic supply chain gives Chinese developers a cost structure competitors elsewhere cannot easily replicate.
Market Impact: Stalls over 10 GW of projects

European Utilities Commit To Long-Term Offtake Agreements

Corporate power purchase agreements from technology companies and industrial buyers seeking renewable energy credentials are increasingly underwriting offshore wind projects alongside traditional utility offtake contracts, giving developers a second demand channel independent of government auction schedules. Microsoft, Google, and Amazon have all signed multi-hundred-megawatt renewable offtake agreements that include offshore wind capacity, reflecting data center operators' growing appetite for firm, large-scale renewable supply. This corporate demand channel is particularly valuable in markets where government auction schedules have slowed or paused entirely, giving developers a financing path that does not depend on any single national policy cycle continuing uninterrupted.
Market Impact: Raises vessel day rates by 40%

Market Restraints and Challenges

United States Permitting Freeze Stalls East Coast Projects

A 2025 federal permitting pause halted environmental review and construction approvals for several East Coast offshore wind projects that had already secured state contracts and begun preliminary construction, leaving billions in committed capital exposed to indefinite delay. The root cause is a shift in federal energy policy that reversed the previous administration's expedited permitting approach for offshore wind. The commercial impact falls hardest on developers with the most site work already underway, since sunk cost cannot be recovered if a project is cancelled. Some developers are pursuing litigation while others shift capital toward projects with clearer regulatory paths.
Market Impact: Opens seabed depths beyond 60 meters

Steel And Vessel Costs Keep Compressing Project Margins

Foundation steel, specialized installation vessels, and skilled offshore labor costs have all risen faster than turbine prices have fallen, compressing developer margins across nearly every fixed-bottom project sanctioned since 2022. The root cause is a supply bottleneck: too few heavy-lift vessels exist relative to the pipeline of projects seeking construction slots, and steel prices stay exposed to industrial demand cycles developers cannot control. The commercial impact has forced several European developers to renegotiate power purchase agreements or cancel projects rather than proceed at a loss. Some developers now order vessels years ahead of need and lock multi-year steel supply contracts.
Market Impact: Cuts foundation cost per MW 20%
3 additional market trends, 2 additional growth drivers, and 4 additional restraints and challenges are covered in the full report. Contact sales@marketmindsadvisory.com to access the complete intelligence.

Segment CAGR and Growth Architecture

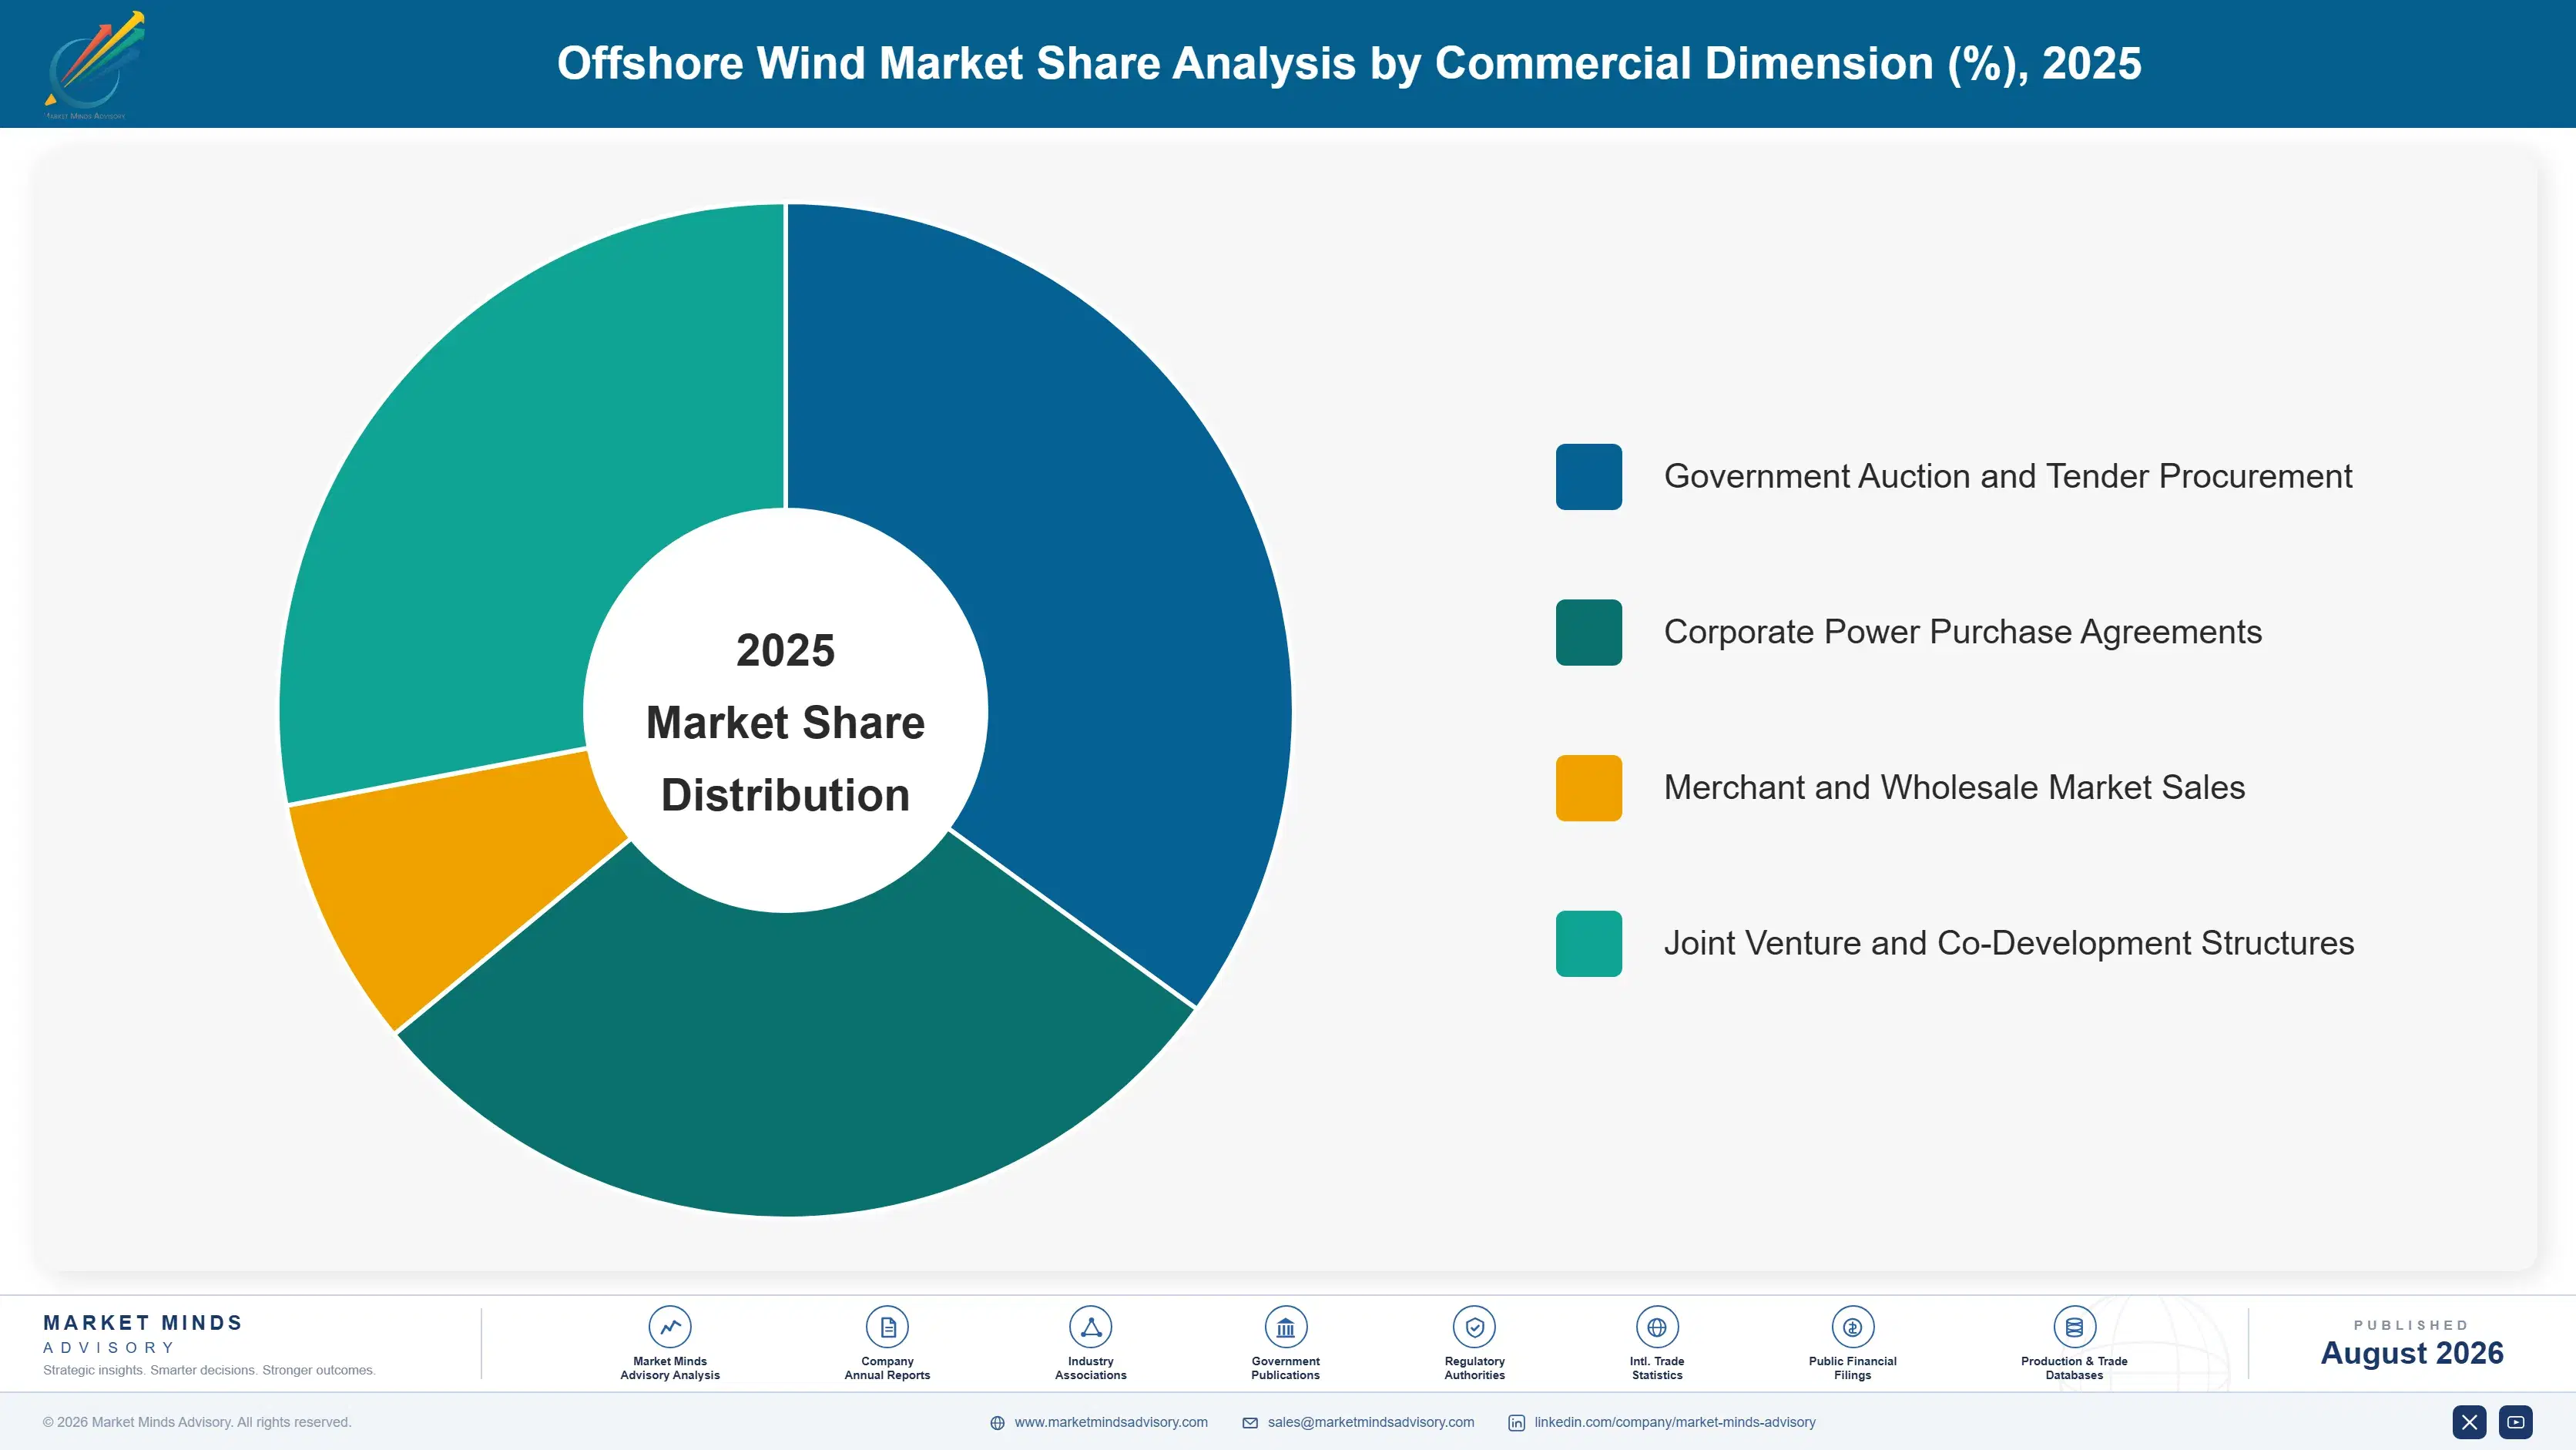
Segmentation follows foundation and platform type, the engineering distinction that determines which water depths and seabed conditions a project can access. Monopile, jacket, and gravity-based foundations serve fixed-bottom sites, while semi-submersible, spar-buoy, and tension-leg platforms serve floating deep-water sites, so commercial position tracks water depth capability rather than turbine brand, ownership structure, or manufacturing origin.
offshore-wind-market-market-share-analysis-1787300703272

Floating Semi-Submersible Platforms

Floating semi-submersible platforms grow fastest at 16.5%, roughly 1.68 times the overall market rate, as this design proves the most commercially mature of the three floating architectures, combining relatively simple port-based assembly with stability characteristics that suit a wide range of metocean conditions. Principle Power's WindFloat design and Equinor's Hywind-derived platforms both use semi-submersible architecture, and it dominates the near-term commercial floating project pipeline across Norway, South Korea, and France specifically. Manufacturing and assembly can largely happen quayside rather than requiring specialized offshore construction vessels for the platform itself, which cuts installation cost relative to spar-buoy designs that need deep-water ports for vertical assembly. That practical advantage is why floating tenders increasingly specify semi-submersible designs by default.
CAGR 16.5%

Floating Spar-Buoy Platforms

Floating spar-buoy platforms grow second-fastest at 14.2%, about 1.45 times the overall rate, offering superior stability in deep, rough water conditions like those found off Norway's continental shelf, where Equinor's Hywind Tampen project has operated successfully since 2022. The design's long vertical draft provides inherent stability without the active ballast systems some competing architectures require, reducing maintenance complexity once installed. The tradeoff is assembly: spar-buoy platforms need deep, sheltered fjord-like ports capable of vertical launch, which limits where they can be manufactured and assembled to a small number of suitable coastal locations worldwide. That port constraint is the main reason semi-submersible designs are winning a larger share of near-term commercial tenders despite spar-buoy's superior offshore performance.
CAGR 14.2%
Full segment breakdown across 6 segments available in the complete report.

Regional Architecture and Country Demand Map

East Asia leads on value at 30% of the global total, driven by China's domestic build-out and supply chain dominance. Western Europe and North America follow closely, anchoring mature project pipelines. South Asia and Pacific, Latin America, the Middle East, and Eastern Europe complete a distribution across seven regions.

North America

A decade of state-level clean energy mandates built the pipeline that a 2025 federal permitting pause has now frozen mid-construction, leaving North America's 22% share, the bottom of its typical band, reflecting genuine policy-driven uncertainty rather than weak underlying demand. Vineyard Wind, Revolution Wind, and South Fork Wind remain under construction or newly operational off the Northeast coast, having secured permits before the policy shift took effect. New York and New Jersey continue running state procurement processes despite federal headwinds, keeping developer interest alive even as construction timelines slip. Growth of 8.6%, near the bottom of its typical band, reflects this genuine policy overhang rather than any underlying demand weakness.
Share: 22% | CAGR: 8.6% (2026 to 2036)

Western Europe

The United Kingdom alone hosts more operating offshore wind capacity than any other single country outside China, anchoring Western Europe's mature 22% share alongside Germany, Denmark, and the Netherlands. Ørsted, RWE, and Iberdrola all run substantial European project portfolios, and the region's supply chain, from Siemens Gamesa's Danish turbine plants to Belgian and Dutch cable manufacturers, remains the most vertically developed outside China specifically. Germany's offshore auctions have increasingly required negative bids, meaning developers pay for site access rather than receiving subsidy, a sign of how mature and competitive the region's project economics have become. Growth of 8.2%, the softest pace among the seven regions tracked, reflects this underlying market maturity rather than weakening demand.
Share: 22% | CAGR: 8.2% (2026 to 2036)
Regional intelligence for 5 additional markets available in the complete report: East Asia, South Asia and Pacific, Latin America, Middle East and Africa, Eastern Europe. Contact sales@marketmindsadvisory.com.
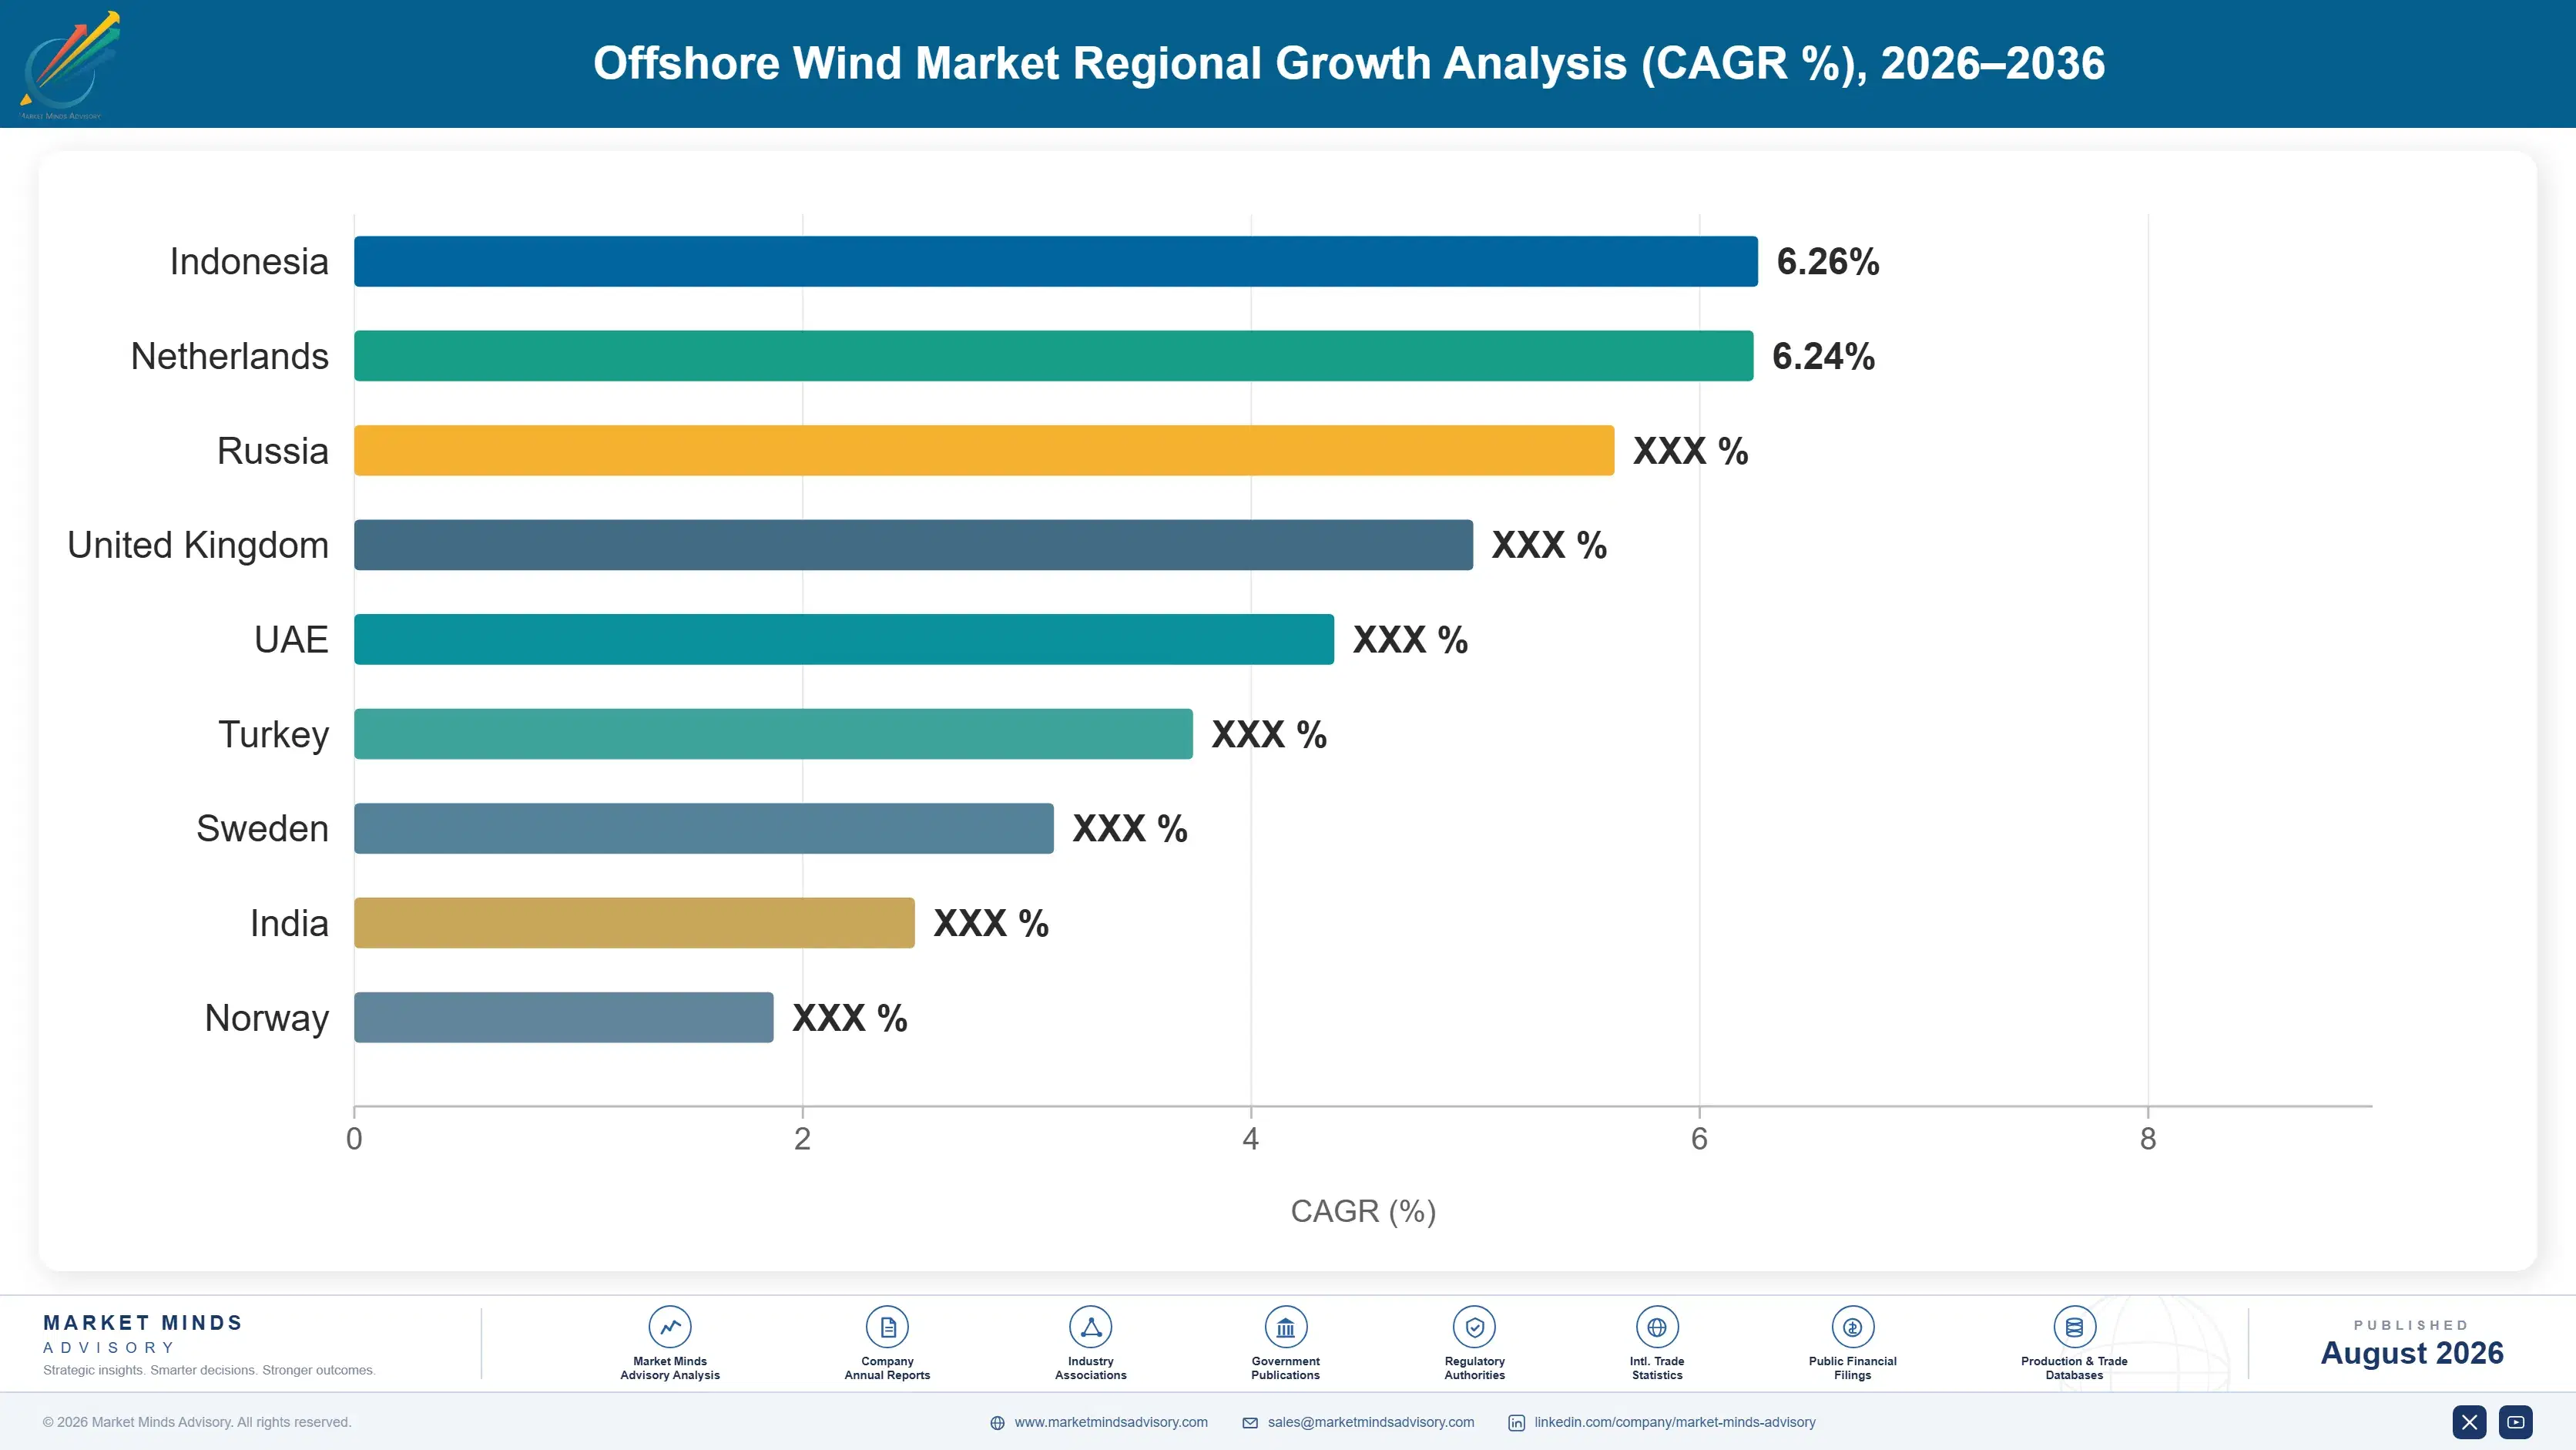
offshore-wind-market-country-cagr-analysis-1787300703784

How Offshore Wind Players Can Defend Value

Margin increasingly depends on managing construction risk and financing structure rather than turbine technology alone, as cost inflation keeps compressing returns on conventionally structured projects. The four levers below target risk transfer, service, and financing revenue that offshore wind developers and suppliers have historically left underexploited, converting a single construction-phase payoff into a longer, more defensible value stream.

Sell Long-Term Operations And Maintenance Service Contracts

Turbine manufacturers increasingly sell 15 to 20 year service and maintenance contracts alongside the physical turbine sale, covering blade inspection, gearbox monitoring, and remote performance optimization across a project's full operating life. Vestas and Siemens Gamesa both report meaningful recurring service revenue that persists regardless of ongoing new turbine order volume, smoothing income against the cyclical nature of new project sanctioning. This shifts manufacturer economics toward annuity-style cash flow rather than depending entirely on lumpy multi-hundred-turbine orders that arrive unevenly across the project development cycle. Developers benefit too, since predictive maintenance meaningfully cuts costly offshore vessel mobilization for unplanned repairs.
Market Impact: Adds 15 to 20 year recurring service revenue

Offer Construction Risk Insurance And Financing Products

Specialized insurers and project finance arrangers increasingly offer construction delay and cost overrun coverage tailored to offshore wind's unique risk profile, capturing premium revenue that generalist insurers have historically underpriced or declined to offer. Lenders and equity investors pay for this risk transfer given how often vessel delays and permitting setbacks have disrupted recent projects across multiple markets. Firms with deep offshore wind underwriting expertise, rather than generalist infrastructure insurers, are capturing 2% to 4% outsized margin on this coverage because the risk assessment requires specialized technical knowledge competitors lack, creating a genuine moat for willing providers.
Market Impact: Captures 2% to 4% premium underwriting margin annually

Bundle Corporate Offtake With Green Certificate Programs

Developers increasingly bundle physical power delivery with renewable energy certificate programs and carbon accounting support for corporate offtake buyers, capturing premium pricing above standard utility power purchase agreement rates. Technology companies seeking verifiable renewable claims for data center operations pay 10% to 15% more for offshore wind offtake bundled with this documentation and reporting support than for equivalent unbundled generation elsewhere. This premium reflects genuine value: corporate sustainability teams need audit-ready documentation, not just electrons, to satisfy increasingly stringent disclosure requirements from regulators and shareholders alike. Developers building this documentation capability in-house capture meaningfully more of this premium themselves.
Market Impact: Commands 10% to 15% premium on offtake deals

Finance Floating Platform Fabrication Through Shared Port Investment

Floating platform fabrication requires specialized port infrastructure, deep-water quaysides capable of handling multi-thousand-tonne structures, that few individual developers can justify building alone. Shared port investment consortia, splitting fabrication infrastructure cost across multiple developers and projects, cut individual project capital requirements by roughly 30% while building the reusable regional infrastructure floating wind needs to scale beyond isolated pilot projects. Norway and South Korea have both pursued this model explicitly, treating port infrastructure as shared national policy rather than a cost any single developer bears alone. Developers participating early secure priority access and negotiating leverage over fabrication slots latecomers do not get.
Market Impact: Cuts individual project capital costs by roughly 30%

Who Controls the Margin Pool

Five companies control just under two-thirds of installed and contracted capacity, a tight concentration for infrastructure this capital-intensive. Ørsted and Vestas both lead on scale, though Ørsted leads project development while Vestas leads turbine supply, occupying different points in the value chain. Installed capacity, the basis used throughout this assessment, favors developers and manufacturers with the deepest pipelines.
Competitive activity currently runs across three dimensions. Turbine makers race to certify ever-larger platforms before rivals lock in supply agreements for the next tender cycle. Chinese manufacturers are winning export orders in markets, including Southeast Asia and the Middle East, that once belonged exclusively to European suppliers. Installation vessel capacity has become a genuine bottleneck, with owners of specialized heavy-lift ships commanding pricing power that shapes which developers can build on schedule.

Pressure is building from two directions that could reshuffle rankings within the decade. Korean and Japanese manufacturers, absent from the key player list, are scaling floating platform capability to serve their domestic floating wind targets. Chinese turbine makers, already dominant domestically, are beginning to win export contracts in Europe and Latin America, forcing Western manufacturers to decide whether to compete on price or retreat toward premium positioning instead.
offshore-wind-market-company-positioning-matrix-1787300704309

Competitive Moat and Risk Dimensions

ØRSTED A/S

Moat: Deepest Global Project Pipeline

Ørsted holds the broadest portfolio of operating and under-construction offshore wind capacity of any single developer worldwide, built over two decades of early-mover project origination across Europe, the United States, and Asia. That scale gives it negotiating leverage with turbine suppliers and installation vessel operators that smaller regional developers cannot match on comparable terms.
ØRSTED A/S

Risk: Exposure To US Project Cancellation

Ørsted carries significant exposure to United States East Coast projects now caught in the federal permitting freeze, several of which represent billions in committed capital that could face indefinite delay or outright cancellation. That concentrated American exposure sits alongside broader balance sheet strain following prior project impairments elsewhere in its portfolio.
VESTAS WIND SYSTEMS A/S

Moat: Broadest Turbine Platform Range

Vestas ships turbine platforms across the widest range of capacity classes and foundation types of any manufacturer, letting it bid competitively across nearly any project specification from shallow fixed-bottom sites to emerging floating platforms. That breadth reduces dependence on any single regional market's demand cycle for overall order volume.
VESTAS WIND SYSTEMS A/S

Risk: Rising Chinese Export Competition

Vestas faces intensifying price competition from Chinese manufacturers now bidding on projects outside China itself, threatening the export markets that have historically offset softer demand at home. Matching Chinese pricing without matching their vertically integrated domestic supply chain cost structure remains a genuine unresolved challenge.

Key Players

Ørsted A/S
Vestas Wind Systems A/S
Siemens Gamesa Renewable Energy S.A.
GE Vernova Inc.
MingYang Smart Energy Group Co., Ltd.

Others

RWE Renewables GmbH
Iberdrola S.A.
Equinor ASA
EnBW Energie Baden-Württemberg AG
TotalEnergies SE
CSSC Haizhuang Wind Power Co., Ltd.
Envision Energy Co., Ltd.
Xinjiang Goldwind Science & Technology Co., Ltd.
Nexans S.A.
Prysmian Group
Subsea 7 S.A.
Van Oord
Jan De Nul Group
Boskalis
Shell plc

Recent Developments

APRIL 2025

Federal Permitting Freeze Halts Multiple East Coast Projects

A federal executive action paused environmental review and construction permits for several East Coast offshore wind projects, including some that had already begun preliminary site work. The action reversed the prior administration's expedited permitting approach and left affected developers evaluating litigation options against the freeze.
Signal: Signals that offshore wind's American pipeline now faces genuine multi-year political risk beyond ordinary permitting timeline variation.
SEPTEMBER 2025

Equinor And Shell Sign Floating Wind Development Agreement

Equinor and Shell signed a joint development agreement to co-develop a floating wind project off the Norwegian coast, sharing both capital commitment and technical risk across the project's early development phase. The agreement was structured as a joint venture rather than a supply contract or equity investment.
Signal: Signals major oil and gas majors are deepening floating wind commitments despite broader sector cost pressure.
JANUARY 2025

MingYang Wins First European Floating Wind Turbine Order

MingYang secured its first commercial order to supply floating wind turbines for a European pilot project, marking Chinese turbine makers' initial entry into the European floating wind segment. The order was a direct equipment supply contract, not a joint venture or manufacturing partnership between the companies involved.
Signal: Signals Chinese turbine makers are beginning to compete directly in European markets long dominated by domestic suppliers.

What Really Drives Project Construction Cost

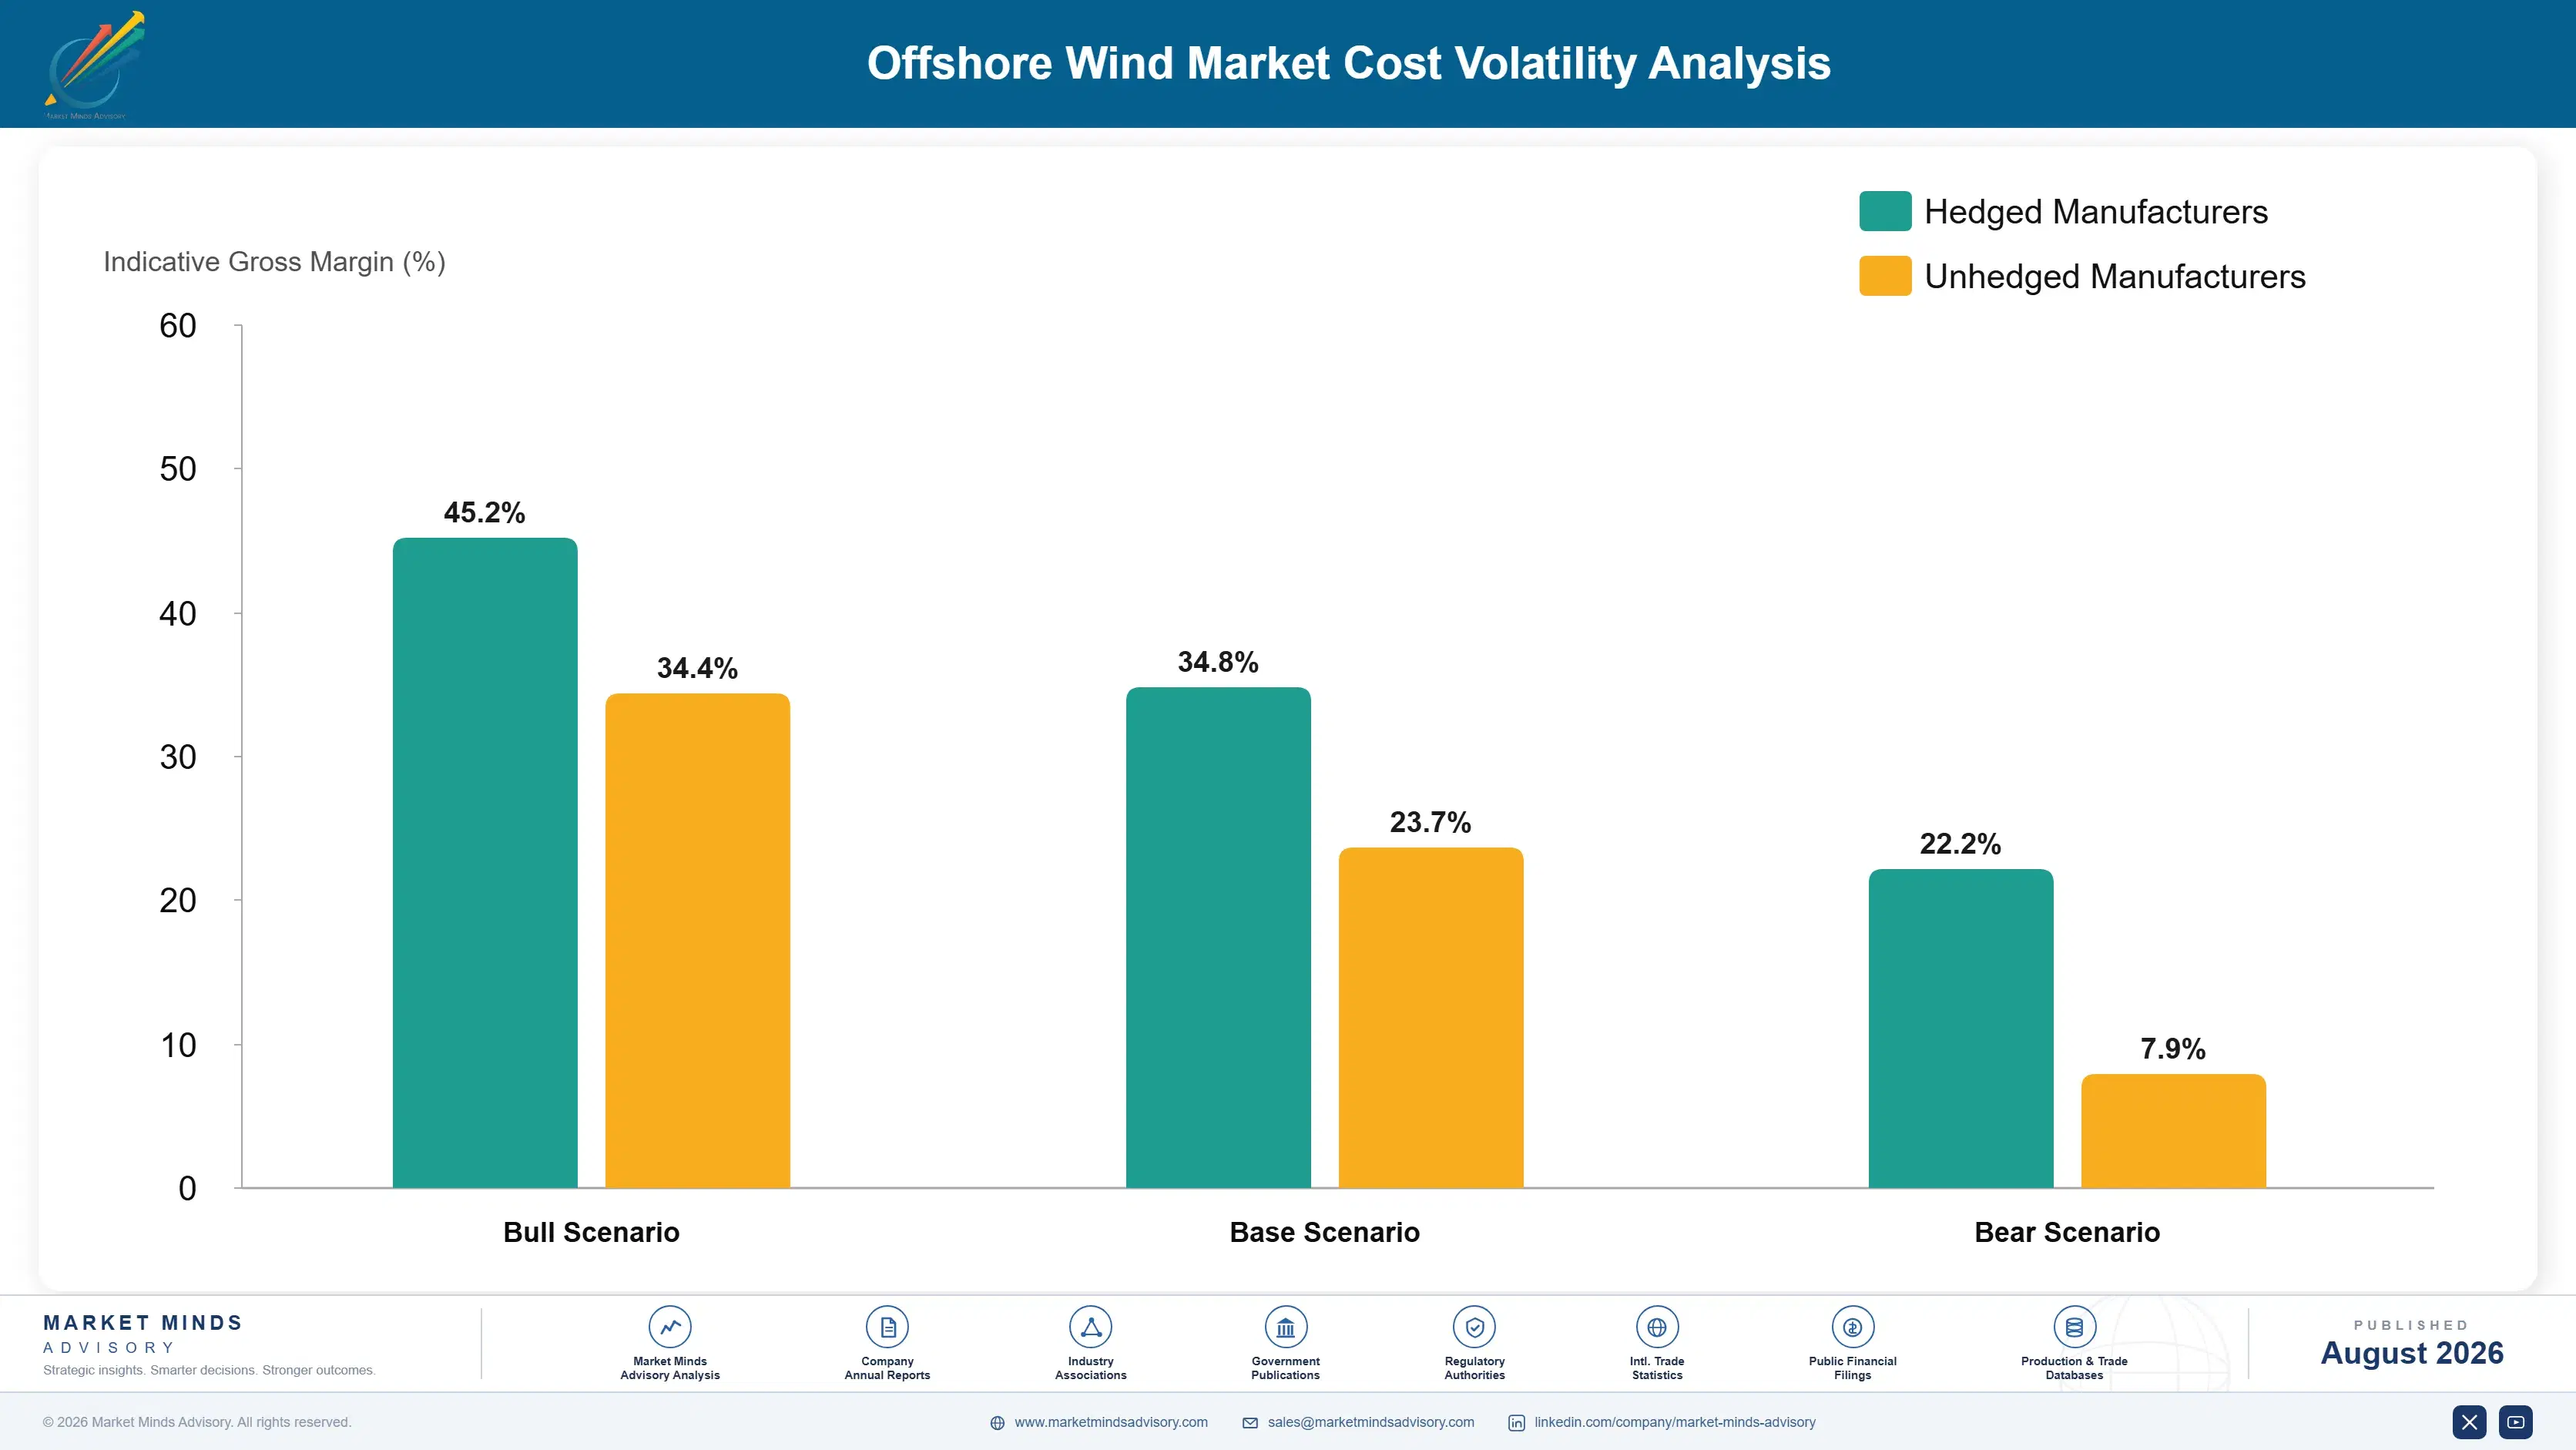
Foundation steel and specialized fabrication account for roughly 31% of total project construction cost, sourced primarily from South Korean, Chinese, and European steel mills and fabrication yards. Installation vessel day rates and offshore labor add another 25%, while the turbine itself, nacelle, blades, and tower, makes up most of the remainder, reflecting how construction and logistics costs have grown relative to equipment cost.
Steel and vessel costs spiked sharply in 2022 and 2023 as industrial commodity inflation coincided with a shortage of specialized heavy-lift installation vessels relative to the pipeline of projects seeking construction slots. Ørsted's 2023 annual report cited cost inflation as the primary driver behind several project impairments and cancelled power purchase agreements, and multiple developers across Europe and the United States reported similar pressure, pushing some smaller projects toward delayed investment decisions.

Smaller regional developers carry the sharpest exposure, since they lack the pipeline scale to negotiate long-term vessel charter agreements that Ørsted and RWE secure years in advance. Geographic exposure varies too: European developers face tighter vessel availability than Chinese projects, where domestic fleet capacity has scaled to match the country's own installation pipeline, a gap that widens whenever global vessel demand spikes across multiple regions.
offshore-wind-market-cost-volatility-analysis-1787300704506

Lock Multi-Year Installation Vessel Charter Agreements Early

Developers with sufficient project pipeline scale are negotiating multi-year vessel charter agreements directly with specialized heavy-lift operators, trading pricing flexibility for guaranteed construction slots during industry-wide vessel shortages. This approach favors the largest developers disproportionately, since minimum commitment volumes required for priority booking sit well beyond what smaller regional developers can commit to reliably.

Order Custom Vessels Years Ahead Of Construction Need

Some developers and vessel operators now commission new specialized installation vessels years before a specific project requires them, trading upfront capital commitment for guaranteed capacity when construction windows finally open. This approach adds financing cost and utilization risk but reduces the risk of schedule slippage that vessel scarcity has repeatedly caused across recent projects.

Build Regional Fabrication Capacity Near Project Sites

Opening foundation fabrication yards closer to major project clusters, as several developers have done across the Taiwan Strait and Baltic Sea, cuts logistics cost and vessel transit time even when core steel still ships from concentrated global mills, shortening the exposed portion of the construction schedule meaningfully for participating developers and their contracted suppliers.

Portfolio Architecture for Margin Defence

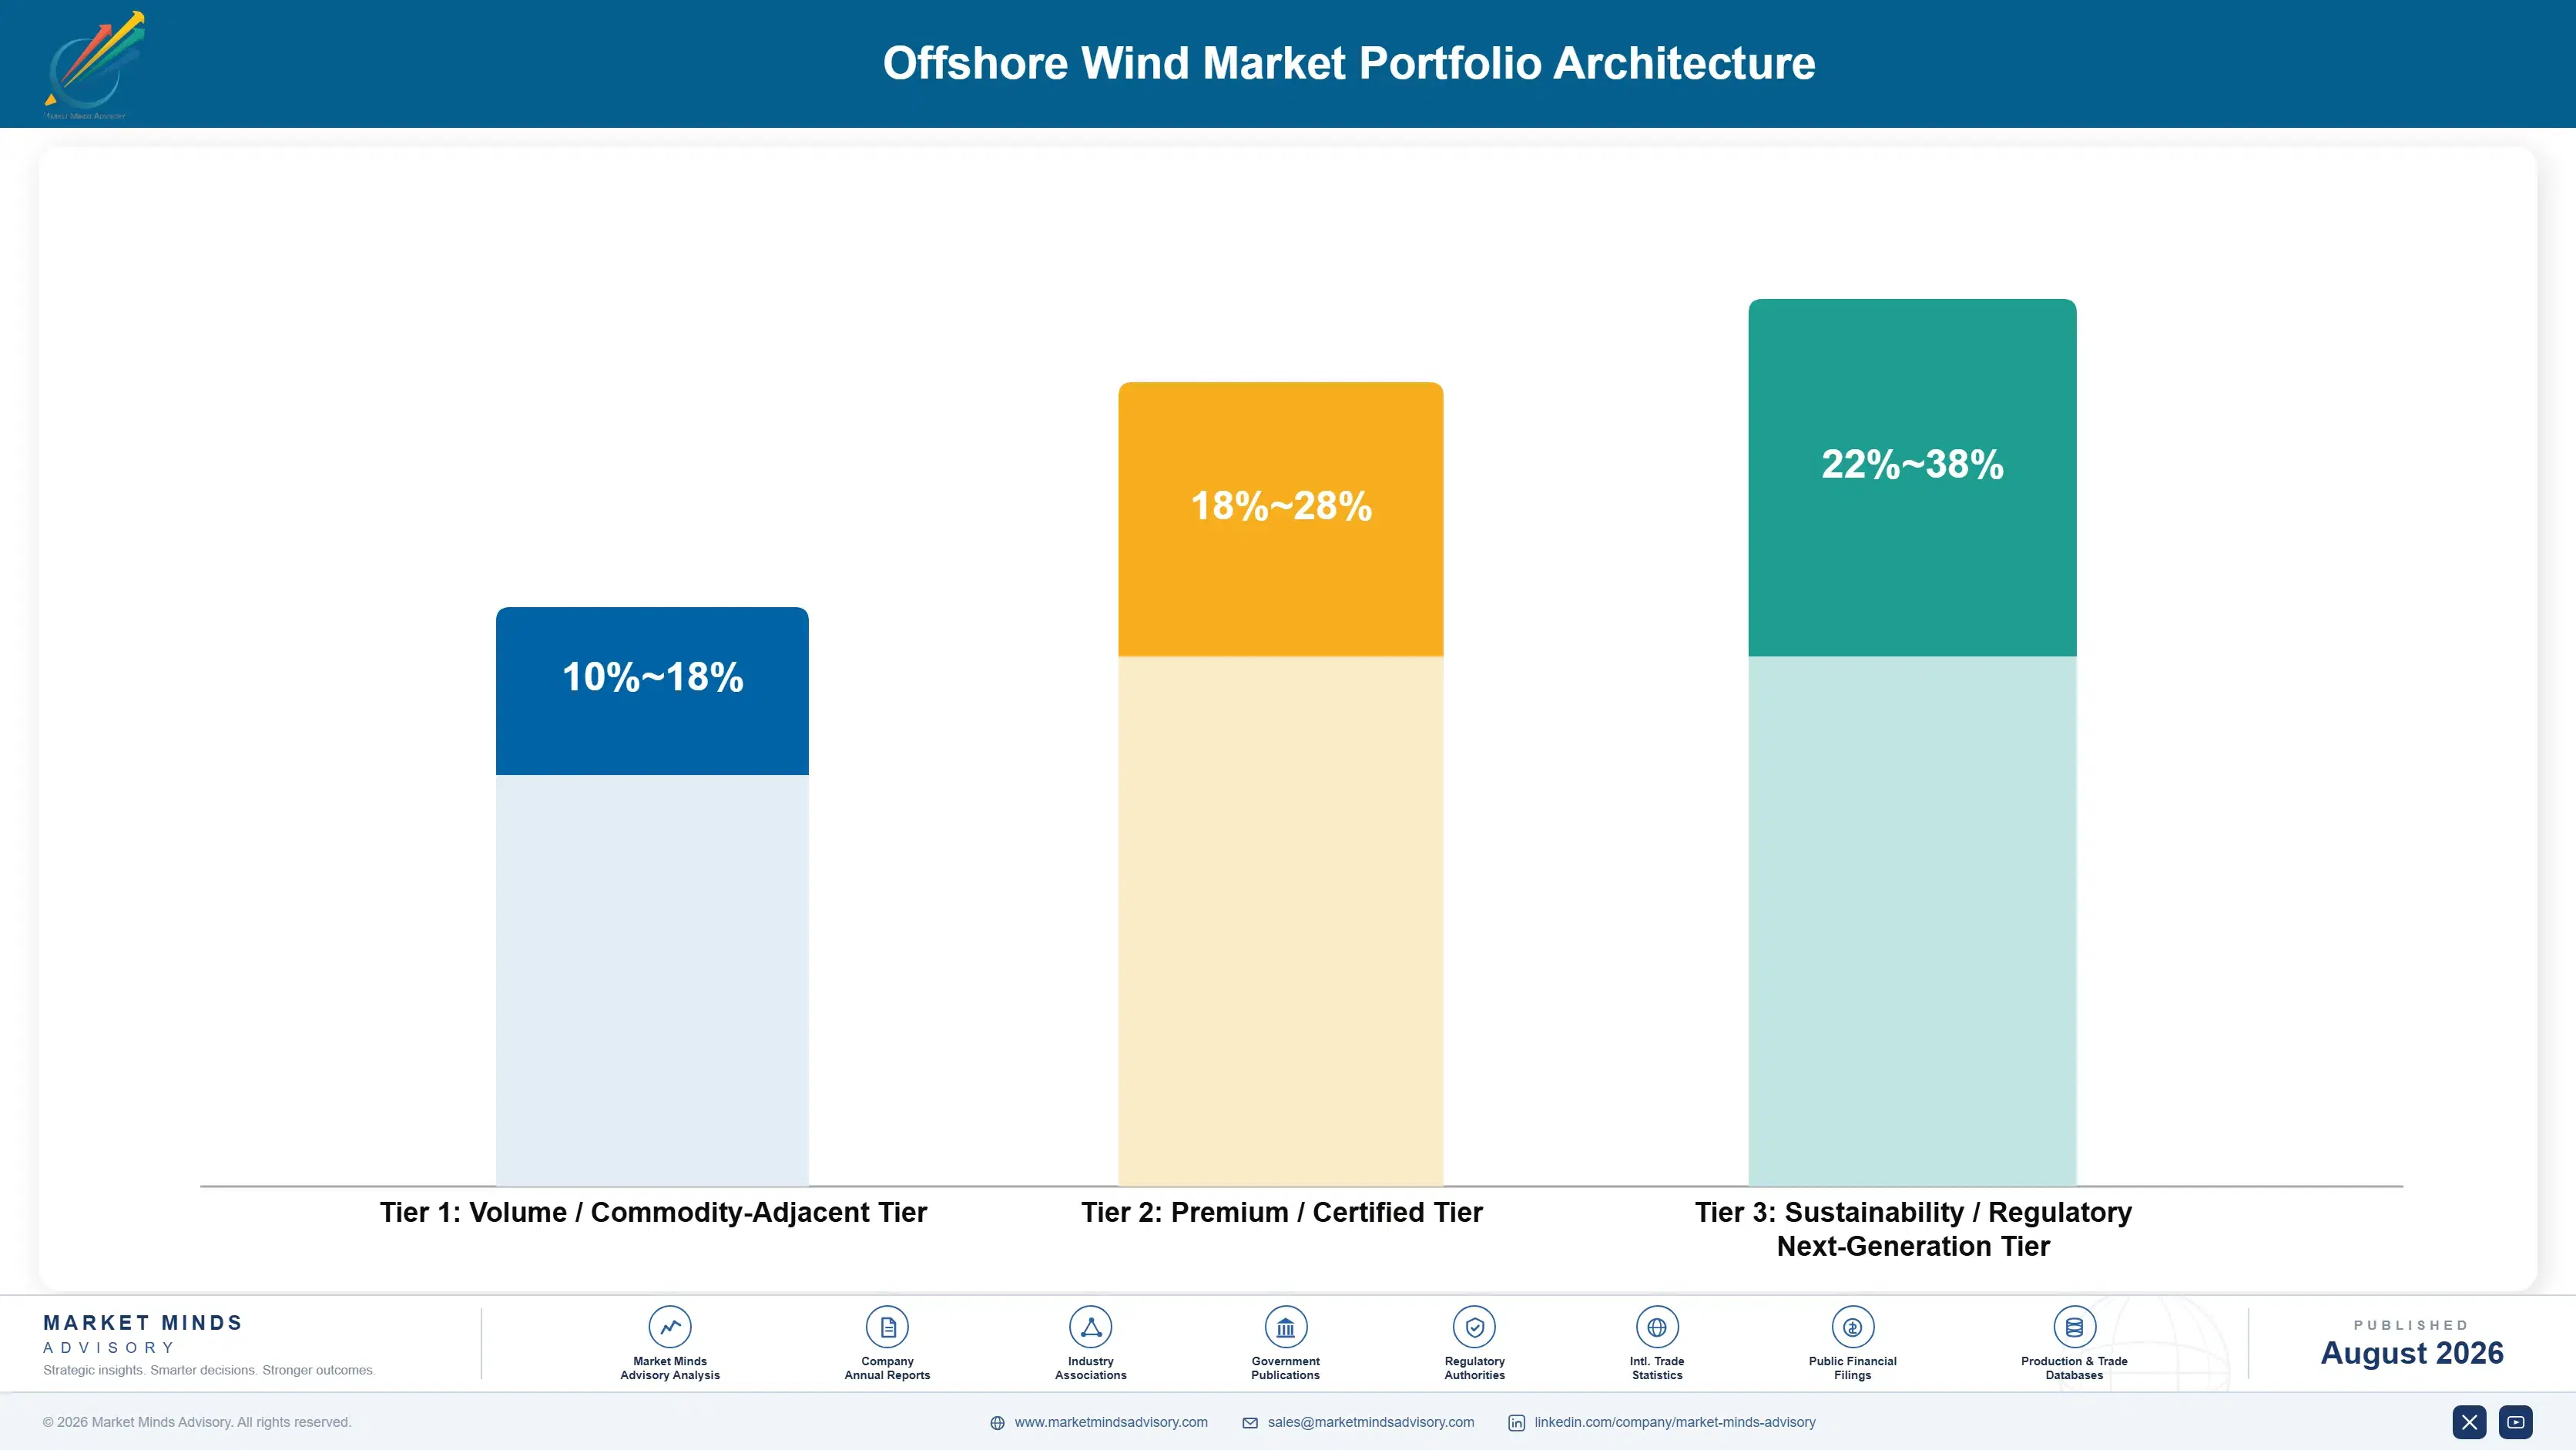
The portfolio splits into three tiers with real margin separation. Volume-tier work, standard fixed-bottom monopile projects in shallow, well-understood sites, competes on execution discipline and earns modestly. Premium certified projects, covering jacket foundations in deeper water and projects with corporate offtake premiums, earn considerably more because technical complexity and buyer relationships support pricing. Next-generation floating platforms occupy the top tier, commanding the stron
The tension here is familiar to any capital-intensive infrastructure business: volume fixed-bottom projects fund the balance sheet strength and vessel relationships that floating projects depend on, yet fixed-bottom growth alone cannot capture the deep-water sites floating technology is built to access. Developers leaning too heavily into floating platforms risk overextending technically unproven capital ahead of demonstrated bankability, while those staying purely fixed-bottom cede the fastest-growing, longest-runway segment to better-capitalized rivals.

High-value pools concentrate where technical complexity, corporate offtake premiums, and floating-capable water depth intersect: deep-water projects serving buyers willing to pay for verified renewable provenance. That intersection is still a small minority of total installed capacity globally but expanding quickly, which is why the next-generation tier grows fastest even while representing a modest share of total capacity today.

Volume / Commodity-Adjacent Tier

Standard fixed-bottom monopile projects in shallow, well-understood sites, competing on construction execution and cost discipline against an increasingly commoditized bidding process across most mature global markets tracked in this segmentation.
Gross Margin: 10%-18%

Premium / Certified Tier

Jacket foundation projects in deeper water and fixed-bottom projects carrying corporate offtake premiums, sold to developers and buyers willing to pay for technical complexity and documented provenance across major markets.
Gross Margin: 18%-28%

Sustainability / Regulatory / Next-Generation Tier

Floating platform projects representing the technology and water-depth frontier, priced at a premium justified by unproven-but-improving bankability and access to deep-water sites that fixed-bottom foundations simply cannot reach at all today.
Gross Margin: 22%-38%
offshore-wind-market-portfolio-architecture-1787300705038

High-value Sub-segments and Strategic Watch-out

Floating Semi-Submersible Platforms

The fastest-growing and highest long-run margin segment, expanding at 16.5% as this design proves the most commercially mature floating architecture available today. Quayside assembly cuts installation cost relative to rival floating designs, and tenders increasingly specify it by default across nearly every near-term commercial floating program.
Gross Margin: 22%-38%

Jacket Foundations

High value with strong growth as projects move into deeper water beyond monopile's practical range, though overall expansion trails floating platforms since jacket technology remains fundamentally fixed-bottom and depth-limited, capping how far into deep water this segment can realistically extend over the coming decade of project development.
Gross Margin: 18%-28%

Monopile Foundations

The volume core by installed capacity, covering the bulk of shallow-water projects worldwide, generating steady but thin margins under intensifying price competition across nearly every mature market tracked, as bidding processes grow more commoditized each year across the global monopile fabrication and supply chain network.
Gross Margin: 10%-18%

Gravity-Based Foundations

The strategic watch-out, as developers increasingly favor monopile and jacket designs over gravity-based construction for most sites, leaving this niche category shrinking steadily even as total fixed-bottom capacity keeps expanding across nearly every major offshore market tracked in this year's full segmentation review and analysis.
Gross Margin: 8%-16%

How Offshore Wind Demand Actually Commits

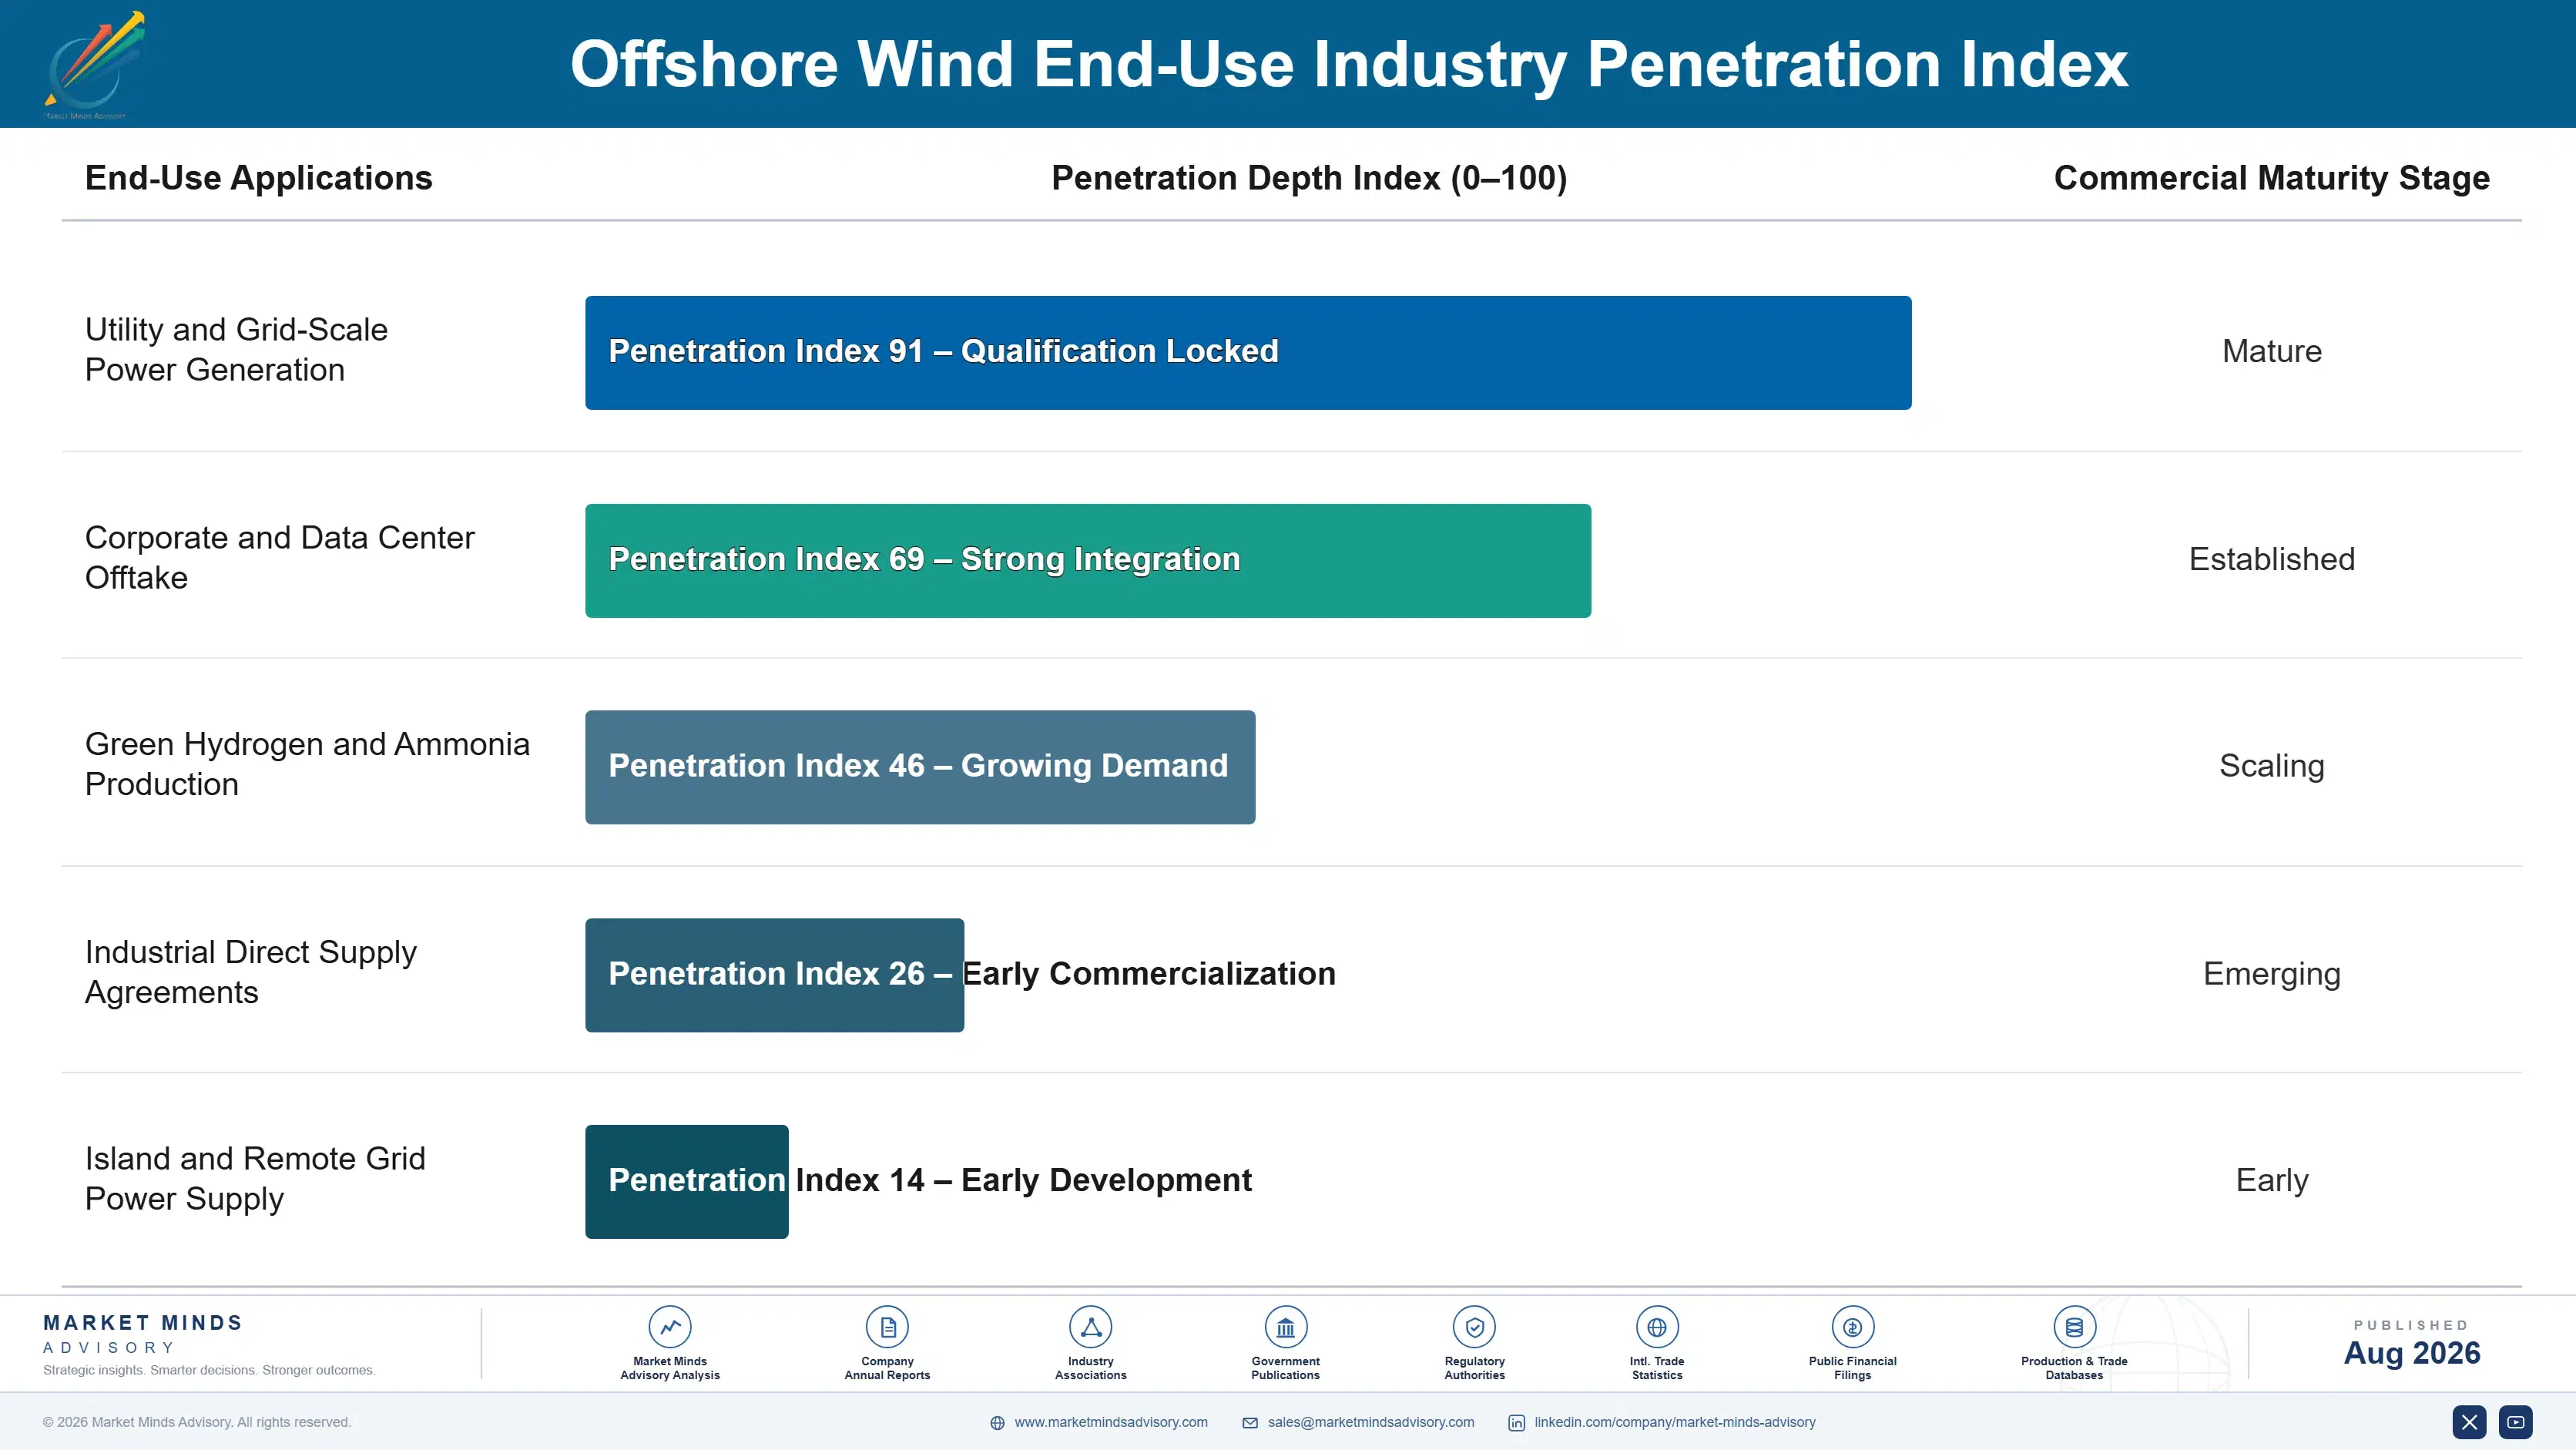
Demand here commits through extraordinarily long instruments rather than repeat orders. A single project locks in a 20 to 30 year power purchase agreement before construction begins, and once a turbine fleet is installed it operates against that contracted revenue for decades with minimal opportunity to renegotiate. That long-instrument structure makes offshore wind behave like fixed-income infrastructure rather than a conventional equipment market.
Adoption depth varies sharply by buyer type. Government-backed utility offtake remains the dominant demand channel, since sovereign counterparties can credibly commit to multi-decade contracts that smaller private buyers generally cannot match. Corporate offtake buyers, increasingly technology companies seeking verifiable renewable supply for data centers, are adopting offshore wind more selectively, often layering it alongside onshore renewable and storage contracts rather than relying on it exclusively. Industrial buyers occupy a smaller but growing position in Asia, where offshore wind increasingly supports green hydrogen ambitions.

Younger project developers and financiers increasingly specialize narrowly, in floating technology or corporate offtake structuring, rather than building the broad, generalist capability earlier-generation developers needed when the industry was smaller. That specialization pushes established developers toward more focused positioning, even though winning large tenders still typically requires broad capability across permitting, construction, and financing.
offshore-wind-market-end-use-penetration-index-1787300705538

Where This Market Rewards Patience

These are among the four positions where our research anticipates prominent divergence between winners and laggards over the coming forecast period. Each is grounded in the demand model, the regulatory perimeter, and the announced capacity pipeline.
01 / FLOATING TECHNOLOGY STRATEGY

Winners will prove floating bankability before scaling further

Floating wind's technology risk has narrowed as Norway, South Korea, and France accumulate real operating data from commercial-scale pilot arrays, but financing terms still price in uncertainty fixed-bottom projects no longer carry. What actually separates winners is the discipline to prove bankability at modest scale before committing capital to gigawatt-class floating tenders, because one high-profile floating failure would set financing terms back industry-wide. Developers building credible operating track records first, rather than chasing headline project scale, will secure better financing terms than rivals over the coming decade.
02 / REGIONAL SUPPLY CHAIN STRATEGY

Domestic manufacturing footprint will decide export market access

Trade policy and domestic content requirements, not raw manufacturing cost alone, increasingly determine which turbine makers can compete for tenders in the United States, South Korea, and parts of Europe following growing political sensitivity around Chinese-origin equipment. Manufacturers who build regional assembly and fabrication capacity early will capture tender access that purely China-based competitors cannot bid for, regardless of how competitive their equipment pricing might otherwise be. Those relying entirely on Chinese-origin supply chains will find themselves locked out of the most attractive protected markets this decade.
03 / SERVICE AND FINANCING REVENUE

Recurring service revenue will matter more than turbine orders

Manufacturers still competing purely on turbine price per megawatt are leaving durable revenue on the table that long-term service contracts, construction risk insurance, and corporate offtake bundling already capture successfully for service-forward competitors. These recurring revenue streams persist between the lumpy, cyclical turbine order cycles that otherwise define this market's uneven revenue pattern tied to tender timing. Companies that build genuine service and financing capability early will earn materially more per installed megawatt over a decade than those still selling only hardware.
04 / INSTALLATION VESSEL ACCESS

Vessel availability will constrain growth more than permitting

Even where permitting and financing align favorably for a given project, construction timing is capped by the availability of specialized heavy-lift installation vessels, a genuinely scarce global resource that neither developers nor regulators fully control today. Developers who invest early in long-term vessel charter agreements or direct vessel ownership will effectively secure construction slots ahead of competitors still exposed to spot-market vessel scarcity. This constraint will matter more to realized project timing over the next decade than any single permitting policy decision alone.

Engagement Snapshot From the Field

A live engagement with an industry participant carrying material or product regulatory and market exposure ahead of a defining policy shift, showing how our research translates into a defensible multi-year portfolio strategy.
MARKET MINDS ADVISORY · CLIENT ENGAGEMENT SUMMARY
Offshore Wind Producer Strategic Portfolio Review and Transition Roadmap 2026·Investment Scenario on Offshore Wind Exposure Evaluation 2025-26
CLIENT PROFILE
A European utility-backed offshore wind developer with projects across three national markets approached MMA while evaluating whether to proceed with a final investment decision on a large fixed-bottom project amid sharply rising steel and vessel costs. The client reported a project pipeline exceeding 4 gigawatts, with the project under review representing roughly 25% of near-term planned capital deployment (client-reported, unverified by MMA).
STRATEGIC CHALLENGE
Leadership faced a binary decision under genuine uncertainty: proceed at revised, higher cost assumptions and accept lower project returns, or delay and risk losing the site lease and permit timeline entirely to a competing developer. Nobody had modeled how sensitive the project's returns actually were to further vessel and steel cost inflation before the board meeting.
MMA APPROACH
MMA modeled project returns under five vessel and steel cost scenarios, benchmarked the client's contracted pricing against comparable recent European project sanctions, and interviewed procurement leads at three comparable developers on real-world vessel charter negotiation outcomes across recent construction cycles, financing rounds, and board-level capital allocation decisions made under similar cost pressure.
KEY FINDINGS
  1. The project remained financeable even under the most pessimistic cost scenario tested, though returns fell meaningfully below the client's original underwriting case from two years earlier.
  2. Locking a vessel charter agreement immediately, rather than waiting six months for potentially better terms, saved an estimated 8% on total vessel cost based on comparable recent agreements (client-reported, unverified by MMA).
  3. Delaying the final investment decision by even one tender cycle risked losing priority access to the two remaining qualified installation vessel operators serving that region.
  4. Delaying the final investment decision by even one tender cycle risked losing priority access to the two remaining qualified installation vessel operators serving that specific region.
CLIENT PROFILE
A European utility-backed offshore wind developer with projects across three national markets approached MMA while evaluating whether to proceed with a final investment decision on a large fixed-bottom project amid sharply rising steel and vessel costs. The client reported a project pipeline exceeding 4 gigawatts, with the project under review representing roughly 25% of near-term planned capital deployment (client-reported, unverified by MMA).
STRATEGIC CHALLENGE
Leadership faced a binary decision under genuine uncertainty: proceed at revised, higher cost assumptions and accept lower project returns, or delay and risk losing the site lease and permit timeline entirely to a competing developer. Nobody had modeled how sensitive the project's returns actually were to further vessel and steel cost inflation before the board meeting.
MMA APPROACH
MMA modeled project returns under five vessel and steel cost scenarios, benchmarked the client's contracted pricing against comparable recent European project sanctions, and interviewed procurement leads at three comparable developers on real-world vessel charter negotiation outcomes across recent construction cycles, financing rounds, and board-level capital allocation decisions made under similar cost pressure.
KEY FINDINGS
  1. The project remained financeable even under the most pessimistic cost scenario tested, though returns fell meaningfully below the client's original underwriting case from two years earlier.
  2. Locking a vessel charter agreement immediately, rather than waiting six months for potentially better terms, saved an estimated 8% on total vessel cost based on comparable recent agreements (client-reported, unverified by MMA).
  3. Delaying the final investment decision by even one tender cycle risked losing priority access to the two remaining qualified installation vessel operators serving that region.
  4. Delaying the final investment decision by even one tender cycle risked losing priority access to the two remaining qualified installation vessel operators serving that specific region.
RECOMMENDED STRATEGY
Phase 1: Phase 1 (0 to 3 months): Lock the vessel charter agreement immediately at current terms rather than waiting for a potentially better market. Phase 2: Phase 2 (3 to 12 months): Finalize the corporate offtake agreement to lock in premium pricing before competing projects reach the market. Phase 3: Phase 3 (12 to 36 months): Proceed to final investment decision and construction, monitoring steel cost trends for any further hedging opportunity.
OUTCOME
The client proceeded to final investment decision on schedule, securing the vessel charter agreement at terms MMA estimated saved approximately 8% versus waiting six months. The project reached financial close with corporate offtake covering a meaningful share of contracted capacity, and the client reported the deal set a new regional benchmark for offtake pricing (client-reported, unverified by MMA).

Frequently Asked Questions

Foundational context covering the market sizes, CAGR, scope, country, region and competition that inform every finding below. This section is provided to cover basics and most often pre-purchase conversations, answered from the MMA Primary Research Dataset.

What is the current size of the Offshore Wind Market?

The market stood at USD 48.5 billion in 2025, based on MMA Primary Research Dataset findings. China's domestic build-out increasingly dominates the global installation total.

How large will the Offshore Wind Market be by 2036?

MMA projects the market will reach USD 135.62 billion by 2036 under the base case scenario, representing roughly 2.55 times the 2026 opening value across the eleven-year forecast period.

What is the CAGR for the Offshore Wind Market 2026 to 2036?

The base case CAGR is 9.8% annually. MMA's bull scenario reaches 11.0% while the bear scenario, reflecting continued permitting and cost pressure, runs closer to 8.5%.

Which segment is growing fastest?

Floating semi-submersible platforms lead at 16.5% CAGR, roughly 1.68 times the overall market rate, as this design proves the most commercially mature of the floating architectures available.

Who are the major companies in the Offshore Wind Market?

Ørsted, Vestas, Siemens Gamesa, GE Vernova, and MingYang lead the market, together controlling an estimated 64% of installed and contracted capacity on a consistent basis.

Which country is growing fastest?

South Korea posts the fastest national growth at 17.5% CAGR, driven by aggressive floating wind targets and government support for domestic manufacturing capacity tied to its Ulsan floating wind program.

Report Segmentation Architecture

The full report scope spans multiple orthogonal segmentation dimensions, with cross-tabulated demand data provided for each dimension pair. Coverage extends further to regional breakdowns, trend trajectories, and the competitive detail needed to support segment-level decision-making.

By Foundation and Platform Type

  • Monopile Foundations
  • Jacket Foundations
  • Gravity-Based Foundations
  • Floating Semi-Submersible Platforms
  • Floating Spar-Buoy Platforms
  • Floating Tension-Leg Platforms

By End-Use Industry

  • Utility and Grid-Scale Power Generation
  • Corporate and Data Center Offtake
  • Green Hydrogen and Ammonia Production
  • Industrial Direct Supply Agreements
  • Island and Remote Grid Power Supply

By Commercial Dimension

  • Government Auction and Tender Procurement
  • Corporate Power Purchase Agreements
  • Merchant and Wholesale Market Sales
  • Joint Venture and Co-Development Structures

By Region

  • North America
  • Western Europe
  • East Asia
  • South Asia and Pacific
  • Latin America
  • Middle East and Africa
  • Eastern Europe

Scope, Methodology, and Coverage

Every figure in this report is reproducible from documented input assumptions. The scope below maps the historical period, the forecast horizon, the segmentation dimensions, and the countries covered, alongside the underlying primary and qualitative methodology.
Historical Period
2020 to 2025
Forecast Period
2026 to 2036
Base Year
2025 (USD billions; MMA Primary Research Dataset, August 2026)
Market Definition
The offshore wind market covers electricity generation and associated infrastructure from wind turbines installed in marine and coastal waters, spanning fixed-bottom foundations, floating platforms, subsea cabling, and offshore substations through to grid connection. It excludes onshore wind generation, offshore oil and gas infrastructure, and marine energy technologies such as tidal and wave power.
Quantitative Units
USD billions (current prices); gigawatts of installed and contracted capacity where applicable
Segmentation Dimensions
By Foundation and Platform Type; By End-Use Industry; By Commercial Dimension; By Region
Regions Covered
North America, Western Europe, East Asia, South Asia and Pacific, Latin America, Middle East and Africa, Eastern Europe
Countries Covered
USA, China, Germany, France, UK, Japan, South Korea, India, Australia, Canada, Brazil, Mexico, Indonesia, Vietnam, Thailand, Malaysia, UAE, Saudi Arabia, South Africa, Nigeria, Turkey, Poland, Netherlands, Italy, Spain, Sweden, Switzerland, Argentina, Colombia, Singapore, and additional markets relevant to this sector
Key Companies Profiled
Ørsted A/S, Vestas Wind Systems A/S, Siemens Gamesa Renewable Energy S.A., GE Vernova Inc., MingYang Smart Energy Group Co., Ltd., RWE Renewables GmbH, Iberdrola S.A., Equinor ASA, EnBW Energie Baden-Württemberg AG, TotalEnergies SE, CSSC Haizhuang Wind Power Co., Ltd., Envision Energy Co., Ltd., Xinjiang Goldwind Science & Technology Co., Ltd., Nexans S.A., Prysmian Group, Subsea 7 S.A., Van Oord, Jan De Nul Group, Boskalis, Shell plc
Quantitative Methodology
Primary survey, n=3,800 respondents, Q4 2025, six countries; demand-side model with trade association cross-validation
Qualitative Methodology
47 expert interviews, Q4 2025; applied to validate demand model assumptions, identify emerging dynamics, and assess competitive positioning
Report Format
PDF and XLSX data workbook (Word format preview document)
Publisher
Market Minds Advisory
Report Code
MMA-2026-ENE-215
Published
August 2026
Contact
sales@marketmindsadvisory.com | www.marketmindsadvisory.com

Purchase the full Offshore Wind Market Report (2026 to 2036).

The full MMA Offshore Wind report sizes the market across six foundation and platform categories, five end-use verticals, four commercial channels, and seven regions through 2036. It profiles 20 participants on a consistent installed and contracted capacity basis, scoring the top five on project pipeline depth, manufacturing footprint, and floating technology readiness. Scenario models quantify how permitting policy shifts, floating technology bankability, and vessel supply constraints move both demand and realizable project economics. The report also includes delivered-cost modelling by foundation type, a regional permitting and policy tracker, and a competitive benchmarking tool built for developer strategy, manufacturer planning, and investor due diligence teams.
Six-category foundation segmentation with regional cross-tabulation
Permitting and policy tracker across twelve major markets
Competitive benchmarking on consistent capacity basis
Delivered-cost modelling by foundation type and region
Scenario models for floating bankability and vessel supply
Installation vessel capacity constraint analysis by region

Built For The People Who Decide

From boardroom strategy to bench-side execution, this report is read cover-to-cover by leaders shaping the next decade of their industry, turning demand scenarios, market dynamics and valuation benchmarks into decisions.
CXOs/ Presidents/ VPs/ Managers
M&A and Corporate Development
Strategy Teams and R&D Heads
Procurement and Product Directors
Regulatory and Compliance Leaders
Investor Relations and Equity Analysts