Market Minds Advisory
Offshore Mining Services Market

Offshore Mining Services Market: The Biggest Seabed Mine Is A Sand Pit

Sand and gravel account for roughly three quarters of everything commercially mined from the seabed, and almost nobody discussing seabed minerals is talking about any of it. The gap between debate and dredging is remarkable.

Lead Analyst

David Horsley

Published

September 2026

Make Smarter Decisions with Customized Research Insights

Request a free sample report and evaluate market opportunities, growth trends, and competitive dynamics relevant to your business needs.

2025 MARKET VALUE$6.8BMarket Size 2025
2036 FORECAST VALUE$14.2BBase Case , 2026 to 2036
CAGR 2026 TO 20366.9 %Bull 8.1% / Bear 5.7%
INCREMENTAL OPPORTUNITY$6.9BNet 10- year value creation
EXPANSION MULTIPLE1.95x2036 value over 2026 base
Strategic Levers
M&A Pipeline
Regional Outlook
Country Rankings
Competitive Intelligence
Segmental Deep-dive
Call-Us : 91 93563 13602

Executive Snapshot and Market Trajectory

Commercial seabed mining is overwhelmingly sand. Marine aggregate and reclamation fill account for around 76% of material extracted offshore, while the polymetallic minerals dominating every public discussion produce essentially nothing. The gap between what gets debated and what actually gets dredged is remarkable.
Growth runs at 6.9% and reclamation leads it. Land reclamation fill supply grows at 10.35%, exactly 1.50 times the market rate, pulled by Gulf and Asian coastal development that consumes fill in volumes no quarry can supply. South Asia and Pacific holds 27%, far outside band, because Singaporean, Indonesian, and Australian activity concentrates there. Fleet availability rather than demand is the practical constraint there. Sand is the business and almost nobody frames it that way.
Concentration is moderate at 44% across the top five measured on offshore extraction and services revenue, and vessel fleets combined with licence tenure hold it. Consenting a new extraction area runs about six years and tenure runs fifteen, which makes the permission rather than the deposit the asset worth owning. Offshore diamond recovery produces around 9% of revenue from a trivial volume, the only part where the mineral decides economics.
Market Definition
This market covers services delivered for commercial extraction of minerals and aggregates from the seabed, spanning marine aggregate dredging, land reclamation fill supply, offshore diamond and precious mineral recovery, resource survey and definition services, and environmental monitoring and consenting support. Deep sea polymetallic nodule and sulphide extraction equipment, onshore quarrying and processing, port and harbour maintenance dredging, offshore oil and gas services, and marine construction beyond fill placement fall outside scope.
Base Year Value
$6.8B in 2025 (MMA Primary Research Dataset, August 2026)
Forecast Period
2026 to 2036, eleven discrete annual values
CAGR
6.9% base case. Bull 8.1%. Bear 5.7%.
Fastest Growth Segment
Land Reclamation Fill Supply: 10.3% CAGR
Fastest Growth Country
Saudi Arabia: 11.6% CAGR
Fastest Growth Region
South Asia and Pacific: 9.0% CAGR
Largest Region
South Asia and Pacific: 27% of 2025 global value
Market Leaders
Boskalis, Van Oord, DEME, Jan De Nul, De Beers Marine. Source: MMA Analysis based on company annual reports.
Primary Survey
n=3,800 procurement and R&D decision-makers, Q4 2025, six countries
Methodology
Demand-side build-up, cross-validated against public data, 47 expert interviews

Offshore Mining Services Market Forecast Scenarios

offshore-mining-services-market-size-forecast-scenario-1787302737980
The 2020 to 2025 period ran at 5.7% and reclamation projects rather than aggregate demand set the pattern. Several large coastal developments paused in 2020 and resumed from 2022, while marine aggregate extraction for construction tracked building activity with far less volatility. Offshore diamond recovery grew steadily throughout, insulated from construction cycles by an entirely different demand base and a very different value density.
Three mechanisms carry the 6.9% base case. Coastal land reclamation is the largest, since Gulf and Asian development consumes fill volumes that no terrestrial source can supply at reasonable haul distance. Coastal protection and nourishment is the second, as sea level and storm response programmes expand across exposed shorelines. And terrestrial aggregate depletion is the third, pushing construction demand offshore. Survey and consenting support demand follows all three without leading any of them.
The 8.1% bull case rests on coastal protection programmes accelerating beyond current funding, which would create sustained nourishment demand independent of any construction cycle at all. The 5.7% bear case is licensing tightening across major regimes in response to coastal community objection, since consenting already runs about six years and further restriction would constrain supply well before demand fell.

Sand Is The Business

The commercially significant seabed mining industry is a sand business, and almost nobody frames it that way. Marine aggregate and reclamation fill account for roughly 76% of material extracted offshore, dredged by trailing suction hopper vessels and delivered to construction markets and coastal projects. The polymetallic minerals occupying every public discussion produce essentially nothing by comparison and have done for decades.
TOP FIVE CONCENTRATION44%Moderate, held through vessel fleets and licence tenure together
AGGREGATE SHARE OF VOLUME76%Of offshore mined material moved, mostly sand and gravel
LICENCE TENURE PERIOD15 yearsTypical marine extraction consent duration in established regulatory regimes
CONSENTING LEAD TIME6 yearsFrom application through to first extraction under a new licence
TRAILING DREDGER DAY RATE180,000For a large hopper vessel working on a reclamation contract
DIAMOND RECOVERY VALUE SHARE9%Of offshore mining revenue from a tiny extracted material volume
The asset here is permission rather than resource. Sand deposits offshore are abundant and consenting an extraction area runs about six years against tenure of roughly fifteen, with coastal communities, fisheries, and heritage interests objecting to nearly every application. A dredger without a licensed area is an expensive vessel with nowhere to work, which is why operators guard tenure more carefully than fleet.
Value density explains the outlier. Offshore diamond recovery off Namibia produces around 9% of industry revenue from a volume of material that would barely register against aggregate tonnages. That contrast is worth holding onto, because it is the only part of this market where the mineral rather than the logistics decides the economics. Every other part of it is haulage with an extraction licence attached.
"Everybody wants to talk about nodules. Meanwhile the largest offshore mining operations on earth are moving sand for a runway extension, and they have been doing it profitably since before anybody drew a picture of a collector vehicle."
Director, Marine Resources and Dredging Services Practice · MMA Marine Services

Market Trends

Reclamation Demand Outstrips Any Terrestrial Fill Source

Gulf and Asian coastal developments consume fill in volumes that no quarry can supply at a haul distance anybody would accept, which pushes the requirement offshore by default rather than by preference. Reclamation fill supply grows at 10.35% against 6.9% for the market. Projects are large, discrete, and vessel-intensive, and a single reclamation contract can absorb a substantial share of the available large hopper fleet for a year. Sequencing across operators therefore matters considerably more than pricing does on these awards. Bidding everything leaves a fleet idle or overcommitted. Both cost more than declining.
Market Impact: Aggregate is 76% of volume moved
Licence Tenure Has Become The Scarce Asset

Consenting a new marine extraction area runs about six years against a typical tenure of fifteen, and coastal community, fishery, and heritage objections attach to nearly every application submitted anywhere. Operators therefore guard licensed areas more carefully than they guard vessels, since a dredger without an area is simply an expensive asset with nowhere to work. Licence portfolios now change hands more often than fleets do. Early community engagement shortens the objection phase materially and occasionally prevents one forming. Operators treating consultation as a formality extend their own timelines. Few treat it as the critical path.
Market Impact: Licence tenure runs 15 years

Market Opportunities and Growth Drivers

Terrestrial Aggregate Depletion Pushes Demand Offshore

Land based sand and gravel reserves near major coastal population centres are increasingly worked out or built over, and haul distance from remaining inland sources rises until marine supply becomes the cheaper option. That transition has already happened around several North Sea and Japanese urban regions. Offshore aggregate carries around 76% of extracted volume partly because terrestrial alternatives ran out rather than because anybody preferred dredging. Haul distance from remaining inland sources eventually exceeds the cost of dredging and shipping. That crossover has already happened around several coastal regions. It will happen around more.
Market Impact: Consenting takes about 6 years

Coastal Protection Programmes Create Non-Cyclical Demand

Beach nourishment and shoreline defence consume dredged sand on schedules set by erosion rates and storm damage rather than by construction cycles, which gives this demand a stability that reclamation projects never have. Programmes are publicly funded and recur, since nourished beaches erode again. That combination makes coastal protection the steadiest work available in a market otherwise driven by large discrete projects. Incumbent contractors hold considerable advantage at each renewal, since mobilisation and local knowledge both count. Programmes recur because nourished beaches erode again. That is the steadiest work available.
Market Impact: Day rates reach 180,000 daily

Market Restraints and Challenges

Consenting Timelines Prevent Any Supply Response

A new extraction area takes about six years from application to first dredging, and the root cause is that coastal communities, fisheries, and heritage bodies object to nearly every application and each objection requires evidence to answer. Commercial impact is that supply cannot respond to a demand surge anywhere within a project timescale. Mitigation runs through maintaining licence portfolios well ahead of need, acquiring consented areas rather than applying, and early community engagement that shortens the objection phase. Licence portfolios now change hands more often than dredging fleets do. That tells you which asset is genuinely scarce.
Market Impact: Reclamation fill grows at 10.35%

Fleet Availability Constrains Large Reclamation Delivery

Large trailing suction hopper dredgers cost hundreds of millions and very few exist, and the root cause is that building one is a shipyard programme measured in years against demand that arrives as discrete projects. Commercial impact is that a single large reclamation contract absorbs a substantial share of available capacity and day rates near 180,000 dollars follow. Mitigation runs through fleet sharing arrangements, contract sequencing across operators, and accepting that some projects simply wait. Building a large hopper dredger is a shipyard programme measured in years, not months. Nobody builds one against a single project.
Market Impact: Consenting runs about 6 years
4 additional market trends, 3 additional growth drivers, and 2 additional restraints and challenges are covered in the full report. Contact sales@marketmindsadvisory.com to access the complete intelligence.

Segment CAGR and Growth Architecture

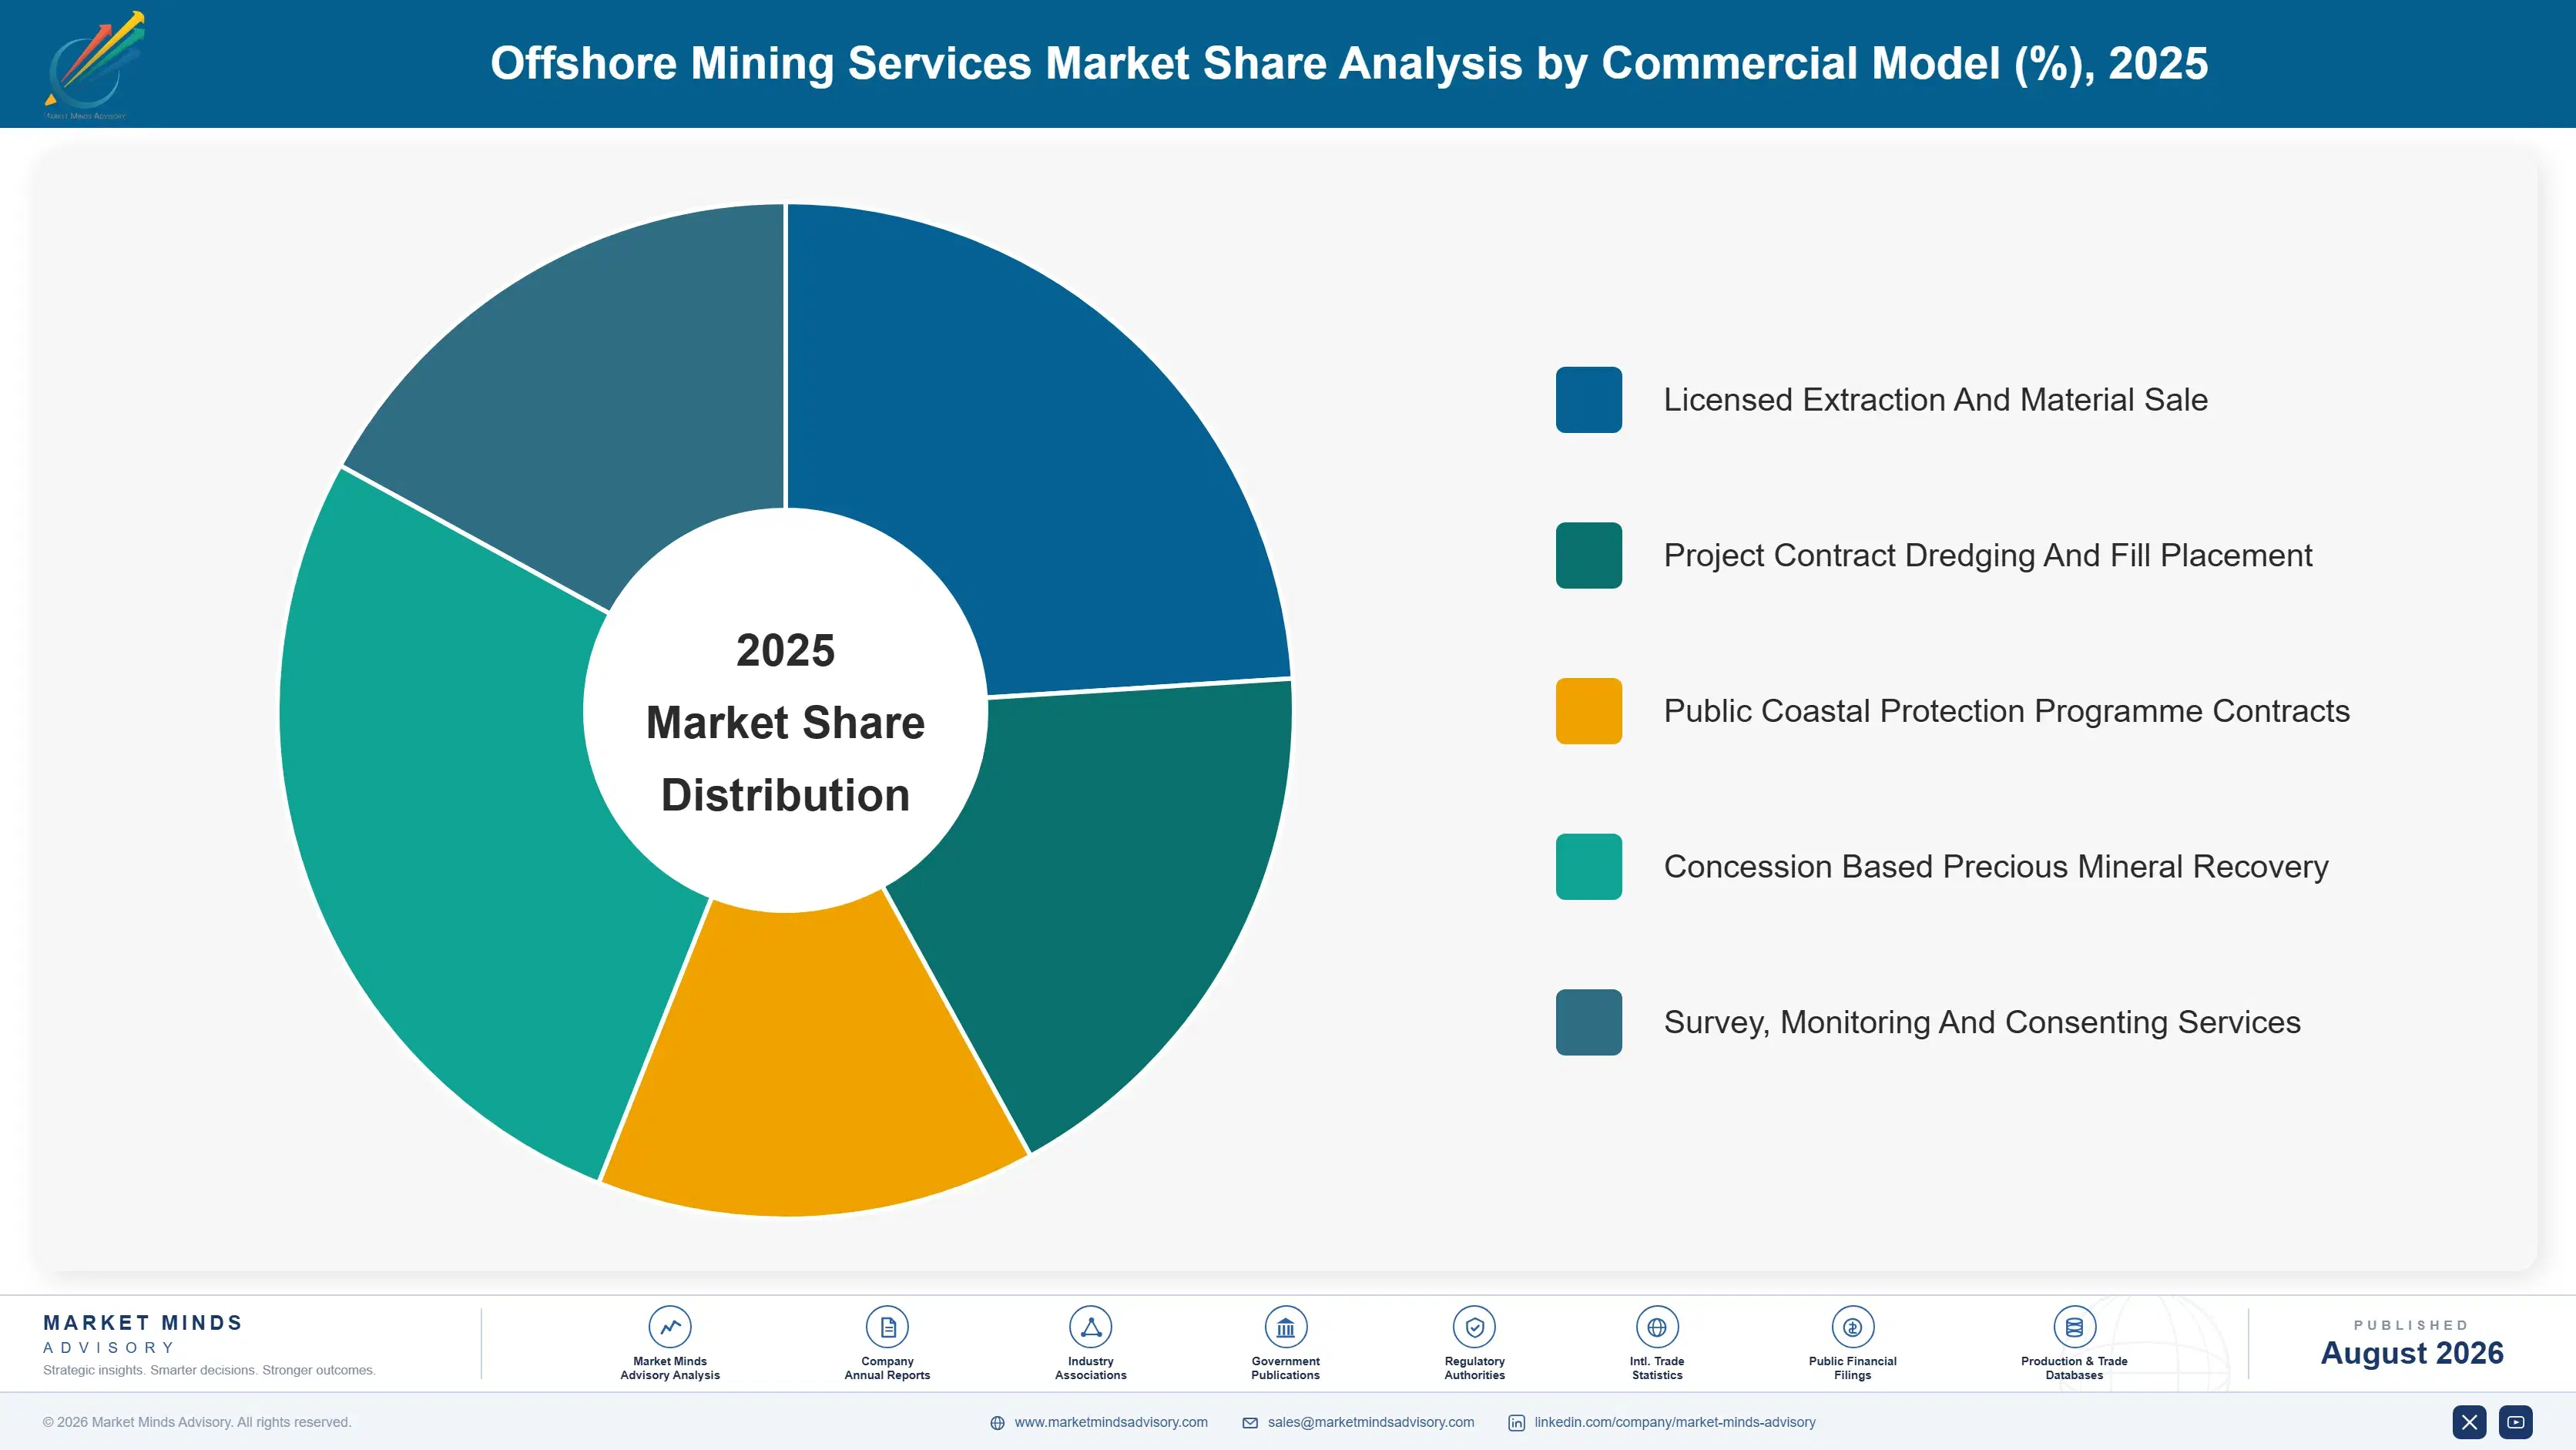
Segmentation follows the service delivered and the material recovered, because those determine vessel type, licence requirement, customer, and whether revenue follows tonnage or value. Water depth and seabed geology both cut across every service rather than separating them cleanly, which makes either weaker as a primary dimension here. Service type also decides who the customer is.
offshore-mining-services-market-market-share-analysis-1787302738523

Land Reclamation Fill Supply

The fastest service at 10.35%, exactly 1.50 times the market rate, supplying dredged sand as engineered fill for coastal land creation across Gulf, Singaporean, and Chinese developments. Volumes per project are enormous and no terrestrial source can supply them at an acceptable haul distance, which pushes the requirement offshore by default. Contracts are discrete and vessel-intensive enough that a single award can absorb much of the available large hopper fleet, and sequencing across operators matters more than pricing does. Source country export restrictions have made fill sourcing a political question rather than a commercial one. Several Southeast Asian governments have tightened them. Projects now plan around that. Sourcing is now planned politically.
CAGR 10.3%

Offshore Diamond And Precious Mineral Recovery

Second fastest at 8.4% and by far the highest value density, recovering diamonds from Namibian marine gravels alongside smaller tin and placer operations elsewhere. Around 9% of industry revenue comes from a material volume that would barely register against aggregate tonnages, which is the clearest illustration available of what value density does to an extraction business. Purpose-built recovery vessels and processing plant are specific to the deposit, and the operating concessions involved are effectively unavailable to anybody else. Concessions of this kind are effectively closed to any newcomer, whatever vessel capability it might assemble. Access rather than capability decides participation. Nothing about that looks likely to change. Nothing suggests otherwise.
CAGR 8.4%
Full segment breakdown across 5 segments available in the complete report.

Regional Architecture and Country Demand Map

South Asia and Pacific leads at 27%, far outside band, because Singaporean, Indonesian, and Australian activity concentrates there. Western Europe follows on North Sea aggregate. Saudi Arabia grows fastest. Four regional shares sit outside their framework bands. Coastline and licensing geography explain all four. Resource abundance explains none of it.

South Asia and Pacific

Twenty-seven percent, far outside the framework band, and justified because Singaporean land reclamation has consumed more dredged fill per unit of coastline than anywhere on earth while Indonesian and Malaysian waters supplied much of it. Export restrictions across several source countries have made sourcing a political question rather than a commercial one. Australian aggregate and coastal protection work adds a separate and steadier base. Growth at 9.0% leads every region, carried by reclamation demand more than anything else. Regional fleet availability rather than demand is now the practical constraint on how quickly reclamation proceeds. Projects wait for vessels rather than for funding. Export restrictions have made sourcing a political question rather than a commercial one.
Share: 27% | CAGR: 9.0% (2026 to 2036)

Western Europe

Twenty-two percent, and North Sea marine aggregate extraction is the most established regime anywhere, with licensed areas, tenure conventions, and environmental evidence requirements that other jurisdictions have copied. Terrestrial reserves near coastal urban regions were worked out decades ago, which made marine supply the default rather than an alternative. Dutch and Belgian dredging contractors also operate globally from this base. Growth at 5.4% is the slowest of any region, reflecting mature demand. Consenting conventions established here have been copied into other jurisdictions, which gives regional operators an advantage abroad that is rarely recognised. Licence portfolios here are unusually mature. Tenure changes hands rather than being created. New areas are rare.
Share: 22% | CAGR: 5.4% (2026 to 2036)
Regional intelligence for 5 additional markets available in the complete report: Middle East and Africa, East Asia, North America, Latin America, Eastern Europe. Contact sales@marketmindsadvisory.com.
offshore-mining-services-market-country-cagr-analysis-1787302739040

Licences, Fleet And Value Density

Aggregate carries 76% of volume, consenting runs six years against fifteen year tenure, day rates reach 180,000 dollars, and reclamation grows at 10.35%. Value comes from licence portfolios, from fleet positioning against discrete projects, and from work where value density beats logistics. Vessel efficiency decides remarkably little of it. Permission and position decide it.

Build Licence Portfolios Well Ahead Of Demand

Consenting a new extraction area runs about six years against typical tenure of fifteen, and objections from coastal communities, fisheries, and heritage bodies attach to nearly every application anywhere. An operator without consented areas cannot respond to a demand surge inside any project timescale. Licence portfolios have become the scarce asset in this business and they now change hands considerably more often than vessels do. Tenure runs about 15 years and serves many projects rather than the one that prompted the application. Treating consenting as portfolio investment changes how early anybody starts.
Market Impact: Consenting runs about 6 years for each area

Sequence Fleet Against Discrete Project Awards

Large trailing suction hopper dredgers cost hundreds of millions, very few exist, and a single reclamation contract can absorb much of the available capacity for a year at day rates near 180,000 dollars. Utilisation therefore depends on sequencing across projects rather than on winning every tender. Operators bidding everything simultaneously end up either idle or overcommitted, and both outcomes cost considerably more than declining work would. Very few large hopper dredgers exist and building one is a shipyard programme measured in years. Capacity therefore lags demand persistently. Sequencing is the only available response.
Market Impact: Day rates now reach 180,000 dollars every day

Pursue Value Density Rather Than Tonnage Moved

Offshore diamond recovery generates around 9% of industry revenue from a material volume that barely registers against aggregate tonnages, which is what happens when the mineral rather than the logistics decides the economics. Aggregate dredging is a haulage business with a licence attached. Operators able to reach precious mineral and placer work escape a cost structure where fuel and vessel time consume most of the value created. Purpose-built recovery vessels and the concessions behind them are effectively closed to newcomers. Access rather than capability decides who participates. That barrier is unusually durable.
Market Impact: Diamonds make up 9% of all industry revenue

Engage Coastal Communities Before Applying Formally

Objections from fisheries, coastal residents, and heritage interests attach to nearly every marine extraction application and each one requires evidence to answer, which is most of what makes consenting take six years. Engagement before submission shortens that phase materially and occasionally prevents an objection forming at all. Operators treating consultation as a regulatory formality rather than as the critical path are extending their own timelines unnecessarily. Objections attach to nearly every application and each one requires evidence to answer properly. That evidence gathering is most of the 6 year timeline. Engagement beforehand shortens it materially.
Market Impact: Tenure typically runs a full 15 years each

Who Controls the Margin Pool

Concentration is moderate at 44% across the top five measured on offshore extraction and services revenue, and vessel fleets combined with licence tenure explain it together. Large trailing suction hopper dredgers cost hundreds of millions and very few exist, while consented extraction areas take about six years to obtain, so a credible competitor needs both. The leader to challenger gap is widest in large reclamation work and narrowest in survey and monitoring services.
Competitive activity runs on three fronts. Licence portfolio depth is the first and increasingly the scarcer of the two core assets. Fleet sequencing is the second, since utilisation across discrete project awards decides returns more than pricing does. And precious mineral concession access is the third, where value density escapes the haulage economics governing everything else.

Pressure arrives from two directions. Chinese contractors have built large dredging fleets and compete aggressively on reclamation work worldwide. And coastal community objection is tightening consenting across several established regimes. Rankings shift on licence acquisition rather than on any commercial activity. Neither pressure reaches precious mineral recovery, where concessions and purpose-built vessels are effectively closed to anybody arriving now. That segment behaves as a separate industry.
offshore-mining-services-market-company-positioning-matrix-1787302739562

Competitive Moat and Risk Dimensions

BOSKALIS

Moat: Fleet scale and licence portfolio

A large trailing suction hopper fleet combined with consented extraction areas across several jurisdictions gives the two assets this business genuinely requires, and neither can be assembled quickly by any competitor. Vessels take years to build and licences take about six years to obtain. Global project experience across reclamation and coastal protection reinforces both positions further.
BOSKALIS

Risk: Chinese fleet competition on reclamation

Chinese contractors have built substantial dredging capacity and compete aggressively on international reclamation work at cost positions European operators do not attempt to match. Reclamation is also the fastest growing segment at 10.35%. Licence portfolios confer little advantage on a reclamation contract where the client supplies or sources the material separately.
VAN OORD

Moat: Coastal protection and nourishment depth

Established positions in publicly funded beach nourishment and shoreline defence give recurring work on schedules set by erosion rather than by construction cycles, which is the steadiest demand available in this market. Those programmes recur because nourished beaches erode again, and incumbent contractors hold considerable advantage at each renewal. Offshore wind capability adds a further use for the same vessels.
VAN OORD

Risk: Public funding dependence for nourishment

Coastal protection work is funded by governments and municipalities whose budgets move with political priorities rather than with erosion rates, and programmes get deferred whenever fiscal pressure arrives. That steadiness is real until it is not. Reclamation and aggregate work carry different cyclicality, and depth in one does not hedge the other.

Players Tracked

Prominent Players

Boskalis
Van Oord
DEME
Jan De Nul
De Beers Marine

Other Key Players

Hanson Aggregates Marine
CEMEX Marine
Tarmac Marine Dredging
Great Lakes Dredge and Dock
China Communications Construction
Penta-Ocean Construction
Toa Corporation
National Marine Dredging Company
Rohde Nielsen
Fugro
Gardline
Debmarine Namibia
PT Timah
Dredging Corporation of India
Weeks Marine

Recent Developments

JANUARY 2025

Operator acquires consented extraction areas rather than applying

A marine aggregate operator purchased licensed extraction areas from another company rather than pursuing new applications, buying consented tenure that would otherwise have taken years to obtain through the normal process. The transaction was an asset acquisition rather than any merger, partnership, or joint venture arrangement.
Signal: Licence portfolios now change hands considerably more often than any of the dredging fleets ever do
APRIL 2025

Reclamation award absorbs regional large hopper capacity

A single Gulf coastal development contract committed a substantial share of the large trailing suction hopper dredgers available in the region for over a year, leaving competing projects to wait or seek vessels from further afield. The award was a competitive tender outcome rather than any exclusive arrangement.
Signal: A single reclamation contract can absorb most of an entire region's available large hopper dredger fleet
AUGUST 2025

Source country restricts marine sand export on environmental grounds

A Southeast Asian government tightened restrictions on marine sand export, citing coastal erosion and marine habitat concerns, which affected fill supply arrangements for reclamation projects in neighbouring countries. The restriction was a national policy decision rather than any commercial dispute or contractual failure. Neighbouring projects sought alternatives.
Signal: Fill sourcing has now become a political question rather than a merely commercial or logistical one

Fuel, Vessels and Consenting

Operating cost divides between marine fuel at roughly 32%, vessel capital charge and depreciation near 24%, crew and operations around 17%, licence acquisition, consenting, and environmental monitoring about 15%, and maintenance, insurance, and overhead the balance. Fuel dominates because dredging is fundamentally a pumping and haulage operation, and the distance between an extraction area and a delivery point sets much of the economics.
Marine fuel prices moved sharply through 2022 and emissions regulation added compliance cost across the same period, and several dredging contractors disclosed fuel cost pressure and bunker surcharge arrangements in filings covering those years, with IEA data tracking the underlying movement. Vessel newbuild costs rose separately. Neither could be recovered quickly on contracts priced at tender before a multi-year project began. Projects are priced at tender and executed across years.

The competitive disadvantage mechanism runs through haul distance rather than through vessel efficiency. Fuel burn per cubic metre is broadly comparable across modern hopper dredgers, while the distance between a consented extraction area and the delivery point differs enormously and no operational improvement shortens it. An operator whose licensed areas sit close to demand holds an advantage that a more efficient vessel further away cannot overcome.
offshore-mining-services-market-cost-volatility-analysis-1787302739757

Acquire consented areas close to expected delivery points

Fuel carries roughly 32% of operating cost and haul distance between extraction area and delivery point drives most of it, which no vessel efficiency improvement can offset. Licence acquisition should therefore weigh proximity to expected demand as heavily as resource quality or area size. Operators who bought areas on tonnage available rather than on distance have discovered that

Write bunker adjustment into multi-year project contracts

Marine fuel carries roughly 32% of operating cost and moves on cycles no contractor influences, while reclamation contracts are priced at tender and executed across years. Bunker adjustment clauses referenced to published indices shift that exposure to clients better able to absorb it inside a project contingency. Clients resist adjustment clauses and concede them more readily on long duration work.

Treat consenting spend as portfolio investment not project cost

Licence acquisition, consenting, and environmental monitoring carry about 15% of operating cost and are frequently charged against whichever project prompted the application. That framing understates the asset created, since tenure runs fifteen years and serves many projects. Treating consenting as portfolio investment changes how much an operator is willing to spend and how early it starts.

Portfolio Architecture for Margin Defence

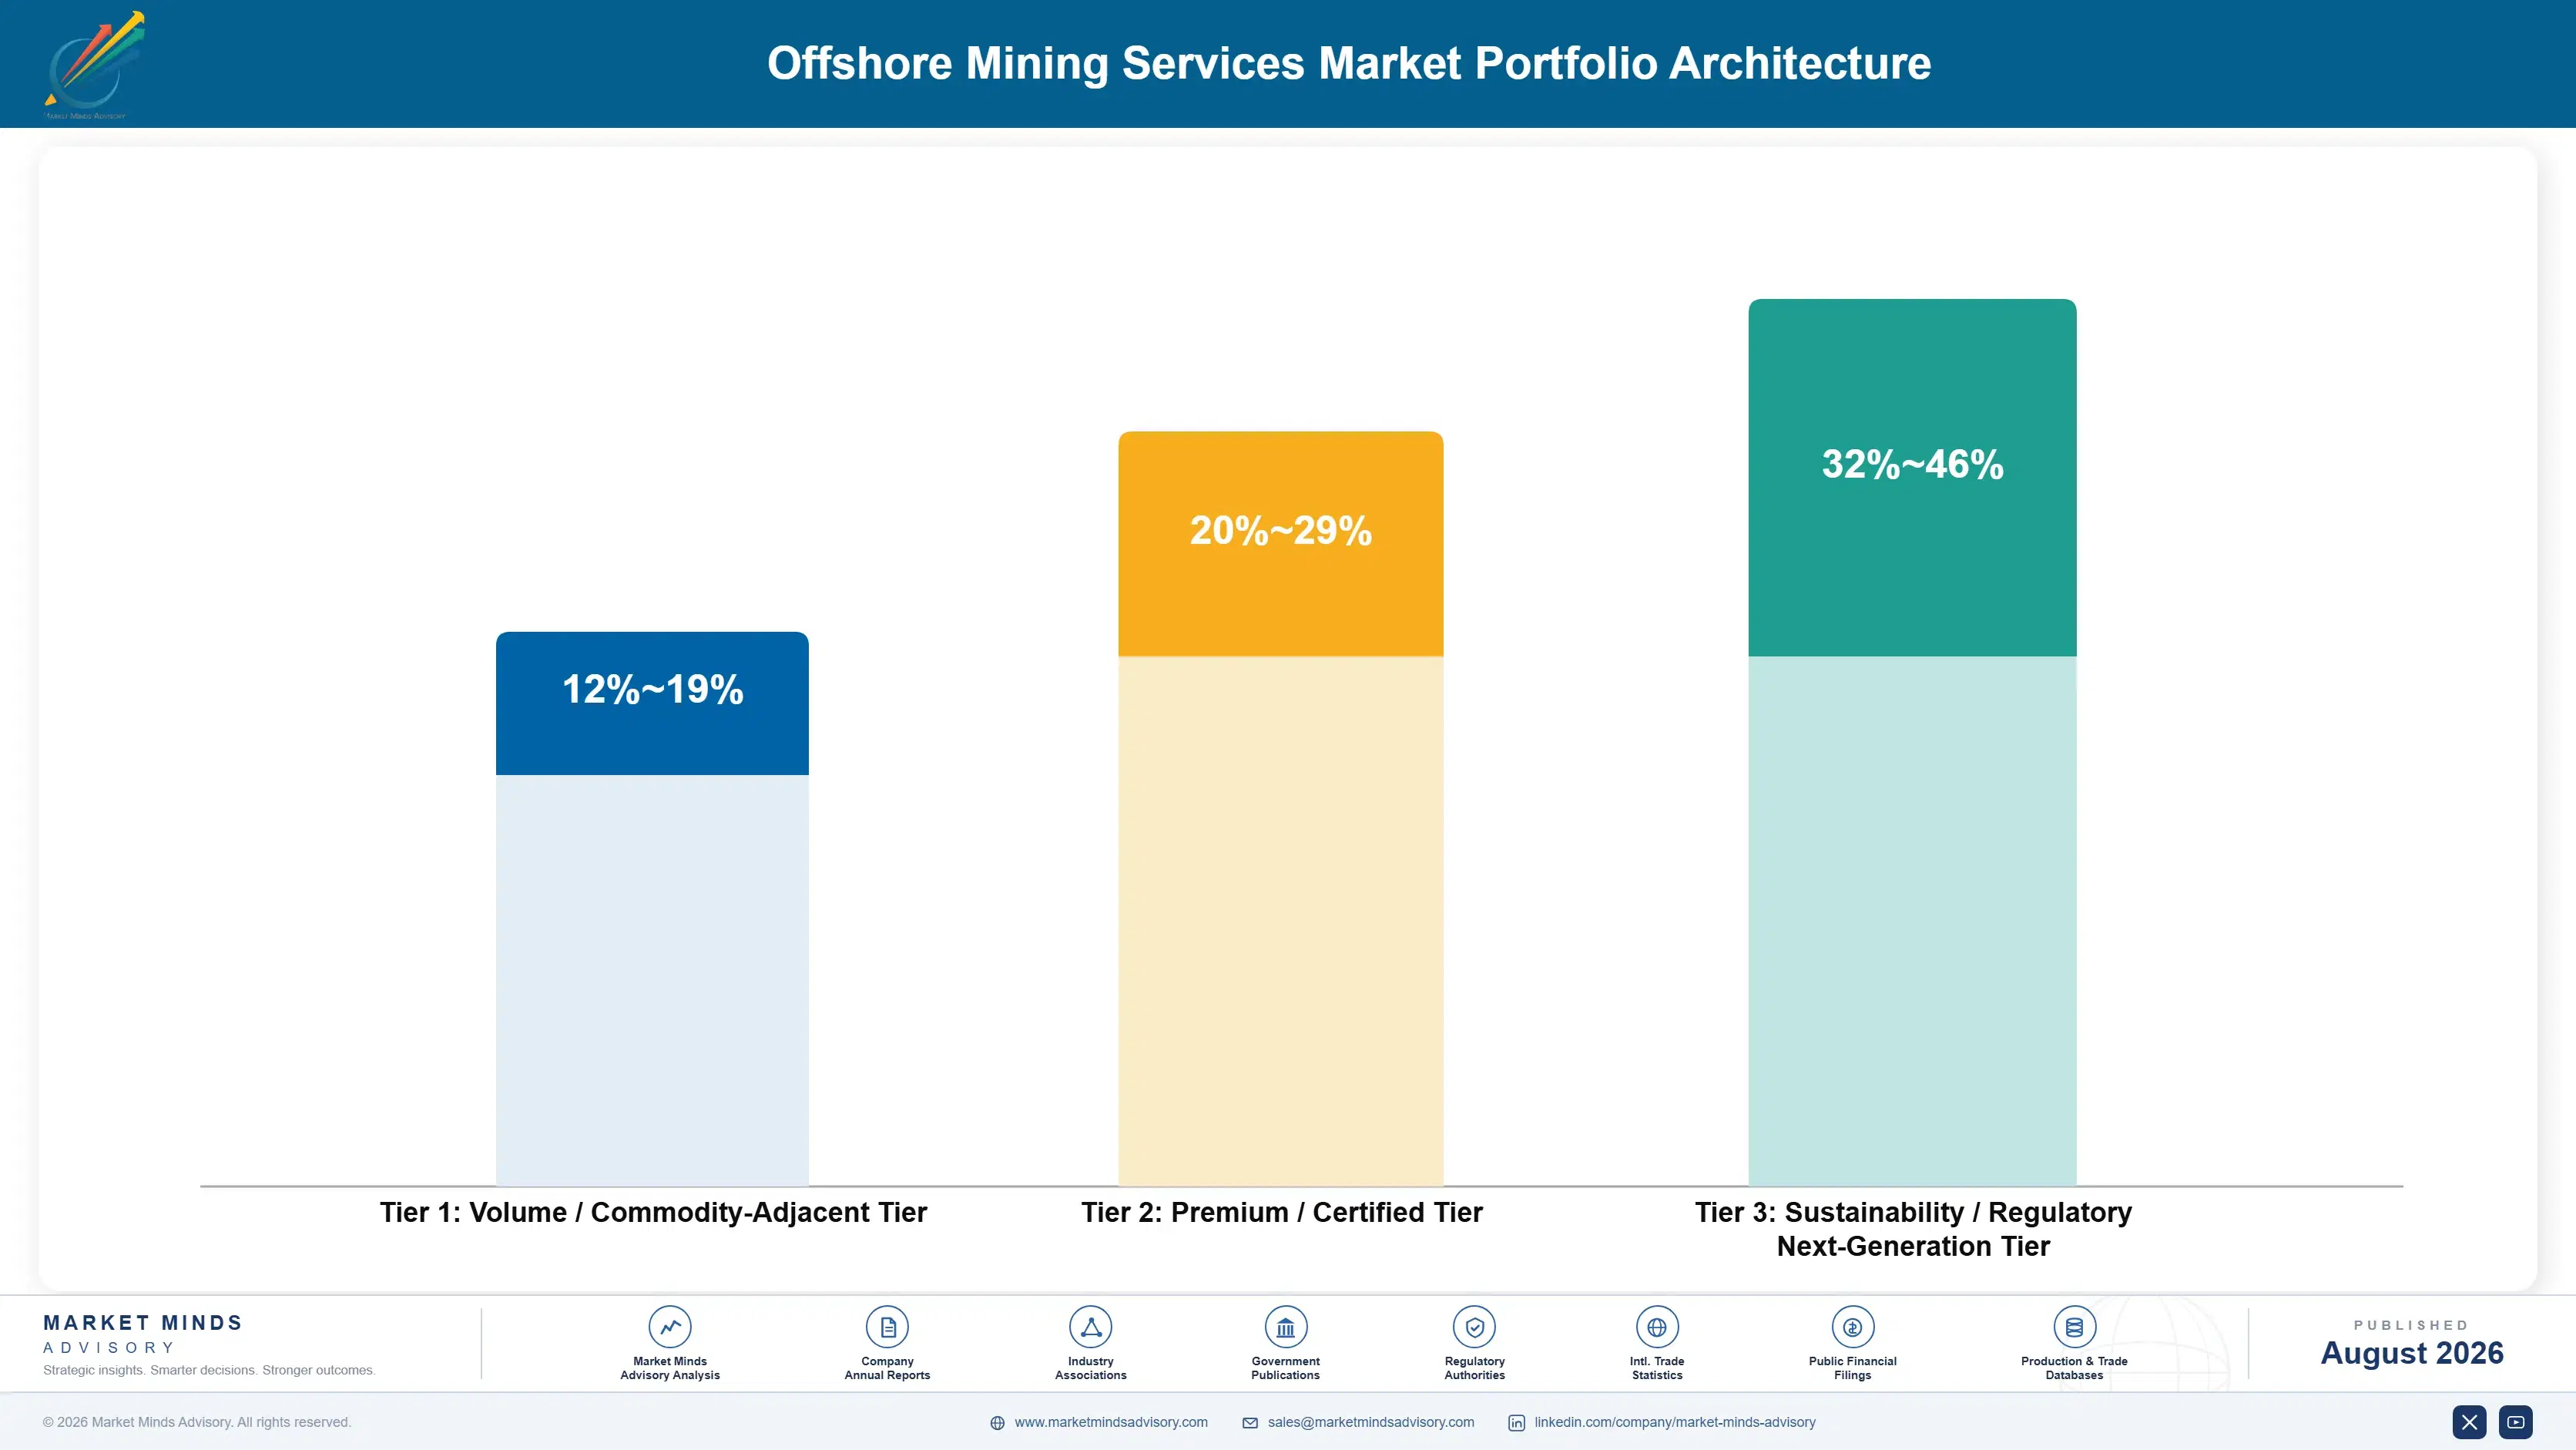
Three tiers describe this business and the spread follows value density and contract structure rather than vessel size. Bulk aggregate dredging sits at the bottom, where the work is haulage with a licence attached and delivered cost per cubic metre decides everything. Reclamation and coastal protection occupy the middle. Precious mineral recovery and specialist survey work sit at the top, where the material or the expertise rather than
The tension is that bulk aggregate carries most of the volume and the thinnest returns, while it also provides the baseload utilisation that keeps a fleet economic between large discrete project awards. An operator weighted toward reclamation has better contract values and idle vessels between awards. One weighted toward aggregate has steady utilisation and returns that fuel prices erode continuously.

High-value pools concentrate where the mineral decides the economics. Offshore diamond recovery is the clearest case, since around 9% of industry revenue comes from a material volume that would barely register against aggregate tonnages, and the concessions involved are effectively closed to anybody else. Specialist survey and consenting support is the second such pool, where expertise rather than any vessel creates the value. Neither pool is decided on cubic metres.

Volume / Commodity-Adjacent Tier

Bulk marine aggregate dredging for construction where delivered cost per cubic metre decides everything. Haulage with a licence attached, providing baseload utilisation between larger discrete project awards. Fuel erodes returns continuously here.
Gross Margin: 12-19%

Premium / Certified Tier

Land reclamation fill supply and coastal protection nourishment where project scale and vessel availability decide awards. Contract values are large and utilisation between awards is the real problem. Idle vessels between awards are the recurring problem.
Gross Margin: 20-29%

Sustainability / Regulatory / Next-Generation Tier

Offshore diamond and precious mineral recovery alongside specialist survey and consenting support. Value density or expertise rather than tonnage decides economics, and access is effectively closed. Concessions are effectively closed to newcomers.
Gross Margin: 32-46%
offshore-mining-services-market-portfolio-architecture-1787302740289

High-value Sub-segments and Strategic Watch-out

Land Reclamation Fill Supply

Fastest growth at 10.35%, exactly 1.50 times the market rate, since no terrestrial source supplies these volumes at acceptable haul distance. A single award can absorb much of a region's large hopper fleet for a year. Sourcing has become political rather than logistical. Projects plan around it.
Gross Margin: 20-29%

Offshore Precious Mineral Recovery

Highest value density anywhere, generating around 9% of industry revenue from material volumes that barely register against aggregate tonnages. Concessions and purpose-built vessels are effectively closed to any newcomer. Access rather than capability decides participation entirely. Purpose-built vessels are specific to the deposit itself. Newcomers cannot enter.
Gross Margin: 32-46%

Bulk Marine Aggregate Dredging

The volume core at roughly 76% of material moved, competing on delivered cost per cubic metre against terrestrial alternatives. Provides the baseload utilisation that keeps a fleet economic between larger awards. Terrestrial depletion pushed this demand offshore. Fuel erodes the returns continuously. Licence and distance decide it.
Gross Margin: 12-19%

Licence Consenting Exposure

The strategic watch-out, since consenting runs about six years and coastal community objection is tightening across established regimes. An operator without consented areas cannot respond to demand at all. Objection is tightening across established regimes. Portfolios change hands rather than being created. Applications get slower.
Gross Margin: 12-19%

Projects, Programmes and Tenure

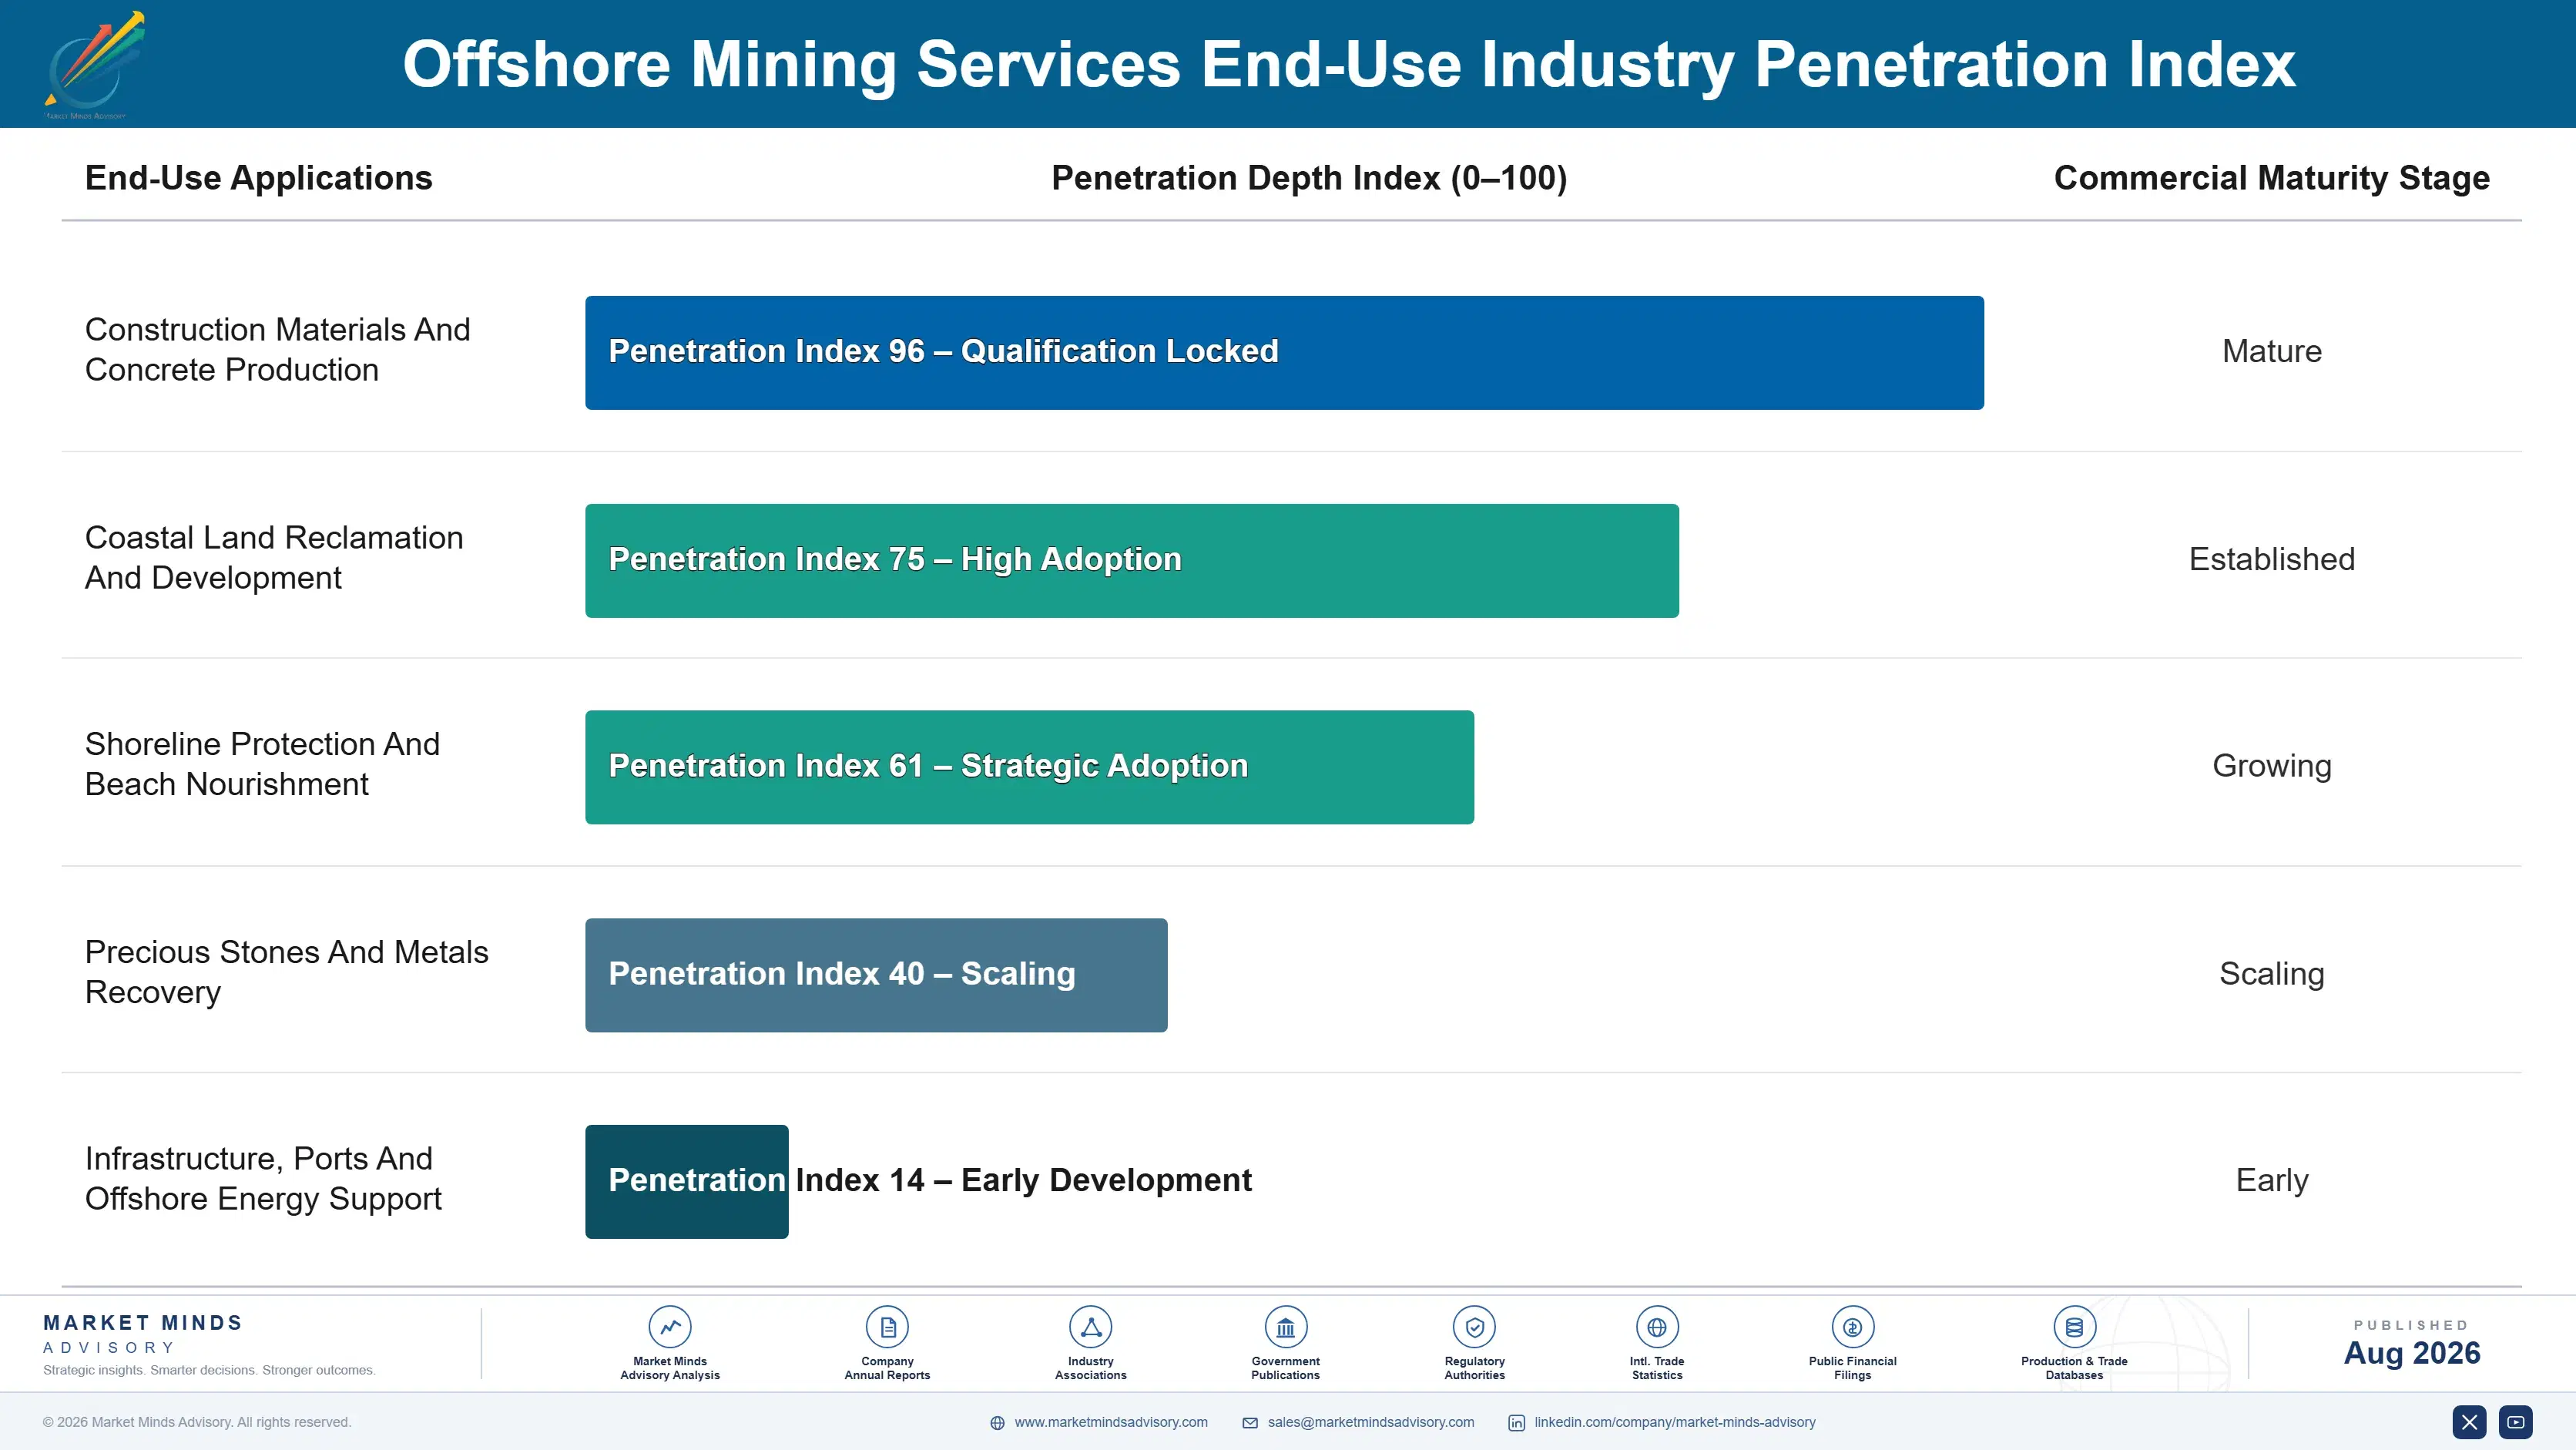
Demand arrives in three shapes that behave nothing alike. Reclamation is discrete, enormous, and awarded through competitive tender at intervals nobody controls. Coastal protection is publicly funded, recurring, and scheduled against erosion rates. Marine aggregate is continuous supply into construction markets. An operator carrying all three is balancing utilisation across demand patterns that rarely align in any useful way. Balancing across them is the whole operational problem.
Stickiness runs through licence tenure and incumbency rather than through any commercial relationship. A consented extraction area held for fifteen years is a position no competitor can contest, and coastal protection programmes favour the incumbent contractor at each renewal because mobilisation and local knowledge both carry real value. Reclamation tenders stick least and are genuinely contested on price and vessel availability together.

Buyer profiles differ completely across those three. Aggregate is sold to construction material companies and concrete producers on delivered price. Reclamation is awarded by developers and state authorities on capability and schedule. Coastal protection is procured by public bodies against erosion assessments, and that conversation involves engineers and funding officials who never appear in the other two. Very few operators staff all three conversations properly.
offshore-mining-services-market-end-use-penetration-index-1787302740783

What We Would Tell a Board

These are among the four positions where our research anticipates prominent divergence between winners and laggards over the coming forecast period. Each is grounded in the demand model, the regulatory perimeter, and the announced capacity pipeline.
01 / LICENCE PORTFOLIO BUILDING

The permission is scarcer than the vessel

Consenting an entirely new marine extraction area runs about six years against a typical tenure of only fifteen, and objections from coastal communities, fisheries, and heritage bodies attach to very nearly every application submitted anywhere. An operator without any consented areas simply cannot respond to a demand surge inside any project timescale that a client would accept. Licence portfolios have become the genuinely scarce asset in this business, and they now change hands considerably more often than dredging fleets do.
02 / FLEET SEQUENCING DISCIPLINE

Utilisation beats winning every single tender

Large trailing suction hopper dredgers cost hundreds of millions each, very few exist anywhere, and one reclamation contract can absorb much of a region's available capacity for a year at day rates near 180,000 dollars. Returns therefore depend on sequencing work carefully across projects rather than on winning every single tender that happens to appear. Operators bidding everything simultaneously end up either idle or badly overcommitted, and both of those outcomes cost considerably more than simply declining the work would have.
03 / VALUE DENSITY PURSUIT

Sand is haulage; minerals are actually mining

Offshore diamond recovery off Namibia generates around 9% of total industry revenue from a material volume that would barely register at all against the bulk aggregate tonnages moved over exactly the same period. Bulk aggregate dredging is fundamentally a haulage business with an extraction licence attached to the front end of it. Operators able to reach precious mineral and placer work escape a cost structure in which fuel and vessel time between them consume nearly all of the value created.
04 / HAUL DISTANCE WEIGHTING

Buy areas near demand, not areas with tonnage

Marine fuel carries roughly 32% of total operating cost, and haul distance between the extraction area and the delivery point drives most of that, which no vessel efficiency improvement anywhere can ever offset. Licence acquisition should therefore weigh proximity to expected demand at least as heavily as resource quality, deposit thickness, or the total area size available. Operators who bought their areas on tonnage available rather than on distance to actual demand have discovered that error slowly and very expensively.

Engagement Snapshot From the Field

A live engagement with an industry participant carrying material or product regulatory and market exposure ahead of a defining policy shift, showing how our research translates into a defensible multi-year portfolio strategy.
MARKET MINDS ADVISORY · CLIENT ENGAGEMENT SUMMARY
Offshore Mining Services Producer Strategic Portfolio Review and Transition Roadmap 2026·Investment Scenario on Offshore Mining Services Exposure Evaluation 2025-26
CLIENT PROFILE
A marine aggregate and dredging operator with approximately 310 million dollars in annual revenue (client-reported, unverified by MMA), running four hopper dredgers against a licence portfolio inherited largely unchanged for a decade. Utilisation had fallen for three years, fuel cost per cubic metre delivered had risen faster than the fleet average, and no new consenting applications were in progress.
STRATEGIC CHALLENGE
Management attributed declining returns to fuel prices and competitive tendering, and the board wanted an independent assessment before approving a vessel efficiency programme intended to address what it had been told was the problem. Nobody had mapped haul distance from the licensed areas to where the work actually was. It had been assumed.
MMA APPROACH
We mapped haul distance from every licensed area to actual delivery points across three years of voyages. Licence tenure expiry dates were assessed against consenting lead times. Utilisation gaps were decomposed into vessel availability, licence access, and tender losses, and coastal protection programme funding was reviewed by authority. Acquisition options for consented tenure were then priced.
KEY FINDINGS
  1. Fuel cost per cubic metre traced overwhelmingly to haul distance rather than to vessel efficiency, since demand had shifted away from the areas the client held licences over.
  2. Two of the four principal licensed areas expired within the consenting lead time, and no replacement applications had been started at any point.
  3. Utilisation gaps arose more from licence access than from tender losses, with vessels idle because no consented area sat within economic reach of available work.
  4. Coastal protection programmes at two authorities were funded and recurring, and the client had never tendered for either of them. Both sat within economic reach of the fleet.
CLIENT PROFILE
A marine aggregate and dredging operator with approximately 310 million dollars in annual revenue (client-reported, unverified by MMA), running four hopper dredgers against a licence portfolio inherited largely unchanged for a decade. Utilisation had fallen for three years, fuel cost per cubic metre delivered had risen faster than the fleet average, and no new consenting applications were in progress.
STRATEGIC CHALLENGE
Management attributed declining returns to fuel prices and competitive tendering, and the board wanted an independent assessment before approving a vessel efficiency programme intended to address what it had been told was the problem. Nobody had mapped haul distance from the licensed areas to where the work actually was. It had been assumed.
MMA APPROACH
We mapped haul distance from every licensed area to actual delivery points across three years of voyages. Licence tenure expiry dates were assessed against consenting lead times. Utilisation gaps were decomposed into vessel availability, licence access, and tender losses, and coastal protection programme funding was reviewed by authority. Acquisition options for consented tenure were then priced.
KEY FINDINGS
  1. Fuel cost per cubic metre traced overwhelmingly to haul distance rather than to vessel efficiency, since demand had shifted away from the areas the client held licences over.
  2. Two of the four principal licensed areas expired within the consenting lead time, and no replacement applications had been started at any point.
  3. Utilisation gaps arose more from licence access than from tender losses, with vessels idle because no consented area sat within economic reach of available work.
  4. Coastal protection programmes at two authorities were funded and recurring, and the client had never tendered for either of them. Both sat within economic reach of the fleet.
RECOMMENDED STRATEGY
Phase 1: Phase 1 (months one to twelve): begin consenting applications for areas near current demand and open acquisition discussions for consented tenure. Phase 2: Phase 2 (months twelve to thirty): defer the vessel efficiency programme and redirect that capital toward licence acquisition instead. Treat tenure as the scarcer asset. Phase 3: Phase 3 (months thirty to fifty-four): tender for coastal protection nourishment work to build recurring baseload utilisation. Build recurring utilisation deliberately.
OUTCOME
The efficiency programme was deferred and two consented areas were acquired within three quarters, both closer to current demand. Consenting applications were opened for the expiring areas, and the client tendered for its first nourishment programme (client-reported, unverified by MMA). Haul distance became a standing criterion in every licence decision.

Frequently Asked Questions

Foundational context covering the market sizes, CAGR, scope, country, region and competition that inform every finding below. This section is provided to cover basics and most often pre-purchase conversations, answered from the MMA Primary Research Dataset.

What is the current size of the Offshore Mining Services Market?

The market is valued at USD 6.8 billion in 2025, rising to USD 7.27 billion in 2026. Scope covers commercial seabed extraction services, not deep sea polymetallic equipment, onshore quarrying, or maintenance dredging.

How large will the Offshore Mining Services Market be by 2036?

MMA forecasts USD 14.17 billion by 2036, an increase of USD 6.90 billion over the 2026 base. That represents an expansion multiple of 1.95 times across the forecast period.

What is the CAGR for the Offshore Mining Services Market 2026 to 2036?

The base case CAGR is 6.9%, with a bull case of 8.1% and a bear case of 5.7%. The historical rate from 2020 to 2025 was also 5.7%, interrupted by paused coastal developments.

Which segment is growing fastest?

Land reclamation fill supply at 10.35%, exactly 1.50 times the market rate. No terrestrial source can supply those volumes at a haul distance anybody would accept.

Who are the major companies in the Offshore Mining Services Market?

Boskalis, Van Oord, DEME, Jan De Nul, and De Beers Marine lead on extraction and services revenue. The top five hold 44%, held there by vessel fleets and licence tenure together.

Which country is growing fastest?

Saudi Arabia at 11.6%, where coastal development programmes consume reclamation fill in volumes matched only by Singapore. Regional fleet availability rather than demand is the practical constraint.

Report Segmentation Architecture

The full report scope spans multiple orthogonal segmentation dimensions, with cross-tabulated demand data provided for each dimension pair. Coverage extends further to regional breakdowns, trend trajectories, and the competitive detail needed to support segment-level decision-making.

By Service And Material Recovered

  • Marine Aggregate Dredging
  • Land Reclamation Fill Supply
  • Offshore Diamond And Precious Mineral Recovery
  • Resource Survey And Definition Services
  • Environmental Monitoring And Consenting Support

By End-Use Industry

  • Construction Materials And Concrete Production
  • Coastal Land Reclamation And Development
  • Shoreline Protection And Beach Nourishment
  • Precious Stones And Metals Recovery
  • Infrastructure, Ports And Offshore Energy Support

By Commercial Model

  • Licensed Extraction And Material Sale
  • Project Contract Dredging And Fill Placement
  • Public Coastal Protection Programme Contracts
  • Concession Based Precious Mineral Recovery
  • Survey, Monitoring And Consenting Services

By Region

  • South Asia and Pacific
  • Western Europe
  • Middle East and Africa
  • East Asia
  • North America
  • Latin America
  • Eastern Europe

Scope, Methodology, and Coverage

Every figure in this report is reproducible from documented input assumptions. The scope below maps the historical period, the forecast horizon, the segmentation dimensions, and the countries covered, alongside the underlying primary and qualitative methodology.
Historical Period
2020 to 2025
Forecast Period
2026 to 2036
Base Year
2025 (USD billions; MMA Primary Research Dataset, August 2026)
Market Definition
This market comprises services delivered for the commercial extraction of minerals and aggregates from the seabed in shallow and nearshore waters, measured at operator and contractor revenue across licensed extraction, project contract, public programme, concession, and survey service channels. Coverage spans marine aggregate dredging for construction materials, land reclamation fill supply and placement, offshore diamond, tin and placer mineral recovery, marine resource survey and definition services, and environmental monitoring and consenting support delivered for extraction projects. Deep sea polymetallic nodule, sulphide and crust extraction equipment and operations, onshore quarrying, crushing and aggregate processing, port, harbour and channel maintenance dredging, offshore oil and gas construction and support services, offshore wind installation, and marine construction work beyond fill placement fall outside scope.
Quantitative Units
USD billions (current prices); cubic metres extracted and placed; day rates by vessel class; licensed extraction area under tenure
Segmentation Dimensions
By Service And Material Recovered; By End-Use Industry; By Commercial Model; By Region
Regions Covered
South Asia and Pacific, Western Europe, Middle East and Africa, East Asia, North America, Latin America, Eastern Europe
Countries Covered
Singapore, Indonesia, Malaysia, Australia, India, Vietnam, Japan, South Korea, China, Taiwan, Netherlands, Belgium, United Kingdom, Denmark, Germany, France, Spain, Saudi Arabia, United Arab Emirates, Qatar, Namibia, South Africa, United States, Mexico, Brazil, Poland, Romania, and additional markets relevant to this sector
Key Companies Profiled
Boskalis, Van Oord, DEME, Jan De Nul, De Beers Marine, Hanson Aggregates Marine, CEMEX Marine, Tarmac Marine Dredging, Great Lakes Dredge and Dock, China Communications Construction, Penta-Ocean Construction, Toa Corporation, National Marine Dredging Company, Rohde Nielsen, Fugro, Gardline, Debmarine Namibia, PT Timah, Dredging Corporation of India, Weeks Marine
Quantitative Methodology
Primary survey, n=3,800 respondents, Q4 2025, six countries; demand-side model with trade association cross-validation
Qualitative Methodology
47 expert interviews, Q4 2025; applied to validate demand model assumptions, identify emerging dynamics, and assess competitive positioning
Report Format
PDF and XLSX data workbook (Word format preview document)
Publisher
Market Minds Advisory
Report Code
MMA-2026-ENE-945
Published
August 2026
Contact
sales@marketmindsadvisory.com | www.marketmindsadvisory.com

Purchase the full Offshore Mining Services Market Report (2026 to 2036).

The full report sizes offshore mining services across five service types, five end-use industries, five commercial models, and seven regions, with licence tenure and consenting timelines assessed as the primary competitive constraint throughout. Haul distance economics are modelled from licensed extraction areas to actual delivery points rather than at the vessel. Fleet availability is tracked against the discrete project awards that absorb it. Competitive profiling covers twenty participants on extraction and services revenue, and precious mineral concession access is assessed separately from bulk dredging capability.
Licence tenure and consenting timelines assessed as the primary constraint
Haul distance economics modelled from extraction areas to delivery points
Fleet availability tracked against discrete reclamation project award timing
Precious mineral concession access assessed separately from bulk dredging capability
Coastal protection programme funding tracked by authority and horizon
Marine sand export restrictions mapped against reclamation fill sourcing

Built For The People Who Decide

From boardroom strategy to bench-side execution, this report is read cover-to-cover by leaders shaping the next decade of their industry, turning demand scenarios, market dynamics and valuation benchmarks into decisions.
CXOs/ Presidents/ VPs/ Managers
M&A and Corporate Development
Strategy Teams and R&D Heads
Procurement and Product Directors
Regulatory and Compliance Leaders
Investor Relations and Equity Analysts