Market Minds Advisory
Oceania Digital Textile Printer Market

Oceania Digital Textile Printer Market: Direct-to-Garment, Sublimation, and Pigment Printing Technology

On-demand apparel customization is pulling Oceania print shops away from screen printing toward direct-to-garment digital equipment, forcing imported machine suppliers to build local service networks that regional distances have historically made difficult.

Lead Analyst

Bilal Shaikh

Published

September 2026

Make Smarter Decisions with Customized Research Insights

Request a free sample report and evaluate market opportunities, growth trends, and competitive dynamics relevant to your business needs.

2025 MARKET VALUE$0.2BMarket Size 2025
2036 FORECAST VALUE$0.5BBase Case , 2026 to 2036
CAGR 2026 TO 20369.2 %Bull 10.5% / Bear 7.8%
INCREMENTAL OPPORTUNITY$0.3BNet 10- year value creation
EXPANSION MULTIPLE2.41x2036 value over 2026 base
Strategic Levers
M&A Pipeline
Regional Outlook
Country Rankings
Competitive Intelligence
Segmental Deep-dive
Call-Us : 91 93563 13602

Executive Snapshot and Market Trajectory

On-demand apparel customization is pulling Oceania print shops away from screen printing toward direct-to-garment digital equipment, forcing imported machine suppliers to build local service networks that regional distances have historically made genuinely difficult across most markets and customer segments broadly, a shift few incumbents fully anticipated when planning distribution strategy.
Direct-to-garment digital printers are growing fastest as small-batch apparel customization demand expands, with equipment supply concentrating from East Asia and Western Europe, where dominant global printer manufacturing bases sustain the deepest technology and service capability reaching Oceania's comparatively small but rapidly digitizing textile printing sector, well ahead of any domestic manufacturing capability the region itself maintains, where global manufacturing leadership sustains technology depth Oceania's own limited industrial base cannot match.
Competition remains concentrated among a handful of established global printer manufacturers, while local distribution and service network investment increasingly determines which suppliers can convert Oceania's growing digital printing interest into sustained equipment sales, forcing even long-established suppliers to defend distributor relationships against fast-moving regional rivals entering adjacent territories nationwide and across neighboring Pacific Island markets currently underserved by comparable service capability at any meaningful commercial scale.
Market Definition
This market covers digital textile printing equipment sold and installed across Australia, New Zealand, and Pacific Island markets, including direct-to-fabric, direct-to-garment, and dye-sublimation printer technologies. It excludes screen printing equipment, textile finishing machinery, and consumables sold independently of printer hardware.
Base Year Value
$0.2B in 2025 (MMA Primary Research Dataset, August 2026)
Forecast Period
2026 to 2036, eleven discrete annual values
CAGR
9.2% base case. Bull 10.5%. Bear 7.8%.
Fastest Growth Segment
Direct-to-Garment (DTG) Digital Printers: 13.5% CAGR
Fastest Growth Country
New Zealand: 10.8% CAGR
Fastest Growth Region
South Asia and Pacific: 11.2% CAGR
Largest Region
East Asia: 38% of 2025 global value
Market Leaders
Mimaki Engineering Co., Ltd., Epson Corporation, Kornit Digital Ltd., EFI Reggiani S.p.A., Konica Minolta, Inc. Source: MMA Analysis based on company annual reports.
Primary Survey
n=3,800 procurement and R&D decision-makers, Q4 2025, six countries
Methodology
Demand-side build-up, cross-validated against public data, 47 expert interviews

Oceania Digital Textile Printer Market Forecast Scenarios

oceania-digital-textile-printer-market-size-forecast-scenario-1787308066129
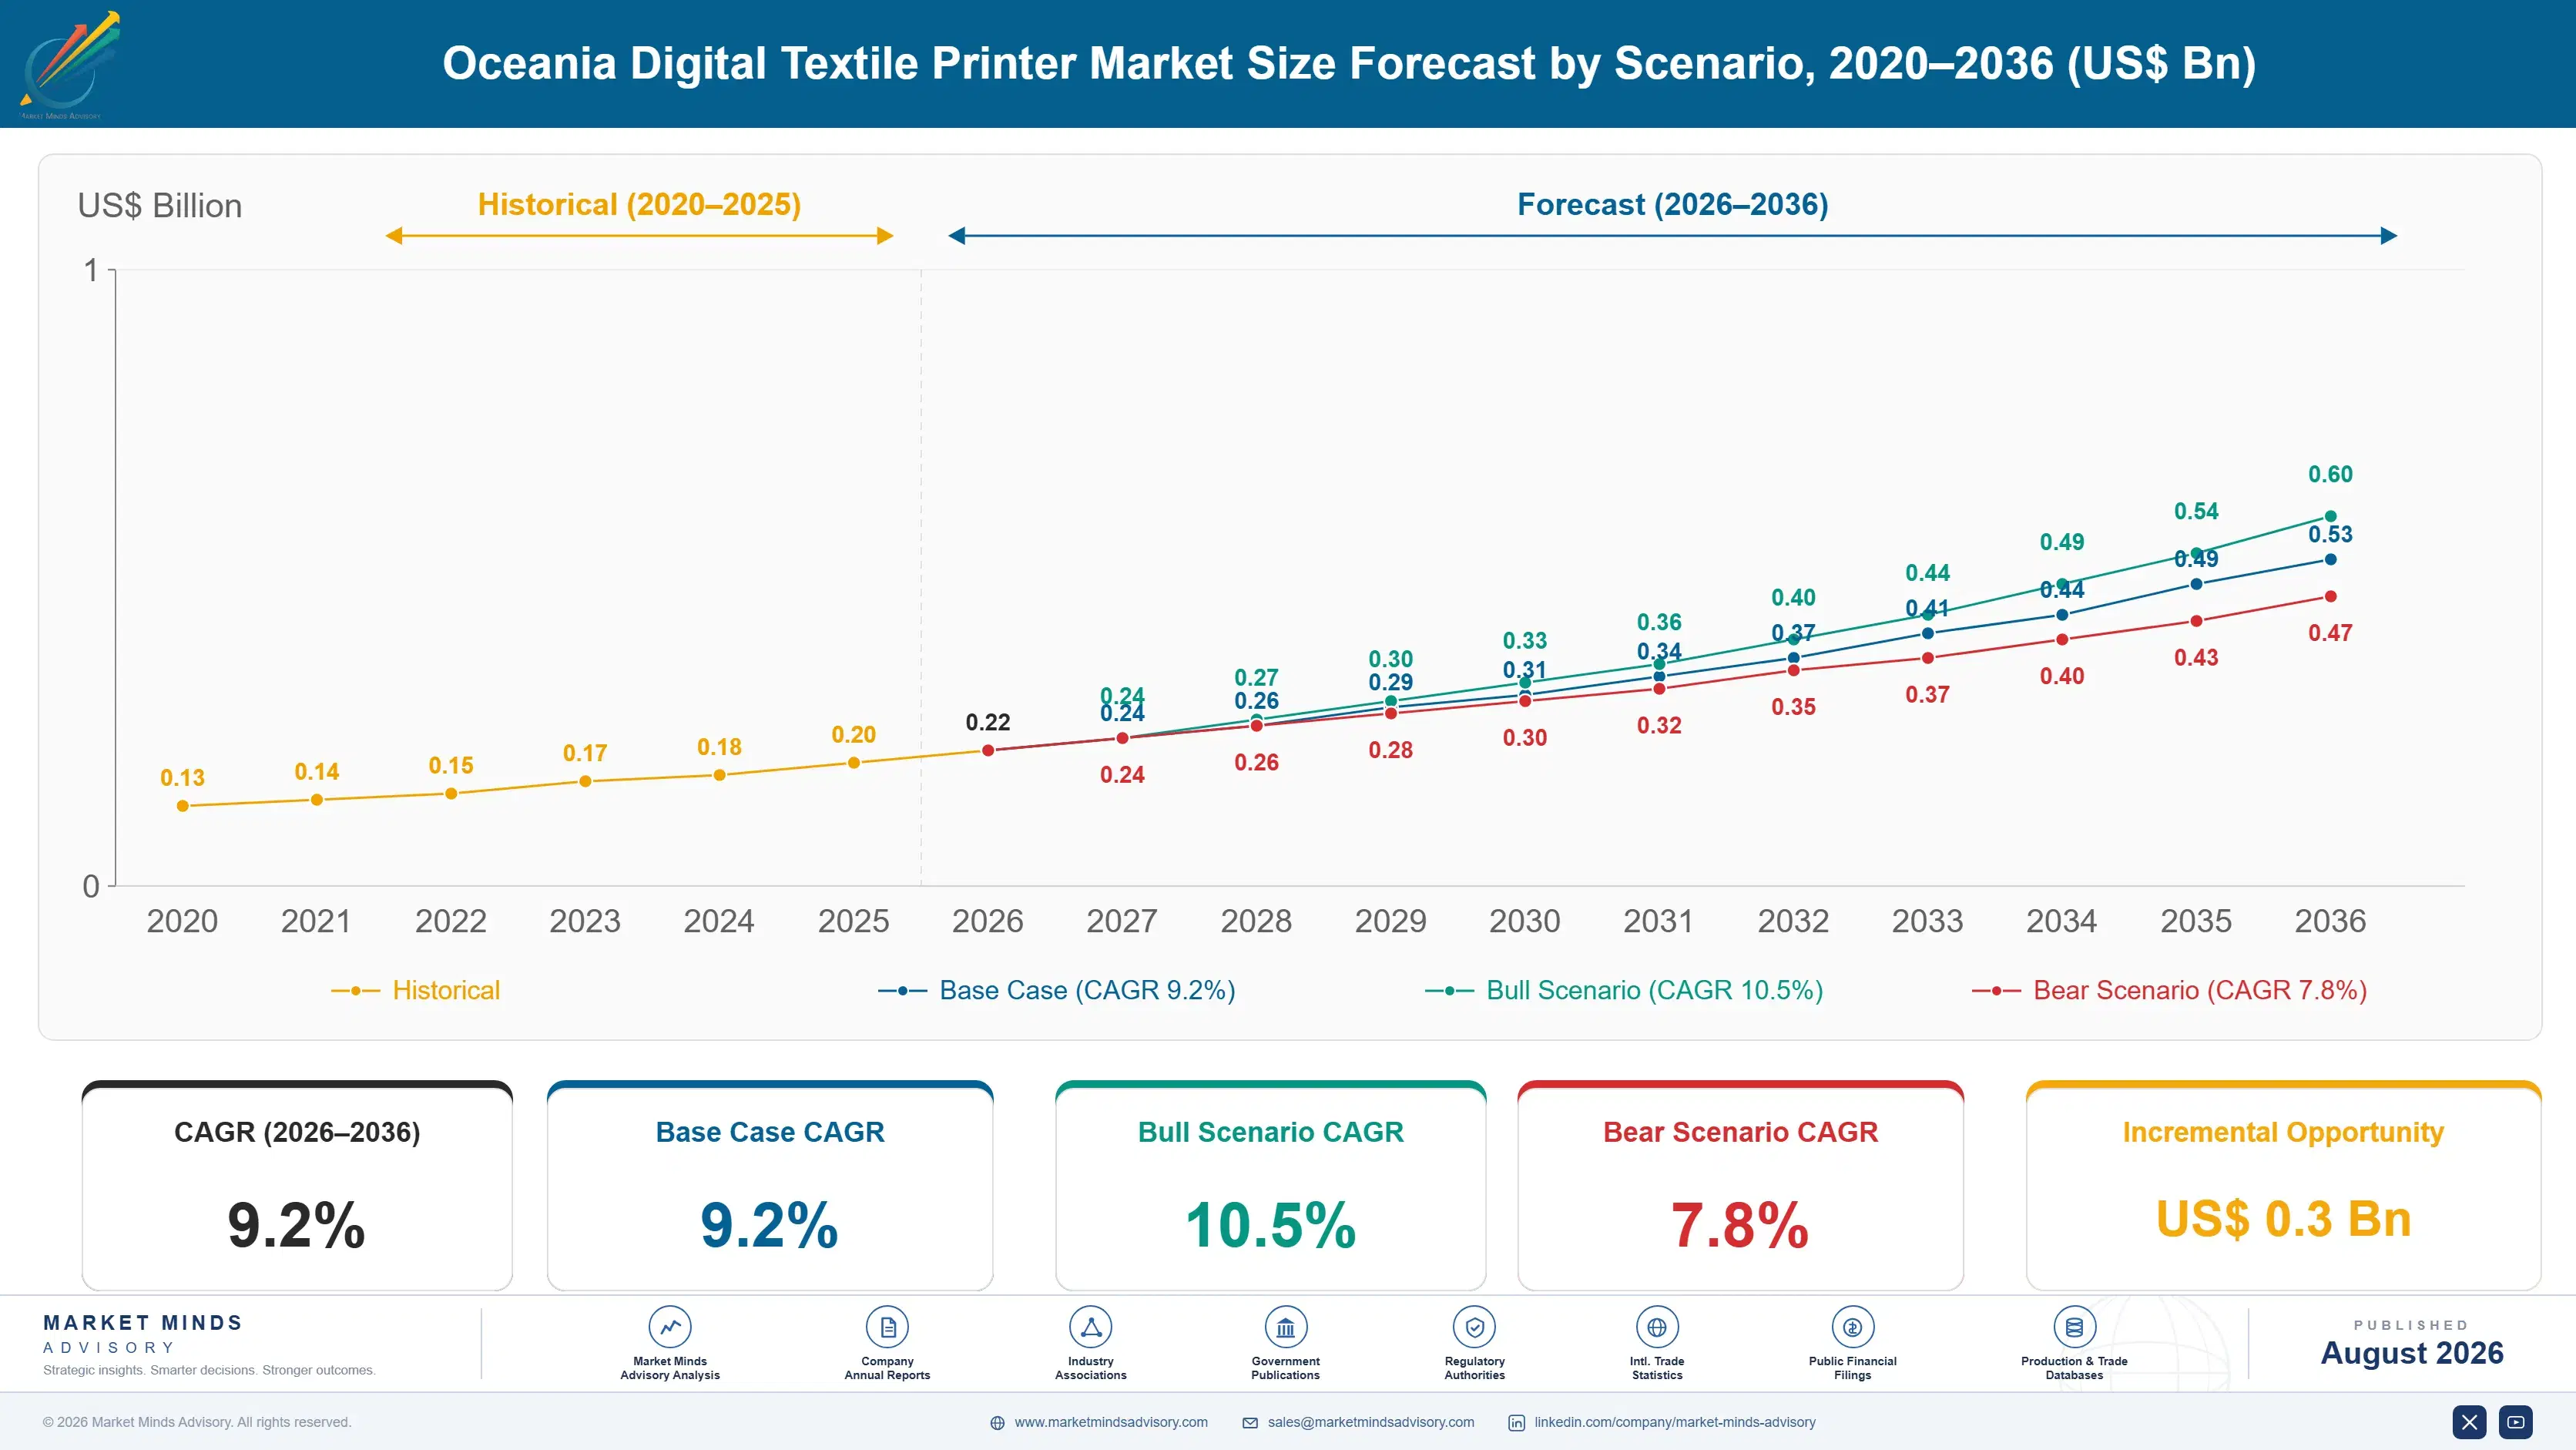
Oceania digital textile printer spending grew at roughly 8.2% annually between 2020 and 2025, as expanding on-demand apparel customization and steady replacement of aging screen printing equipment drove growth across most major Oceania printing markets tracked in this study, a pattern that has held steady even as individual application categories diverged meaningfully in underlying growth trajectory.
The base case assumes continued direct-to-garment adoption, expanding local distributor service network investment, and steady replacement of legacy equipment, sustaining a 9.2% blended annual growth rate through 2036 as regional print shops increasingly favor digital equipment over conventional analog printing methods. These three mechanisms reinforce each other: DTG adoption widens the buyer pool, service investment lifts conversion, and replacement demand sustains baseline volume nationally across most major Oceania printing markets tracked in this study.
A bull scenario assumes faster-than-expected on-demand apparel adoption pulls direct-to-garment equipment sales well ahead of current projections across major Oceania print markets. The bear case centers on regional distribution cost pressure and equipment financing constraints that could meaningfully slow broader adoption among smaller print operations, lifting growth toward 10.5% if adoption accelerates. The bear case pulls growth down toward 7.8% instead if financing constraints intensify faster than expected.

Digital Conversion Meets Regional Distribution Reality

The Oceania digital textile printer market sits at the convergence of growing on-demand apparel customization demand and the genuine logistical challenge of serving a geographically dispersed regional market, a combination pulling this comparatively small category into more service-dependent, distributor-driven competitive territory across most major Oceania printing markets, a shift accelerating faster than most imported equipment suppliers originally expected when planning multi-year distribut
MARKET CONCENTRATIONCR5 52%share held by the five largest printer suppliers combined
AVERAGE PRINTER SYSTEM PRICE$95,000blended average price across standard industrial digital textile printer systems
LEADING COUNTRY SHAREAustralia 68%of regional category spending in a single national market
DIRECT-TO-GARMENT PENETRATION29%of total digital printer installations now using direct-to-garment technology
SERVICE RESPONSE TIME3.4 daysaverage technician response time for equipment service requests
DIGITAL CONVERSION RATE38%of print shops converted from screen printing to digital equipment
Commercially, this market splits between standard direct-to-fabric systems sold to established textile printing operations, and newer direct-to-garment systems sold at meaningfully higher price points to smaller print shops and on-demand apparel businesses, a divide reshaping which suppliers capture the fastest-growing customer segment, leaving slower-moving premium-only suppliers increasingly confined to a narrower, larger-account customer base nationwide and beyond, as this bifurcation continues deepening across most Oceania printing markets tracked.
Over the next decade, continued on-demand apparel growth, expanding local distributor service capability, and steady legacy equipment replacement will keep pulling Oceania print shops toward digital equipment across most major textile printing application categories and customer segments tracked in this study, reshaping distribution, service, and commercial investment priorities across nearly every major supplier serving this region across distribution, service, and commercial planning alike nationwide.
"A printer is only as good as the technician who can reach it. In Oceania, that logistics question decides more equipment purchases than the spec sheet does."
Director, Digital Printing Technology and Industrial Equipment Practice · MMA Te

Market Trends

On-Demand Apparel Customization Drives DTG Adoption

Growing consumer and business demand for small-batch, customized apparel continues driving strong adoption of direct-to-garment digital printing equipment across Oceania print shops and merchandise businesses, replacing traditional screen printing methods that require substantially higher minimum order volumes to remain cost-effective. Industry data indicates direct-to-garment installations now represent roughly 29% of total digital printer installations across the region, a meaningful increase from a much smaller base just several years earlier before on-demand apparel business models gained broader commercial traction. This shift is pulling equipment suppliers without dedicated direct-to-garment product lines to expand their offerings rapidly or risk losing this fastest-growing segment.
Market Impact: Expands on-demand business volume 2
Local Distributor Service Networks Expand Regional Reach

Leading digital textile printer manufacturers continue expanding local distributor and service partner networks across Australia, New Zealand, and Pacific Island markets, addressing the genuine logistical challenge that regional distances have historically posed for equipment maintenance and technical support availability. Industry data confirms average service response times have improved meaningfully across the region over the past several years as manufacturers invest in expanded local technician networks and regional parts inventory. This trend is pulling suppliers without established local service infrastructure to invest rapidly or risk losing customer confidence entirely across most Oceania printing markets tracked broadly.
Market Impact: Drives 18 percent replacement conve

Market Opportunities and Growth Drivers

Expanding On-Demand and Print-on-Demand Apparel Businesses

Continued growth of on-demand and print-on-demand apparel business models across Oceania continues driving demand for direct-to-garment digital printing equipment capable of cost-effective single-unit and small-batch production runs that traditional screen printing methods cannot economically match. E-commerce industry data confirms print-on-demand apparel business formation has grown considerably across the region over the past several years, directly expanding the addressable market for direct-to-garment equipment. This driver is expected to keep sustaining above-average growth in direct-to-garment applications through the coming decade across most major Oceania consumer markets tracked across most major Oceania consumer markets and printing segments broadly today.
Market Impact: Adds 22 percent to costs

Aging Screen Printing Equipment Replacement Cycle

A substantial share of Oceania's installed screen printing equipment base has reached the end of its typical operational lifespan, continuing to drive replacement purchasing decisions that increasingly favor digital equipment over comparable analog replacement given digital technology's improved cost economics for shorter production runs. Industry survey data confirms a meaningful share of regional print shops report actively evaluating digital equipment as part of planned screen printing equipment replacement cycles. This driver is expected to keep sustaining steady replacement-driven demand through the coming decade across most major Oceania printing markets tracked broadly.
Market Impact: Limits 31 percent of shops

Market Restraints and Challenges

Regional Distribution Costs Limit Equipment Affordability

Continued high shipping, import duty, and regional distribution costs associated with serving Oceania's geographically dispersed and comparatively small market continue limiting equipment affordability relative to larger markets where suppliers achieve greater distribution economies of scale. The root cause is that Oceania's population and printing industry base remain genuinely small relative to shipping distances from major manufacturing regions in East Asia and Europe, creating persistent logistics cost disadvantages relative to larger markets. This pressure disproportionately affects smaller print shops with limited capital access. Suppliers are responding by expanding local distributor partnerships to improve landed cost competitiveness.
Market Impact: Reaches 29 percent DTG penetration

Equipment Financing Constraints Slow Smaller Operator Adoption

Persistent equipment financing constraints continue slowing digital printer adoption among smaller Oceania print shops and independent operators, who often lack the capital access or credit history that equipment financing providers require for the substantial upfront investment digital printing systems typically require. The underlying cause is that many smaller regional print operations remain genuinely capital-constrained businesses without established banking relationships suited to equipment financing arrangements common in larger markets. This constraint disproportionately affects independent operators outside major metropolitan areas. Suppliers are responding by developing leasing and financing partnership programmes tailored to smaller regional operators.
Market Impact: Improves service response 24 percen
3 additional market trends, 4 additional growth drivers, and 3 additional restraints and challenges are covered in the full report. Contact sales@marketmindsadvisory.com to access the complete intelligence.

Segment CAGR and Growth Architecture

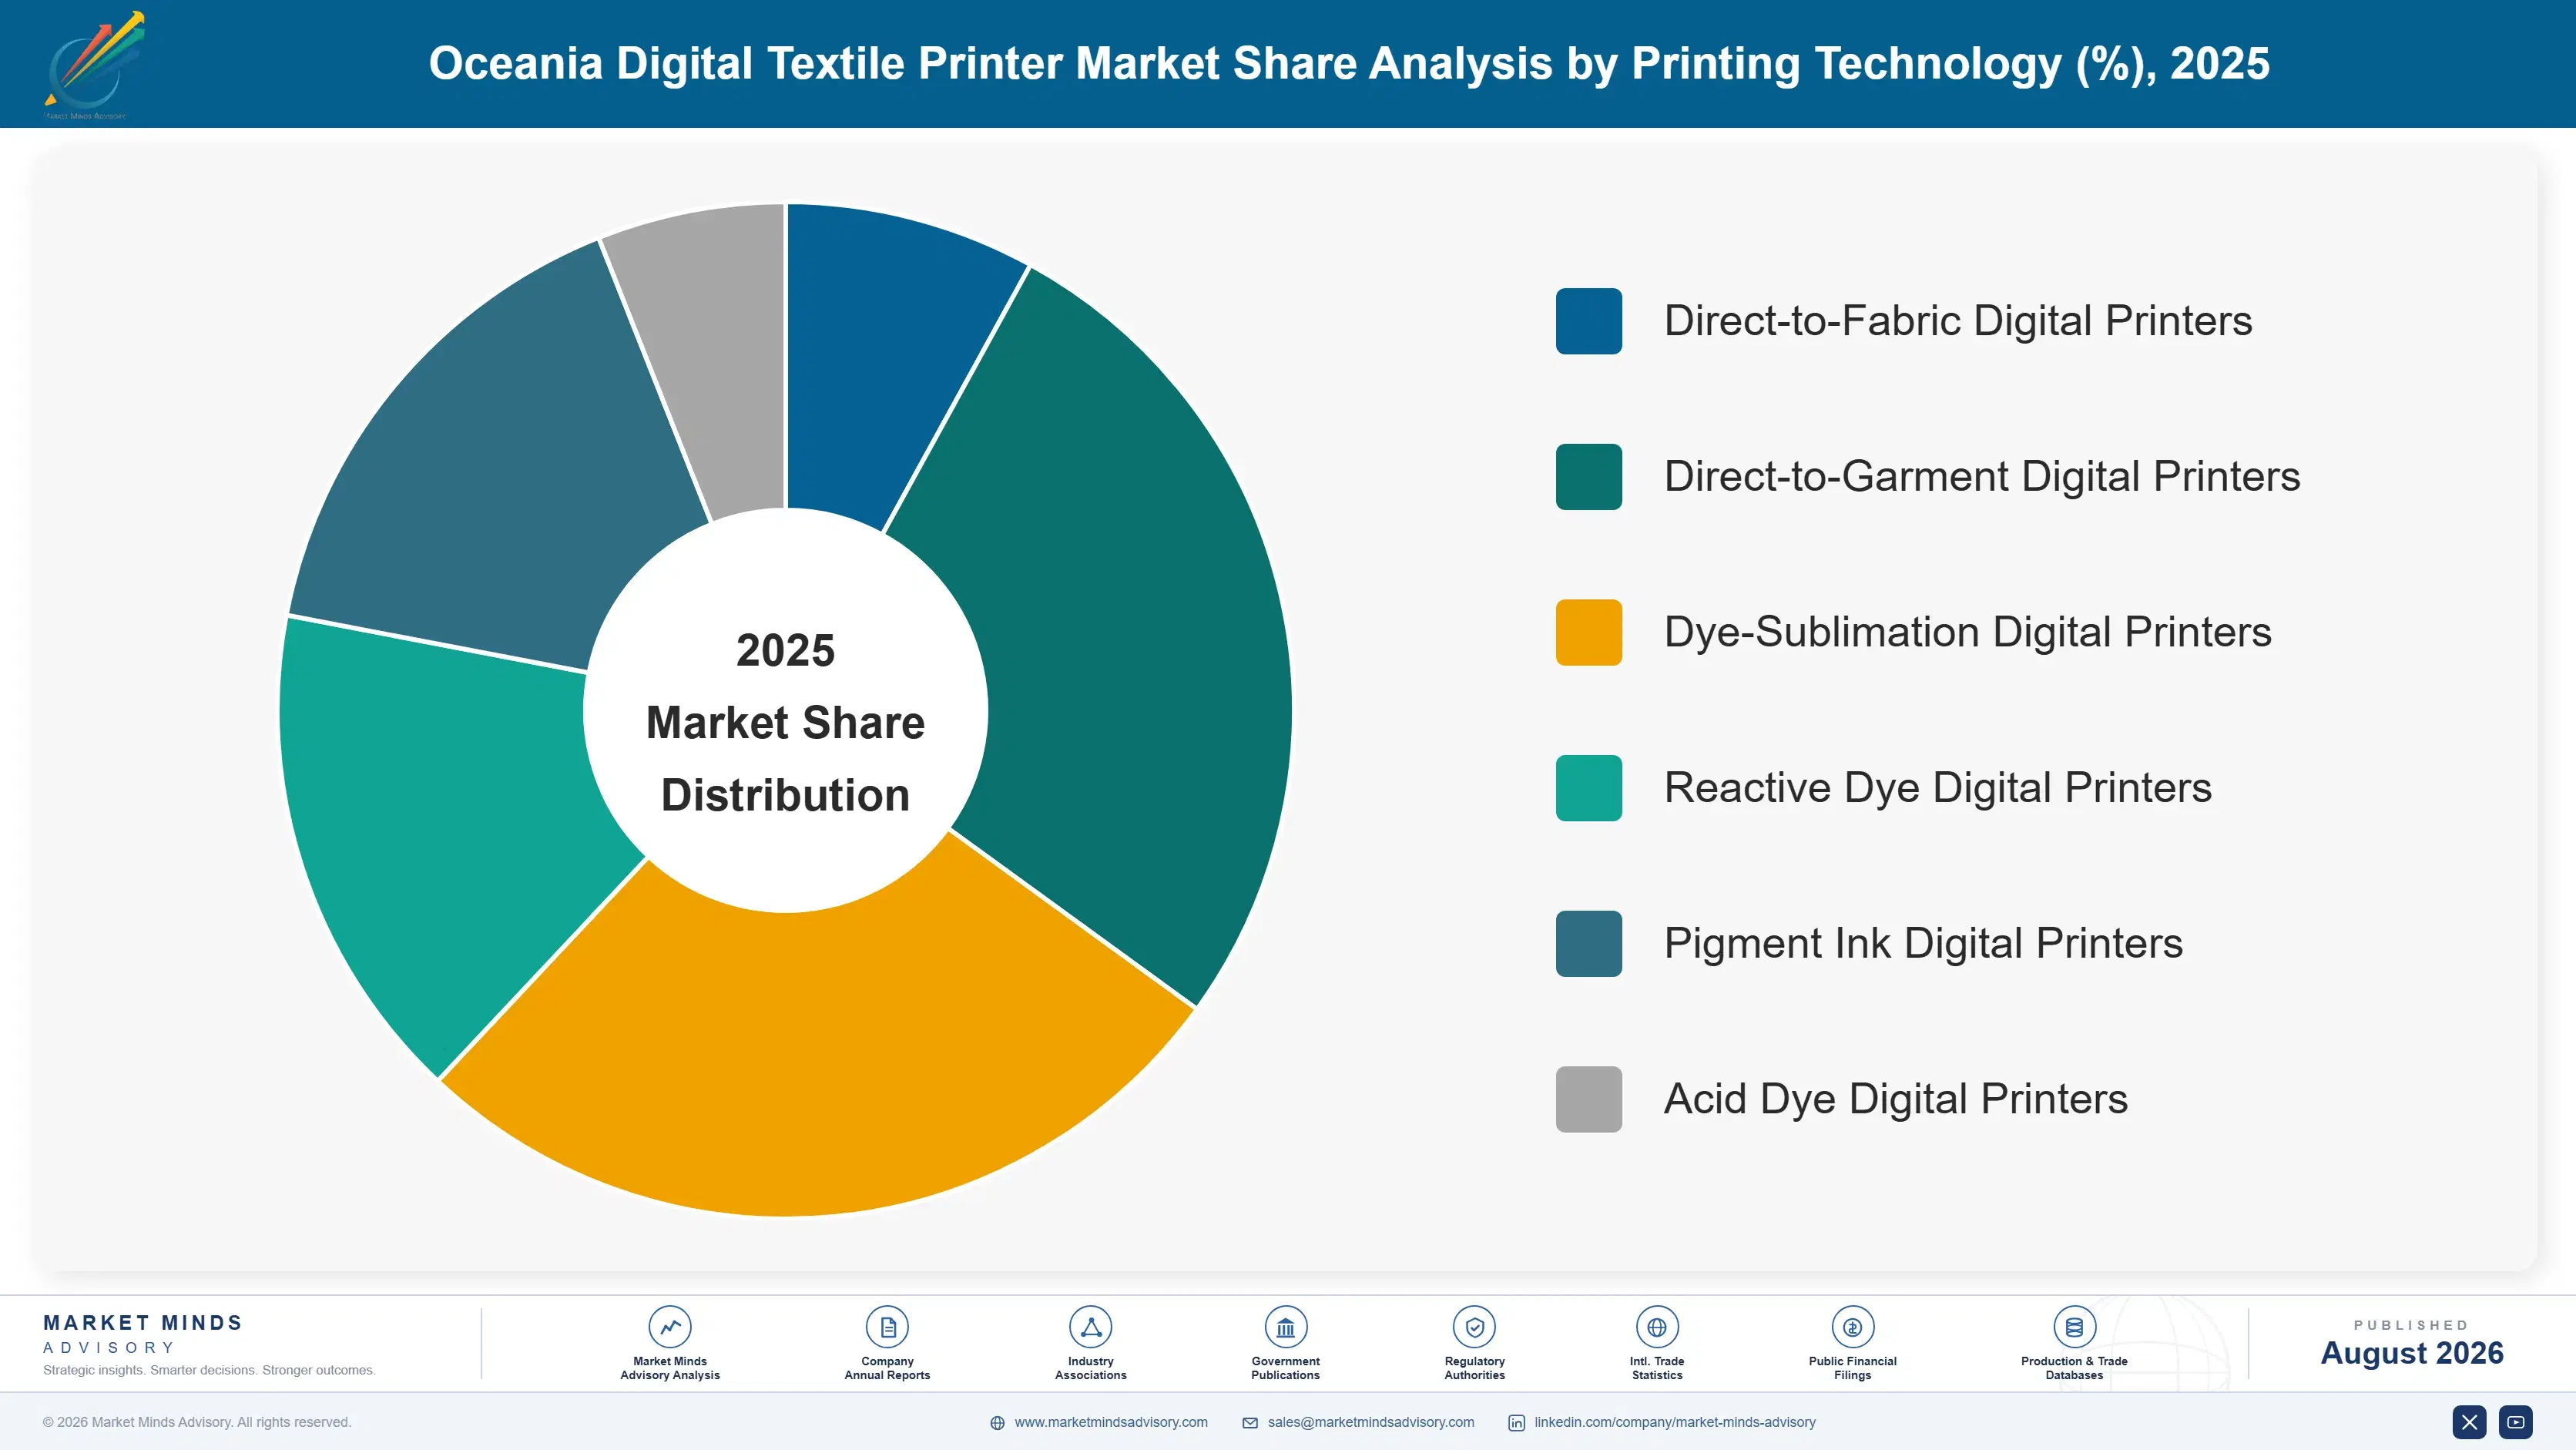
This market segments by ink and printing technology spanning direct-to-fabric, direct-to-garment, dye-sublimation, reactive dye, pigment ink, and acid dye digital textile printers sold across Oceania's apparel, home textile, and merchandise printing sectors broadly.
oceania-digital-textile-printer-market-market-share-analysis-1787308066659

Direct-to-Garment (DTG) Digital Printers

Direct-to-garment digital printers are the fastest-growing segment as on-demand apparel customization continues expanding across Oceania print shops and merchandise businesses, driving strong demand for equipment capable of cost-effective single-unit and small-batch production that traditional screen printing methods cannot economically match for these smaller order volumes tracked in this study. Leading manufacturers have invested heavily in expanding direct-to-garment product lines specifically for smaller regional print shop customers seeking accessible entry-level equipment options alongside premium industrial-grade systems. This segment commands meaningfully higher unit sales growth than legacy direct-to-fabric formats, reflecting genuine business model transformation among Oceania print shops adapting to changing consumer demand for customized apparel. Suppliers are pursuing expanded direct-to-garment distribution specifically to compete for this fastest-growing segment across the region nationwide.
CAGR 13.5%

Pigment Ink Digital Printers

Pigment ink digital printers are growing considerably faster than the broader market as their versatility across multiple fabric types and simplified production workflow compared to reactive and acid dye systems continues appealing to Oceania print shops seeking equipment flexibility without extensive specialized production infrastructure investment tracked in this study. Leading manufacturers have invested significantly in pigment ink formulation improvements that address historical colorfastness and hand-feel limitations relative to reactive dye alternatives, broadening pigment technology's suitability across more demanding textile printing applications. This segment benefits from genuine operational simplicity that smaller Oceania print shops value given their more limited technical staffing resources compared to larger textile manufacturing operations. Suppliers are investing in pigment technology improvements specifically to compete for this genuinely differentiated segment across the region.
CAGR 11.8%
Full segment breakdown across 6 segments available in the complete report.

Regional Architecture and Country Demand Map

[house] Because this report is scoped explicitly to Oceania, regional shares reflect the geographic origin of digital textile printing equipment supplied into the region rather than end-market demand distribution used in globally scoped reports.

North America

[house] North American-origin equipment, supplied primarily by HP and Kornit Digital's United States operations, holds a meaningful share of the Oceania market, reflecting these companies' strong global brand recognition and established distributor relationships across major Australian and New Zealand printing markets. American suppliers have historically competed on advanced print head technology and software integration capability rather than pure price competitiveness against Asian manufacturing origin equipment. Several American manufacturers have expanded Oceania-focused distributor partnerships specifically to improve regional service response times that geographic distance from United States headquarters has historically complicated. This region's share reflects continued American technology leadership positioning within the broader Oceania digital printing equipment market.
Share: 14% | CAGR: 9.5% (2026 to 2036)

Western Europe

[house] Western European-origin equipment, supplied primarily by Italian manufacturers including EFI Reggiani, Durst, and MS Printing Solutions, holds the second-largest share of the Oceania market, reflecting Italy's globally recognized leadership position in digital textile printing equipment engineering and design specifically. German and Austrian manufacturers including Zimmer Maschinenbau contribute additional meaningful share through specialized industrial textile printing equipment sold primarily to larger Oceania textile manufacturing operations. European manufacturers have historically competed on print quality and engineering precision rather than price, appealing particularly to premium textile printing operations across major Oceania metropolitan markets. This region's substantial share reflects European equipment's strong reputation among established Oceania textile printing businesses specifically.
Share: 30% | CAGR: 7.8% (2026 to 2036)
Regional intelligence for 5 additional markets available in the complete report: East Asia, South Asia and Pacific, Latin America, Middle East and Africa, Eastern Europe. Contact sales@marketmindsadvisory.com.
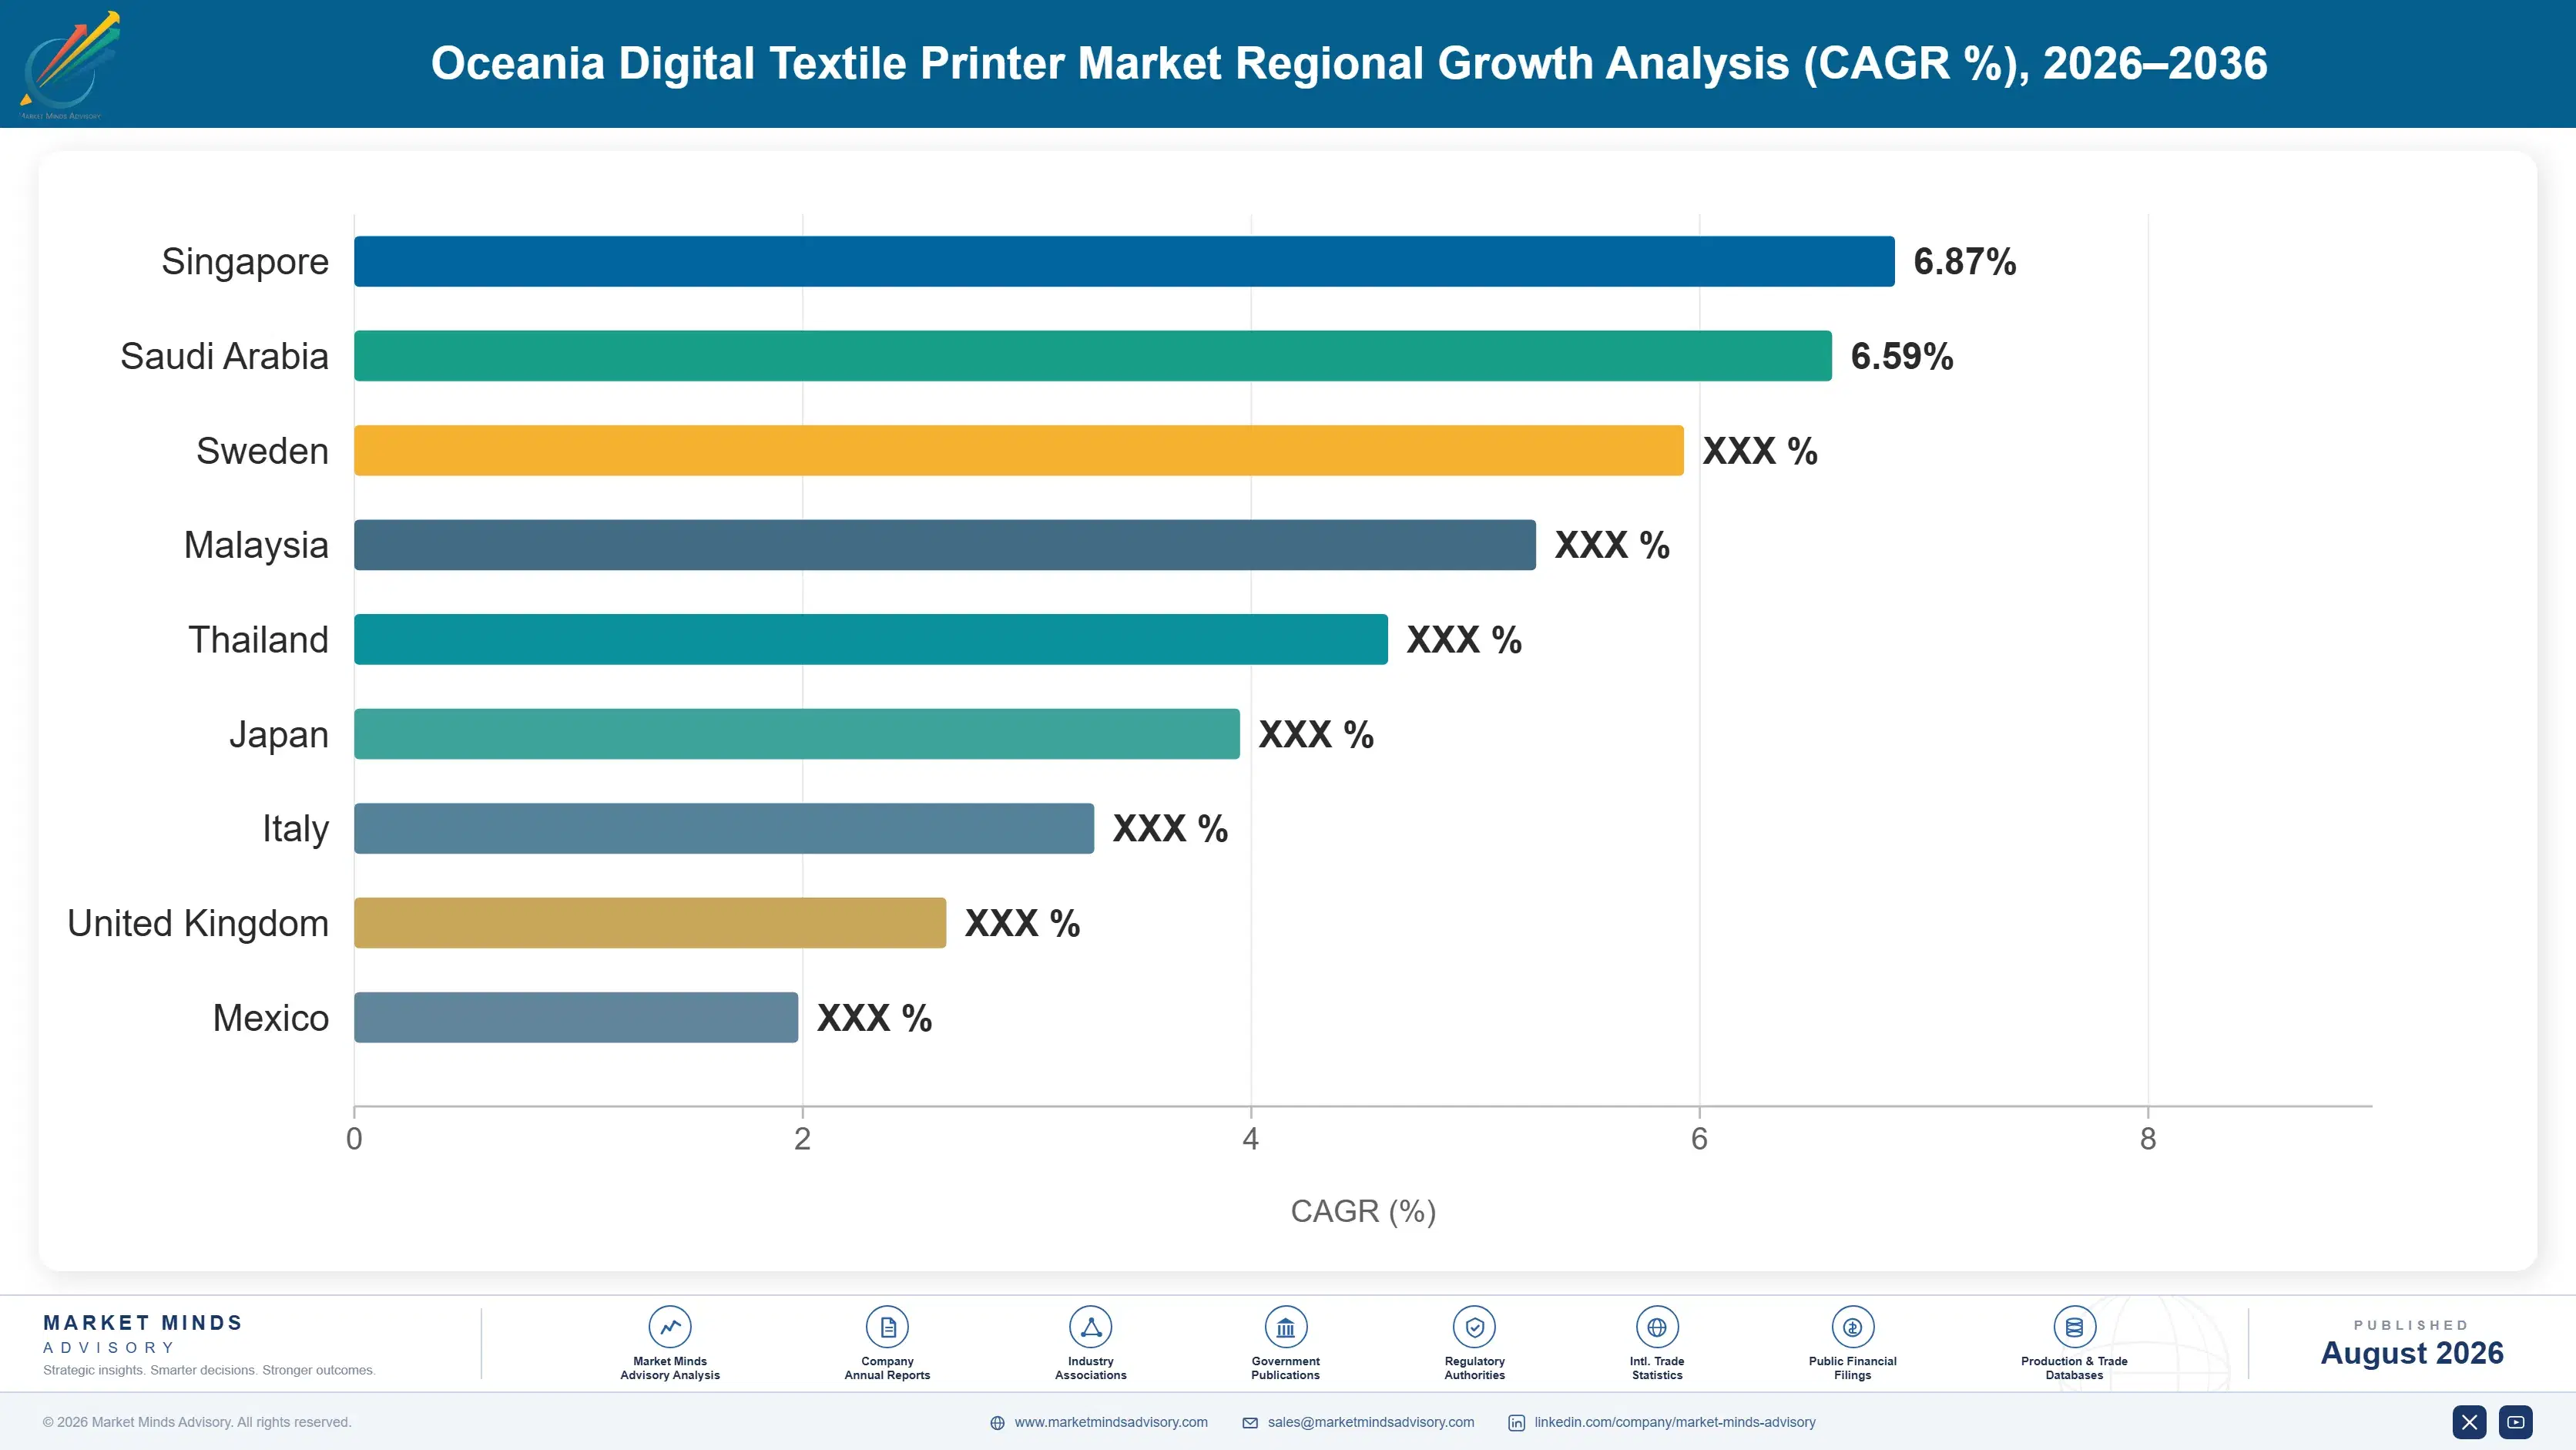
oceania-digital-textile-printer-market-country-cagr-analysis-1787308067179

Local Service Network and DTG Expansion Strategy

Suppliers are shifting commercial strategy toward local distributor service network investment, direct-to-garment product line expansion, and equipment financing partnership development, capturing conversion revenue that imported equipment sales alone increasingly cannot sustain across Oceania's geographically dispersed printing market.

Local Distributor Service Network Investment Programme

Suppliers are investing in expanded local distributor and technician service networks across Australia, New Zealand, and Pacific Island markets, addressing the genuine logistical challenge that regional distances have historically posed for equipment maintenance and customer confidence in imported digital printing technology. This lever requires meaningful investment in local partnership development and technician training, but successfully expanded service networks capture durable, long-term customer relationships that competitors lacking comparable regional presence cannot easily replicate. Suppliers report service network investment improving equipment sales conversion rates by roughly 27% compared to suppliers without dedicated regional service infrastructure.
Market Impact: Improves sales conversion rates by

Direct-to-Garment Product Line Expansion Strategy

Suppliers are expanding direct-to-garment product lines specifically targeting smaller Oceania print shops and on-demand apparel businesses seeking accessible entry-level digital printing equipment options alongside premium industrial-grade systems traditionally sold to larger textile manufacturing operations. This lever requires meaningful product development investment tailored to smaller customer budgets, but successfully expanded product lines capture the fastest-growing customer segment that premium-only suppliers increasingly cannot reach. Suppliers report direct-to-garment expansion improving addressable customer base by roughly 24% compared to premium-only product portfolios.
Market Impact: Expands addressable customer base 2

Equipment Financing Partnership Development Strategy

Suppliers are developing leasing and financing partnership programmes tailored to smaller regional Oceania print operators who often lack the capital access or established banking relationships that traditional equipment financing arrangements require, capturing sales from customers who would otherwise remain priced out of digital equipment adoption entirely. This lever requires meaningful financial partnership structuring investment, but successfully developed financing programmes open genuinely new customer segments previously unable to purchase equipment outright. Suppliers report financing partnership development improving smaller operator conversion rates by roughly 29% compared to cash-purchase-only sales approaches.
Market Impact: Improves conversion rates by 29 per

Regional Training and Technical Support Investment Strategy

Suppliers are investing in regional training programmes and technical support infrastructure that build print shop operator confidence and technical competency with digital printing equipment, reducing the perceived operational risk that has historically slowed adoption among print shops more familiar with conventional screen printing methods across Oceania markets. This lever requires meaningful ongoing training investment, but successfully trained customer bases generate materially stronger equipment utilization and customer satisfaction outcomes. Suppliers report training investment improving customer satisfaction scores by roughly 22% compared to suppliers without dedicated training programmes.
Market Impact: Improves customer satisfaction by 2

Who Controls the Margin Pool

The top five suppliers control roughly 52% of regional category spending, a genuinely concentrated market reflecting significant barriers to entry including capital-intensive manufacturing requirements, established global brand recognition, and the substantial local distribution infrastructure investment required to serve Oceania's geographically dispersed printing market effectively.
Current competitive activity centers on local distributor service network investment, direct-to-garment product line expansion, and equipment financing partnership development, as leading suppliers pursue genuinely different strategic emphases depending on whether they compete primarily in premium industrial or accessible entry-level equipment categories.

Emerging pressure comes from Chinese manufacturers entering with more accessibly priced equipment options targeting price-sensitive smaller Oceania print shops, alongside growing direct-to-garment specialists expanding their regional distributor presence that could eventually reshape which suppliers lead the fastest-growing on-demand apparel equipment segment specifically.
oceania-digital-textile-printer-market-company-positioning-matrix-1787308067701

Competitive Moat and Risk Dimensions

MIMAKI ENGINEERING CO., LTD.

Moat: Broad Multi-Technology Printer Portfolio

Mimaki maintains a broad multi-technology digital textile printer portfolio spanning sublimation, direct-to-fabric, and pigment applications alongside established Oceania distributor relationships built over many years, giving it product breadth and regional market access that narrower competitors would need years of comparable investment to replicate.
MIMAKI ENGINEERING CO., LTD.

Risk: Currency Fluctuation Export Pricing Risk

Mimaki faces meaningful exposure to Japanese yen currency fluctuation affecting export pricing competitiveness into Oceania and other international markets, and continued currency volatility could meaningfully affect the company's price positioning relative to competitors manufacturing in other currency zones.
KORNIT DIGITAL LTD.

Moat: Proprietary Single-Step Pigment Technology

Kornit benefits from proprietary single-step pigment printing technology and dominant direct-to-garment market positioning built through sustained research and development investment, giving it technical differentiation in the fastest-growing segment that competitors relying on conventional multi-step printing processes cannot easily replicate.
KORNIT DIGITAL LTD.

Risk: Premium Pricing Market Penetration Risk

Kornit faces meaningful exposure to premium pricing positioning that limits penetration among cost-sensitive smaller Oceania textile printing operations, and continued price sensitivity among smaller regional print shops could meaningfully constrain the company's addressable market relative to more accessibly priced competitors.

Players Tracked

Prominent Players

Mimaki Engineering Co., Ltd.
Epson Corporation
Kornit Digital Ltd.
EFI Reggiani S.p.A.
Konica Minolta, Inc.

Other Key Players

Durst Group AG
MS Printing Solutions S.p.A.
Roland DG Corporation
Brother Industries Ltd.
HP Inc.
Mutoh Holdings Co., Ltd.
ColorJet Group
DGI Co., Ltd.
SPGPrints B.V.
Zimmer Maschinenbau GmbH
J-Teck3 S.r.l.
Hangzhou Honghua Digital Technology Stock Co., Ltd.
Aeoon Technologies GmbH
Xennia Technology Ltd.
Ricoh Company, Ltd.

Recent Developments

MARCH 2026

Mimaki Expands Australian Distributor Service Network

Mimaki announced an expanded distributor service network agreement covering additional regional Australian territories, broadening technician coverage and parts inventory availability to reduce equipment service response times across the country's more remote printing markets.
Signal: Reflects continued manufacturer investment
OCTOBER 2025

Kornit Digital Launches New Zealand Financing Partnership

Kornit Digital established a new equipment financing partnership with a regional New Zealand lender, offering leasing arrangements specifically designed for smaller print shop operators seeking direct-to-garment equipment without substantial upfront capital investment.
Signal: Indicates growing supplier investment in f
JANUARY 2026

EFI Reggiani Signs Distribution Agreement With Australian Partner

EFI Reggiani signed a multi-year distribution agreement with a major Australian industrial equipment distributor, expanding its direct-to-fabric printer availability across the country's textile manufacturing sector under newly established regional support terms.
Signal: Signals continued European manufacturer in

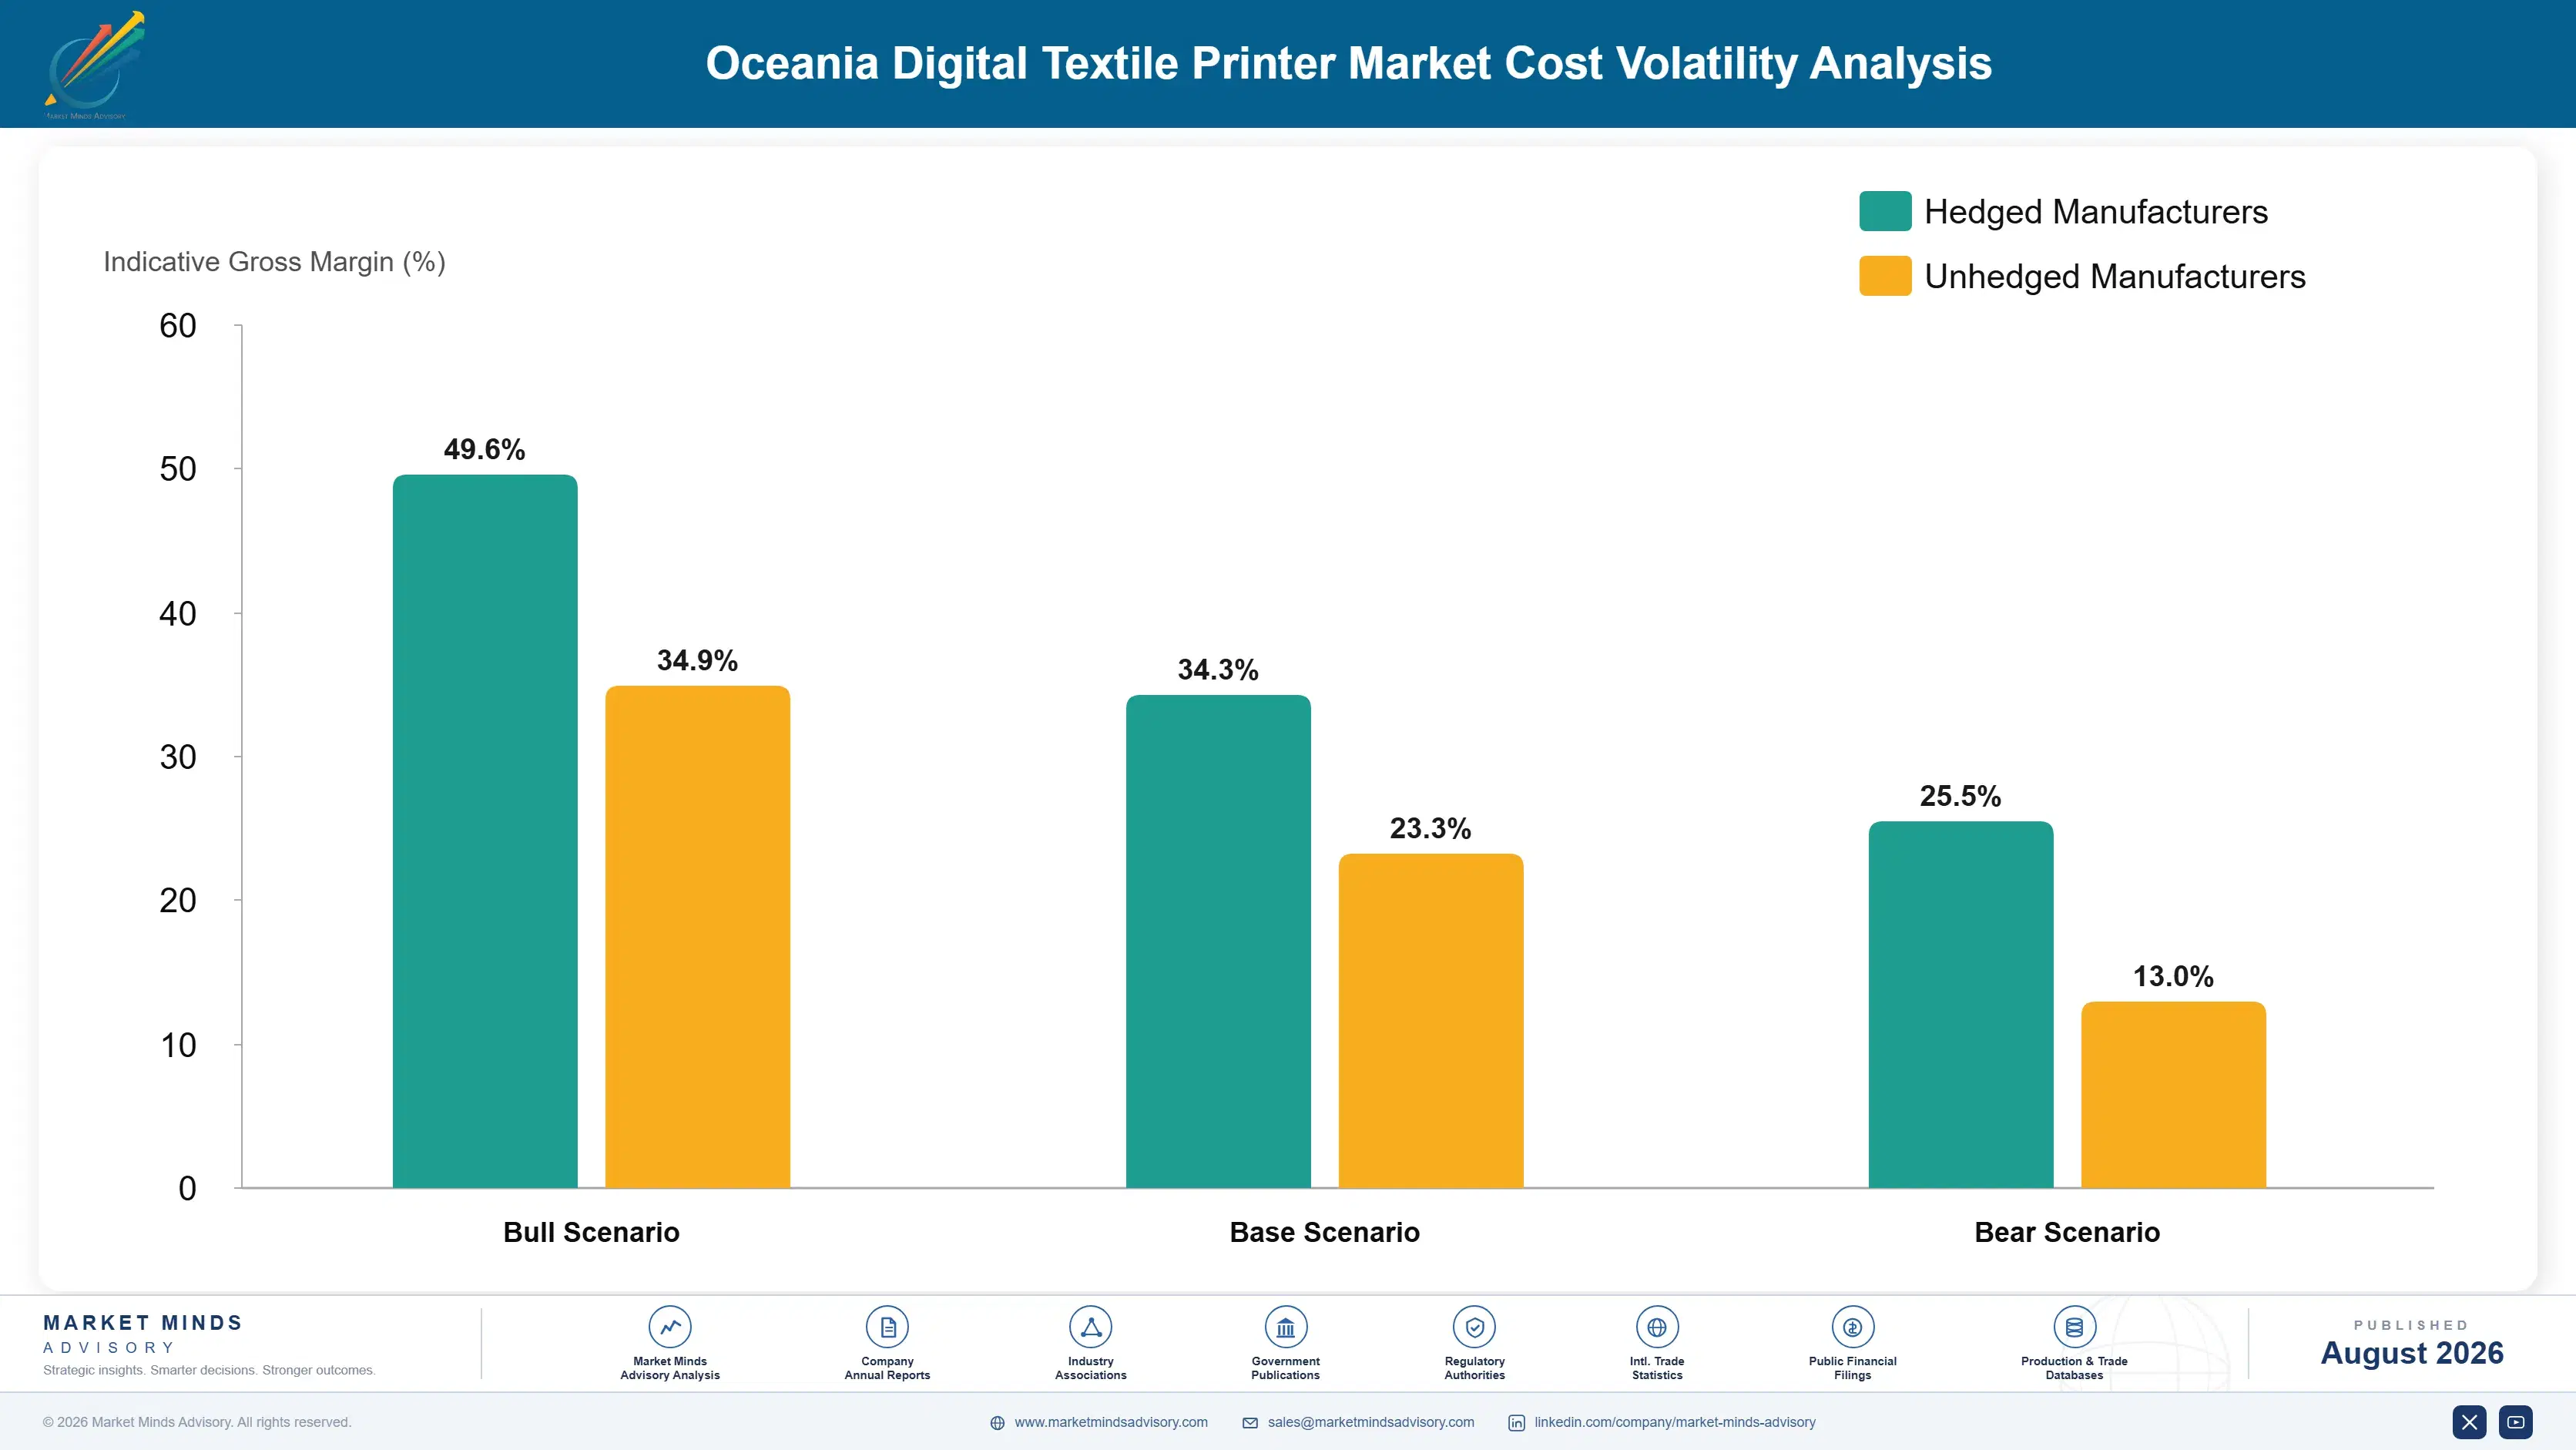
Print Head Components and Import Logistics Exposure

Precision print head components, specialized ink formulations, and international freight and import duty costs together represent roughly 49% of landed cost of goods sold for equipment reaching Oceania customers, with print head components sourced from a concentrated group of specialized electronics manufacturers serving the broader digital printing industry.
International freight and shipping costs rose meaningfully during 2021 and 2022 amid broader global logistics disruption, with company annual reports from major manufacturers confirming elevated shipping costs to Oceania markets persisted through much of 2022 before moderating gradually through 2023 and 2024 as global freight markets stabilized.

Suppliers without established regional distribution infrastructure or consolidated freight arrangements face materially higher landed cost exposure and longer delivery timelines than better-capitalized competitors, creating a durable cost and reliability advantage for larger companies able to invest in dedicated regional logistics infrastructure.
oceania-digital-textile-printer-market-cost-volatility-analysis-1787308067899

Consolidated Regional Freight and Logistics Arrangements

Larger suppliers are negotiating consolidated freight and logistics arrangements specifically for Oceania shipments, reducing per-unit shipping costs and improving delivery reliability compared to smaller competitors shipping individual orders without comparable volume-based freight negotiating leverage.

Regional Parts and Component Inventory Investment

Suppliers are investing in regional parts and component inventory warehousing across major Oceania distribution hubs, reducing equipment downtime and service delays that customers previously experienced waiting for components shipped from distant manufacturing locations.

Local Currency Hedging and Pricing Strategy

Suppliers are implementing currency hedging programmes and localized pricing strategies that reduce exposure to exchange rate volatility affecting equipment landed costs, stabilizing pricing predictability for Oceania customers and distributor partners across multi-year purchasing cycles.

Portfolio Architecture for Margin Defence

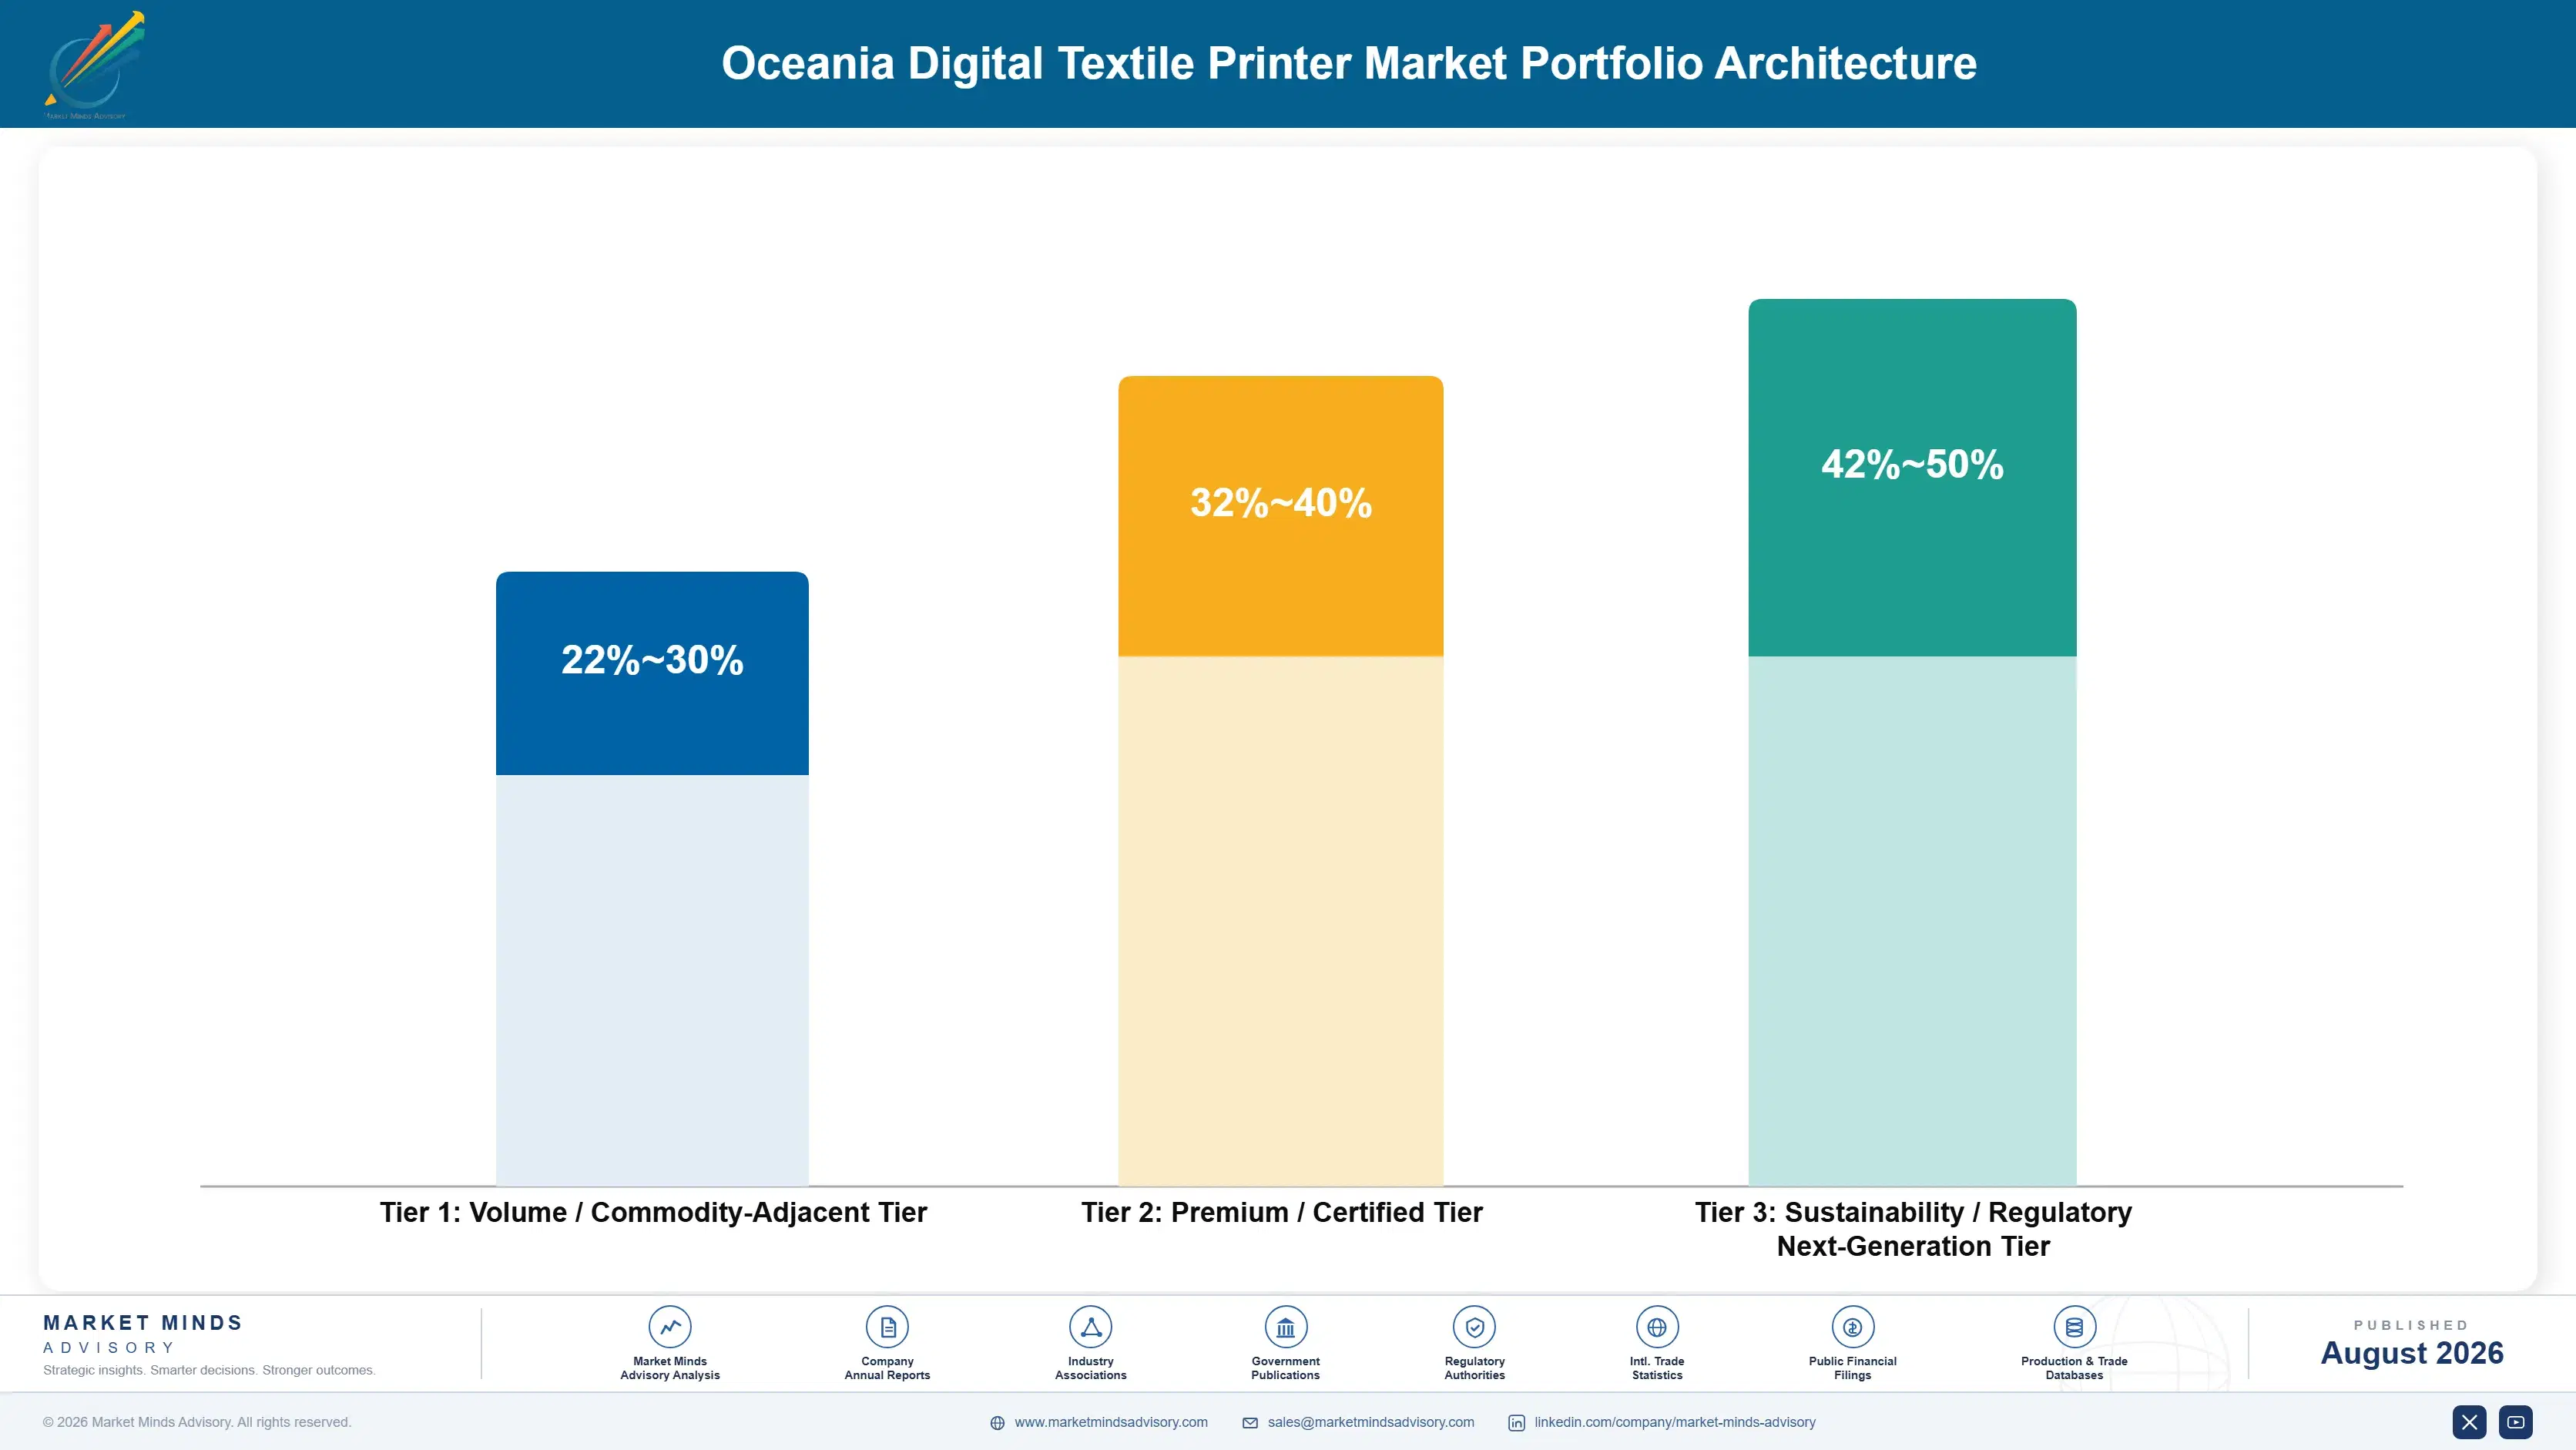
This market organizes into three commercial tiers spanning entry-level direct-to-garment systems at the volume end, standard direct-to-fabric industrial systems in the middle tier, and premium sublimation and specialty equipment capturing the strongest margins at the top of the portfolio architecture given technical sophistication.
Entry-level and premium tiers pull suppliers in genuinely different directions: entry-level systems sustain broad small print shop distribution at moderate margins, while premium industrial systems deliver materially stronger margins that increasingly fund the service network and financing investment this geographically challenging market requires.

The highest-value pools concentrate around premium sublimation and specialty direct-to-garment systems sold to established textile manufacturing operations, where technical sophistication and comprehensive service support together sustain premium pricing power that entry-level equipment simply cannot match across comparable regional distribution volume.

Volume / Commodity-Adjacent Tier

Entry-level direct-to-garment systems sold to smaller print shops and on-demand apparel businesses across most Oceania markets broadly.
Gross Margin: 22-30%

Premium / Certified Tier

Standard direct-to-fabric industrial systems sold under moderate technical support to established regional textile printing operations.
Gross Margin: 32-40%

Sustainability / Regulatory / Next-Generation Tier

Premium sublimation and specialty equipment commanding the strongest technical sophistication premium available across the region.
Gross Margin: 42-50%
oceania-digital-textile-printer-market-portfolio-architecture-1787308068400

High-value Sub-segments and Strategic Watch-out

Direct-to-Garment (DTG) Digital Printers

The fastest-growing and highest-volume-growth segment, combining strong on-demand apparel momentum with genuine smaller print shop willingness to adopt accessible entry-level equipment broadly.
Gross Margin: 22-30%

Pigment Ink Digital Printers

Strong growth and steady margins driven by operational simplicity that sustains demand even during broader economic softness affecting more discretionary equipment upgrade decisions.
Gross Margin: 30-38%

Direct-to-Fabric Digital Printers

The volume core segment sustaining broad industrial textile printing distribution even as newer formats increasingly capture disproportionate category growth overall nationally.
Gross Margin: 32-40%

Reactive Dye Digital Printers

A strategic watch-out segment facing moderate growth pressure, requiring suppliers to defend volume against simpler pigment ink alternatives gaining broader operator preference.
Gross Margin: 28-36%

Service-Anchored Equipment Renewal Streams

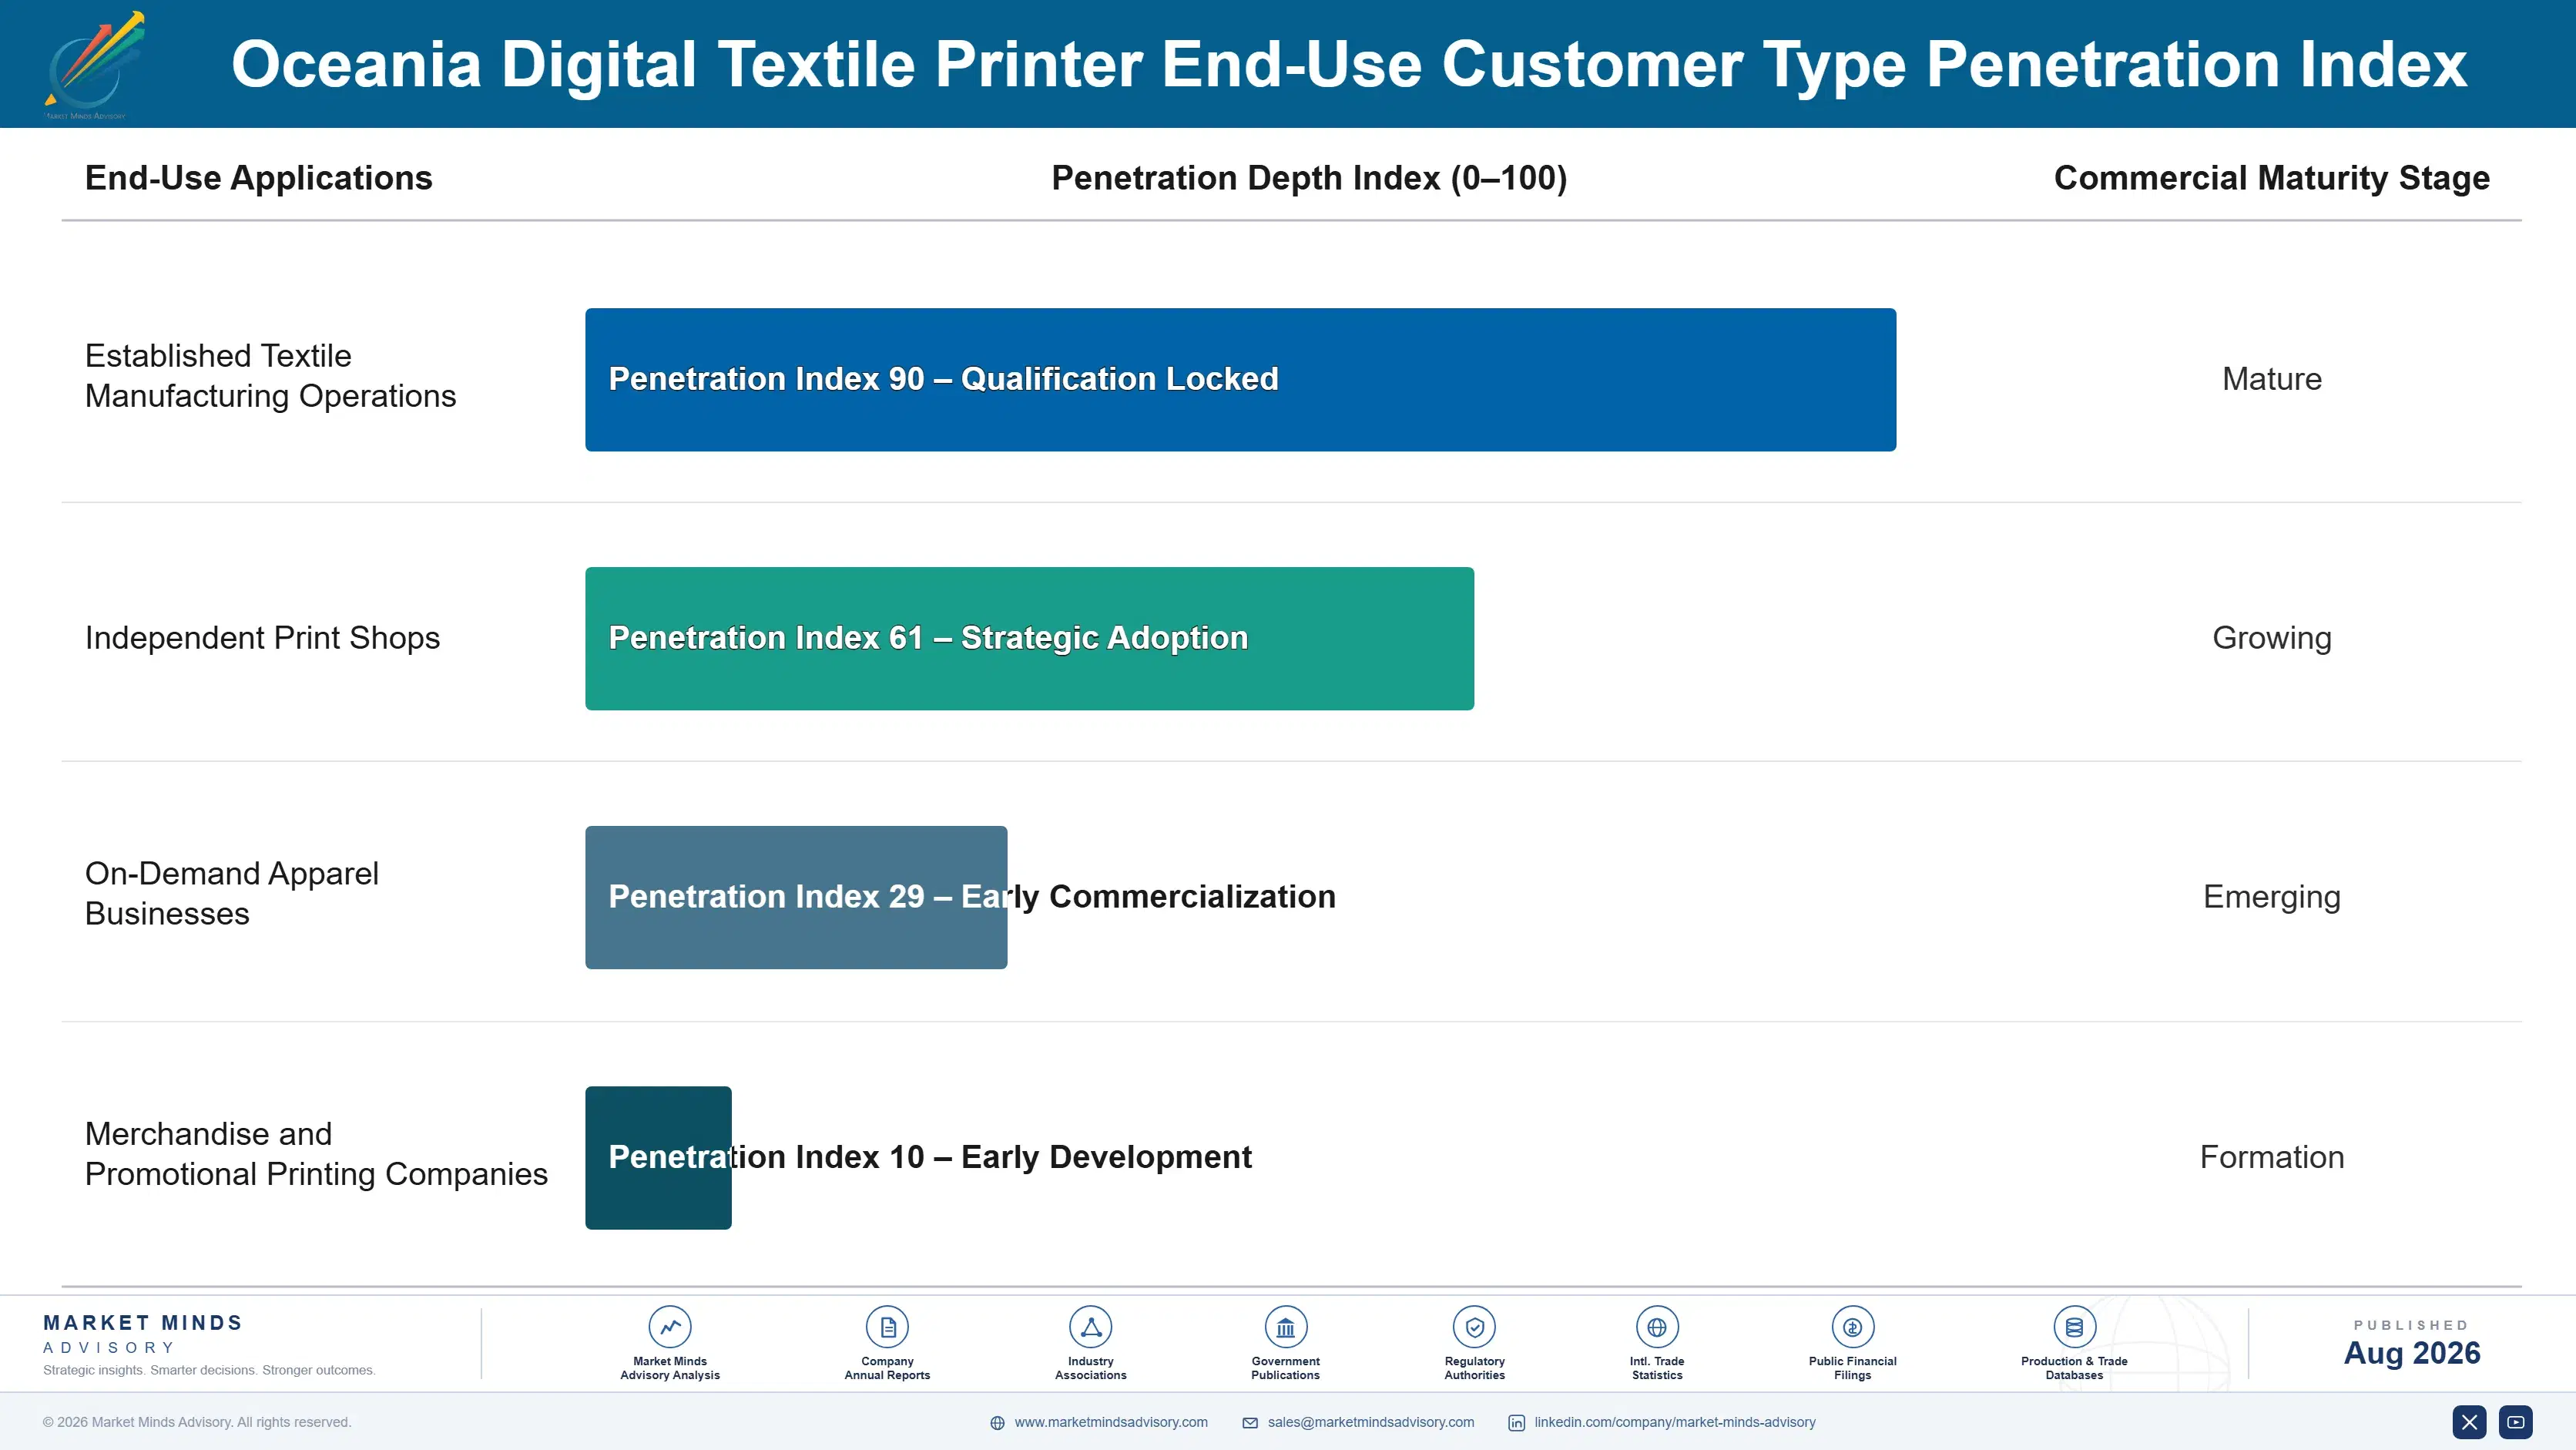
Winning an equipment sale with a reliable local service commitment functions as an annuity anchor across the equipment's operational lifespan: securing customer trust generates recurring consumables, parts, and eventual replacement equipment sales throughout years of continued operation, and losing that trust through unreliable service can eliminate a supplier's relationship with that print shop almost entirely within a single service failure affecting broader multi-year customer relationships.
Adoption depth varies considerably by customer size: larger established textile manufacturing operations adopt premium industrial systems earliest given clear production volume return on investment, while smaller independent print shops more often start with entry-level direct-to-garment systems before potentially upgrading as their business volume grows, a pattern that continues shifting gradually as financing access and service confidence accumulate across most Oceania printing markets broadly.

A generational shift is underway as younger print shop owners raised on digital and on-demand business models enter the industry expecting digital printing capability as standard equipment consideration, gradually normalizing a category that older print shop operators historically associated almost entirely with conventional screen printing methods, a shift suppliers slow to recognize risk finding themselves increasingly disconnected from where purchasing decision-making is heading.
oceania-digital-textile-printer-market-end-use-penetration-index-1787308068891

Where Oceania Printer Economics Are Heading

These are among the four positions where our research anticipates prominent divergence between winners and laggards over the coming forecast period. Each is grounded in the demand model, the regulatory perimeter, and the announced capacity pipeline.
01 / LOCAL SERVICE INVESTMENT

Regional service networks will separate trusted leaders from distant suppliers

Suppliers investing in local distributor service networks are capturing disproportionate share of the fastest-growing customer segments, where reliable regional support increasingly determines customer purchasing confidence over pure equipment specifications alone. Companies without meaningful service investment risk losing customer trust to competitors with established local presence despite comparable equipment capability. Expect local service network depth to become the single most important competitive differentiator for suppliers seeking sustainable positioning through the coming decade.
02 / DIRECT-TO-GARMENT EXPANSION RACE

Entry-level product lines will determine smaller shop segment leadership

Suppliers expanding direct-to-garment product lines targeting smaller print shops are capturing disproportionate share of the fastest-growing on-demand apparel segment, where accessible pricing and entry-level positioning increasingly determine which suppliers reach smaller regional operators over premium-only competitors. Companies without meaningful entry-level investment risk missing this genuinely growing customer segment entirely. Expect entry-level product line depth to become an increasingly important determinant of smaller shop segment leadership.
03 / FINANCING PARTNERSHIP ADVANTAGE

Equipment financing will unlock previously inaccessible customer segments

Suppliers developing financing and leasing partnerships are unlocking genuinely new customer segments among smaller Oceania print operators previously unable to purchase equipment outright, and this advantage compounds further as more regional lenders develop familiarity with digital printing equipment financing arrangements. Companies without meaningful financing partnership capability face a persistently smaller addressable customer base regardless of equipment quality. Expect financing partnership depth to become an increasingly important determinant of market penetration success.
04 / MANUFACTURING ORIGIN SHIFT

Equipment financing will open previously inaccessible customer segments

Continued Chinese manufacturer entry with more accessibly priced equipment options is steadily pulling price-sensitive smaller Oceania print shop demand toward these alternatives, reflecting genuine cost advantages that established Japanese and European suppliers increasingly must address through their own entry-level product development. This trajectory shows no sign of reversing given sustained Chinese manufacturing investment and improving product quality. Expect Chinese-origin equipment share to continue expanding meaningfully throughout the current forecast period across Oceania's price-sensitive customer segments.

Engagement Snapshot From the Field

A live engagement with an industry participant carrying material or product regulatory and market exposure ahead of a defining policy shift, showing how our research translates into a defensible multi-year portfolio strategy.
MARKET MINDS ADVISORY · CLIENT ENGAGEMENT SUMMARY
Oceania Digital Textile Printer Producer Strategic Portfolio Review and Transition Roadmap 2026·Investment Scenario on Oceania Digital Textile Printer Exposure Evaluation 2025-26
CLIENT PROFILE
The client is a mid-sized digital textile printer distributor generating projected annual revenue of approximately $28 million (client-reported, unverified by MMA) upon successful service network expansion. Leadership sought guidance on prioritizing regional service infrastructure investment ahead of a multi-year distribution territory expansion plan across additional Australian states.
STRATEGIC CHALLENGE
The client had historically concentrated service capability in major metropolitan areas, and leadership was uncertain whether expanding technician coverage into more remote regional territories would generate sufficient additional equipment sales to justify the substantial ongoing service infrastructure investment required.
MMA APPROACH
MMA's team benchmarked comparable distributor regional expansion strategies, modeled projected equipment sales growth and service cost under various territory expansion scenarios, and assessed the client's existing customer portfolio for regional demand concentration and service response time sensitivity specifically.
KEY FINDINGS
  1. Regional territories with the longest existing service response times showed the strongest suppressed demand, suggesting meaningful pent-up equipment sales opportunity once service capability improved.
  2. Comparable distributors that expanded regional service coverage achieved meaningfully higher equipment sales conversion rates within the newly served territories compared to their existing metropolitan baseline.
  3. The client's existing technician training programme required only moderate expansion to support additional regional coverage, reducing projected investment considerably compared to building entirely new training infrastructure.
  4. A phased territory expansion strategy targeting the highest-suppressed-demand regions first reduced projected investment risk considerably compared to pursuing comprehensive regional expansion simultaneously.
CLIENT PROFILE
The client is a mid-sized digital textile printer distributor generating projected annual revenue of approximately $28 million (client-reported, unverified by MMA) upon successful service network expansion. Leadership sought guidance on prioritizing regional service infrastructure investment ahead of a multi-year distribution territory expansion plan across additional Australian states.
STRATEGIC CHALLENGE
The client had historically concentrated service capability in major metropolitan areas, and leadership was uncertain whether expanding technician coverage into more remote regional territories would generate sufficient additional equipment sales to justify the substantial ongoing service infrastructure investment required.
MMA APPROACH
MMA's team benchmarked comparable distributor regional expansion strategies, modeled projected equipment sales growth and service cost under various territory expansion scenarios, and assessed the client's existing customer portfolio for regional demand concentration and service response time sensitivity specifically.
KEY FINDINGS
  1. Regional territories with the longest existing service response times showed the strongest suppressed demand, suggesting meaningful pent-up equipment sales opportunity once service capability improved.
  2. Comparable distributors that expanded regional service coverage achieved meaningfully higher equipment sales conversion rates within the newly served territories compared to their existing metropolitan baseline.
  3. The client's existing technician training programme required only moderate expansion to support additional regional coverage, reducing projected investment considerably compared to building entirely new training infrastructure.
  4. A phased territory expansion strategy targeting the highest-suppressed-demand regions first reduced projected investment risk considerably compared to pursuing comprehensive regional expansion simultaneously.
RECOMMENDED STRATEGY
Phase 1: Phase 1 (Months 1-7): Expand technician coverage into the client's two highest-suppressed-demand regional territories first. Phase 2: Phase 2 (Months 8-15): Launch targeted equipment sales campaigns leveraging newly improved regional service capability. Phase 3: Phase 3 (Months 16-24): Expand service coverage to additional territories based on initial results and demand growth.
OUTCOME
The client expanded its regional service coverage and launched targeted sales campaigns within the recommended timeline, reporting equipment sales growth consistent with initial modeling projections during the following two fiscal years (client-reported, unverified by MMA).

Frequently Asked Questions

Foundational context covering the market sizes, CAGR, scope, country, region and competition that inform every finding below. This section is provided to cover basics and most often pre-purchase conversations, answered from the MMA Primary Research Dataset.

What is the current size of the Oceania Digital Textile Printer Market?

The market was valued at approximately $0.2 billion in 2025. This includes direct-to-fabric, direct-to-garment, and sublimation printer equipment sold across Oceania.

How large will the Oceania Digital Textile Printer Market be by 2036?

The market is projected to reach approximately $0.53 billion by 2036, up from about $0.22 billion in 2026. This reflects strong on-demand apparel demand growth.

What is the CAGR for the Oceania Digital Textile Printer Market 2026 to 2036?

The market is expected to grow at a compound annual growth rate of 9.2% between 2026 and 2036. This reflects expanding direct-to-garment adoption and equipment replacement.

Which segment is growing fastest?

Direct-to-garment digital printers are the fastest-growing segment, expanding at approximately 13.5% annually. This reflects strong on-demand apparel customization demand growth.

Who are the major companies in the Oceania Digital Textile Printer Market?

Leading companies include Mimaki, Epson, Kornit Digital, EFI Reggiani, and Konica Minolta. Together they account for roughly 52% of regional category spending.

Which country is growing fastest?

New Zealand is the fastest-growing major country at an estimated 10.8% CAGR, driven by expanding on-demand apparel businesses and equipment replacement cycles.

Report Segmentation Architecture

The full report scope spans multiple orthogonal segmentation dimensions, with cross-tabulated demand data provided for each dimension pair. Coverage extends further to regional breakdowns, trend trajectories, and the competitive detail needed to support segment-level decision-making.

By Printing Technology

  • Direct-to-Fabric Digital Printers
  • Direct-to-Garment Digital Printers
  • Dye-Sublimation Digital Printers
  • Reactive Dye Digital Printers
  • Pigment Ink Digital Printers
  • Acid Dye Digital Printers

By End-Use Customer Type

  • Established Textile Manufacturing Operations
  • Independent Print Shops
  • On-Demand Apparel Businesses
  • Merchandise and Promotional Printing Companies

By Commercial Dimension

  • Direct Manufacturer Distribution
  • Regional Distributor Partnerships
  • Equipment Leasing and Financing Programmes
  • Aftermarket Parts and Service Contracts

By Region

  • North America
  • Western Europe
  • East Asia
  • South Asia and Pacific
  • Latin America
  • Middle East and Africa
  • Eastern Europe

Scope, Methodology, and Coverage

Every figure in this report is reproducible from documented input assumptions. The scope below maps the historical period, the forecast horizon, the segmentation dimensions, and the countries covered, alongside the underlying primary and qualitative methodology.
Historical Period
2020 to 2025
Forecast Period
2026 to 2036
Base Year
2025 (USD billions; MMA Primary Research Dataset, August 2026)
Market Definition
This report covers digital textile printing equipment sold and installed across Australia, New Zealand, and Pacific Island markets, including direct-to-fabric, direct-to-garment, and dye-sublimation printer technologies. It excludes screen printing equipment, textile finishing machinery, and consumables sold independently of printer hardware.
Quantitative Units
USD billions (current prices); unit shipment volume; average selling price per printer system
Segmentation Dimensions
By Printing Technology; By End-Use Customer Type; By Commercial Dimension; By Region
Regions Covered
North America, Western Europe, East Asia, South Asia and Pacific, Latin America, Middle East and Africa, Eastern Europe
Countries Covered
Australia, New Zealand, Fiji, Papua New Guinea, and additional Pacific Island markets relevant to this sector, alongside supply-origin markets including USA, China, Germany, France, UK, Japan, South Korea, India, Canada, Brazil, Mexico, UAE, Saudi Arabia, South Africa, Turkey, Poland, Netherlands, Italy, Spain, Sweden, Switzerland
Key Companies Profiled
Mimaki Engineering Co., Ltd., Epson Corporation, Kornit Digital Ltd., EFI Reggiani S.p.A., Konica Minolta, Inc., Durst Group AG, MS Printing Solutions S.p.A., Roland DG Corporation, Brother Industries Ltd., HP Inc., Mutoh Holdings Co., Ltd., ColorJet Group, DGI Co., Ltd., SPGPrints B.V., Zimmer Maschinenbau GmbH, J-Teck3 S.r.l., Hangzhou Honghua Digital Technology Stock Co., Ltd., Aeoon Technologies GmbH, Xennia Technology Ltd., Ricoh Company, Ltd.
Quantitative Methodology
Primary survey, n=3,800 respondents, Q4 2025, six countries; demand-side model with trade association cross-validation
Qualitative Methodology
47 expert interviews, Q4 2025; applied to validate demand model assumptions, identify emerging dynamics, and assess competitive positioning
Report Format
PDF and XLSX data workbook (Word format preview document)
Publisher
Market Minds Advisory
Report Code
MMA-2026-TEC-143
Published
August 2026
Contact
sales@marketmindsadvisory.com | www.marketmindsadvisory.com

Purchase the full Oceania Digital Textile Printer Market Report (2026 to 2036).

The full report provides detailed technology-level segmentation, country-level equipment penetration analysis, and channel distribution tracking across Australia, New Zealand, and Pacific Island markets covered in this study. It includes supplier-level competitive benchmarking based on regional service network depth and financing partnership capability. Subscribers receive quarterly updates tracking new distributor agreements and equipment launches as they occur. A companion dataset provides equipment installation estimates by country for detailed market sizing purposes.
Technology-level segmentation breakdown by category
Country-level equipment penetration trend analysis
Distribution channel tracking and benchmarking service
Supplier competitive benchmarking scorecards and overview
Quarterly distributor agreement and launch update service
Equipment installation dataset segmented by country

Built For The People Who Decide

From boardroom strategy to bench-side execution, this report is read cover-to-cover by leaders shaping the next decade of their industry, turning demand scenarios, market dynamics and valuation benchmarks into decisions.
CXOs/ Presidents/ VPs/ Managers
M&A and Corporate Development
Strategy Teams and R&D Heads
Procurement and Product Directors
Regulatory and Compliance Leaders
Investor Relations and Equity Analysts