Market Minds Advisory
Oat-Based Beverage Market

Oat-Based Beverage Market: Barista dependency, the copied process advantage and nutritional reformulation to 2036

This category was built on a functional trick that made the drink foam like dairy, and functional tricks living inside a process are exactly the kind that contract manufacturers learn to copy.

Lead Analyst

Lisa Gevelber

Published

September 2026

Make Smarter Decisions with Customized Research Insights

Request a free sample report and evaluate market opportunities, growth trends, and competitive dynamics relevant to your business needs.

2025 MARKET VALUE$4.4BMarket Size 2025
2036 FORECAST VALUE$9.4BBase Case , 2026 to 2036
CAGR 2026 TO 20367.2 %Bull 8.4% / Bear 6.0%
INCREMENTAL OPPORTUNITY$4.7BNet 10- year value creation
EXPANSION MULTIPLE2.00x2036 value over 2026 base
Strategic Levers
M&A Pipeline
Regional Outlook
Country Rankings
Competitive Intelligence
Segmental Deep-dive
Call-Us : 91 93563 13602

Executive Snapshot and Market Trajectory

Oat drink won on foam. Enzymatic starch conversion gives it the body and steaming behaviour that almond never had, which got it into coffee shops, and coffee shops then drove household trial. That entire advantage lives inside a process, and processes get copied.
They were copied. Contract manufacturers now supply barista-grade oat base to anybody with a brand, and retailer own labels hold 31% of grocery volume as a result. Foodservice still takes 34% of total volume, which ties this category's health to out-of-home coffee traffic far more tightly than most forecasting acknowledges anywhere. Own label tastes close enough that most shoppers cannot justify the premium, and the barrier that funded early brand building has simply gone.
Protein-fortified and functional formulations grow at 10.8%, half again the market rate of 7.2%, and low-sugar variants follow at 8.4%. Both answer the same objection: a standard oat drink carries roughly a third of dairy protein and its enzymatic conversion produces free sugars. Western Europe holds 32% of value, where the category began and per capita consumption remains highest. Standard formulations now compete in the slowest part of the category.
Market Definition
This report covers oat-based drinking beverages sold through retail and foodservice channels, spanning barista and foodservice formulations, standard retail ambient, chilled fresh retail, protein-fortified and functional, flavoured and ready-to-drink, and unsweetened and low-sugar formulations. Value is measured at manufacturer level across retail and foodservice sales. Excluded are oat-based yoghurt, ice cream, cream and cooking alternatives, oat flour and flakes sold as ingredients, blended beverages where oat is a minor component, and enzymes or oat base concentrate sold business to business.
Base Year Value
$4.4B in 2025 (MMA Primary Research Dataset, August 2026)
Forecast Period
2026 to 2036, eleven discrete annual values
CAGR
7.2% base case. Bull 8.4%. Bear 6.0%.
Fastest Growth Segment
Protein-Fortified and Functional: 10.8% CAGR
Fastest Growth Country
China: 10.4% CAGR
Fastest Growth Region
South Asia and Pacific: 9.2% CAGR
Largest Region
Western Europe: 32% of 2025 global value
Market Leaders
Oatly, Danone, Califia Farms, Minor Figures and Yili Group lead the market. Source: MMA Primary Research Dataset, July 2026.
Primary Survey
n=3,800 procurement and R&D decision-makers, Q4 2025, six countries
Methodology
Demand-side build-up, cross-validated against public data, 47 expert interviews

Oat-Based Beverage Market Forecast Scenarios

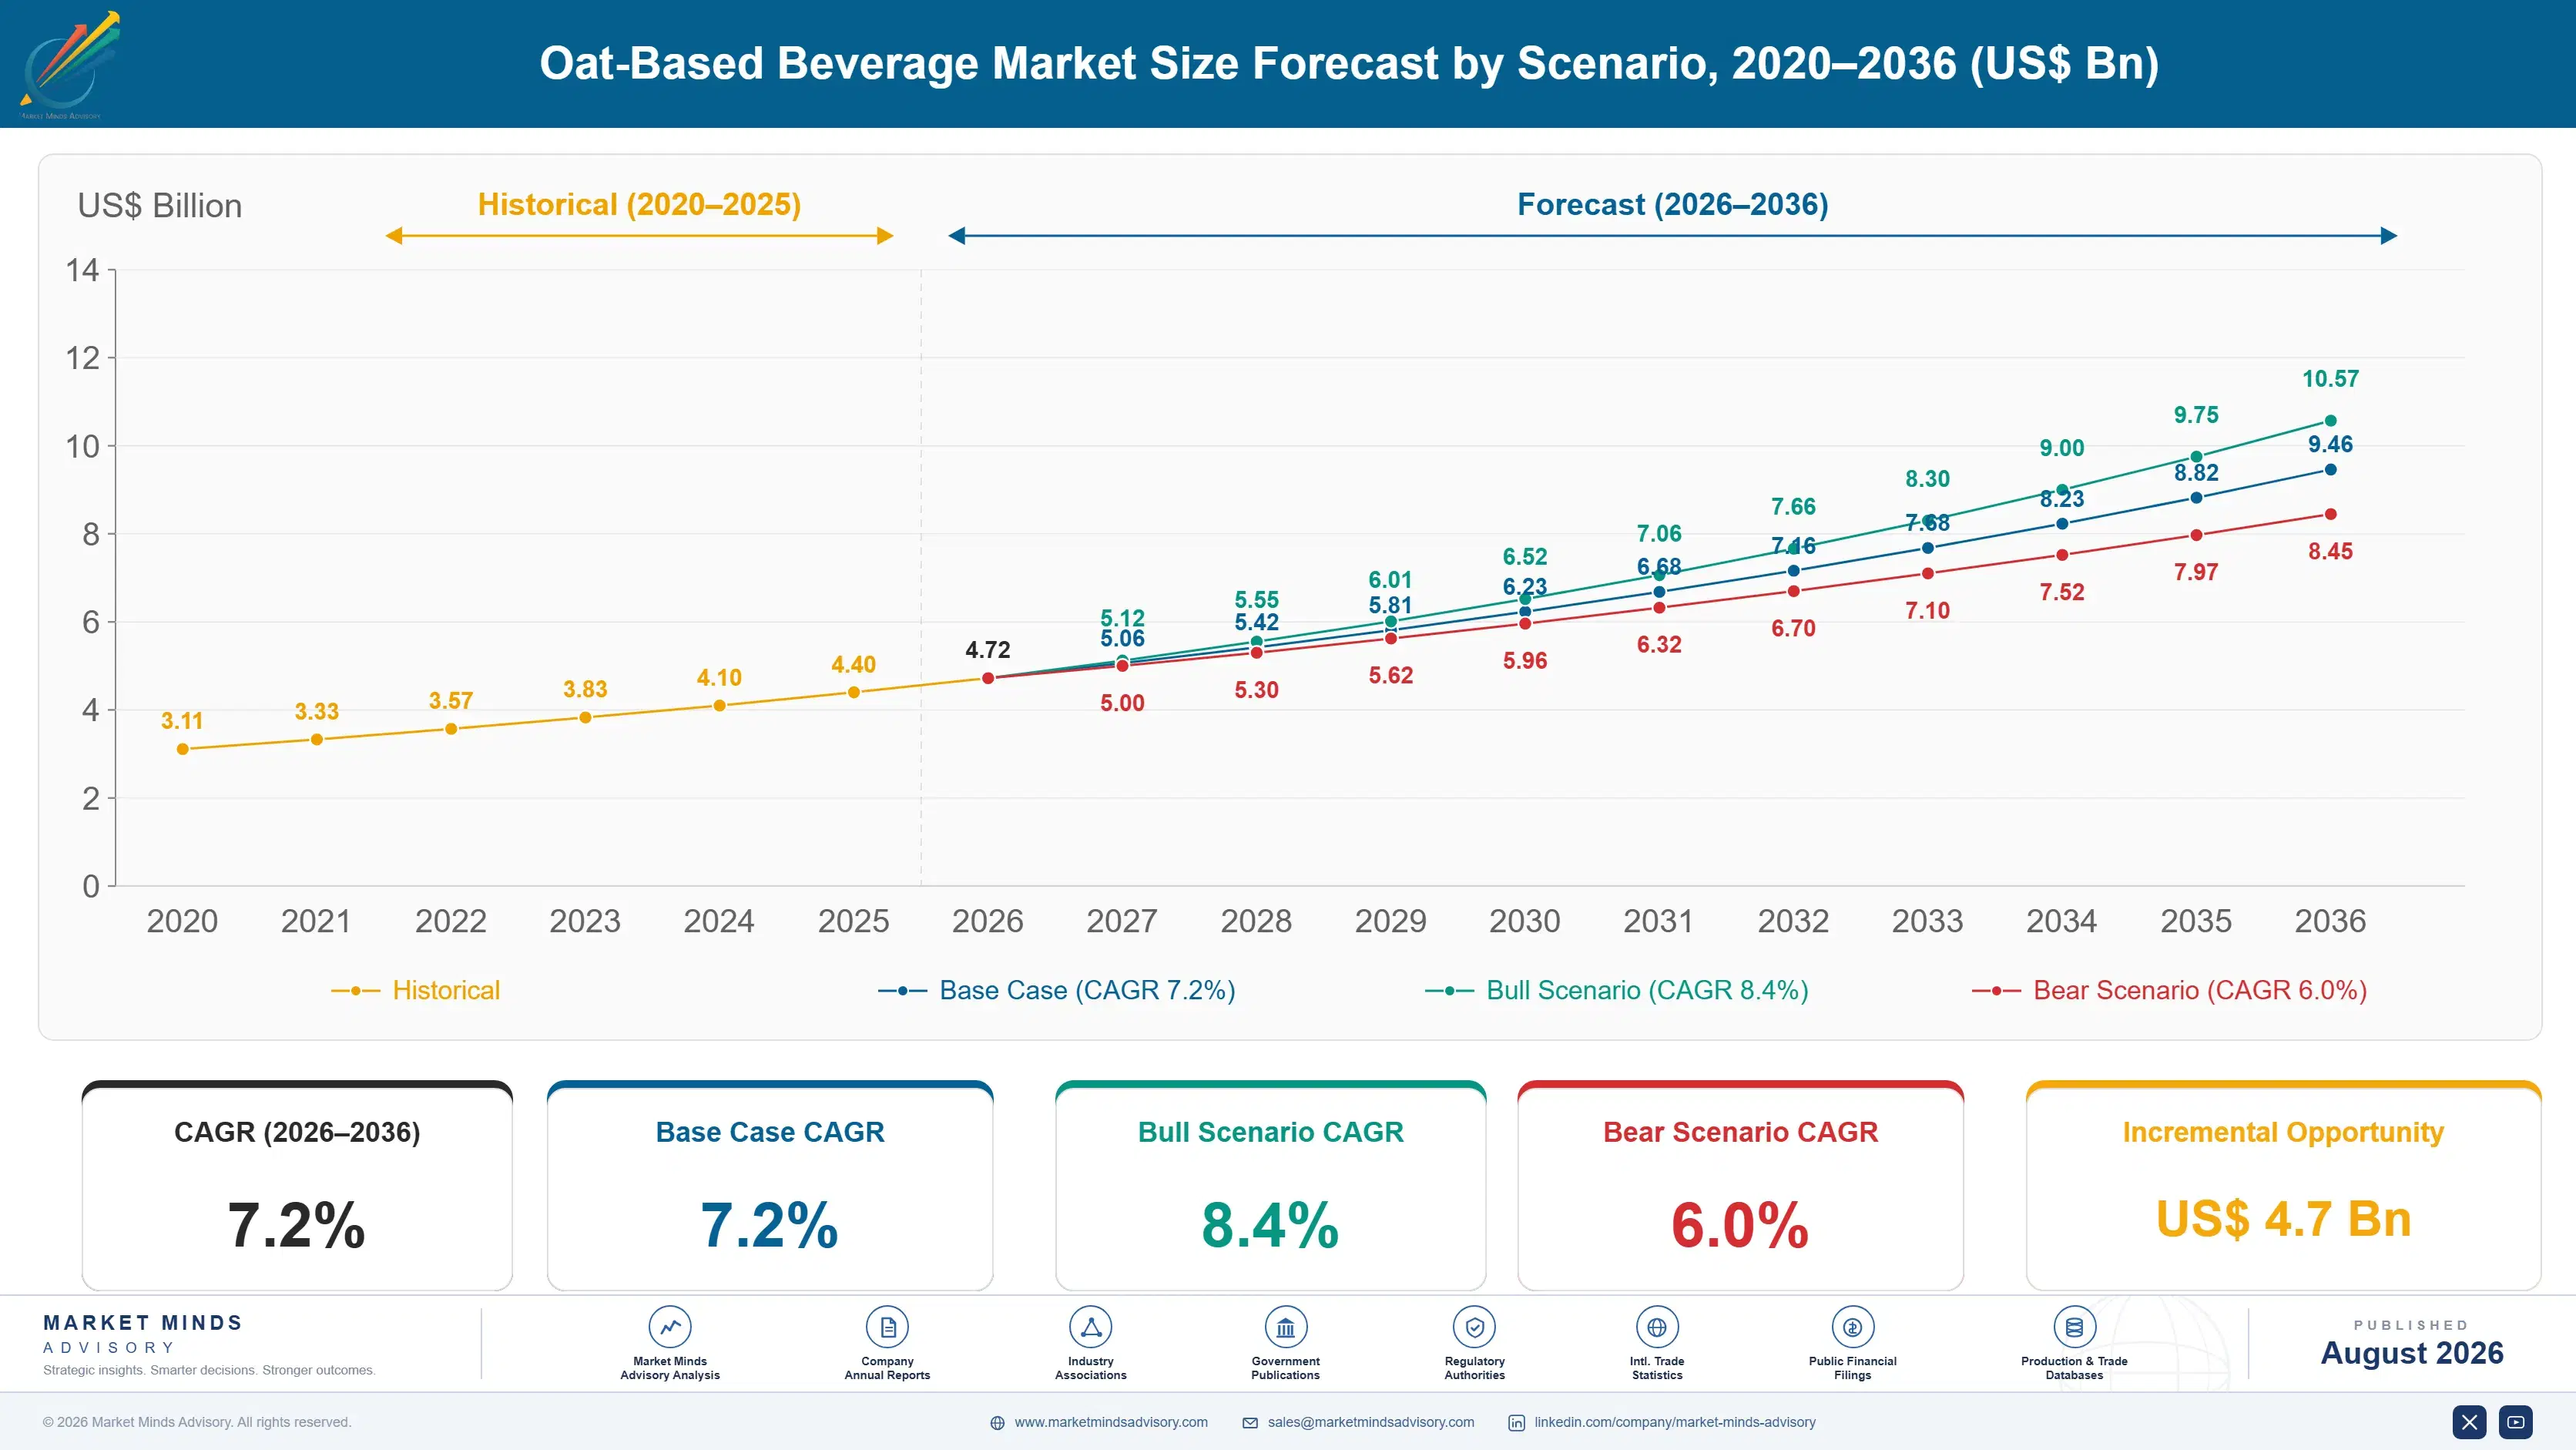
oat-based-beverage-market-trends-forecast-size-forecast-scenario-1787559359210
Growth ran at 12.6% between 2020 and 2025, and quoting that number without qualification badly misleads anybody planning against it. The early part of the period saw the category expand at rates no packaged food business sustains, driven by coffee shop adoption and heavy brand investment. Growth then decelerated sharply from 2023 as private label entered, capacity became widely available and the land-grab phase simply ended.
The 7.2% base case reflects a category that now behaves like ordinary packaged food rather than a growth story, and it rests on three mechanisms. Protein-fortified formulations at 10.8% answering the nutritional objection directly. Low-sugar variants at 8.4% addressing the free sugars that enzymatic conversion creates. And Chinese growth at 10.4%, the fastest of any country, on coffee chain expansion introducing oat drink to consumers who never drank dairy. None of those depends on the original recipe.
The 8.4% bull case is reformulated protein and low-sugar variants converting households that rejected the category on nutrition rather than taste. The 6.0% bear case is out-of-home coffee traffic weakening, since foodservice takes 34% of volume and a category this exposed to a single channel does not have a retail base deep enough to absorb the loss.

The Trick That Got Copied

Oat drink beat almond, soy and every other plant milk in coffee for one reason that has nothing to do with marketing. Enzymes hydrolyse the oat starch to a controlled degree, typically around twelve on the dextrose equivalent scale, and the resulting maltose and maltodextrins deliver sweetness without added sugar plus the viscosity and protein-starch behaviour that lets the drink steam and hold microfoam. A barista could make a flat white with it. That property built the category, and it lives in a process rather than a brand.
TOP-FIVE CONCENTRATION42%Combined position across supply held by the leading beverage manufacturers
FOODSERVICE CHANNEL SHARE34%Portion of volume sold through coffee shops and catering
PRIVATE LABEL RETAIL SHARE31%Share of grocery volume carried under retailer own brands
ENZYMATIC CONVERSION LEVEL12 DEDegree of starch breakdown that sets sweetness and body
PROTEIN CONTENT GAP3.2xDairy protein relative to a standard oat drink serving
GLUTEN-FREE OAT PREMIUM26%Cost above conventional oats for dedicated handling and testing
Processes get copied. Contract manufacturers across Europe and North America now supply barista-grade oat base to anybody who wants a brand on a carton, which collapsed the barrier that early entrants had enjoyed. Retailer own labels took 31% of grocery volume, and they taste close enough that most consumers cannot justify the premium. The value in this category has quietly relocated from the brands to the enzyme suppliers, the oat base producers and the co-manufacturers who make it for everybody.
The other number worth watching is channel. Foodservice takes 34% of volume, which is extraordinary for something sold in supermarkets, and it means coffee shop traffic matters more than household penetration does.
"Everyone models this as a dairy alternative competing in the chilled aisle. A third of it is sold to coffee shops, and that is where the category is actually decided. If out-of-home coffee has a bad year, the retail base underneath is nothing like deep enough to hold the numbers up."
Director, Plant-Based Foods and Beverages Practice · MMA Food and Agriculture Ingredients Practice · August 2026

Market Trends

Contract manufacturing collapsed the barista formulation barrier

Barista-grade oat base is now available from contract manufacturers across Europe and North America to anybody who wants to put a brand on a carton, which removed the formulation advantage early entrants had built their positions on. Retailer own labels reached 31% of grocery volume very quickly as a result, and they perform closely enough in a coffee machine that most consumers cannot justify paying a premium. Commercially the value has relocated toward enzyme suppliers, oat base producers and co-manufacturers, who now supply competing brands from identical process lines without any of the marketing cost.
Market Impact: Chinese demand compounds at 10.4%
Nutritional objections drive reformulation toward protein and lower sugar

A standard oat drink carries roughly a third of the protein in dairy and the enzymatic conversion that gives it body also produces free sugars, which nutrition commentary has amplified into a genuine consumer objection rather than a technical footnote. Protein-fortified formulations compound at 10.8% and low-sugar variants at 8.4%, well ahead of the category, because they answer that objection directly. Commercially this is where category growth has moved, and manufacturers still selling only the original formulation are competing in the slowest part of their own market. Contract manufacturers deliver these variants far less uniformly.
Market Impact: Foodservice takes 34% of volume

Market Opportunities and Growth Drivers

Asian coffee chain expansion introduces oat to non-dairy drinkers

Chinese growth at 10.4% leads every country in this market, driven by coffee chain expansion across a population where lactose intolerance is common and dairy was never the default beverage anyway. Oat drink arrives there as the standard coffee milk rather than as a dairy substitute, which is a materially different and considerably easier proposition to sell. Korean, Japanese and Southeast Asian chains follow similar patterns. Regional manufacturers including Yili and Vitasoy hold strong positions built on existing plant beverage capability and distribution reach. Regional distribution reach matters more than brand heritage here.
Market Impact: Growth halved from 12.6%

Coffee shop specification drives retail household trial

The adoption path in this category runs backwards compared with most packaged food. Consumers encountered oat drink in coffee shops, decided they liked it, and then bought it for home, rather than discovering it in a supermarket first. Foodservice accounts for 34% of volume, and brands with strong coffee shop presence consistently outperform in grocery for reasons that have nothing to do with their retail execution. Commercially this makes barista channel investment a marketing expense disguised as a low-margin sales channel. Manufacturers who cut that spending on margin grounds have watched grocery velocity fall afterwards.
Market Impact: Certified oats cost 26% more

Market Restraints and Challenges

Category growth decelerated once the land grab finished

Growth ran at 12.6% across the historical period and has settled to roughly half that, which is what happens when a category completes its expansion phase and begins competing on cost and taste like ordinary packaged food. The root cause is that capacity became widely available while distribution reached saturation in the markets that mattered. Commercially this stranded brands whose valuations and cost structures assumed the earlier rate would continue. Manufacturers are responding by moving into reformulated variants and adjacent formats where growth genuinely remains. Cost structures built on the earlier rate became untenable.
Market Impact: Own label reaches 31% of grocery

Certified gluten-free oat supply carries a real cost premium

Oats are grown in rotation with wheat and handled on shared equipment through most of the supply chain, so gluten-free certification requires dedicated seed, segregated storage, cleaned transport and batch testing throughout. That carries roughly a 26% premium over conventional oats. The root cause is agronomic and logistical rather than anything to do with the oat itself. Commercially it constrains a claim many brands treat as standard, and few outside the industry realise the certified supply is a distinct and considerably smaller pool than the oat crop suggests. The claim on a carton depends on supply somebody had to secure.
Market Impact: Fortified variants compound at 10.8%
4 additional market trends, 3 additional growth drivers, and 2 additional restraints and challenges are covered in the full report. Contact sales@marketmindsadvisory.com to access the complete intelligence.

Segment CAGR and Growth Architecture

Value is classified here by product formulation and format, since the enzymatic conversion level, protein content and channel each differ by what the manufacturer is actually making. Packaging format, sales channel and brand structure are handled separately in the framework below, because a single formulation reaches several channels without any change to its recipe.
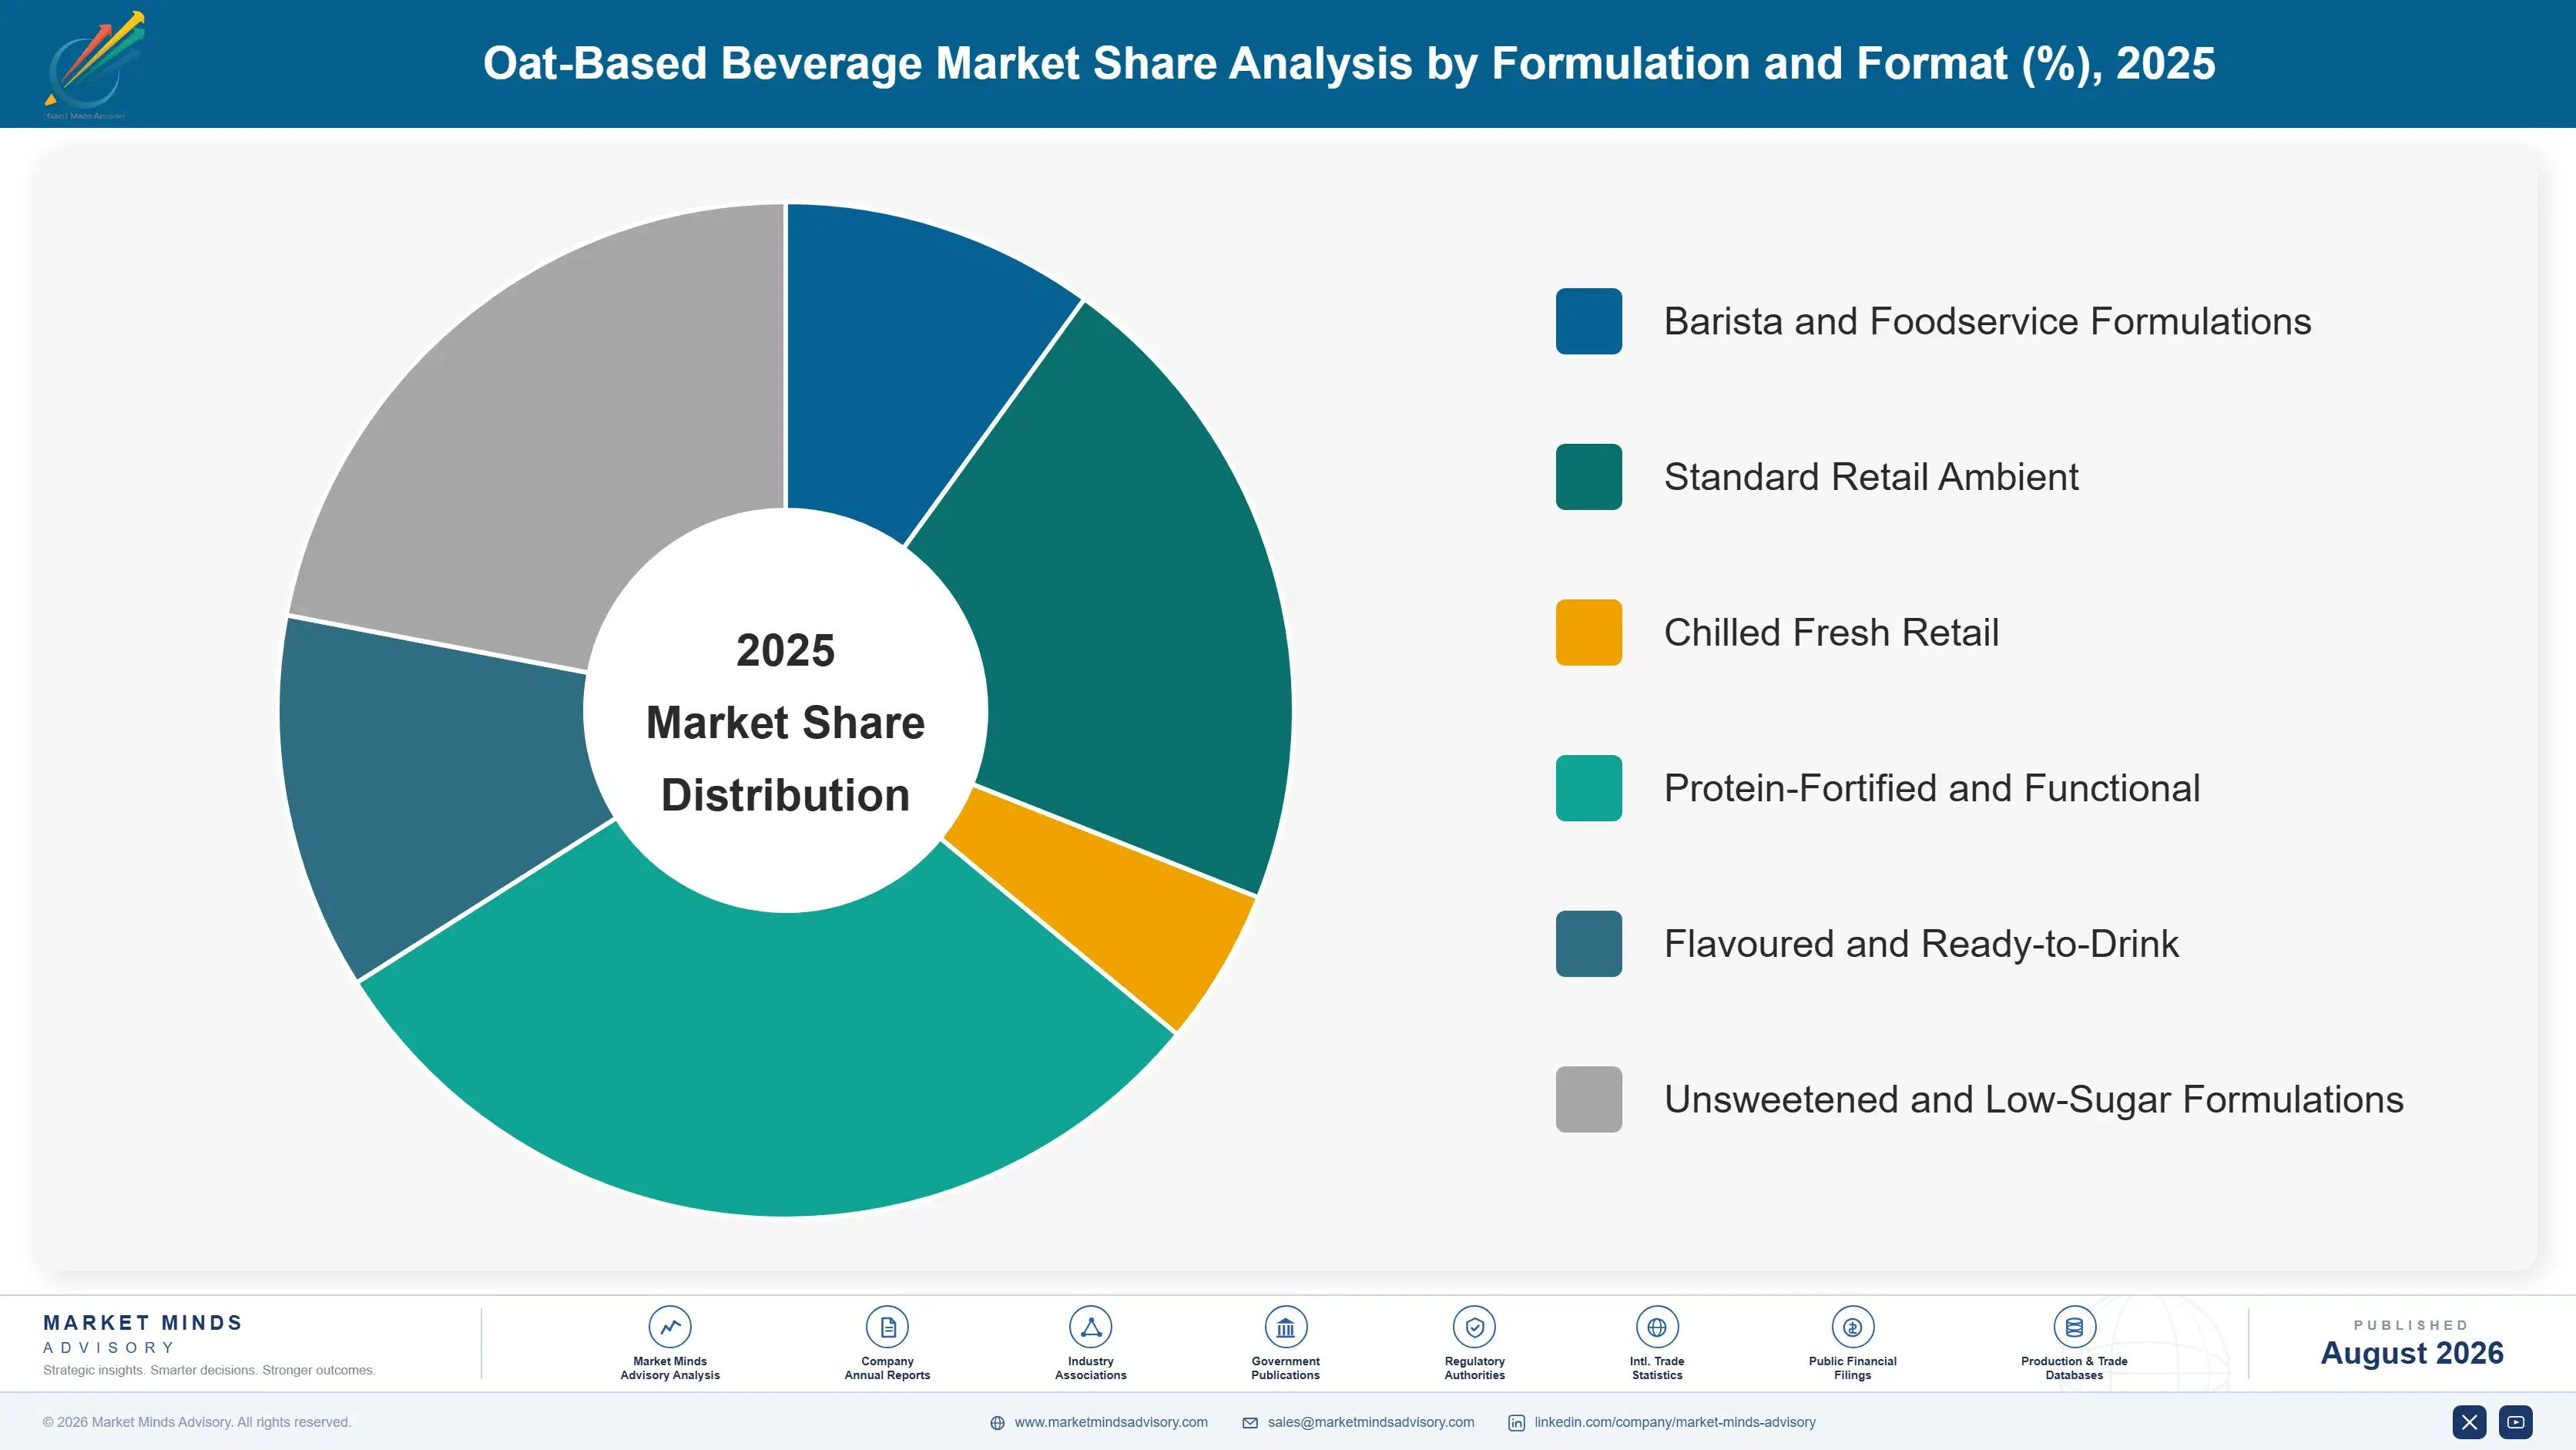
oat-based-beverage-market-trends-forecast-market-share-analysis-1787559359738

Protein-Fortified and Functional

Growing at 10.8%, half again the market rate, protein-fortified and functional formulations answer the objection that has done this category the most damage. A standard oat drink carries roughly a third of the protein in dairy, and nutrition commentary turned that into a mainstream consumer concern rather than a specialist one. Fortification uses pea, faba or added oat protein, each of which brings flavour and stability challenges that the base product never had to solve. Added calcium, vitamin D and B12 have become effectively standard rather than differentiating. This is where category growth has relocated, and it demands formulation capability that contract manufacturers supply less uniformly than they supply barista base.
CAGR 10.8%

Unsweetened and Low-Sugar Formulations

Enzymatic hydrolysis is what gives oat drink its body and its sweetness, and it also generates the free sugars that appear on a nutrition panel and attract criticism the manufacturer cannot easily explain away. Low-sugar formulations reduce the conversion level or remove sugars after hydrolysis, both of which cost body and mouthfeel that the category was built on. Growth at 8.4% reflects genuine demand from consumers who like the product and dislike the label. Getting acceptable texture at low conversion is the technical problem, and the manufacturers who solve it properly hold an advantage that the barista formulation never gave anybody for long. Consumers can taste the difference between a solved problem and a compromised one.
CAGR 8.4%
Full segment breakdown across 6 segments available in the complete report.

Regional Architecture and Country Demand Map

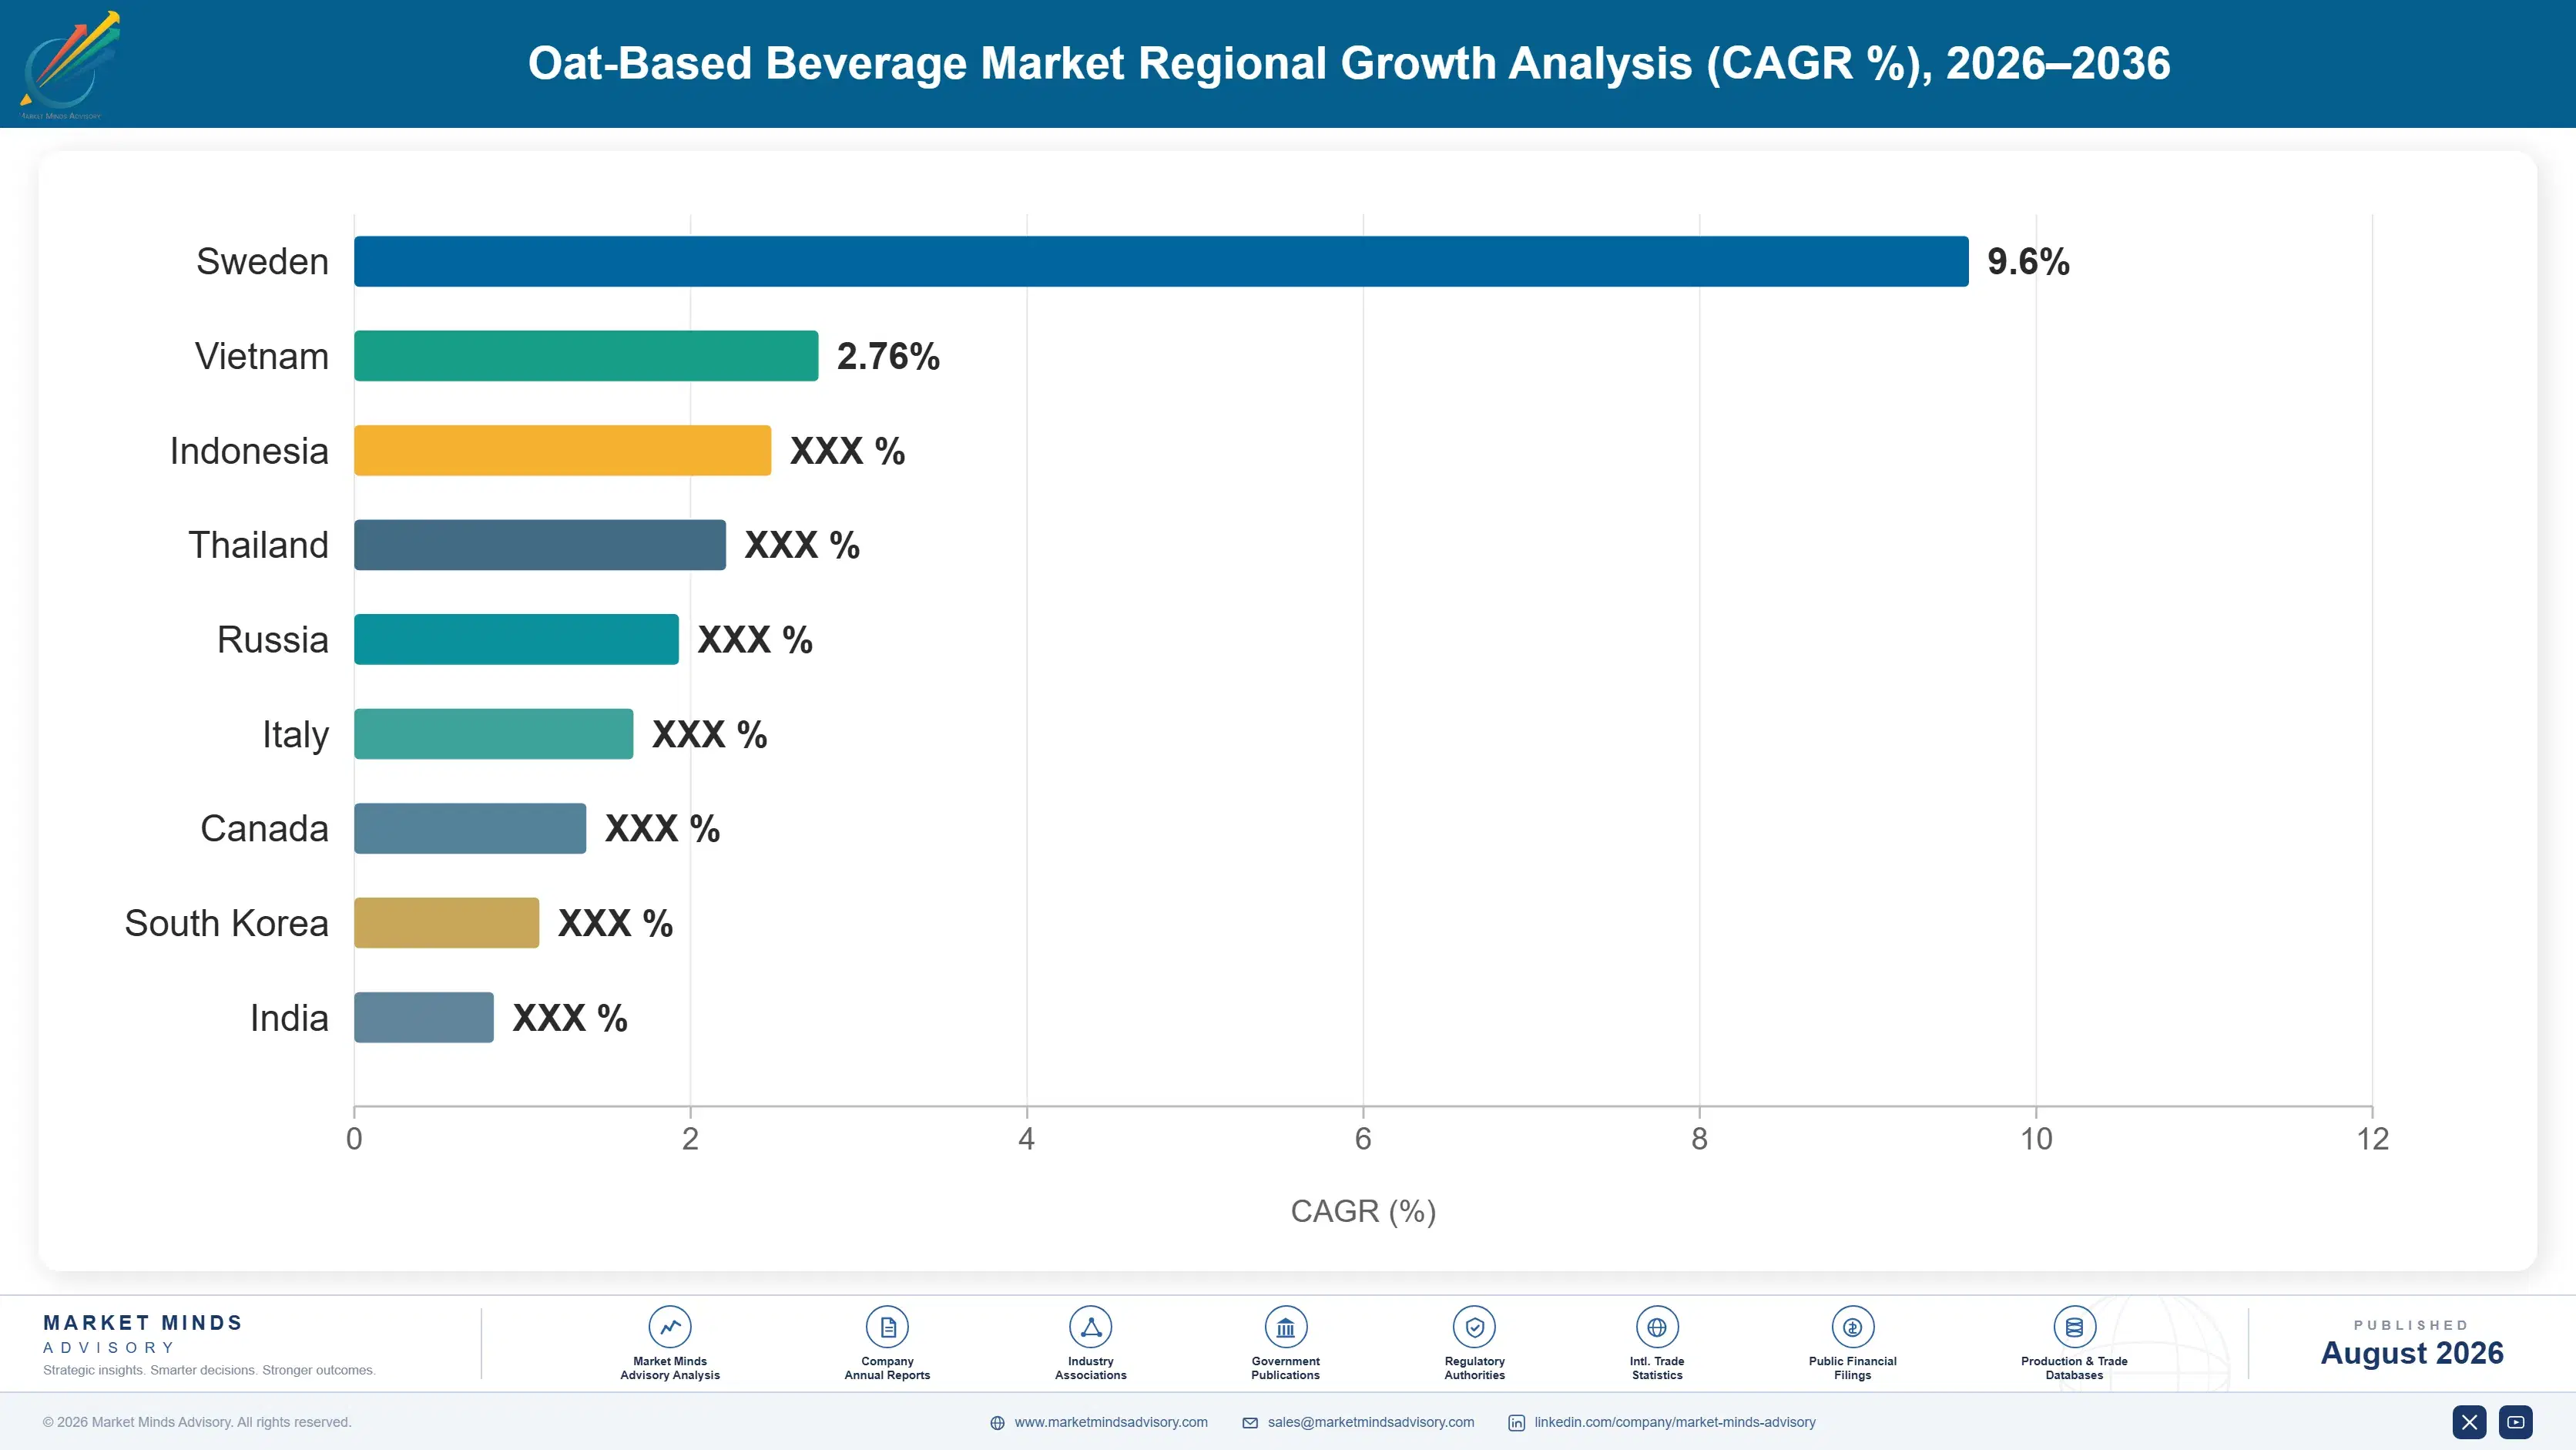
Western Europe holds 32% of value, above the standard band, because the category originated in Sweden and per capita plant beverage consumption across Nordic, British and German markets remains the highest anywhere. North America follows closely at 30% on coffee shop adoption and retail distribution depth.

Western Europe

At 32% this region sits above the standard band and leads the market, because oat drink was invented in Sweden and Nordic, British and German consumers carry the highest per capita plant beverage consumption anywhere. Coffee shop adoption ran furthest and fastest here, and the retail base built behind it is correspondingly deep. Private label penetration is also the most advanced, with retailer own brands holding a substantial share of grocery volume and pricing well below branded equivalents. Nutritional criticism has been loudest in this region too, which is why reformulated variants launched here first. Growth at 5.6% is the weakest on this table and reflects a mature category. Cafe channel relationships run deepest here.
Share: 32% | CAGR: 5.6% (2026 to 2036)

North America

Coffee shop adoption drove the category here almost entirely, with major chain listings converting oat drink from a specialist product into a default option within a few years. Retail distribution followed and is now essentially complete across grocery. Private label entry has been aggressive and branded margins have compressed accordingly. Protein-fortified formulations resonate strongly in a market where protein content is a mainstream purchasing consideration across food categories generally. Domestic oat supply is substantial though certified gluten-free volumes remain constrained. Growth at 6.6% sits below the market rate and reflects a category past its expansion phase. Contract manufacturing capacity is widely available across the region, which is precisely what allowed private label to enter at scale so quickly.
Share: 30% | CAGR: 6.6% (2026 to 2036)
Regional intelligence for 5 additional markets available in the complete report: East Asia, South Asia and Pacific, Latin America, Middle East and Africa, Eastern Europe. Contact sales@marketmindsadvisory.com.
oat-based-beverage-market-trends-forecast-country-cagr-analysis-1787559360271

Where Oat Value Has Relocated

Four moves matter in a category whose founding advantage has already been copied and whose growth rate has already halved from where it started out. Two concern the reformulated variants where demand has actually moved, and two concern the channel and supply positions that simply cannot be replicated by ordering from any contract manufacturer.

Lead with protein rather than defending the original recipe

Protein-fortified formulations compound at 10.8% against a category rate of 7.2%, because a standard oat drink carries roughly a third of dairy protein and nutrition commentary turned that into a mainstream purchasing objection rather than a specialist one. Fortification with pea, faba or oat protein brings flavour and stability problems the base product never had to solve, which means formulation capability genuinely differentiates here in a way barista base no longer does. Manufacturers still selling only the original recipe are competing in the slowest part of their own market. The objection is real and answering it sells.
Market Impact: Serves growth that is running at 10.8% yearly

Solve low conversion texture before competitors do

Enzymatic hydrolysis creates the body and the free sugars together, so reducing conversion improves the nutrition panel and damages the mouthfeel that made the product work. Low-sugar variants grow at 8.4% and the technical problem is delivering acceptable texture at low dextrose equivalent, which very few manufacturers have genuinely solved. Whoever does holds an advantage of a different kind from the barista formulation, because it sits in formulation science rather than in a process any contract manufacturer can run on request. Several low-sugar launches have failed on repeat purchase rather than on trial.
Market Impact: Serves variants that are growing at 8.4% annually

Treat barista channel spend as marketing, not sales

Foodservice takes 34% of volume and coffee shop presence drives household trial rather than the reverse, which inverts the normal packaged food adoption path completely. Brands with strong cafe listings outperform in grocery for reasons unrelated to their retail execution. Judging that channel on its own thin margin misses what it actually does, and several manufacturers have cut barista investment on margin grounds and then watched retail velocity fall without connecting the two events at all. Brands with strong cafe listings outperform in grocery for reasons unrelated to shelf investment.
Market Impact: Protects a channel worth 34% of all volume

Contract certified gluten-free oat supply on multi-season terms

Certified gluten-free oats carry roughly a 26% premium and require dedicated seed, segregated storage, cleaned transport and batch testing, because oats rotate with wheat and share handling equipment throughout the chain. The certified pool is far smaller than total oat production suggests. Manufacturers treating this as a routine purchase discover during a tight season that the claim on their carton depends on a supply they never secured. Multi-season grower contracts with segregation built in are the only reliable answer available. Multi-season grower contracts with segregation specified are the only reliable answer available to anybody.
Market Impact: Manages a 26% premium on the certified oats

Who Controls the Margin Pool

Five manufacturers hold 42% of this market, measured on retail and foodservice sales value at manufacturer level, the basis used throughout this section. That concentration is falling rather than consolidating, because contract manufacturing made barista-grade formulation available to anybody and retailer own labels moved in hard. The barrier to entry that supported early margins has essentially gone, and what remains is brand, channel access and formulation capability beyond the base recipe.
Competition runs on four dimensions. Reformulation capability across protein and low-sugar variants, which is where category growth has now relocated entirely. Coffee shop channel presence, which drives retail trial rather than following it as most packaged food does. Certified oat supply security behind the claims already printed on cartons. And cost position against private label, which sets the grocery price ceiling whether a brand likes it or not.

Rankings shift toward manufacturers with genuine formulation depth and toward regional players across Asian markets where the category is still being introduced rather than defended. European brands hold the deepest cafe relationships alongside the most mature and price-pressured retail markets anywhere. Dairy companies hold distribution and manufacturing scale that pure plant brands have never been able to match.
oat-based-beverage-market-trends-forecast-company-positioning-matrix-1787559360782

Competitive Moat and Risk Dimensions

OATLY

Moat: Category origin and cafe depth

The company created the category and holds coffee shop relationships that took a decade to build, which matters because foodservice at 34% of volume drives household trial rather than following it. Brand recognition among consumers who first met oat drink in a cafe remains strong, and no private label can manufacture that association.
OATLY

Risk: Cost position against own label

Contract manufacturing made barista formulation available to everybody and retailer own labels hold 31% of grocery volume at prices a branded cost structure cannot match. The formulation advantage that justified premium pricing no longer exists in any exclusive form. Manufacturers with dairy-scale distribution and lower overheads compete on ground where brand equity alone does not decide the outcome.
DANONE

Moat: Distribution scale and formulation

Existing chilled and ambient beverage distribution reaches retail accounts and foodservice operators that a standalone plant brand spends years accessing, and the group's formulation resources cover protein fortification and sugar reduction where category growth has actually relocated. Manufacturing scale also produces a cost position that competes against private label rather than merely surrendering the price-sensitive volume.
DANONE

Risk: Cafe channel credibility gap

Coffee shop adoption drives household trial in this category and barista credibility is earned through relationships and product performance rather than distribution scale. Specialist brands hold those listings and the association that comes with them. A large food group entering the channel on commercial terms alone frequently finds the volume available and the credibility harder to purchase.

Players Tracked

Prominent Players

Oatly
Danone
Califia Farms
Minor Figures
Yili Group

Other Key Players

HP Hood
Vitasoy International
Campbell Soup Company
Nestlé
Lactalis
Arla Foods
Valio
Chobani
SunOpta
Oatside
Mooala
Elmhurst 1925
Rude Health
Plenish
Yeo Valley

Recent Developments

FEBRUARY 2025

A retailer launched barista own label across its grocery estate

A European grocery retailer launched a barista-specification oat drink under its own label across its full estate, produced by a contract manufacturer and priced substantially below branded equivalents on shelf. This was a private label launch rather than any transaction between beverage manufacturers themselves. Volumes committed were substantial.
Signal: Barista formulation is now a commodity available to any retailer, which removes the premium that funded early brand building
JUNE 2025

A manufacturer launched a protein-fortified oat drink range

A plant beverage manufacturer launched a protein-fortified oat range using added pea and oat protein, positioned explicitly against the nutritional criticism that standard oat drinks carry far less protein than dairy. This was a product launch rather than any acquisition or partnership arrangement. Calcium and vitamin fortification came as standard.
Signal: Reformulation toward protein is where category growth has relocated, and it demands capability contract manufacturers supply unevenly
OCTOBER 2025

A coffee chain made oat drink its default milk in Asian markets

A coffee chain operating across several Asian markets made oat drink the default option at no surcharge in its Chinese and Korean outlets, citing lactose intolerance prevalence and consumer preference among younger customers. This was an operational decision rather than any commercial transaction. Dairy remained available on request.
Signal: In markets where dairy was never the default, oat arrives as standard coffee milk rather than as a substitute

What Drives Beverage Cost

Oats and enzymes together account for roughly 31% of production cost, with certified gluten-free oats carrying about a 26% premium over conventional supply. Packaging takes around 27%, dominated by aseptic carton, and it is the single largest controllable line for most manufacturers. Processing energy for hydrolysis and sterilisation adds about 12%. Distribution costs vary sharply between ambient and chilled formats.
Oat prices rose through 2022 as European harvests disappointed and energy-driven input costs reached agriculture, while aseptic packaging costs climbed with board and polymer prices at the same time. Danone noted raw material and packaging cost pressure across its plant-based operations in its Annual Report 2022. Manufacturers on annual retailer pricing absorbed most of it, and several reduced promotional depth rather than seek list price increases that retailers would have resisted.

The disadvantage falls on brands without manufacturing scale, and it appears through the private label price ceiling rather than through input purchasing. Own label sets what a shopper will pay, and a brand with contract manufacturing costs plus marketing overhead cannot reach that price and still fund itself. Manufacturers with owned aseptic lines and dairy-scale packaging purchasing operate on a different cost base entirely.
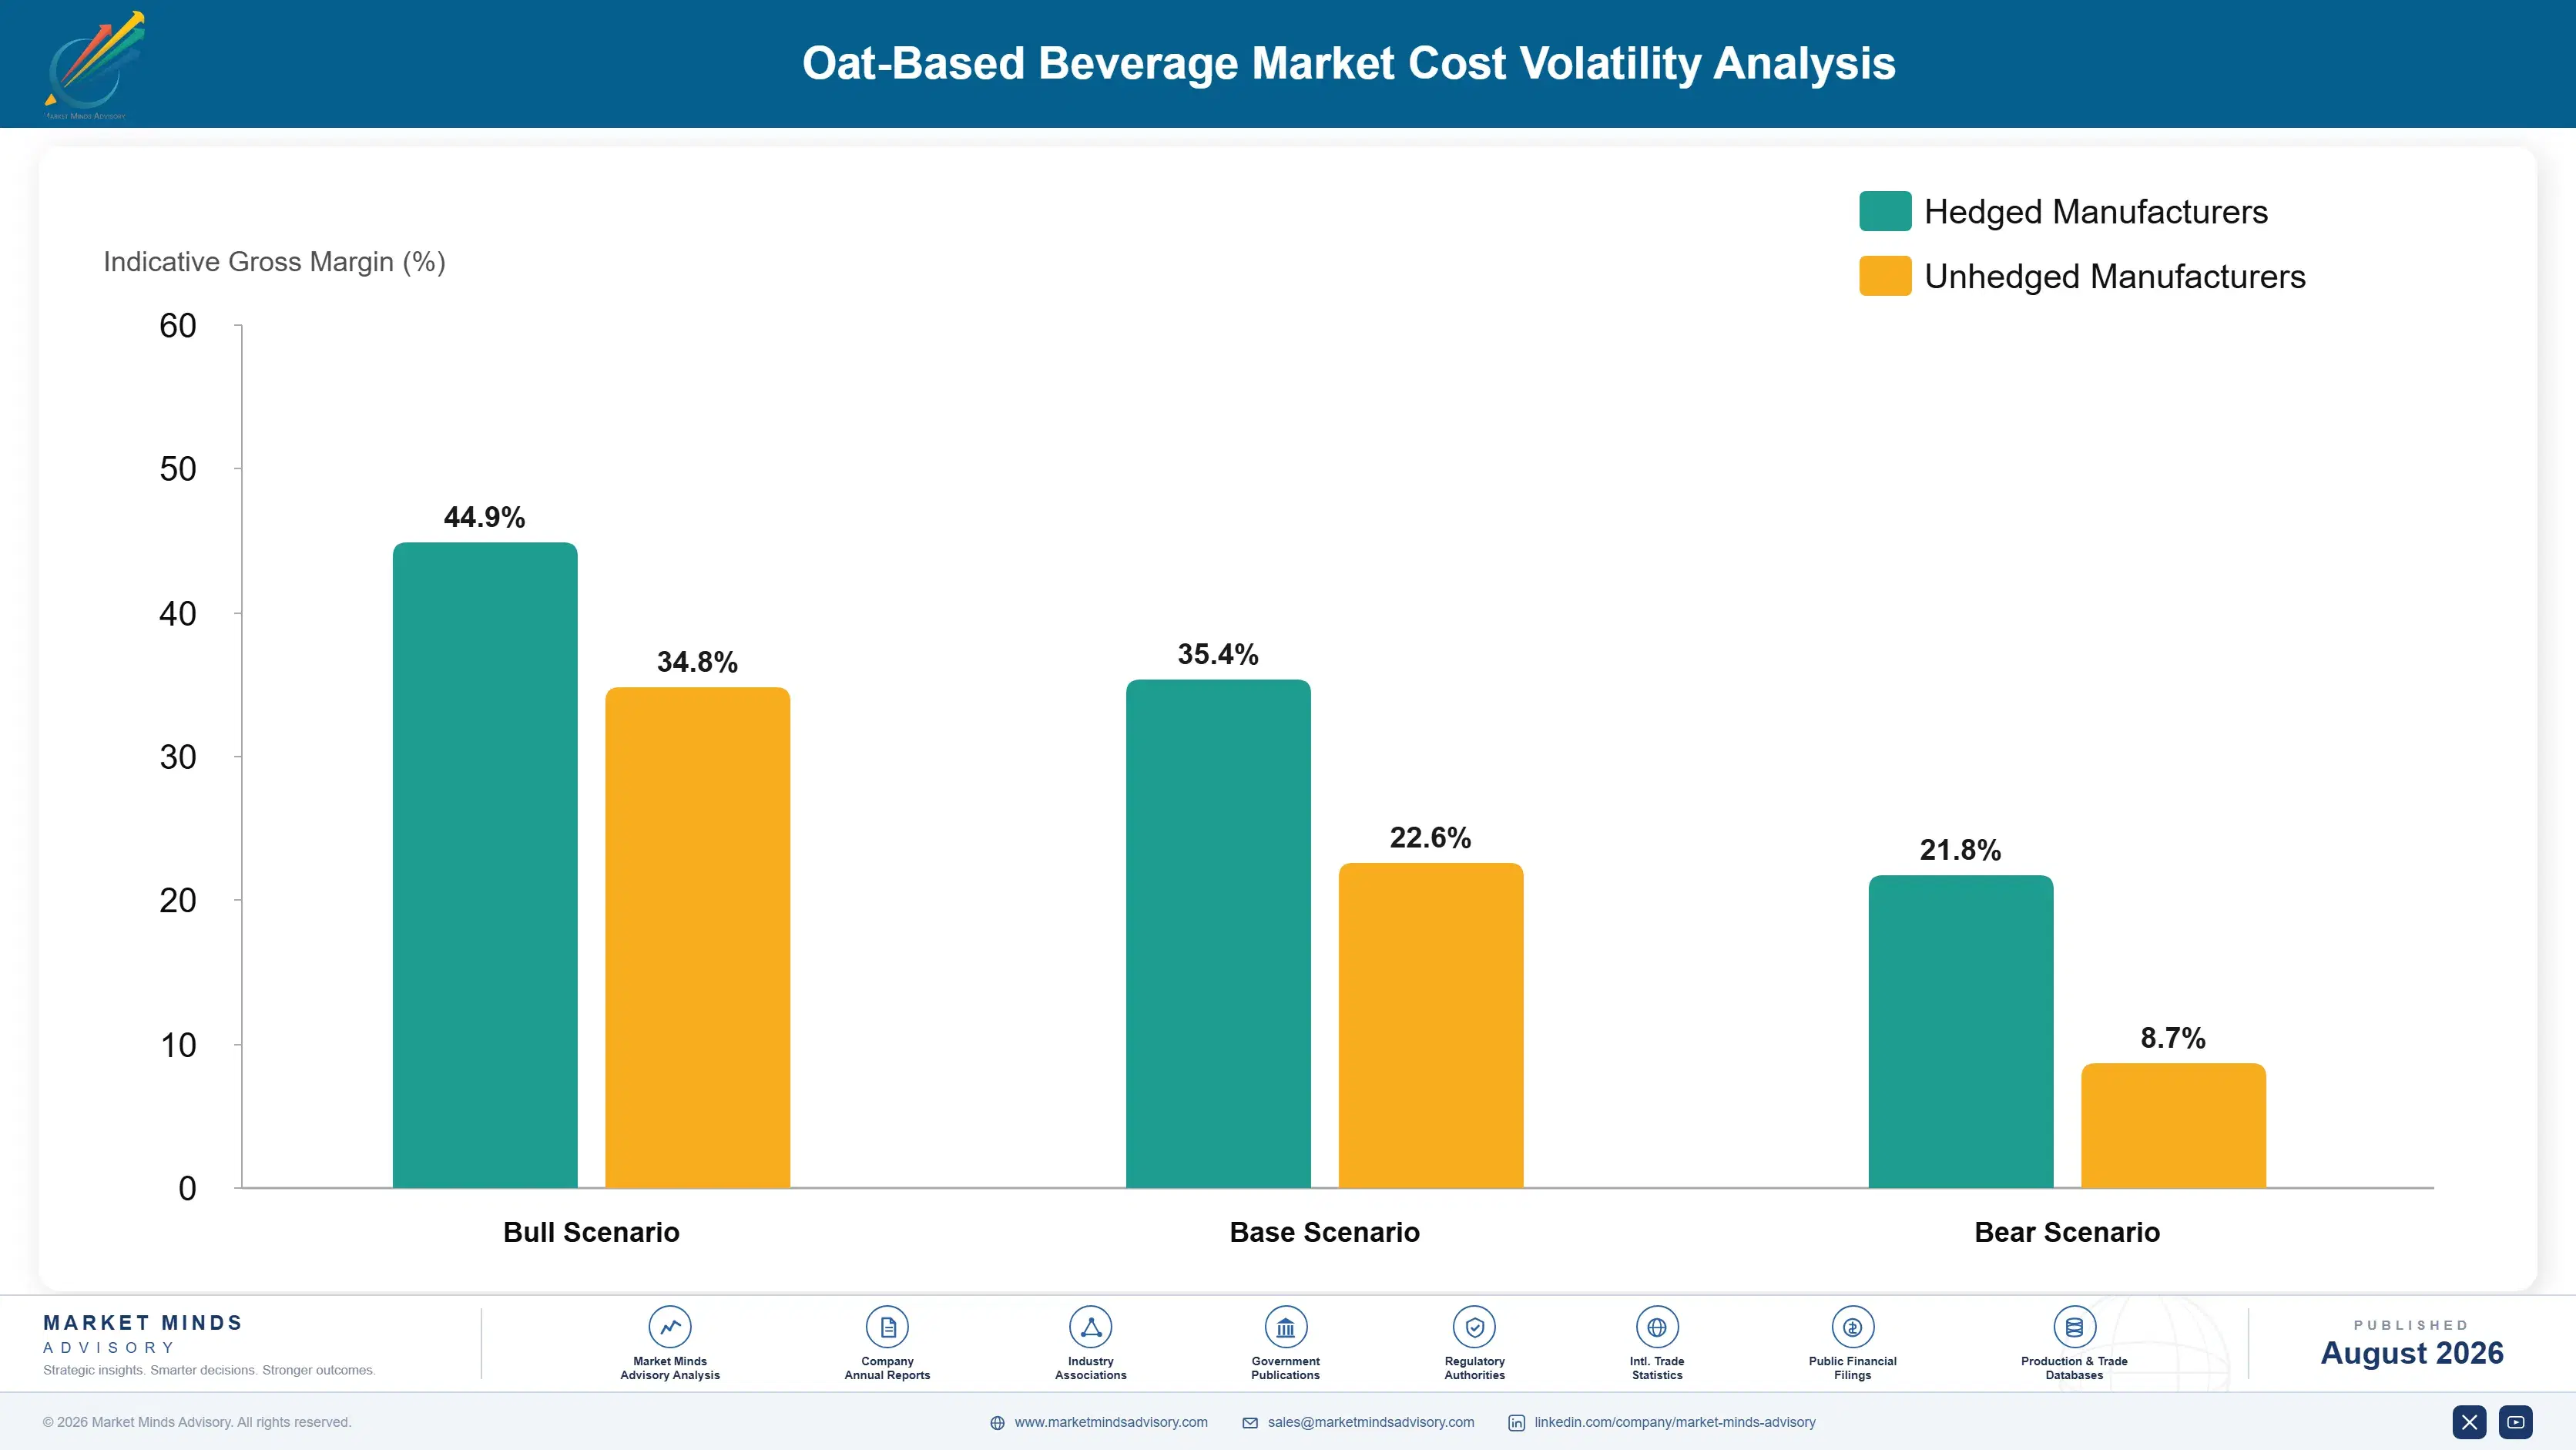
oat-based-beverage-market-trends-forecast-cost-volatility-analysis-1787559360976

Contract certified gluten-free oat supply across multiple seasons

Certified oats need dedicated seed, segregated storage, cleaned transport and testing, and carry roughly a 26% premium as a result. The certified pool is much smaller than total oat production implies, and it tightens without warning. Multi-season grower contracts with segregation specified secure the supply behind a claim already printed on the carton. Segregation must be specified explicitly.

Move volume toward ambient formats where distribution allows

Aseptic ambient product costs considerably less to distribute and store than chilled, and the difference compounds across a national retail footprint. Consumer preference for chilled is real but weaker than manufacturers assume in several markets. Testing ambient conversion by account rather than assuming the chilled position is fixed frequently releases meaningful cost. Account by account testing beats blanket assumptions.

Invest in formulation rather than competing on shelf price

Private label at 31% of grocery volume sets the price ceiling and a branded cost structure cannot reach it. Competing there loses money slowly. Protein fortification and low-sugar texture are formulation problems contract manufacturers solve unevenly, which restores a genuine reason for a consumer to pay more than own label asks. Formulation is where a premium survives.

Portfolio Architecture for Margin Defence

Margin separates on formulation difficulty rather than on scale or brand, which is not where this category expected to end up. Standard retail ambient runs at gross margins in the high teens against private label that sets the shelf price ceiling. Chilled fresh retail runs modestly better on distribution barriers rather than on any product difference. Barista and foodservice runs better again on channel relationship. Protein-fortified and low-sugar formulations run highest, because contract manufacturers deliver them unevenly and consumers pay for the answer to a real objection.
The tension is that standard formulations carry the volume while reformulated variants earn the returns, and moving toward the latter needs formulation science and sensory work rather than any manufacturing investment. Brands weighted toward the original recipe face a private label price ceiling that will not lift and a growth rate that has already halved. Several are defending shelf position in the slowest part of the category while the growth happens two facings away.

High-value pools sit in protein-fortified variants, low-sugar formulations that actually taste acceptable, and cafe channel positions. Standard ambient retail is where own label has settled the question and no brand wins it back.

Volume / Commodity-Adjacent

Standard retail ambient and basic chilled formulations priced against retailer own label across grocery. The ten-point range separates manufacturers with owned aseptic lines and packaging scale from brands relying entirely on contract manufacturing.
Gross Margin: 16%-26%

Premium / Certified

Barista and foodservice formulations plus organic and certified gluten-free ranges where channel relationship and claim substantiation matter. The twelve-point spread reflects cafe listings and supply security rather than any formulation advantage.
Gross Margin: 28%-40%

Sustainability / Regulatory / Next-Generation

Protein-fortified, functional and genuinely acceptable low-sugar formulations. The eighteen-point range is wide because formulation quality varies enormously and consumers can taste the difference between a solved problem and a compromised one.
Gross Margin: 36%-54%
oat-based-beverage-market-trends-forecast-portfolio-architecture-1787559361477

High-value Sub-segments and Strategic Watch-out

Protein-Fortified Formulations

Compounding at 10.8% because a standard oat drink carries roughly a third of dairy protein and consumers now notice. Pea, faba and oat protein each bring flavour problems the base recipe never had to solve properly. Formulation capability genuinely differentiates suppliers within this particular segment.
Gross Margin: 38%-54%

Low-Sugar Texture Solutions

Growing at 8.4% on consumers who like the product and dislike the panel. Reducing enzymatic conversion improves nutrition and damages mouthfeel, so whoever solves the texture problem holds something genuinely defensible. Several launches failed on repeat purchase rather than on trial. Texture is the whole problem.
Gross Margin: 36%-50%

Barista Channel Position

Foodservice takes 34% of volume and drives household trial rather than following it. Judge this on the retail velocity it generates rather than on its own thin margin, which several manufacturers have learned expensively. Correlation with local cafe density holds right down to postcode level.
Gross Margin: 28%-40%

Standard Ambient Retail

The grocery volume, where own label at 31% of the category sets a price ceiling no branded cost structure reaches. Manage this for manufacturing and packaging cost rather than for any margin recovery. Manufacturing and packaging scale together decide who survives within this tier. Brands rarely do.
Gross Margin: 16%-26%

How Oat Demand Renews

Demand renews weekly through household repeat purchase and daily through cafe consumption, which produces two annuities behaving very differently. The retail annuity is genuine but shallow, since a household that switches back to dairy or across to another plant milk simply stops buying and nothing prevents it. The foodservice annuity runs deeper, since a cafe that has standardised changes reluctantly and each decision carries hundreds of servings weekly.
Stickiness varies sharply by vertical. Coffee chains that have specified a supplier across an estate switch rarely, since retraining baristas and revalidating drink quality across outlets is disruptive out of proportion to any price saving. Independent cafes switch readily on price and availability. Retail households show almost no loyalty at all once private label reaches acceptable quality, which the category discovered faster than anybody in it expected to.

The buyer has shifted from early adopter toward mainstream grocery shopper, and that changed everything about what wins. Early consumers bought a category they believed in and tolerated a premium. The mainstream shopper compares a branded carton with an own label one beside it, tastes very little difference, and behaves exactly as shoppers behave in every other packaged food aisle.
oat-based-beverage-market-trends-forecast-end-use-penetration-index-1787559361997

Where To Place The Bet

These are among the four positions where our research anticipates prominent divergence between winners and laggards over the coming forecast period. Each is grounded in the demand model, the regulatory perimeter, and the announced capacity pipeline.
01 / PROTEIN REFORMULATION PRIORITY

Move the range where the growth actually went

Protein-fortified formulations compound at 10.8% against a category rate of 7.2%, because a standard oat drink carries roughly a third of the protein found in dairy and nutrition commentary converted that into a mainstream purchasing objection rather than a specialist concern. Fortification with pea, faba or oat protein introduces flavour and stability problems the original recipe never needed to solve. That makes formulation capability a genuine differentiator here, in a way that barista base has not been for several years now.
02 / LOW CONVERSION TEXTURE

Cut the sugars without losing the mouthfeel

Enzymatic hydrolysis produces the body and the free sugars in the same step, so any reduction in conversion improves the nutrition panel and simultaneously damages the texture that made this product work in coffee in the first place. Low-sugar variants grow at 8.4% and very few manufacturers have genuinely solved the texture problem at low dextrose equivalent. Whoever does holds an advantage that sits in formulation science rather than in a process any contract manufacturer will run for anybody who asks.
03 / CAFE CHANNEL VALUATION

Stop judging foodservice on its own margin

Foodservice accounts for 34% of category volume and coffee shop presence drives household trial rather than following it, which inverts the normal packaged food adoption sequence entirely. Brands holding strong cafe listings consistently outperform in grocery for reasons that have nothing whatever to do with their retail execution or shelf investment. Several manufacturers have cut barista channel investment on thin margin grounds and then watched retail velocity decline without ever connecting those two events to one another in any management review.
04 / CERTIFIED OAT SECURITY

Contract the supply behind your own claim

Certified gluten-free oats carry roughly a 26% premium and require dedicated seed, segregated storage, cleaned transport and batch testing throughout, because oats are grown in rotation with wheat and share handling equipment across most of the supply chain. The certified pool is considerably smaller than total oat production would suggest to anybody looking at harvest figures. Manufacturers treating it as a routine purchase discover in a tight season that a claim already printed on the carton rests on supply nobody secured.

Engagement Snapshot From the Field

A live engagement with an industry participant carrying material or product regulatory and market exposure ahead of a defining policy shift, showing how our research translates into a defensible multi-year portfolio strategy.
MARKET MINDS ADVISORY · CLIENT ENGAGEMENT SUMMARY
Oat-Based Beverage Producer Strategic Portfolio Review and Transition Roadmap 2026·Investment Scenario on Oat-Based Beverage Exposure Evaluation 2025-26
CLIENT PROFILE
A European oat beverage brand with annual revenue around EUR 68 million (client-reported, unverified by MMA), selling through grocery and independent cafes across four countries. All production ran through contract manufacturers. The range consisted of the original barista and standard formulations only. No protein or low-sugar variant existed anywhere. Growth had stalled for two years.
STRATEGIC CHALLENGE
Retail volume had declined for two consecutive years against private label priced well below the brand, and management proposed matching that price to defend shelf position. Nobody had asked whether a contract-manufactured brand could ever reach own label cost, or where category growth had actually moved. Neither question had been examined.
MMA APPROACH
MMA rebuilt the client's landed cost against private label shelf price to establish whether price matching was arithmetically possible at all. Category growth was decomposed by formulation type rather than by channel. Cafe listings were traced against retail velocity by postcode to test whether foodservice presence was driving grocery performance.
KEY FINDINGS
  1. Price matching own label was arithmetically impossible without abandoning marketing entirely, since contract manufacturing cost plus overhead exceeded the retailer's shelf price before any brand spending at all.
  2. All category growth in the client's markets sat in protein-fortified and low-sugar formulations, neither of which the brand offered, while the original range competed in the only declining part.
  3. Retail velocity correlated closely with independent cafe density in the same postcode, confirming that foodservice presence was generating household trial rather than simply adding volume.
  4. The contract manufacturer could produce a protein-fortified variant but had not solved low conversion texture, which meant the low-sugar opportunity required a different partner entirely.
CLIENT PROFILE
A European oat beverage brand with annual revenue around EUR 68 million (client-reported, unverified by MMA), selling through grocery and independent cafes across four countries. All production ran through contract manufacturers. The range consisted of the original barista and standard formulations only. No protein or low-sugar variant existed anywhere. Growth had stalled for two years.
STRATEGIC CHALLENGE
Retail volume had declined for two consecutive years against private label priced well below the brand, and management proposed matching that price to defend shelf position. Nobody had asked whether a contract-manufactured brand could ever reach own label cost, or where category growth had actually moved. Neither question had been examined.
MMA APPROACH
MMA rebuilt the client's landed cost against private label shelf price to establish whether price matching was arithmetically possible at all. Category growth was decomposed by formulation type rather than by channel. Cafe listings were traced against retail velocity by postcode to test whether foodservice presence was driving grocery performance.
KEY FINDINGS
  1. Price matching own label was arithmetically impossible without abandoning marketing entirely, since contract manufacturing cost plus overhead exceeded the retailer's shelf price before any brand spending at all.
  2. All category growth in the client's markets sat in protein-fortified and low-sugar formulations, neither of which the brand offered, while the original range competed in the only declining part.
  3. Retail velocity correlated closely with independent cafe density in the same postcode, confirming that foodservice presence was generating household trial rather than simply adding volume.
  4. The contract manufacturer could produce a protein-fortified variant but had not solved low conversion texture, which meant the low-sugar opportunity required a different partner entirely.
RECOMMENDED STRATEGY
Phase 1: Phase one: abandon the price matching proposal, hold pricing and accept the volume loss in standard ambient rather than funding an unwinnable position on shelf. Phase 2: Phase two: launch a protein-fortified variant through the existing contract manufacturer, since that capability is available and the growth is demonstrably there. Phase 3: Phase three: qualify a second manufacturer with genuine low conversion texture capability, and expand cafe listings in the markets where retail velocity lags cafe density.
OUTCOME
Standard ambient volume declined as expected while gross margin held. The protein variant launched within nine months and now accounts for a meaningful share of revenue. A second manufacturer is qualified for low-sugar production, and the client reports the brand returning to growth on a smaller volume base (client-reported, unverified by MMA).

Frequently Asked Questions

Foundational context covering the market sizes, CAGR, scope, country, region and competition that inform every finding below. This section is provided to cover basics and most often pre-purchase conversations, answered from the MMA Primary Research Dataset.

What is the current size of the Oat-Based Beverage Market?

The market was valued at USD 4.4 billion in 2025, rising to an estimated USD 4.72 billion in 2026. Western Europe holds the largest regional share at 32% of value.

How large will the Oat-Based Beverage Market be by 2036?

MMA forecasts USD 9.45 billion by 2036 under the base case, an expansion multiple of 2.00 times the 2026 value. That represents USD 4.73 billion of incremental value.

What is the CAGR for the Oat-Based Beverage Market 2026 to 2036?

The base case runs at 7.2% compound annual growth between 2026 and 2036, with a bull case at 8.4% and a bear case at 6.0%. Historical growth from 2020 to 2025 was 12.6%.

Which segment is growing fastest?

Protein-fortified and functional formulations lead at 10.8%, half again the market rate, answering the dairy protein gap directly. Unsweetened and low-sugar variants follow at 8.4%.

Who are the major companies in the Oat-Based Beverage Market?

Oatly, Danone, Califia Farms, Minor Figures and Yili Group hold 42% of the market. That concentration is falling as contract manufacturing and private label remove entry barriers.

Which country is growing fastest?

China leads at 10.4%, driven by coffee chain expansion across a population where lactose intolerance is common and dairy was never the default beverage anyway.

Report Segmentation Architecture

The full report scope spans multiple orthogonal segmentation dimensions, with cross-tabulated demand data provided for each dimension pair. Coverage extends further to regional breakdowns, trend trajectories, and the competitive detail needed to support segment-level decision-making.

By Formulation and Format

  • Barista and Foodservice Formulations
  • Standard Retail Ambient
  • Chilled Fresh Retail
  • Protein-Fortified and Functional
  • Flavoured and Ready-to-Drink
  • Unsweetened and Low-Sugar Formulations

By End-Use Industry

  • Grocery and Supermarket Retail
  • Coffee Shops and Cafe Chains
  • Restaurants and Quick Service
  • Workplace and Institutional Catering
  • Convenience and Forecourt Retail
  • Online and Direct to Consumer

By Brand Structure

  • Specialist Plant Brands
  • Dairy Group Plant Ranges
  • Retailer Private Label
  • Foodservice Contract Supply
  • Regional and Local Brands

By Region

  • North America
  • Western Europe
  • East Asia
  • South Asia and Pacific
  • Latin America
  • Middle East and Africa
  • Eastern Europe

Scope, Methodology, and Coverage

Every figure in this report is reproducible from documented input assumptions. The scope below maps the historical period, the forecast horizon, the segmentation dimensions, and the countries covered, alongside the underlying primary and qualitative methodology.
Historical Period
2020 to 2025
Forecast Period
2026 to 2036
Base Year
2025 (USD billions; MMA Primary Research Dataset, August 2026)
Market Definition
The market comprises oat-based drinking beverages sold through retail and foodservice channels, including barista and foodservice formulations, standard retail ambient, chilled fresh retail, protein-fortified and functional, flavoured and ready-to-drink, and unsweetened and low-sugar formulations, supplied under specialist plant brands, dairy group ranges, retailer private label, foodservice contract and regional brand structures. Value is measured at manufacturer level across retail and foodservice sales. Oat-based yoghurt, ice cream, cream and cooking alternatives, oat flour and flakes sold as ingredients, blended beverages where oat is a minor component, and enzymes or oat base concentrate sold business to business fall outside scope.
Quantitative Units
USD billions (current prices); million litres sold; USD per litre by formulation and channel
Segmentation Dimensions
By Formulation and Format; By End-Use Industry; By Brand Structure; By Region
Regions Covered
North America, Western Europe, East Asia, South Asia and Pacific, Latin America, Middle East and Africa, Eastern Europe
Countries Covered
Sweden, Finland, Denmark, United Kingdom, Germany, Netherlands, France, Spain, Italy, Switzerland, United States, Canada, Mexico, Brazil, Colombia, Chile, China, Japan, South Korea, Taiwan, India, Thailand, Singapore, Australia, New Zealand, Poland, Czechia, Estonia, United Arab Emirates, South Africa
Key Companies Profiled
Oatly, Danone, Califia Farms, Minor Figures, Yili Group, HP Hood, Vitasoy International, Campbell Soup Company, Nestlé, Lactalis, Arla Foods, Valio, Chobani, SunOpta, Oatside, Mooala, Elmhurst 1925, Rude Health, Plenish, Yeo Valley
Quantitative Methodology
Primary survey, n=3,800 respondents, Q4 2025, six countries; demand-side model with trade association cross-validation
Qualitative Methodology
47 expert interviews, Q4 2025; applied to validate demand model assumptions, identify emerging dynamics, and assess competitive positioning
Report Format
PDF and XLSX data workbook (Word format preview document)
Publisher
Market Minds Advisory
Report Code
MMA-2026-AGR-154
Published
August 2026
Contact
sales@marketmindsadvisory.com | www.marketmindsadvisory.com

Purchase the full Oat-Based Beverage Market Report (2026 to 2036).

The full report sizes the global oat-based beverage market to 2036 across six formulations and seven regions, measured at manufacturer level across retail and foodservice. It treats foodservice as the trial-generating channel rather than as incremental volume, which is the correction most category analysis needs. Competitive analysis covers 20 manufacturers on one consistent revenue basis, with moat and risk assessment for the two leaders. Private label penetration and contract manufacturing availability are quantified as competitive factors by region. Four quantified revenue levers close the analysis.
Six-formulation segment sizing with individual growth rates
Foodservice modelled as the channel generating household trial
Private label penetration quantified against branded cost structures
Certified gluten-free oat supply constraints mapped by region
Twenty-manufacturer competitive map on one consistent revenue basis
Four quantified revenue levers with commercial impact ranges

Built For The People Who Decide

From boardroom strategy to bench-side execution, this report is read cover-to-cover by leaders shaping the next decade of their industry, turning demand scenarios, market dynamics and valuation benchmarks into decisions.
CXOs/ Presidents/ VPs/ Managers
M&A and Corporate Development
Strategy Teams and R&D Heads
Procurement and Product Directors
Regulatory and Compliance Leaders
Investor Relations and Equity Analysts