

Market Minds Advisory
North America Temperature Sensor Market

North America Temperature Sensor Market: North America Temperature Sensor Market: Sensing Principles, Calibration Economics and New Thermal Demand 2026 to 2036

The thermocouple is two hundred years old, costs about six dollars and still holds a fifth of this market. Nothing else measures that range at that price, and nothing is going to.

Lead Analyst

Published

September 2026

Make Smarter Decisions with Customized Research Insights

Request a free sample report and evaluate market opportunities, growth trends, and competitive dynamics relevant to your business needs.

2025 MARKET VALUE$7.6BMarket Size 2025
2036 FORECAST VALUE$16.3BBase Case , 2026 to 2036
CAGR 2026 TO 20367.2 %Bull 8.5% / Bear 6.0%
INCREMENTAL OPPORTUNITY$8.2BNet 10- year value creation
EXPANSION MULTIPLE2.00x2036 value over 2026 base
Strategic Levers
M&A Pipeline
Regional Outlook
Country Rankings
Competitive Intelligence
Segmental Deep-dive
Call-Us : 91 93563 13602

Executive Snapshot and Market Trajectory.

A two hundred year old technology still holds around a fifth of this market and grows at 3.1%. The thermocouple costs about USD 6, works from cryogenic temperatures to well beyond a thousand degrees, and nothing else does that at anything approaching the price. It has already outlived four replacements.
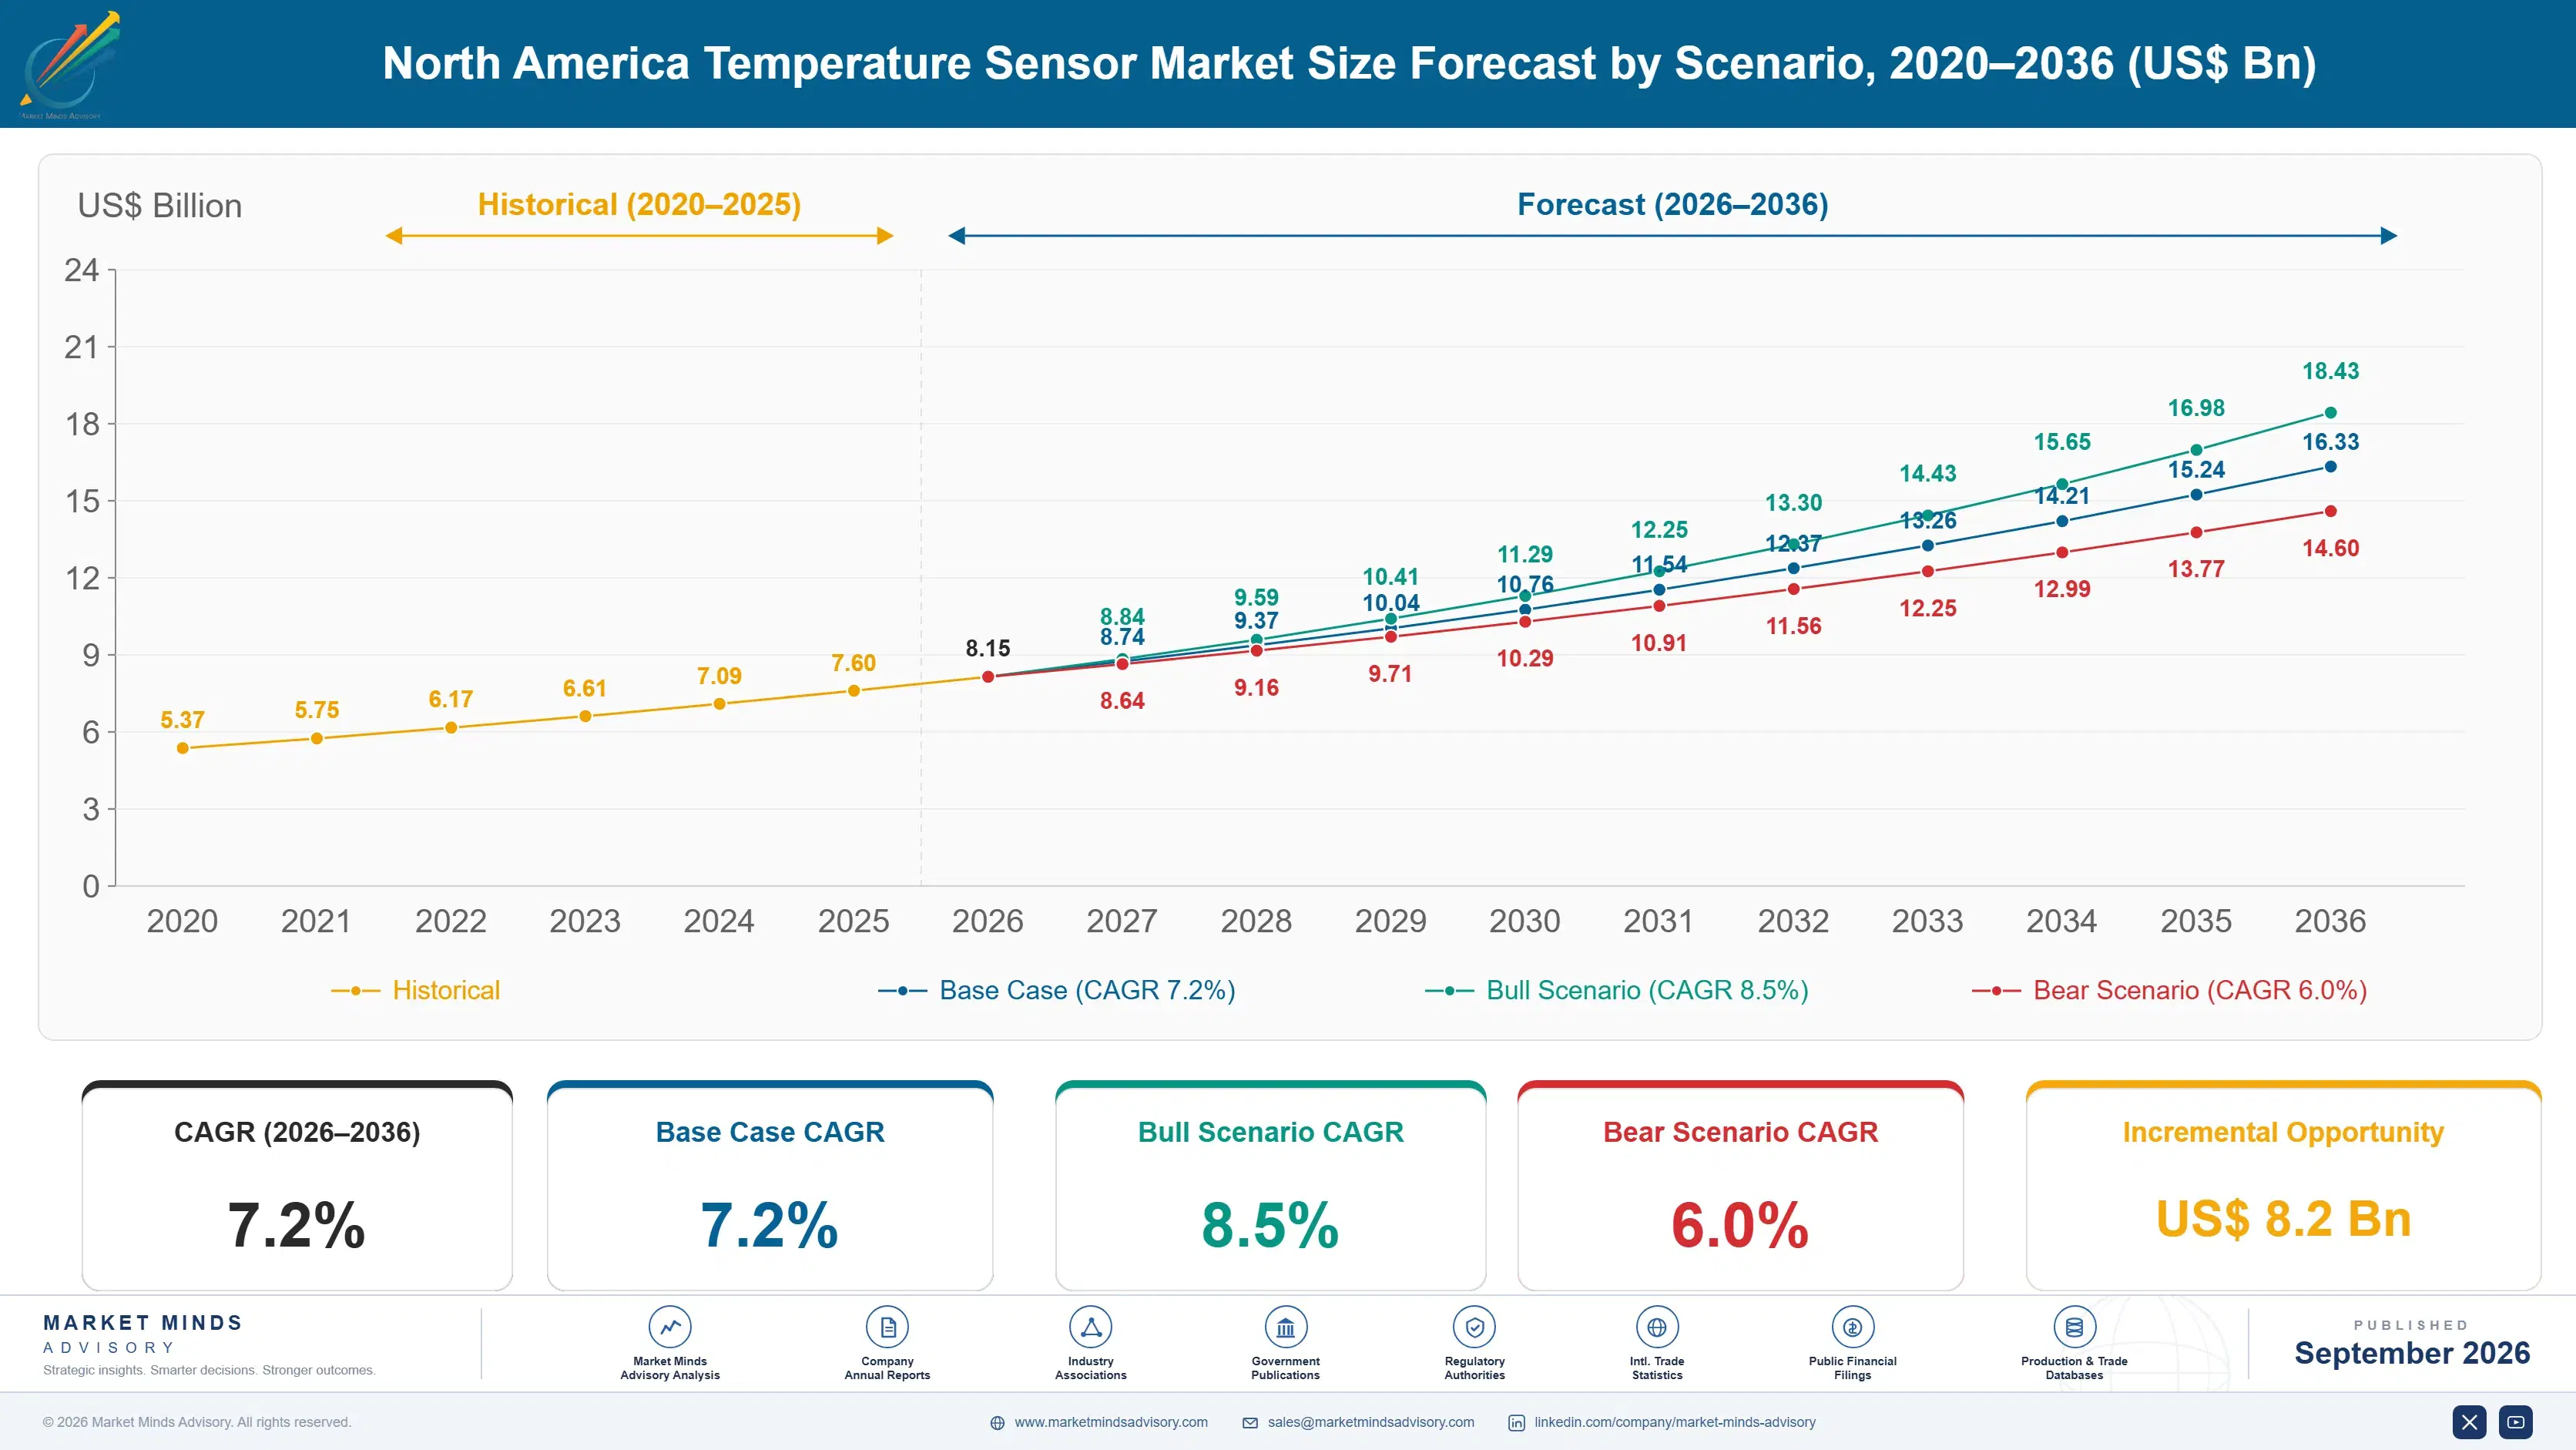
The market reaches USD 8.15 billion in 2026 and USD 16.33 billion by 2036, a 2.00 times expansion at 7.2% across the forecast period. Fibre optic distributed sensing grows at 10.8%, half again the market rate of 7.2%, because a single fibre reports temperature every metre along its length. North America holds 40% of unit shipment revenue in this scoped analysis, and the United States compounds at 8.6% on three new demand sources at once.
Five suppliers hold 41% of unit shipment revenue, which is fragmented because component manufacturers and process instrumentation firms compete for the same measurements from opposite directions. TE Connectivity, Amphenol and Texas Instruments sell components. Honeywell and Emerson sell complete instruments with the sensors already inside them. The two groups rarely meet in the same tender and almost never lose business directly to one another.
Market Definition
This report covers temperature sensing devices across measurement principles, analysed with North America as the geographic centre: semiconductor integrated temperature sensors, non-contact infrared sensors, fibre optic distributed temperature sensing, resistance temperature detectors, thermistors, and thermocouples. It excludes complete process control systems, thermal imaging cameras sold as instruments, temperature controllers and transmitters sold separately, calibration services, and building automation control systems.
Base Year Value
$7.6B in 2025 (MMA Primary Research Dataset, September 2026)
Forecast Period
2026 to 2036, eleven discrete annual values
CAGR
7.2% base case. Bull 8.5%. Bear 6.0%.
Fastest Growth Segment
Fibre Optic Distributed Temperature Sensing: 10.8% CAGR
Fastest Growth Country
United States: 8.6% CAGR
Fastest Growth Region
South Asia and Pacific: 9.2% CAGR
Largest Region
North America: 40% of 2025 global value
Market Leaders
TE Connectivity, Honeywell, Texas Instruments, Amphenol and Emerson lead on temperature sensor unit shipment revenue. Source: MMA Analysis.
Primary Survey
n=3,800 procurement and R&D decision-makers, Q4 2025, six countries
Methodology
Demand-side build-up, cross-validated against public data, 47 expert interviews

North America Temperature Sensor Market Forecast Scenarios

north-america-temperature-sensor-market-size-forecast-scenario-1789990676178
Between 2020 and 2025 the category compounded at 6.1%, tracking industrial production and automotive build with the stability a mature component market usually shows. Two things then changed the North American picture specifically. Battery manufacturing arrived at scale requiring cell level thermal monitoring, and data centre liquid cooling created a measurement requirement that did not previously exist anywhere in computing.
The base case holds 7.2% on three mechanisms. Battery cell monitoring at roughly one sensor per twelve cells multiplies sensor count per vehicle far beyond anything internal combustion required. Liquid cooled computing needs temperature at every coolant path because a thermal excursion destroys hardware within around 800 milliseconds. And semiconductor fabrication capacity being built across North America carries process temperature measurement at densities that general manufacturing has never once approached anywhere.
The bull case at 8.5% assumes distributed fibre sensing displaces point sensors across power cable, pipeline and data centre monitoring faster than expected, which would raise value per installation considerably. The bear case at 6.0% is an industrial production slowdown combined with battery capacity deferral: both new demand sources are capital projects, and capital projects move together when financing conditions change.

Old Physics And New Thermal Problems

Very little in industrial measurement has proved as durable as the thermocouple. Two dissimilar metals joined at a point produce a voltage proportional to temperature, the assembly costs around USD 6, and it works from cryogenic conditions to well past a thousand degrees where every alternative fails. It grows at 3.1% and holds roughly a fifth of this market.
TOP FIVE CONCENTRATION41%Fragmented across component makers and process instrumentation suppliers alike
THERMOCOUPLE UNIT PRICEUSD 6Typical cost for an industrial junction assembly at present
DISTRIBUTED SENSING RESOLUTION1 metreSpatial measurement interval along a single continuous optical fibre
ANNUAL CALIBRATION DRIFT0.4 degreesTypical shift requiring recalibration in process industry service
BATTERY CELL SENSING DENSITY1 per 12Cells monitored individually within a modern pack design
LIQUID COOLING RESPONSE TIME800 millisecondsDetection window before a thermal excursion damages computing hardware
The growth sits in something that inverts the product concept entirely. Fibre optic distributed sensing reads temperature at every metre along a single fibre, so one cable replaces thousands of point sensors along a power line, a pipeline or a data centre coolant loop. That is not a better sensor. It is a different question, and buyers who wanted a temperature at a point are being offered a temperature profile across a distance instead.
Two North American demand sources appeared that nobody in this industry planned for. Battery manufacturing monitors roughly one cell in twelve individually, which multiplies sensor count per vehicle far past anything internal combustion needed. Liquid cooled computing needs measurement at every coolant path, since a thermal excursion destroys hardware inside around 800 milliseconds rather than minutes.
"Somebody asks me every year when the thermocouple finally dies. It costs six dollars, it needs no power, it survives a furnace and it has outlived four technologies that were going to replace it. It will outlive the next one as well."
Director, Industrial Sensing and Measurement Systems Practice · MMA Technology Practice · September 2026

Market Trends

Distributed Fibre Sensing Replaced The Point Measurement

A conventional temperature sensor reports one number at one location, which forces engineers to guess where the interesting temperature will occur before installing anything. Fibre optic distributed sensing reads the whole length of a cable at roughly one metre resolution, so a power circuit, a pipeline or a coolant loop reports a complete thermal profile rather than a handful of samples. Distributed sensing compounds at 10.8% against 7.2% for the market. The installation costs considerably more and it answers a question point sensors were never able to address at all.
Market Impact: Detection window is 800 milliseconds
Battery Manufacturing Multiplied Sensors Per Vehicle

An internal combustion vehicle carried a modest number of temperature measurements across engine, transmission and cabin. A battery electric vehicle monitors roughly one cell in twelve individually because thermal runaway propagates between cells and early detection is the only mitigation available. That multiplies sensor count per vehicle by an order of magnitude and concentrates demand on small, cheap, fast responding devices rather than on precision instruments. North American battery plant construction brought that demand into the region at scale within a very short period. North American plant construction brought that demand into the region very quickly.
Market Impact: United States compounds at 8.6%

Market Opportunities and Growth Drivers

Liquid Cooled Computing Created An Entirely New Requirement

Air cooled data centres tolerated thermal measurement at rack and room level, because a cooling failure raised temperatures over minutes and gave operators time to respond. Liquid cooled racks running artificial intelligence hardware behave differently, since a coolant flow interruption damages processors within roughly 800 milliseconds. That requires measurement at every coolant path with response times no building management sensor was ever designed to deliver. The demand appeared in North America first because that is where the liquid cooled capacity is being built at scale right now. Building management sensors were never designed for it.
Market Impact: Drift runs about 0.4 degrees

Semiconductor Fabrication Capacity Carries Extreme Sensor Density

A semiconductor fabrication plant measures process temperature at densities general manufacturing never approaches, across deposition, etch, diffusion and metrology steps where a fraction of a degree changes yield materially. North American fabrication construction funded through public investment programmes is adding that demand within the region rather than importing finished wafers. The sensors involved are high specification, individually calibrated and replaced on schedule rather than on failure. The United States compounds at 8.6% with fabrication, battery and data centre construction all contributing simultaneously. Those sensors are individually calibrated and replaced on schedule rather than on failure.
Market Impact: All 3 sources are capital projects

Market Restraints and Challenges

Calibration Drift Is The Cost Nobody Compares

Every sensing principle drifts differently and process industry service typically produces around 0.4 degrees of annual shift requiring recalibration. The root cause is physical: thermocouples drift on thermal cycling, thermistors age, and resistance detectors move least but cost most initially. Commercially this means unit price comparisons mislead badly, since recalibration labour across a plant with thousands of measurement points dwarfs the purchase difference. Mitigation runs through in-situ verification, self-diagnosing sensors and honest lifetime cost presentation that very few component suppliers actually offer buyers. Unit price comparisons mislead badly as a result.
Market Impact: Fibre reads every 1 metre

New Demand Sources Are All Capital Projects Together

Battery plants, semiconductor fabrication and liquid cooled data centres are all construction projects rather than production volumes, which means the demand they create arrives and stops with financing decisions rather than with operating cycles. The root cause is that this is equipping new capacity rather than consuming into existing output. Commercially this makes the growth considerably less stable than the industrial base underneath it. Mitigation runs through balancing exposure across replacement demand in process industries, which grows slowly and does not stop when construction financing tightens. Process replacement demand is the natural counterweight to that.
Market Impact: Packs monitor 1 cell in 12
3 additional market trends, 4 additional growth drivers, and 2 additional restraints and challenges are covered in the full report. Contact sales@marketmindsadvisory.com to access the complete intelligence.

Segment CAGR and Growth Architecture

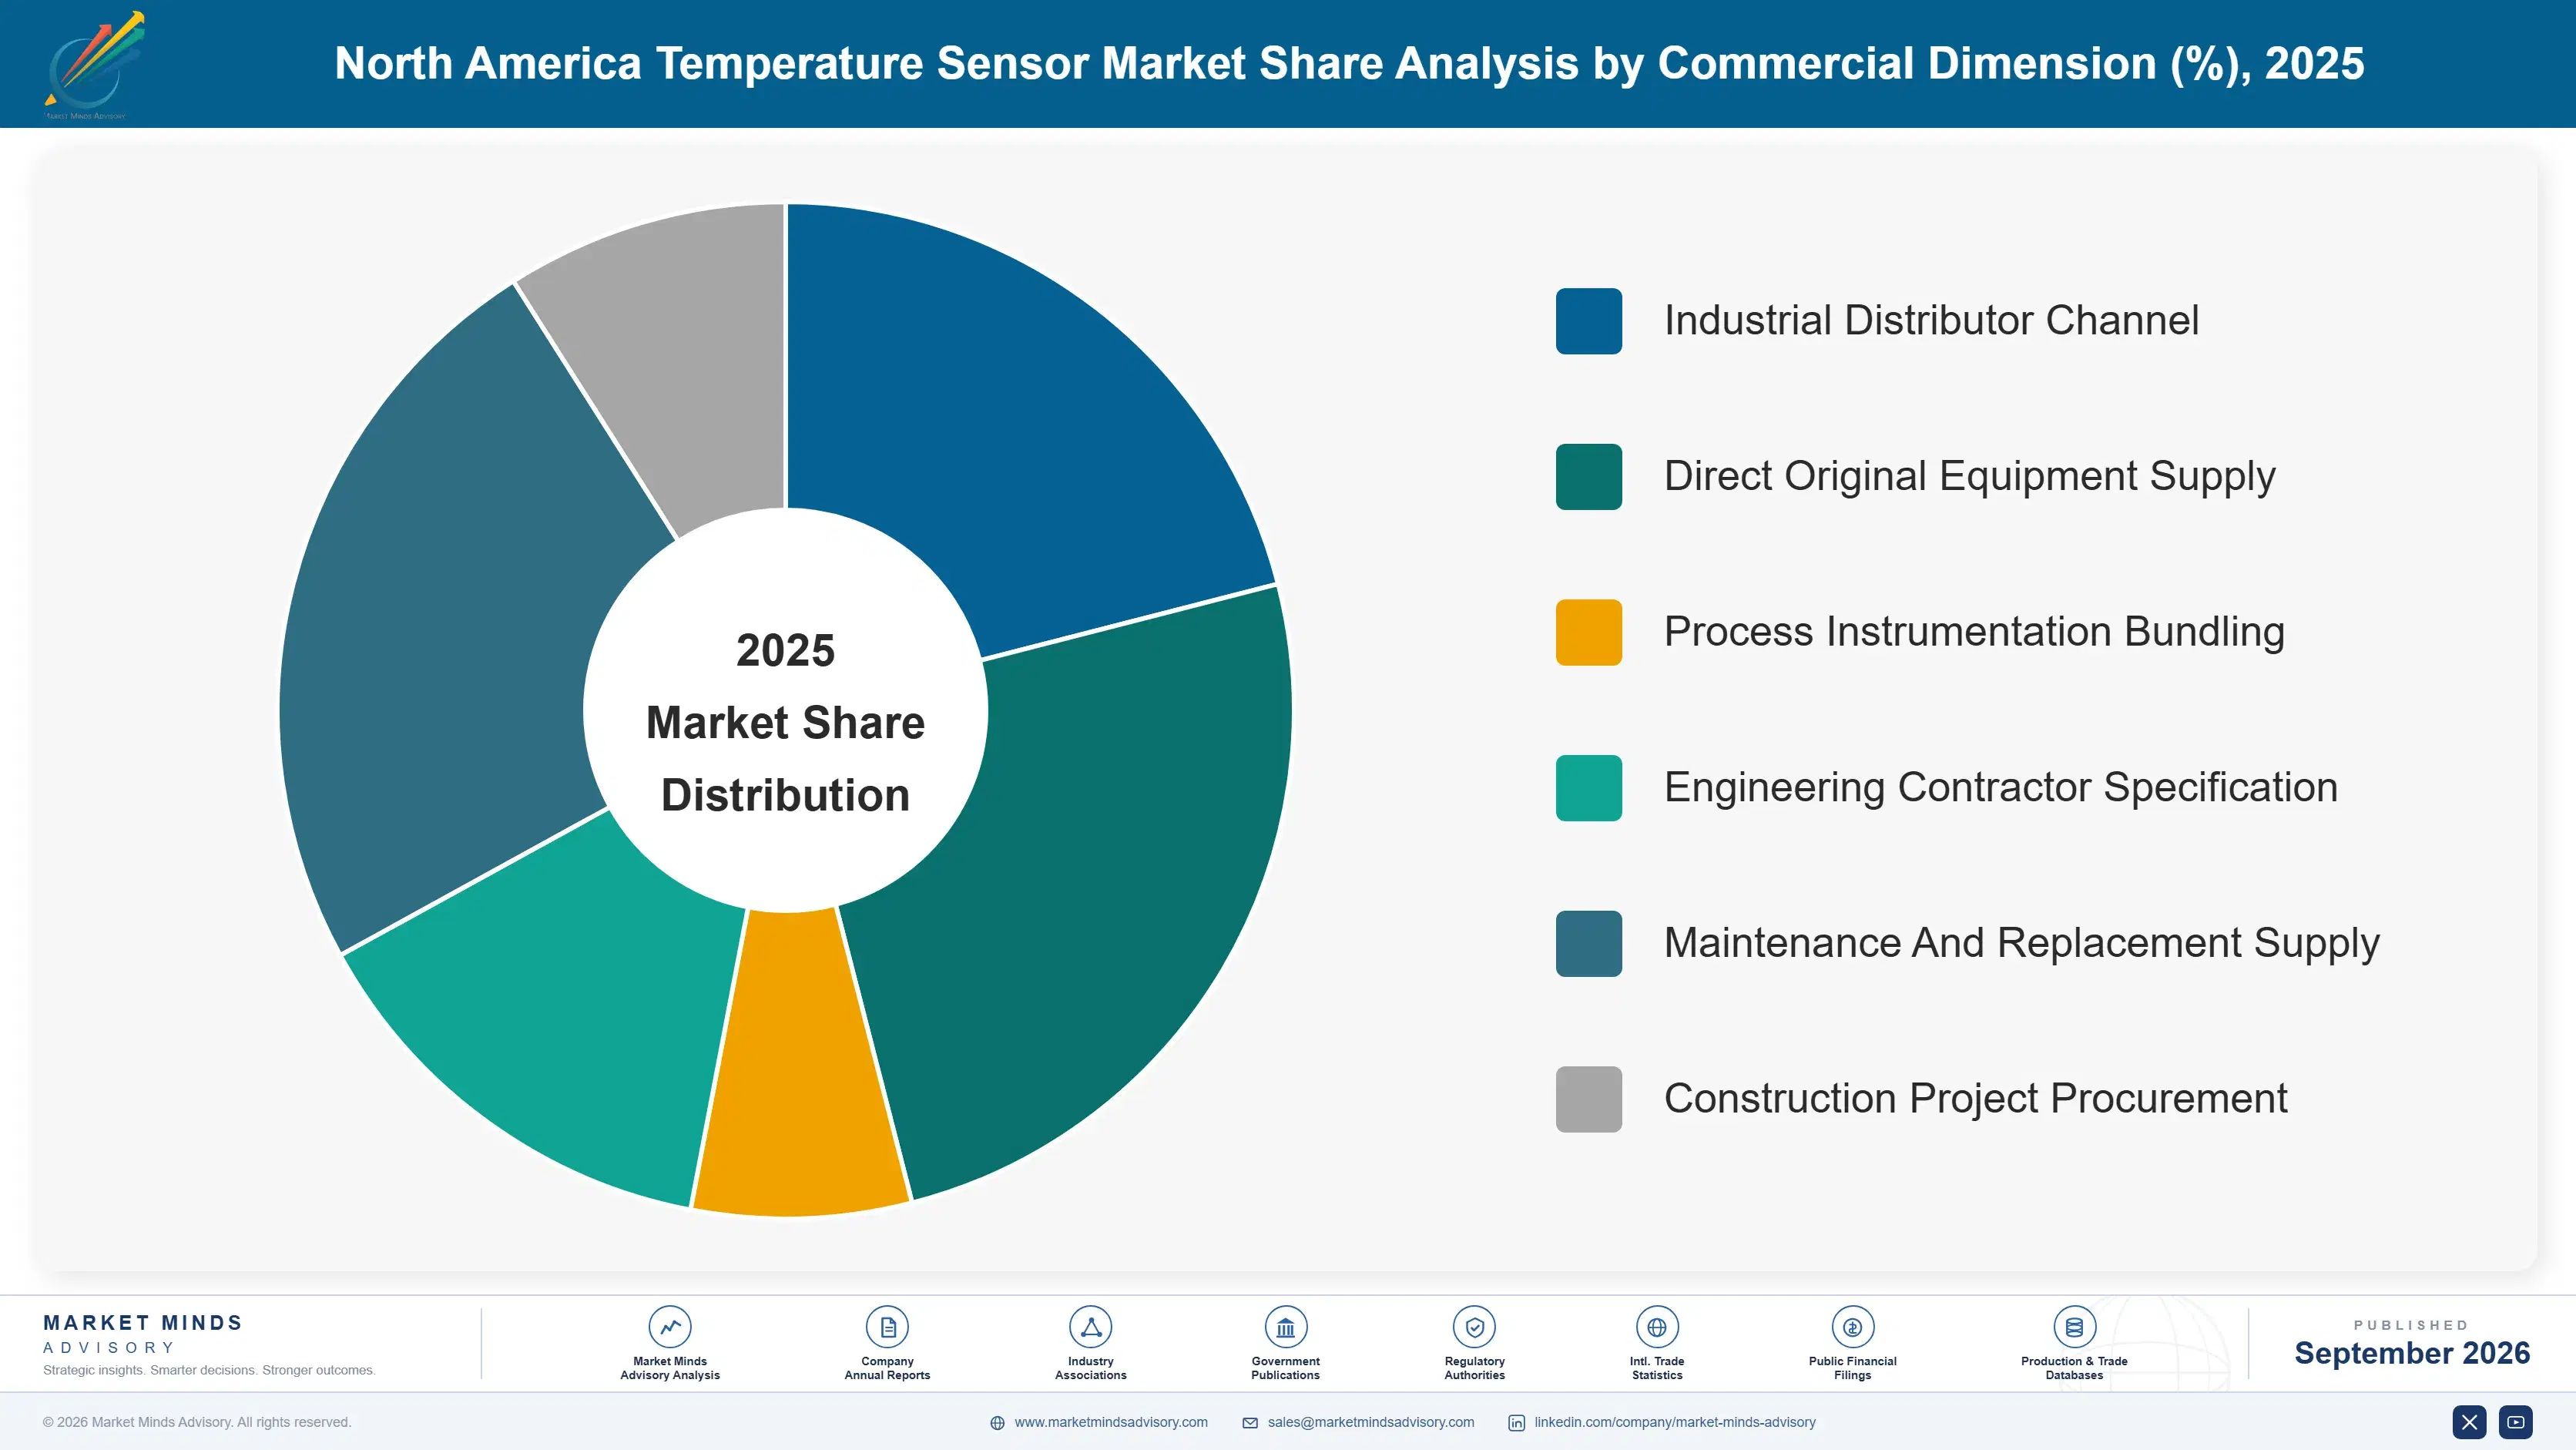
Segmentation follows sensing principle, since the underlying physics determines temperature range, response time, drift behaviour and cost far more than any packaging choice ever does. Six principles cover the market: fibre optic distributed sensing, semiconductor integrated sensors, non-contact infrared, thermistors, resistance temperature detectors, and thermocouples. Application industry and installation format are separate dimensions entirely.
north-america-temperature-sensor-market-market-share-analysis-1789990676712

Fibre Optic Distributed Temperature Sensing

Fibre optic distributed sensing grows at 10.8%, half again the market rate of 7.2%, because it answers a different question rather than answering the same one better. A conventional sensor reports one temperature at one point, which obliges an engineer to predict where the interesting temperature will occur before installing anything at all. A single fibre reports the whole cable length at roughly one metre resolution, producing a thermal profile across a power circuit, a pipeline or a data centre coolant loop. Installation costs considerably more than point sensors and the comparison is misleading, since one fibre replaces thousands of individual measurement points that nobody would have installed anyway. Nobody would have installed them anyway.
CAGR 10.8%

Semiconductor Integrated Temperature Sensors

Semiconductor integrated sensors compound at 9.3% on battery monitoring and electronics thermal management, where cost per point matters more than absolute accuracy does. A battery pack monitors roughly one cell in twelve individually because thermal runaway propagates between cells and early detection is the only available mitigation, which multiplies sensor count per vehicle by an order of magnitude. These devices integrate directly with digital systems, need no cold junction compensation or bridge circuitry, and cost very little in volume. Accuracy is modest against a calibrated resistance detector, and for detecting a cell heading toward runaway that limitation matters considerably less than the price does. Price rather than precision decides these applications, which is unusual in industrial measurement.
CAGR 9.3%
Full segment breakdown across 6 segments available in the complete report.

Regional Architecture and Country Demand Map

North America holds 40% of unit shipment revenue in this scoped analysis, reflecting the report's geographic centre. On a purely global basis the region would sit nearer 24% and East Asia would lead on manufacturing volume, so these figures follow the scope rather than global shipment patterns.

North America

North America holds 40% of unit shipment revenue, above the 32% band ceiling, for two reasons that should be separated. This analysis is scoped to North America, which weights the figure toward the report's geographic centre; on a purely global basis the region would sit nearer 24%. The genuine mechanism is that three new demand sources arrived here first and simultaneously: battery plant construction monitoring one cell in twelve, liquid cooled data centres needing 800 millisecond detection, and semiconductor fabrication funded through public investment. The United States compounds at 8.6% on all three together rather than on any single one. Separating the scope effect from the genuine mechanism matters when reading this figure.
Share: 40% | CAGR: 7.8% (2026 to 2036)

East Asia

Twenty-two percent of unit shipment revenue reaches East Asia, at the band floor within this scoped analysis, though the region leads globally on manufacturing volume. Chinese, Japanese and Korean electronics assembly consumes enormous quantities of thermistors and semiconductor sensors at prices Western suppliers do not attempt to match. Murata Manufacturing and Semitec supply thermistors from Japan to customers worldwide. Chinese battery manufacturing operates at scale exceeding anywhere, with domestic sensor suppliers serving it. Growth at 8.2% sits above the global rate on battery and electronics production expanding together across the whole region. Domestic sensor suppliers serve Chinese battery manufacturing at prices Western suppliers do not attempt to match anywhere. Volume leadership sits here globally.
Share: 22% | CAGR: 8.2% (2026 to 2036)
Regional intelligence for 5 additional markets available in the complete report: Western Europe, South Asia and Pacific, Latin America, Middle East and Africa, Eastern Europe. Contact sales@marketmindsadvisory.com.
north-america-temperature-sensor-market-country-cagr-analysis-1789990677243

Where Sensor Suppliers Earn Position

A two hundred year old technology still holds a fifth of this market, the fastest growing principle answers a genuinely different question, and the cost that buyers compare is not the cost they actually end up paying. Each of the four levers below works with those realities rather than arguing about accuracy on a datasheet.

Price The Calibration, Not The Sensor

Process service produces around 0.4 degrees of annual drift requiring recalibration, and a plant with thousands of measurement points pays labour for every one of them on a fixed schedule. That recurring cost dwarfs the difference between a USD 6 thermocouple and a considerably more expensive resistance detector that drifts far less. Buyers compare unit prices because that number is visible and the other is not. Suppliers presenting honest lifetime cost, including recalibration labour, win specifications that unit price comparisons hand to somebody else entirely. Very few suppliers present that comparison at all.
Market Impact: Drift near 0.4 degrees drives the lifetime cost

Sell The Profile Rather Than The Point

A point sensor requires an engineer to predict where the interesting temperature will occur before installation, which is guesswork that fails regularly on long assets. Fibre optic distributed sensing reports every metre along a cable and compounds at 10.8% against 7.2% for the market. The installed cost looks far higher against a handful of point sensors and considerably lower against the thousands nobody would ever have installed. Framing the comparison correctly is the entire sale, and suppliers keep making it against the wrong alternative. Suppliers keep comparing against the wrong alternative.
Market Impact: Fibre reports every 1 metre along its length

Follow Construction Rather Than Production Volume

Battery plants, semiconductor fabrication and liquid cooled data centres all install temperature measurement during construction rather than buying it into existing output. Those projects appear in permit filings, public investment awards and utility connection applications years ahead of any procurement conversation happening. The United States compounds at 8.6% on all three arriving simultaneously. Suppliers organised around industrial replacement demand keep arriving after specification closes, which is a coverage problem rather than a product one and it is entirely fixable. Permit filings and investment awards make those projects visible years ahead of any purchase order.
Market Impact: Construction demand compounds at 8.6% in this region

Design For Response Time Where Milliseconds Matter

A liquid cooled rack loses hardware within roughly 800 milliseconds of a coolant flow interruption, which is a detection requirement no building management sensor was designed for. Battery cell monitoring at one sensor per twelve cells needs comparable urgency for the same reason, since thermal runaway propagates faster than any operator responds. Suppliers offering laboratory grade accuracy with slow thermal response are answering the wrong specification entirely, and speed rather than precision decides these applications outright. Thermal runaway propagates faster than any operator responds. Speed decides both applications outright. Nothing about that is a precision requirement.
Market Impact: An 800 millisecond detection window decides every selection

Who Controls the Margin Pool

Five suppliers hold 41% of temperature sensor unit shipment revenue, fragmented because component manufacturers and process instrumentation firms approach the same measurements from opposite directions. TE Connectivity, Amphenol and Texas Instruments sell components into designs. Honeywell and Emerson sell instruments with sensors inside them to plant operators. The two groups rarely appear in the same tender at all. All participants are assessed on unit shipment revenue.
Competition differs completely by application, which the aggregate figure hides. Battery and electronics sensing is a component contest on price, response time and package size where volume manufacturing decides outcomes. Process industry measurement is an instrumentation contest on calibration traceability, safety certification and service coverage, where a plant operator selects a supplier who can recertify a loop rather than one who ships a cheaper part.

Rankings shift as fibre optic distributed sensing takes applications point sensors previously served, since that technology sits closer to instrumentation and interrogation systems than to component manufacturing. The second pressure is new construction demand, which favours suppliers tracking permit filings and investment awards over those organised entirely around industrial replacement cycles, which is a coverage problem rather than a product one.
north-america-temperature-sensor-market-company-positioning-matrix-1789990677774

Competitive Moat and Risk Dimensions

TE CONNECTIVITY

Moat: Automotive Qualification Depth

TE Connectivity holds automotive qualification across sensor families accumulated over decades, and qualification for vehicle applications involves validation, documentation and production approval taking years to obtain for each part. Battery pack monitoring at one cell in twelve multiplies volume behind those approvals substantially. A technically superior competitor still needs the qualification first.
TE CONNECTIVITY

Risk: Component Price Competition

Semiconductor and thermistor sensing for battery and electronics applications is a volume component contest where Asian manufacturers compete effectively at prices Western suppliers struggle to match. Automotive qualification defends the position and does not defend the price. Every vehicle programme renegotiation reopens that comparison, and battery pack cost pressure runs harder than almost anywhere else in vehicle design.
EMERSON

Moat: Process Loop Certification Position

Emerson supplies temperature measurement inside process instrumentation with calibration traceability, safety integrity certification and service coverage that a plant operator needs to keep a regulated process running lawfully. Changing supplier means recertifying loops rather than swapping a component, which nobody undertakes voluntarily. That position accumulated through decades of installed base and service relationships across process industries.
EMERSON

Risk: Distributed Sensing Displacement

Fibre optic distributed sensing compounds at 10.8% and takes applications where a long asset previously carried many individual instrumented points, particularly across pipelines, cables and increasingly coolant systems. That technology sits with interrogation system specialists rather than with process instrumentation suppliers. Defending a point measurement position against a technology that measures continuously requires a different product entirely.

Players Tracked

Prominent Players

TE Connectivity
Honeywell
Texas Instruments
Amphenol
Emerson

Other Key Players

Analog Devices
Sensata Technologies
Yokogawa
Endress and Hauser
ABB
Siemens
Watlow
Omega Engineering
Vishay Intertechnology
Murata Manufacturing
Semitec
Littelfuse
Melexis
FLIR Systems
Luna Innovations

Recent Developments

FEBRUARY 2025

TE Connectivity Expands Battery Cell Sensing Range For Vehicles

TE Connectivity expanded its temperature sensing range aimed at battery pack cell monitoring applications, an organic product development rather than an acquisition or joint venture. Modern packs monitor roughly one cell in twelve individually because thermal runaway propagates between cells and early detection remains the only genuinely effective mitigation available.
Signal: Sensor count per vehicle has risen by an order of magnitude and nobody in the industry forecast it.
SEPTEMBER 2024

Luna Innovations Extends Distributed Sensing For Data Centre Cooling

Luna Innovations extended fibre optic distributed temperature sensing products toward liquid cooled data centre applications, an organic expansion rather than any transaction. A coolant flow interruption in a liquid cooled rack damages computing hardware within roughly 800 milliseconds, which conventional building sensors were never designed to detect.
Signal: Continuous measurement is now reaching the applications that point sensors served perfectly adequately until quite recently.
JUNE 2025

Emerson Adds Verification Capability Reducing Process Recalibration Visits

Emerson added in-situ verification capability to its temperature instrumentation, an organic engineering development rather than a partnership or merger. Process service produces around 0.4 degrees of annual drift requiring recalibration, and the labour across a plant with thousands of measurement points dwarfs any difference in sensor purchase price.
Signal: Recalibration labour rather than sensor purchase price is where the genuine lifetime cost has always actually sat.

What Temperature Sensing Costs

Sensing element materials account for roughly 24% of sensor cost across the category, ranging from inexpensive thermocouple alloy wire to platinum for resistance detectors and optical fibre for distributed systems. Housing, sheathing and connection assembly carry around 31%, which is high because industrial sensors survive conditions the element alone would not. Calibration and traceability documentation absorb about 19%, and testing plus distribution take the balance.
Platinum pricing moved considerably through 2023 and 2024, and the IEA has documented how far critical mineral demand from industrial and energy applications diverged from historical patterns across that period. TE Connectivity Annual Report 2024 and Emerson Annual Report 2024 both record raw material and component availability as operating variables. Suppliers on multi-year framework agreements absorbed those movements, since a catalogue price fixed for three years does not adjust.

The competitive disadvantage mechanism is calibration infrastructure rather than material cost. Traceable calibration requires reference standards, controlled environments and accredited procedures that run around 19% of cost and do not become cheaper with volume beyond a certain point. A supplier serving process industries carries that infrastructure regardless of volume, while a component supplier into electronics avoids it entirely.
north-america-temperature-sensor-market-cost-volatility-analysis-1789990677972

Automate Calibration Against Reference Standards Directly

Calibration and traceability documentation run around 19% of sensor cost and most of that is technician time moving devices through controlled temperature baths manually. Automated handling against reference standards processes far more units per hour with better documentation consistency than manual procedures achieve. The capital is significant and most suppliers still calibrate as they did two decades ago.

Substitute Platinum Where Accuracy Genuinely Permits

Sensing element materials run about 24% of cost and platinum resistance detectors carry most of that exposure, at pricing that moved considerably through 2023 and 2024. Many applications specified for resistance detectors tolerate thermistor or semiconductor accuracy comfortably at a fraction of the material cost. Reviewing specifications against actual requirement rather than inherited practice releases margin nobody examines.

Standardise Housings Across Every Sensing Principle

Housing, sheathing and connection assembly run around 31% of cost, which exceeds the sensing element itself in most industrial products. Suppliers frequently maintain separate mechanical designs per sensing principle because those product lines developed independently over many years. A common housing platform accepting different elements removes tooling and inventory duplication that mechanical engineering teams rarely examine at all.

Portfolio Architecture for Margin Defence

Margin architecture separates on whether calibration traceability is part of what is sold. Thermocouples and thermistors earn least, since both are commodity components at very low unit prices with adequate substitutes everywhere. Resistance detectors and infrared sensing sit in the middle on material and optical cost. Distributed fibre sensing and calibrated process instrumentation sensors earn most, one on technology scarcity and the other on certification nobody else can provide.
The volume versus premium tension is really about which customer a supplier is built to serve. Electronics and battery assembly buys components on price, response time and package, which needs volume manufacturing and no calibration infrastructure. Process industry buys measurement with traceability and service coverage attached, which needs exactly that infrastructure. Suppliers attempting both from one organisation carry calibration cost into markets that will not pay for it.

High-value pools concentrate in distributed fibre sensing and in certified process measurement, and neither is reached from component manufacturing. Distributed sensing requires optical interrogation systems and signal processing that sensor makers do not build. Certified measurement requires accredited calibration infrastructure and service coverage accumulated across decades. Both sit outside a component manufacturing capability, which is exactly why the margin has settled there.

Volume / Commodity-Adjacent

Thermocouples and thermistors sold as components at very low unit prices with adequate substitutes available from many suppliers. The eight point spread separates manufacturers with genuine automation scale from those assembling smaller volumes at considerably higher labour content per unit.
Gross Margin: 16% to 24%

Premium / Certified

Resistance temperature detectors and non-contact infrared sensors sold on accuracy, material quality and optical performance rather than on price alone. The twelve point spread tracks how much of a supplier's volume carries calibration traceability documentation rather than shipping as an uncertified commodity component.
Gross Margin: 30% to 42%

Sustainability / Regulatory / Next-Generation

Fibre optic distributed sensing systems and fully certified process measurement, one scarce on technology and the other on accredited calibration infrastructure. The fourteen point spread reflects whether a supplier owns the interrogation system or the calibration accreditation, since neither is available for purchase quickly.
Gross Margin: 46% to 60%
north-america-temperature-sensor-market-portfolio-architecture-1789990678498

High-value Sub-segments and Strategic Watch-out

Fibre Optic Distributed Temperature Sensing

Grows at 10.8% because one fibre reports every metre along its length rather than a single point somebody had to predict. The fourteen point spread reflects interrogation system ownership. Comparing installed cost against point sensors misstates what is actually being replaced here. A profile, not a point.
Gross Margin: 46% to 60%

Semiconductor Integrated Temperature Sensors

Grows at 9.3% on battery packs monitoring one cell in twelve and on electronics thermal management generally across every device category. The twelve point spread reflects automotive qualification depth. Accuracy is modest and for detecting runaway that matters considerably less than price. Runaway detection is the whole requirement.
Gross Margin: 30% to 42%

Non-Contact Infrared Sensors

Grows at 8.1% wherever contact is impossible, including moving surfaces, high voltage equipment and sterile processing environments requiring no physical intrusion. The twelve point spread reflects optical and lens quality. Emissivity variation remains the persistent accuracy problem nobody has solved properly. Contact is impossible in those settings.
Gross Margin: 30% to 42%

Thermocouples

Grows at 3.1%, slowest of the six principles, on a two hundred year old technology that costs USD 6 and nothing has managed to replace. The eight point spread reflects manufacturing automation. It works past a thousand degrees where every single alternative simply fails. Nothing replaces it.
Gross Margin: 16% to 24%

How Measurement Positions Persist

The annuity is the calibration record rather than the sensor. A process plant operating under regulated conditions holds calibration history against specific instrument types, and changing supplier means recertifying loops, retraining technicians and rebuilding documentation that inspectors examine. Nobody undertakes that to save money on a component. In battery applications the equivalent lock is automotive qualification, which fixes supply for a vehicle programme's life.
Depth varies with how regulated the measurement is. A safety integrity certified loop in a chemical plant is effectively permanent, since changing anything triggers a recertification nobody schedules voluntarily. A battery pack sensor is fixed for the vehicle programme and reopened at the next one. A thermistor in a consumer appliance is genuinely interchangeable and gets rebid at every cost reduction exercise the manufacturer runs.

The buyer split as new demand arrived. A plant instrumentation engineer selects on traceability, certification and service coverage across a twenty year asset. A battery pack designer selects on response time, package size and cost across a five year programme. A data centre thermal engineer selects on detection speed inside 800 milliseconds. Suppliers organised around the first buyer reach perhaps a third of where growth now sits.
north-america-temperature-sensor-market-end-use-penetration-index-1789990678991

What Decides Sensor Selection

These are among the four positions where our research anticipates prominent divergence between winners and laggards over the coming forecast period. Each is grounded in the demand model, the regulatory perimeter, and the announced capacity pipeline.
01 / LIFETIME COST FRAMING

Sell The Recalibration, Not The Part

Process service produces around 0.4 degrees of annual drift requiring recalibration, and a plant with thousands of measurement points pays technician labour for every one of them on a fixed schedule year after year. That recurring cost dwarfs the difference between a USD 6 thermocouple and a considerably more expensive resistance detector that barely drifts at all. Buyers compare unit prices because that number is visible while the other is not, and suppliers presenting honest lifetime cost win specifications that price comparisons hand elsewhere.
02 / COMPARISON FRAME CORRECTION

Compare Fibre To Thousands, Not Ten

A conventional sensor obliges an engineer to predict where the interesting temperature will occur before anything gets installed, which is guesswork that fails regularly across long assets like cables and pipelines. Fibre optic distributed sensing reports every metre and compounds at 10.8% against 7.2% for the market as a whole. Installed cost looks far higher against a handful of point sensors and considerably lower against the thousands nobody would ever install, and framing that comparison correctly is the entire sale.
03 / CONSTRUCTION PIPELINE COVERAGE

Follow The Permits, Not The Plants

Battery manufacturing, semiconductor fabrication and liquid cooled data centres all install temperature measurement during construction rather than buying it into existing production output. Those projects appear in permit filings, public investment awards and utility connection applications years ahead of any procurement conversation happening with anybody at all. The United States compounds at 8.6% on all three of those arriving more or less at once, and suppliers organised entirely around industrial replacement demand keep arriving well after the specification has already closed for good.
04 / RESPONSE TIME ENGINEERING

Win On Speed Where Accuracy Cannot

A liquid cooled rack loses computing hardware within roughly 800 milliseconds of a coolant flow interruption, which is a detection requirement that no building management sensor was ever designed to satisfy. Battery cell monitoring at one sensor per twelve cells demands comparable urgency, since thermal runaway propagates between cells faster than any human operator responds. Suppliers offering laboratory grade accuracy with slow thermal response are answering entirely the wrong specification, and speed rather than precision is what decides both of these applications outright.

Engagement Snapshot From the Field

A live engagement with an industry participant carrying material or product regulatory and market exposure ahead of a defining policy shift, showing how our research translates into a defensible multi-year portfolio strategy.
MARKET MINDS ADVISORY · CLIENT ENGAGEMENT SUMMARY
North America Temperature Sensor Producer Strategic Portfolio Review and Transition Roadmap 2026·Investment Scenario on North America Temperature Sensor Exposure Evaluation 2025-26
CLIENT PROFILE
A North American chemical processor operating six plants with roughly 14,000 temperature measurement points accumulated from four decades of construction and expansion, using instruments from eleven suppliers. Calibration was managed plant by plant with no group standard. Procurement had been reducing sensor purchase cost successfully for three years while total instrumentation spending rose steadily throughout the same period.
STRATEGIC CHALLENGE
Procurement measured success on sensor unit price and had genuinely improved it. Maintenance reported rising calibration workload but had never connected the two, since the budgets sat in different functions entirely. Nobody had calculated recalibration labour against sensor type, and a group standardisation decision was scheduled without anybody producing that number for the board.
MMA APPROACH
MMA costed recalibration labour by sensor type across three years of maintenance records, and compared total lifetime cost per measurement point against purchase price. We assessed which points genuinely required resistance detector accuracy and which had inherited it from specifications written decades earlier. The work drew on 47 expert interviews conducted in Q4 2025 with suppliers, calibration houses and comparable process operators.
KEY FINDINGS
  1. Recalibration labour exceeded sensor purchase cost by roughly 9 times across the installed base, and no budget anywhere reported the two figures together.
  2. The cheapest sensors that procurement had standardised on drifted about 3 times faster, which had increased calibration visits substantially across every plant.
  3. Around 40% of resistance detector points did not require that accuracy and had inherited the specification from documents written in the 1980s.
  4. In-situ verification capability would have removed roughly half of the calibration visits at a fairly modest sensor purchase premium (client-reported, unverified by MMA).
CLIENT PROFILE
A North American chemical processor operating six plants with roughly 14,000 temperature measurement points accumulated from four decades of construction and expansion, using instruments from eleven suppliers. Calibration was managed plant by plant with no group standard. Procurement had been reducing sensor purchase cost successfully for three years while total instrumentation spending rose steadily throughout the same period.
STRATEGIC CHALLENGE
Procurement measured success on sensor unit price and had genuinely improved it. Maintenance reported rising calibration workload but had never connected the two, since the budgets sat in different functions entirely. Nobody had calculated recalibration labour against sensor type, and a group standardisation decision was scheduled without anybody producing that number for the board.
MMA APPROACH
MMA costed recalibration labour by sensor type across three years of maintenance records, and compared total lifetime cost per measurement point against purchase price. We assessed which points genuinely required resistance detector accuracy and which had inherited it from specifications written decades earlier. The work drew on 47 expert interviews conducted in Q4 2025 with suppliers, calibration houses and comparable process operators.
KEY FINDINGS
  1. Recalibration labour exceeded sensor purchase cost by roughly 9 times across the installed base, and no budget anywhere reported the two figures together.
  2. The cheapest sensors that procurement had standardised on drifted about 3 times faster, which had increased calibration visits substantially across every plant.
  3. Around 40% of resistance detector points did not require that accuracy and had inherited the specification from documents written in the 1980s.
  4. In-situ verification capability would have removed roughly half of the calibration visits at a fairly modest sensor purchase premium (client-reported, unverified by MMA).
RECOMMENDED STRATEGY
Phase 1: Phase one: measure and report total cost per measurement point including recalibration labour, rather than reporting sensor purchase price alone. Phase 2: Phase two: specify verification capable instruments at the points driving the most calibration visits, accepting the higher purchase price knowingly. Phase 3: Phase three: review every inherited specification against the actual accuracy requirement, since around 40% carry precision that nobody currently needs.
OUTCOME
The processor adopted total cost per measurement point as the procurement metric and specified verification capable instruments selectively (client-reported, unverified by MMA). Calibration visits fell substantially and total instrumentation spending declined for the first time in four years. Purchase price and calibration labour are now reported together, which is the change that outlasted the engagement itself.

Frequently Asked Questions

Foundational context covering the market sizes, CAGR, scope, country, region and competition that inform every finding below. This section is provided to cover basics and most often pre-purchase conversations, answered from the MMA Primary Research Dataset.

What is the current size of the North America Temperature Sensor Market?

Global value reaches USD 8.15 billion in 2026, measured as temperature sensor unit shipment revenue across all six sensing principles. The 2025 base is USD 7.6 billion.

How large will the North America Temperature Sensor Market be by 2036?

Unit shipment revenue reaches USD 16.33 billion by 2036, an increase of USD 8.18 billion over the forecast period. That represents 2.00 times expansion from the 2026 base.

What is the CAGR for the North America Temperature Sensor Market 2026 to 2036?

The base case runs at 7.2% annually, with a bull case at 8.5% if distributed fibre sensing displaces point sensors faster than expected and a bear case at 6.0% if capital projects defer.

Which segment is growing fastest?

Fibre optic distributed temperature sensing grows at 10.8%, half again the market rate of 7.2%. A single fibre reports temperature every metre along its length rather than at one predicted point.

Who are the major companies in the North America Temperature Sensor Market?

TE Connectivity, Honeywell, Texas Instruments, Amphenol and Emerson lead on unit shipment revenue, together holding 41%. Sensata, Watlow and Luna Innovations hold smaller positions across the principles.

Which country is growing fastest?

Within this North American analysis the United States leads at 8.6%, on battery plant, semiconductor fabrication and liquid cooled data centre construction arriving simultaneously. Mexico and Canada follow.

Report Segmentation Architecture

The full report scope spans multiple orthogonal segmentation dimensions, with cross-tabulated demand data provided for each dimension pair. Coverage extends further to regional breakdowns, trend trajectories, and the competitive detail needed to support segment-level decision-making.

By Sensing Principle

  • Fibre Optic Distributed Temperature Sensing
  • Semiconductor Integrated Temperature Sensors
  • Non-Contact Infrared Sensors
  • Thermistors
  • Resistance Temperature Detectors
  • Thermocouples

By End-Use Industry

  • Chemical And Process Manufacturing
  • Automotive And Battery Production
  • Data Centres And Computing
  • Semiconductor Fabrication
  • Food And Pharmaceutical Processing
  • Energy And Utilities

By Commercial Dimension

  • Industrial Distributor Channel
  • Direct Original Equipment Supply
  • Process Instrumentation Bundling
  • Engineering Contractor Specification
  • Maintenance And Replacement Supply
  • Construction Project Procurement

By Region

  • North America
  • Western Europe
  • East Asia
  • South Asia and Pacific
  • Latin America
  • Middle East and Africa
  • Eastern Europe

Scope, Methodology, and Coverage

Every figure in this report is reproducible from documented input assumptions. The scope below maps the historical period, the forecast horizon, the segmentation dimensions, and the countries covered, alongside the underlying primary and qualitative methodology.
Historical Period
2020 to 2025
Forecast Period
2026 to 2036
Base Year
2025 (USD billions; MMA Primary Research Dataset, September 2026)
Market Definition
This report covers temperature sensing devices across measurement principles, analysed with North America as the geographic centre: semiconductor integrated temperature sensors, non-contact infrared sensors, fibre optic distributed temperature sensing, resistance temperature detectors, thermistors, and thermocouples. It excludes complete process control systems, thermal imaging cameras sold as instruments, temperature controllers and transmitters sold separately, calibration services, and building automation control systems.
Quantitative Units
USD millions, unit shipment revenue basis; installed measurement points; calibration drift in degrees annually; spatial resolution in metres; detection response time in milliseconds.
Segmentation Dimensions
Sensing principle; end-use industry; commercial supply channel; geography across seven regions with North America as the analytical centre.
Regions Covered
North America, Western Europe, East Asia, South Asia and Pacific, Latin America, Middle East and Africa, Eastern Europe
Countries Covered
United States, Canada, Mexico, Brazil, Chile, Peru, Germany, France, Belgium, Switzerland, United Kingdom, Poland, Czechia, China, Japan, South Korea, India, Australia, Saudi Arabia, South Africa.
Key Companies Profiled
TE Connectivity, Honeywell, Texas Instruments, Amphenol, Emerson, Analog Devices, Sensata Technologies, Yokogawa, Endress and Hauser, ABB, Watlow, Omega Engineering, Murata Manufacturing, Melexis, Luna Innovations.
Quantitative Methodology
Primary survey, n=3,800 respondents, Q4 2025, six countries; demand-side model with trade association cross-validation
Qualitative Methodology
47 expert interviews, Q4 2025; applied to validate demand model assumptions, identify emerging dynamics, and assess competitive positioning
Report Format
PDF and XLSX data workbook (Word format preview document)
Publisher
Market Minds Advisory
Report Code
MMA-2026-TEC-561
Published
September 2026
Contact
sales@marketmindsadvisory.com | www.marketmindsadvisory.com

Purchase the full North America Temperature Sensor Market Report (2026 to 2036).

This report analyses the temperature sensor market with North America as its geographic centre, sized from 2026 to 2036 across six sensing principles, six industries and seven regions. It explains why a two hundred year old thermocouple costing USD 6 still holds a fifth of the market. It shows how fibre optic distributed sensing at one metre resolution answers a different question rather than the same one better, and why 0.4 degrees of annual drift makes unit price comparisons misleading. Cost composition is sourced to IEA minerals analysis and company annual reports, with calibration infrastructure analysed as the margin divider. Competitive assessment covers 20 named suppliers.
Six sensing principles sized through to 2036
Calibration drift economics modelled against purchase price
Material and calibration cost composition from company filings
Twenty named suppliers assessed on shipment revenue
Four revenue levers with quantified commercial impact
Anonymised chemical processor standardisation engagement included in full

Built For The People Who Decide

From boardroom strategy to bench-side execution, this report is read cover-to-cover by leaders shaping the next decade of their industry, turning demand scenarios, market dynamics and valuation benchmarks into decisions.
CXOs/ Presidents/ VPs/ Managers
M&A and Corporate Development
Strategy Teams and R&D Heads
Procurement and Product Directors
Regulatory and Compliance Leaders
Investor Relations and Equity Analysts